
 Submit a Paper
 Propose a Special lssue
 Open Access
ARTICLE
A Quantum-Inspired Algorithm for Clustering and Intrusion Detection
1 School of Artificial Intelligence and Computer Science, North China University of Technology, Beijing, 100144, China
2 Information Security Center, State Key Laboratory of Networking and Switching Technology, Beijing University of Posts and Telecommunications, Beijing, 100876, China
3 School of Information Engineering, Minzu University of China, Beijing, 100081, China
4 School of Digtial and Intelligence Industry, Inner Mongolia University of Science and Technology, Baotou, 014010, China
5 The State Key Laboratory of Public Big Data, College of Computer Science and Technology, Guizhou University, Guiyang, 550025, China
6 Institute for Network Sciences & Cyberspace, Tsinghua University, Beijing, 100084, China
* Corresponding Author: Xiu-Bo Chen. Email:
Computers, Materials & Continua 2026, 87(1), 48 https://doi.org/10.32604/cmc.2025.074256
Received 07 October 2025; Accepted 21 November 2025; Issue published 10 February 2026
 View Full Text
 Download PDF
Abstract
The Intrusion Detection System (IDS) is a security mechanism developed to observe network traffic and recognize suspicious or malicious activities. Clustering algorithms are often incorporated into IDS; however, conventional clustering-based methods face notable drawbacks, including poor scalability in handling high-dimensional datasets and a strong dependence of outcomes on initial conditions. To overcome the performance limitations of existing methods, this study proposes a novel quantum-inspired clustering algorithm that relies on a similarity coefficient-based quantum genetic algorithm (SC-QGA) and an improved quantum artificial bee colony algorithm hybrid K-means (IQABC-K). First, the SC-QGA algorithm is constructed based on quantum computing and integrates similarity coefficient theory to strengthen genetic diversity and feature extraction capabilities. For the subsequent clustering phase, the process based on the IQABC-K algorithm is enhanced with the core improvement of adaptive rotation gate and movement exploitation strategies to balance the exploration capabilities of global search and the exploitation capabilities of local search. Simultaneously, the acceleration of convergence toward the global optimum and a reduction in computational complexity are facilitated by means of the global optimum bootstrap strategy and a linear population reduction strategy. Through experimental evaluation with multiple algorithms and diverse performance metrics, the proposed algorithm confirms reliable accuracy on three datasets: KDD CUP99, NSL_KDD, and UNSW_NB15, achieving accuracy of 98.57%, 98.81%, and 98.32%, respectively. These results affirm its potential as an effective solution for practical clustering applications.Keywords
With the rapid development of information technology and the increasingly severe challenges confronting network security, intrusion detection—a technology for active network security protection—has received widespread attention within the field of computer science. Research in this area continues to evolve, incorporating increasingly sophisticated techniques to enhance detection performance. A bidirectional long short-term memory (Bi-LSTM)-based intrusion detection system (IDS) is introduced to improve detection accuracy [1]. Building on machine learning approaches, Kayode Saheed et al. [2] introduced an IDS capable of effectively identifying complex cyber attacks. More recently, Wang et al. [3] proposed a knowledge-distillation-based intrusion detection model tailored for IoT environments, addressing the specific challenge of detecting cyber assaults in connected devices. These efforts collectively reflect the ongoing development and refinement of intrusion detection technologies, demonstrating a clear trajectory toward more specialized, accurate, and context-aware solutions.
In the field of intrusion detection research, clustering algorithms, as an important unsupervised learning approach, have garnered significant attention from researchers in recent years. In light of increasingly sophisticated and concealed cyberattacks, traditional signature-based detection methods often prove inadequate in identifying unknown or variant attacks. By analyzing intrinsic patterns in network traffic and system behaviors, clustering algorithms can automatically detect anomalous activities and potential threats without relying on prior knowledge, thereby significantly enhancing the capability to identify zero-day attacks and complex multi-stage intrusions. Furthermore, clustering methods demonstrate promising scalability and robustness when handling high-dimensional and large-scale network data, providing crucial support for building adaptive and intelligent intrusion detection systems. As a result, clustering algorithms have emerged as a key research direction advancing the development of intrusion detection technologies. An artificial bee colony and fuzzy clustering algorithms-based intrusion detection systems [4], as well as clustering centers and closest neighbors-based intrusion detection systems [5]. A fuzzy aggregation approach for intrusion detection, which combines a deep belief network with the altered density peak clustering algorithm, was proposed by Yang et al. [6]. To address security challenges in industrial networks, an intrusion detection framework that utilizes a multi-feature data clustering optimization model is presented in [7].
The procedure of clustering involves categorizing data objects into groups according to internal similarities. The clustering technology is widely used in data analysis, object recognition, customer classification, picture retrieval, and data mining. The K-means algorithm is the primary partition-based clustering approach, which is appreciated due to its computational simplicity [8]. However, a significant disadvantage of K-means is its susceptibility to the original centroid, a problem that Mahajan et al. [9] demonstrated to be NP-hard. Framing the clustering problem as an issue in optimization that may have been tackled with an appropriate optimization algorithm. The utilization of nature-inspired algorithms to address globally optimal problems has become well-known among researchers.
Nature-inspired is a stochastic search method inspired by biological behavior [10]. In contrast to traditional algorithms, its strong robustness and self-organization have attracted growing attention from researchers. Researchers have proposed numerous nature-inspired algorithms, including the particle swarm optimization algorithm (PSO) [11], the ant colony optimization algorithm (ACO) [12], the artificial bee colony algorithm (ABC) [13], and genetic algorithms (GA) [14]. Such algorithms are regarded as effective and commonly applied techniques for handling complex problems. Subsequently, various meaningful improvements are introduced to augment the efficiency of nature-inspired algorithms [15,16]. Given the numerous benefits of nature-inspired algorithms, some scholars have begun using these algorithms to optimize the clustering technology and applied them to different fields [17,18].
To overcome the limitations of traditional nature-inspired algorithms—such as slow convergence and vulnerability to local optima—recent research has increasingly turned to quantum computing principles for inspiration. Built on the foundations of quantum mechanics, quantum computing allows parallel computation, markedly strengthens computational capability, and has been applied in diverse domains [19–21]. However, quantum-inspired algorithms may involve high computational costs, particularly when applied to large-scale datasets. Thus, researchers should take this into account while addressing specific problems. Although current quantum computers are still constrained by hardware limitations, quantum-inspired algorithms simulate quantum behaviors on classical hardware to enhance search efficiency and solution quality. Among these developments, quantum-inspired algorithm models have demonstrated promising results in solving complex optimization problems [22–25]. While theoretical models and techniques for quantum computation have advanced rapidly, quantum-inspired approaches generally depend on classical emulation of quantum processes, which limits efficiency. The path toward universal and practical quantum computing requires addressing numerous physical restrictions and technical hurdles, and at present, quantum computers capable of effectively handling complex problems beyond classical systems remain out of reach [26]. Thus, research in the realm of quantum computing needs to be expanded and investigated constantly. The algorithm proposed in this paper is a foundation-laying and exploratory phase, which is necessary for the subsequent development of quantum computers.
In recent years, several researchers have applied quantum-inspired algorithms to clustering problems, including quantum-inspired ant lion optimization, genetic algorithms, and particle swarm optimization [27–29]. Despite these advances, the application of quantum-inspired algorithms in clustering and intrusion detection has not been fully explored, especially the combination with the quantum-classical frame.
In summary, this study presents a quantum-classical hybrid clustering algorithm that integrates an improved quantum-inspired artificial bee colony algorithm hybrid with the K-means (IQABC-K) for cluster analysis. Furthermore, it incorporates a similarity coefficient-based quantum genetic algorithm (SC-QGA) to develop a novel quantum-based attack detection scheme for intrusion detection. In contrast to the K-means, the IQABC-K hybrid scheme achieves better clustering results and accelerates convergence, enabling the K-means to reach the global optimal solution. The novel attack detection quantum scheme can quickly and accurately distinguish between different attack types. The following are the study’s principal works.
1. First, a similarity coefficient-based quantum genetic algorithm is proposed. The algorithm utilizes similarity coefficient theory to construct a class separability approximation matrix, which is incorporated into the quantum genetic algorithm to effectively direct the process of feature selection. The evolutionary search is further enhanced by a quantum rotation gate with an adaptive rotation angle.
2. Second, an improved quantum-inspired artificial bee colony hybrid K-means algorithm is developed. Two adaptive mechanisms are designed: (i) an adaptive quantum rotation gate with dynamically adjusted rotation angles to accomplish a balanced trade-off between global exploration and local exploitation, thereby improving optimization efficiency; and (ii) a linear population reduction strategy that decreases computational overhead while enhancing the quality of the search space. Furthermore, movement exploitation strategies are introduced to prevent the algorithm from being trapped in local optima, thereby accelerating convergence and improving accuracy. In addition, a global optimal bootstrap strategy is designed to search for new nectar sources with superior fitness values during the scout bee phase.
3. Finally, we combined the SC-QGA algorithm and the IQABC-K algorithm to form a quantum- inspired hybrid clustering algorithm applied to intrusion detection.
This is how the remainder of the paper is structured: Section 2 briefly outlines key concepts. Section 3 details an intrusion detection system composed of the SC-QGA algorithm and the IQABC-K algorithm. Section 4 conducts an experiment to assess the proposed algorithm relative to other algorithms in clustering and intrusion detection. Finally, Section 5 summarizes the whole study.
Definition 1: Let f(x) and g(x) be continuous one-dimensional positive functions. The similarity coefficient Cr between f(x) and g(x) is defined as:
here, Cr is used to quantify the correlation between f(x) and g(x). The integration is performed over the domain where both f(x) and g(x) are defined and not simultaneously equal to zero.
Property 1: The values of the similarity coefficient Cr lie in the interval
This property is derived from the Cauchy–Schwartz inequality, as demonstrated below:
Property 2: If f(x) = kg(x), for some constant k > 0, then Cr = 1.
This indicates that the functions f(x) and g(x) are in perfectly correlated states, differing solely by a scalar factor.
Property 3: If, for all x, Cr = 0, and either f(x) = 0 or g(x) = 0, then Cr = 0.
This implies that f(x) and g(x) have disjoint support and are therefore completely dissimilar.
The similarity coefficient criterion is theoretically related to classical feature selection methods that evaluate class separability. Specifically, it measures both intra-class compactness and inter-class dispersion through the ratio of similarity within the same class to that between different classes. The similarity coefficient formulation shares conceptual similarity with the Fisher score, which maximizes the ratio of between-class variance to within-class variance. By defining the similarity coefficient Cr, the class separability criterion in the SC-QGA algorithm can be viewed as a non-linear extension of the Fisher criterion, replacing second-order variance with pairwise similarity to capture more general distributions. Furthermore, from an information-theoretic perspective, the similarity coefficient implicitly encodes the mutual dependency between features and class labels. A high inter-class dissimilarity combined with low intra-class similarity increases the information gain about class boundaries, which is conceptually equivalent to maximizing mutual information. Therefore, the similarity coefficient criterion unifies geometric and information-based perspectives: it generalizes the Fisher score in a kernel-like similarity space and aligns with the objective of maximizing mutual information through similarity-driven feature relevance. This connection provides a theoretical justification for adopting the similarity coefficient as a feature selection metric within the SC-QGA algorithm.
2.2 Class Separability Criterion
The class separability criterion function J is formulated according to Eq. (4), which is derived from the similarity coefficient.
This criterion, constructed based on probability distributions, must satisfy the following three conditions [30]: (i) the criterion function must be greater than zero; (ii) J reaches its maximum value when the distribution functions of the two classes do not overlap; and (iii) J equals zero when the distribution functions of the two classes are identical.
According to Property 1 of the similarity coefficient, it follows that J > 0. In the case where the probability density f(x) and g(x) of the two classes do not overlap, Property 3 implies that Cr = 0, and therefore J = 1. Conversely, if f(x) = g(x), it follows from Property 2 that Cr = 1, and hence J = 0. Therefore, the criterion function J meets the three necessary conditions for class separability and provides a reliable means of evaluating class distinction.
If the distribution function is Gaussian, the similarity coefficient is defined as:
where, u and
2.3 Artificial Bee Colony Algorithm
Inspired by the foraging behaviors of honeybees, the ABC algorithm is a nature-inspired optimization technique introduced by Karaboga for addressing complex optimization problems [31]. The algorithm involves nectar sources and three bee roles—employed, onlooker, and scout. Each stage of the activities of the bee involves various mechanisms, each with particular features and roles during the course of the search. The following is a description of the primary steps of the algorithm.
Initialization stage. This involves initializing the bee population and the location of the nectar sources. Assume that the initial population size is N, the dimension is D, the largest iteration number is Iter, and the largest amount of consecutive searching is L. The original nectar source locations are as follows:
where, i
Employed bee stage. Employed bees are responsible for investigating the surrounding area of nectar sources and gathering information regarding their position and quality. During this stage, every employed bee seeks out a novel solution adjacent to its current location. The update equation for the location of the employed bee is as follows:
where, l
Onlooker bee stage. After evaluating each employed bee’s fitness, onlooker bees choose one to explore further. Typically, a feasible solution may be identified by using the roulette strategy, as indicated below:
where, fiti signifies the fitness of the nectar source or employed bee. The possibility pi of choosing the ith nectar source is determined by its fitness; higher fitness corresponds to a greater probability of selection. A novel solution is then discovered, and its fitness is computed using Eq. (7). Nectar sources with improved fitness are reservations. A nectar source corresponds to a variable Count, initially set to zero. If a nectar source stays unaltered for the corresponding employed or onlooker bees’ exploration stage throughout the iteration process, its Count value is increased by one.
Scout bee stage. In this phase, the scout bee examines the candidate solutions and filters out those that are infeasible. A nectar source is regarded as stagnant when its solution remains unchanged for L consecutive evaluations. When stagnation occurs, the scout bee employs Eq. (6) to generate a new, more randomized solution and resets the associated Count variable to zero.
The K-means algorithm, which maximizes similarity between samples within clusters and differences across clusters, splits the data into k clusters [32]. In the beginning, cluster centers (or centroids) are formed by randomly selecting k samples. Based on distance, each object is subsequently assigned to the cluster with the closest centroid. Assuming a dataset D = {x1, x2, ..., xn}, where
Input: dataset D, cluster amount k, largest iteration number of algorithm Maxcycle.
Output: final locations of k centroids, classification of each data point.
Step 1: choose k samples randomly from D to serve as the original centroids.
Step 2: all the sample data will be grouped into the cluster that has the greatest similarity pursuant to the similarity (similarity is measured by Euclidean distance), where the greatest similarity corresponds to the least Euclidean distance.
Step 3: calculate the average value of all samples inside every cluster to update every centroid.
Step 4: compare the updated centroid with the previous ones. If the objective function converges or Maxcycle iterations are reached, output the clustering results; otherwise, turn to step 2.
The centroids are indicated by the subsequent equation:
where, j = {1, 2, ..., k}, and the number of samples data points in the jth cluster is denoted by
Fig. 1 shows the network attack process and the corresponding defense mechanism of an Intrusion Detection System (IDS). An IDS is a crucial security mechanism designed to detect anomalous traffic patterns in computer networks. With the rising frequency and sophistication of cyberattacks, the development of robust IDS solutions has become critical. These systems continuously monitor network activity and implement proactive measures such as traffic control, access prevention, and suspicious account blocking to ensure data confidentiality. As depicted in Fig. 1, a layered defense strategy integrating firewalls and an IDS is deployed against unauthorized access attempts from the Internet. While firewalls filter traffic to block external threats, the IDS detects malicious behavior, restricts inter-network access, and helps contain attack propagation.
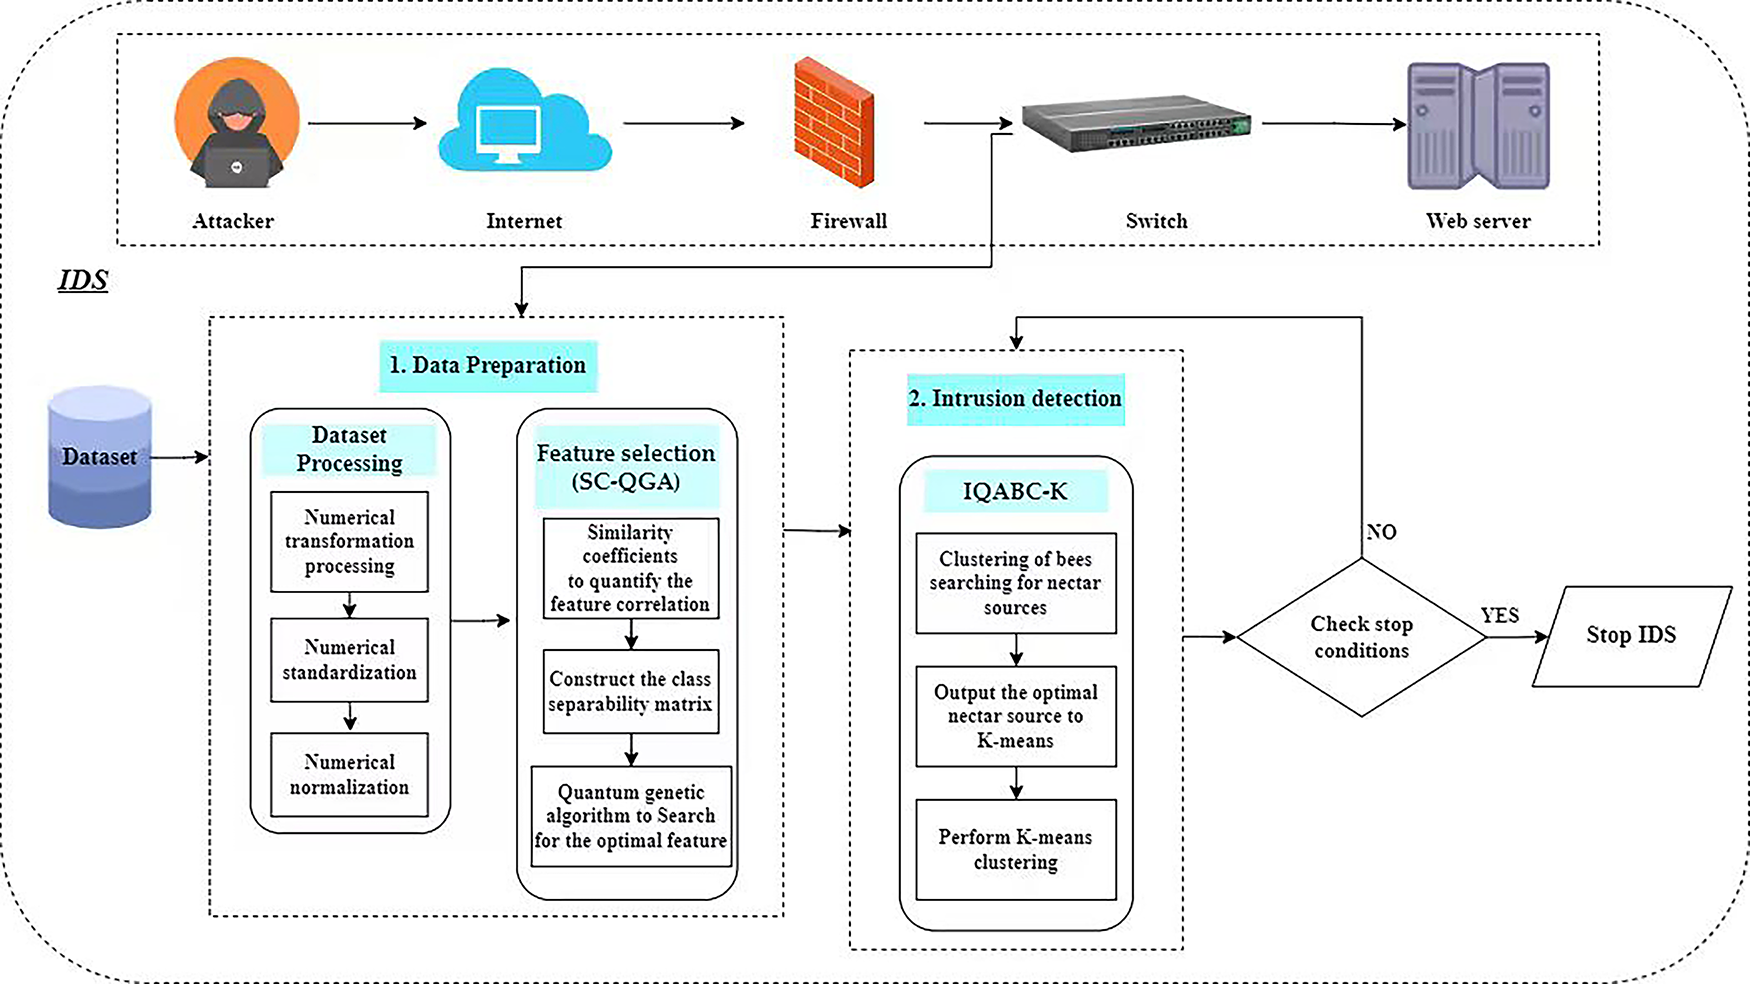
Figure 1: The proposed method is applied to intrusion detection systems
Within this architecture, this study proposes a novel method based on quantum-inspired clustering algorithms. The core of our approach lies in the synergistic integration of two specialized algorithms: a Similarity Coefficient-based Quantum Genetic Algorithm (SC-QGA) for feature selection and an Improved Quantum Artificial Bee Colony hybrid K-means (IQABC-K) algorithm for attack detection, the latter being specifically designed for clustering tasks. The operational workflow of the proposed IDS framework, also reflected in Fig. 1, comprises two main stages: (1) Data preparation stage: the SC-QGA algorithm is employed to perform high-quality feature selection in the initial phase, which is critical for enhancing data quality and reducing computational complexity; (2) Intrusion detection stage: in this phase, the IQABC-K algorithm is utilized to execute the actual intrusion detection via clustering. Detailed formulations of the SC-QGA and IQABC-K algorithms are provided in Sections 3.1 and 3.2, respectively. By seamlessly integrating these two components, the proposed framework establishes an innovative and effective solution for identifying network intrusions.
It should be noted that the proposed algorithm adopts a quantum-inspired rather than a genuine quantum algorithm implementation. In this approach, the notions of qubits, superposition, and rotation gates are mathematically simulated on classical computers to improve search diversity and convergence, without involving physical qubits, entanglement operations. In contrast, quantum-computing-based mechanisms execute optimization on real quantum hardware through unitary transformations that exploit quantum coherence and interference. Therefore, the SC-QGA and IQABC-K algorithms belong to the class of quantum-inspired, which emulate quantum principles through classical probabilistic modeling rather than physical quantum computation. However, this quantum-inspired classical simulation provides a theoretical foundation for its future implementation on actual quantum computers, thus holding significant reference value.
3.1 Feature Selection Using a Similarity Coefficient-Based Quantum Genetic Algorithm
In intrusion detection tasks involving network datasets, feature samples often exhibit fluctuations around their expected values due to factors such as network noise, data collection errors, and anomalous traffic patterns. The probability distribution of each feature, estimated via statistical analysis, can be reasonably approximated by a Gaussian distribution parameterized by the sample mean and variance. Based on the class separability criterion function, the corresponding feature selection algorithm is defined as follows.
3.1.1 Constructing a Class Separability Simplicity Matrix for Data
The core of the proposed feature selection model is the quantification of each feature’s discriminative power. This process is formalized through the construction and analysis of class separability matrices, which consists of the following steps.
Step1: Construct the class separability matrix.
For each network traffic feature in the KDD CUP99 dataset, whose samples approximately follow a Gaussian distribution, the class separability matrix
where, b = {1, 2, ..., L}, L is the total number of features, and n denotes the number of classes. mij represents the similarity between classes i and j with respect to feature F, the matrix satisfies mii = 1 and the symmetry condition mij = mji.
The specific steps include: (i) For each feature Fl = {1, 2, ..., L}, group the samples by class and compute the mean u and variance
Step2: Generate the class separability simplicity matrix.
A threshold g is defined to evaluate the class separability of each feature. The matrix M is then binarized according to this threshold. Specifically, if mij < g, it indicates that classes i and j are not distinguishable using feature Fl, and mij is set to 1; otherwise, it is set to 0. Based on this rule, the class separability approximation matrix
Step3: Iterate over all features to generate the set of matrices.
Steps 1 and 2 are applied to all features in the network dataset to obtain the class separability matrix Ml and the corresponding approximation matrix Sl for each feature (l = 1, 2, ..., L). This process leads to a combinatorial optimization problem, aimed at selecting an optimal features subset that maximizes class discriminability while minimizing feature dimensionality.
3.1.2 Quantum Genetic Algorithm for Feature Subset Optimization
The combinatorial problem defined in Section 3.1.1 is solved using the quantum genetic algorithm (QGA), which efficiently explores the high-dimensional feature solution space. The detailed procedure is as follows:
1. Initialize the population
where, m denotes the number of quantum bits, and
2. Based on the probability amplitudes associated with every individual in population P, generate an observed state set
3. The evaluation of individual fitness is performed to assess the quality of the feature subset. Let d denote the dimensionality of the eigenvector representing an individual, and let
where & denotes the logical “AND” operation. It can be observed that lower values of the function f correspond to higher-quality feature subsets.
4. Update the global optimal solution. The best solution encountered so far is preserved to maintain elite individuals throughout the evolutionary process.
5. Population evolutionary operation, updating the probability amplitude through the quantum rotating gate makes all the individuals in the population get updated. The rotation angle is dynamically adjusted based on the difference between the current solution and the elite solution, as shown in Eq. (14). Specifically, the angle is derived from the discrepancy between the present solution and the elite solution. When the current and elite solutions differ in a given feature selection state, the fitness difference between them is calculated. A larger fitness gap indicates a greater deviation from the optimal solution in that feature dimension, and a correspondingly larger rotation angle is applied to accelerate the adjustment of the quantum bit amplitudes toward the elite solution, thereby improving the convergence rate of the algorithm. Conversely, if the current solution matches the elite solution in a particular feature selection state, the rotation angle is set to zero and no adjustment is made.
here, z denotes the base rotation coefficient, which controls the baseline magnitude of the rotation angle to prevent overly drastic state changes in a single iteration. The function sign() determines the direction of rotation. pelite represents the elite individual, and pcurr denotes the current individual. fiti and fitbest are the fitness values of the current and elite individuals, respectively. The parameter v is a scaling factor introduced to prevent excessively large fitness differences from causing abnormal rotation angles.
6. The iterative process is continued by returning to Step 3 until the specified iteration limit is met.
3.2 A Hybrid Algorithm for Improved Quantum-Inspired Artificial Bee Colony with K-Means
The method is primarily designed to generate high-quality initial centroids through the proposed improved quantum-inspired artificial bee colony (IQABC) algorithm. This method addresses the sensitivity of the standard K-means algorithm to initial centroid selection and enhances the overall clustering performance. The K-means is subsequently applied to complete the data clustering process.
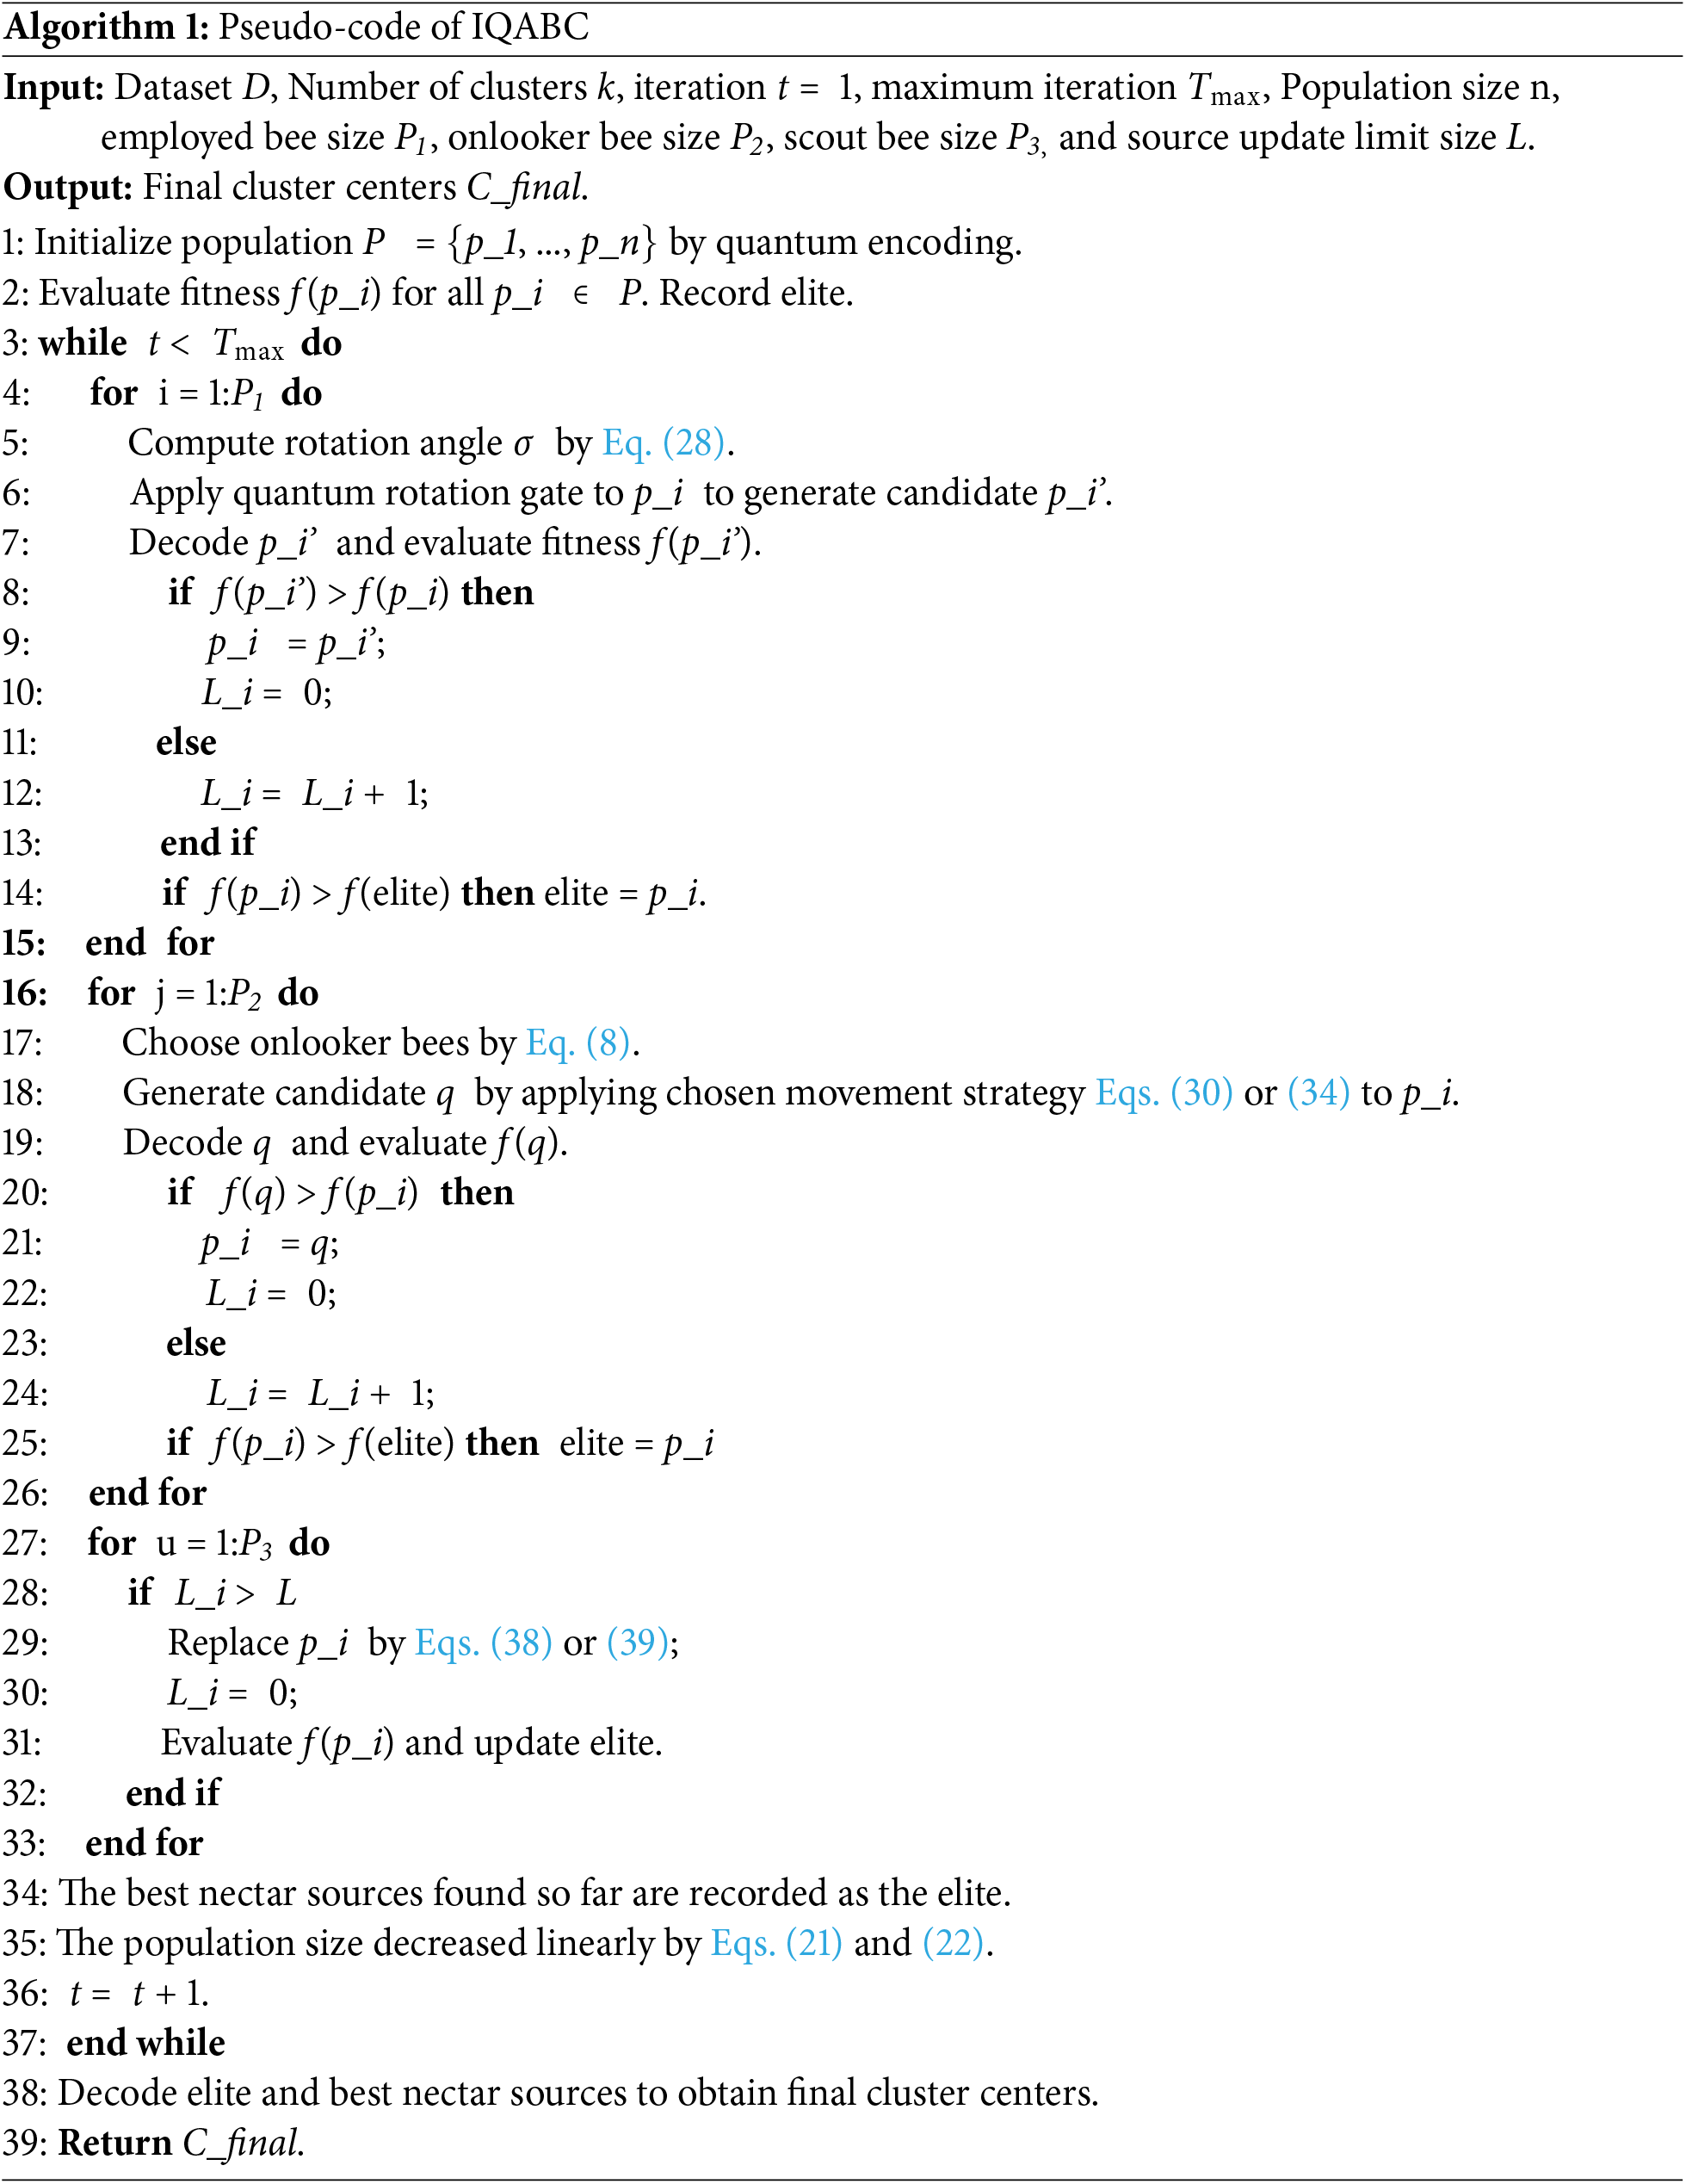
The IQABC-K algorithm in this paper introduces four primary strategies: (1) Linear population reduction strategy; (2) Dynamic adaptive rotation angle update strategy during the employed bee phase; (3) movement exploitation strategies during the onlooker bee phase; (4) Dynamic global optimal bootstrapping strategy during the scout bee phase. The overall workflow of IQABC-K is illustrated in Fig. 2, and its core procedural steps are detailed below. The pseudo-code summarizing the IQABC phase is provided in Algorithm 1.
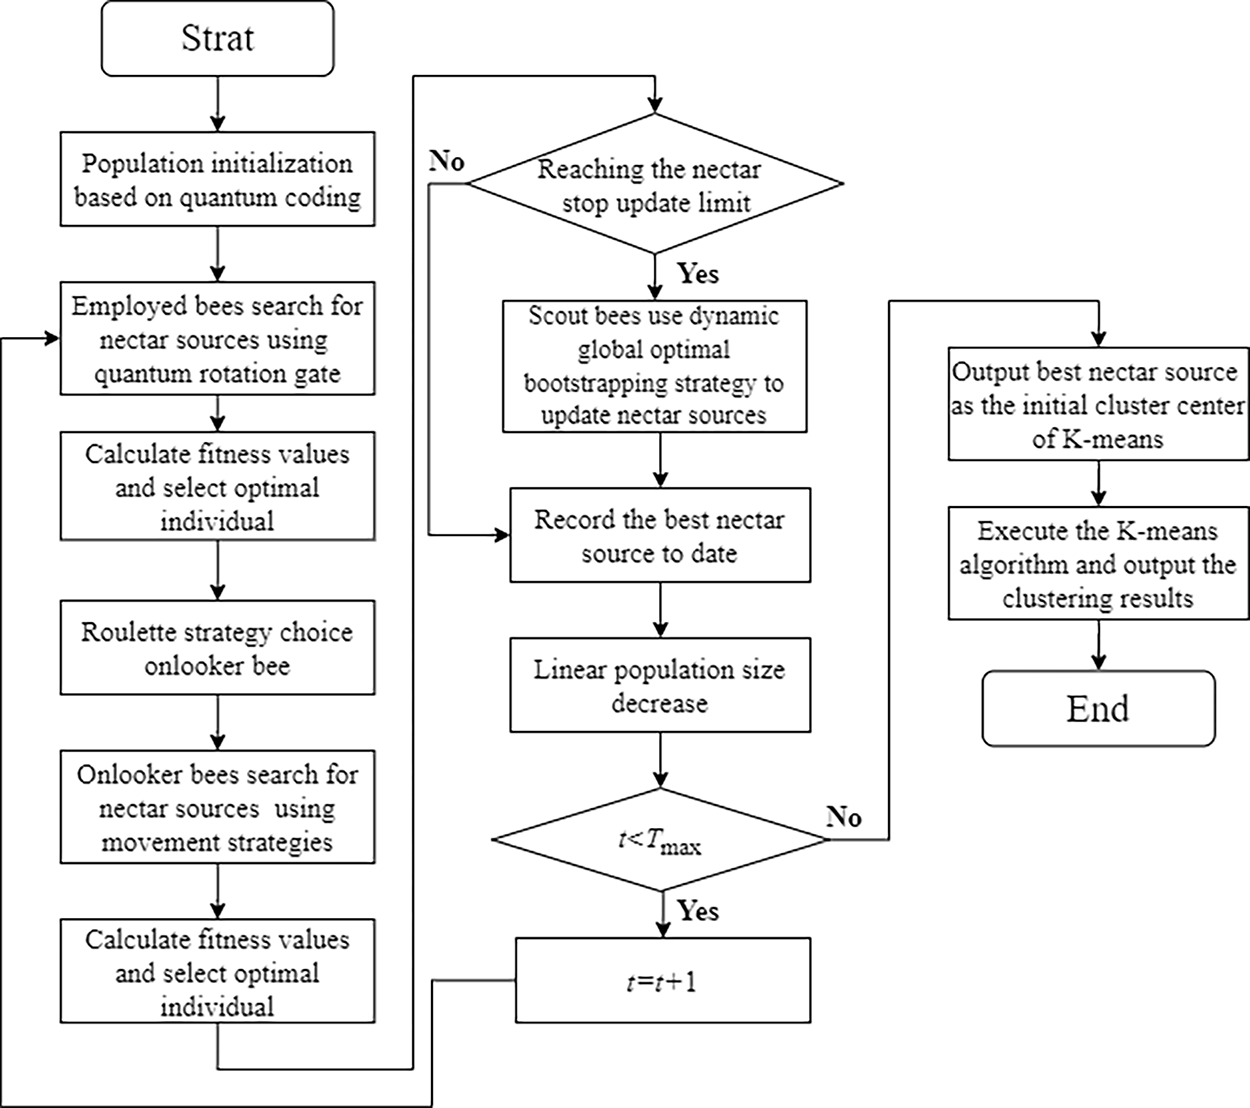
Figure 2: Flow chart of IQABC-K
3.2.1 Initialization with Quantum Representation: Linear Reduction
The algorithm begins by initializing a population of quantum-encoded bees. In this quantum-inspired framework, each food source (a potential solution) is represented by a quantum bee, defined by its probability amplitudes. The quantity of nectar sources typically equals the number of employed bees, and there is a maximum number L of consecutive searches for each nectar source. A predetermined quantity of bees is produced at random, with each bee represented by the quantum bits. Within Hilbert space, a qubit exists as a superposition of ‘0’ and ‘1’ states, and its properties are described as follows:
where,
where,
In the IQABC-K algorithm, each quantum bee is expressed by Eq. (17).
where, i
Let P denote the population matrix of n bees, each associated with two positions in the search area, representing potential solutions as follows:
Here, before fitness evaluation, the solutions must be transformed from quantum space to the solution space.
To mitigate computational overhead—especially in high-dimensional data—the IQABC-K algorithm employs a linear population reduction strategy. Based on fitness values, the quality of quantum bees in population space can be characterized. In order to raise the probability of discovering superior locations and achieve an expedient rate of convergence, consideration is given to elevating the population space’s quality, and the remaining population that exhibits low quality will be disregarded. The IQABC-K algorithm employs an appropriate technique to accomplish this, which is to arrange the matrix population P in ascending order depending on fitness values. The following equation serves as a depiction of this procedure.
Following the calculation of the ranking matrices
where, t is the current iteration, and Tmax is the maximum number of iterations. Therefore, the population size is n for the first iteration (t = 1) and nc for the ultimate iteration (t = Tmax). In the matrix
The linear population reduction strategy defined by Eqs. (21)–(23) gradually decreases the number of individuals from n to nc as iterations progress, ensuring a smooth transition from exploration to exploitation. Formally, the population size function f(t) is monotonically decreasing with respect to the iteration index t, as
From an optimization perspective, this linear decay creates a deterministic annealing effect in the search space: at early iterations, a larger population
3.2.2 Employed Bee Phase: Adaptive Exploration
Each employed bee is associated with a single food source, making their numbers identical, and searches for a new candidate solution near its current position using a quantum rotation gate. The quantum rotation gate is expressed as follows:
The renewal of a qubit using a quantum rotation gate is expressed by Eq. (25).
The rotation angle is adjusted adaptively according to Eq. (26).
where, the sign function
Through analysis and investigation of the conventional quantum rotation gate alteration strategies, it is observed that the rotation angle typically falls within the range of 0.01π to 0.05π. However, a significant limitation of this conventional approach is its use of a fixed rotation angle, which often results in low solution precision and slow convergence. To overcome these drawbacks, this paper introduces two dynamic adaptive strategies for updating rotation angle. Below is the first type.
• Iteration-Dependent Rotation Angle Update
A dynamic adaptive angle update strategy is proposed in which the rotation angle is adjusted adaptively throughout different phases of the iteration process. In the early stages, a large rotation angle aids in maximizing the speed of global convergence and accelerating the approach to the global optimal solution. During the middle stages, a moderate rotation angle balances exploration and exploitation. In the later stages of the search, a reduced rotation angle benefits the local search capability and final precision. The following equation displays the particular form.
The adaptive rotation angle
After employed bees explore new candidate solutions near their current positions via quantum rotation gates, the quality of each new solution is evaluated using a predefined objective function (see Section 3.2.5 for its mathematical equation). If a newly generated solution is superior to the current one, the employed bee updates its location accordingly.
3.2.3 Onlooker Bee Phase: Exploratory Development
Based on information shared by employed bees, each onlooker bee selects an employed bee using a roulette wheel selection mechanism driven by fitness-based probabilities. Upon selecting a source, an onlooker bee employs one of two movement exploitation strategies to generate a new candidate solution.
To enhance global exploration capabilities, the IQABC-K algorithm incorporates not only the centroid vector positions from each iteration but also introduces an additional search realm designated as the average centroid vector
In IQABC-K, a group of vectors
• The first movement exploitation tendency
The first tendency concentrates on utilizing the search area created between each quantum bee position Pi, the global optimal position Pbest, and the average centroid
where, the values r1, r2, and r3 are uniformly distributed in [0, 1]. In IQABC-K, r1 represents how the present position affects the next one. The search area is widened surrounding
Based on
where, the random numbers v1, v2, v3, and v4 are between 0 and 1. Depending on the randomness of these parameters and the two symmetric functions
• The second movement exploitation tendency
The second strategy utilizes the search region between the average centroid
where, r4, r5 and r6 are random numbers with values in the range [0, 1]. The search area of this tendency will clearly be smaller compared to the first tendency. This strategy promotes faster convergence and higher accuracy by focusing on the promising region between
3.2.4 Scout Bee Phase: Dynamic Bootstrapping for Local Escape
If a food source shows no improvement after L trials, it is considered trapped in a local optimum and abandoned. The associated employed bees are consequently converted into scout bees, which then generates a new random solution via Eq. (35). However, purely random solutions often exhibit low fitness and are quickly eliminated during selection. To leverage useful information from previous iterations, a global optimal bootstrapping strategy is introduced. During the algorithm’s iteration, the Pbest in each iteration with valuable information is recorded. This information can guide the generation of new solutions with effective quality. Therefore, a globally optimal bootstrap strategy is introduced in this stage. The specific method for the improved scout bee is expounded as below.
1) According to the bee matrix, a solution is produced through random generation by Eq. (35).
where,
2) Optimize the random solution using the second type of dynamic adaptive angle quantum rotation gate, as shown in Eq. (36).
• Fitness-Based Rotation Angle Update
The second dynamic adaptive rotation angle strategy adjusts based on the relationship between the current fitness value and the global optimal fitness value. This approach allows the algorithm to attain the optimal solution more swiftly without becoming trapped in local optima. The particular form as shown follows:
where,
Analytically, the update rule defines a bounded, monotonically decreasing mapping of
3) Two scenarios arise by the outcomes combining the solution
where, Pbest is the global optimal solution.
In the second scenarios, if the fitness of the randomly generated solution exceeds that of Pbest, the adjusted global best solution is subtracted from the new candidate according to Eq. (39).
The purpose of these two cases is to prevent the new solution from deviating excessively from the global optimum, which could adversely affect the convergence speed of the algorithm. Ultimately, the abandoned food source is ultimately replaced by the newly generated one. After the aforementioned steps, scout bees may produce solutions with improved fitness, enhancing the algorithm’s ability to escape the local optimum.
3.2.5 K-Means Clustering Phase
The K-means algorithm is initialized using the high-quality centroids obtained from the IQABC algorithm process. Subsequently, the K-means is executed to partition the data points into clusters, thereby refining the clustering results and achieving the final segmentation. The IQABC-K algorithm is proposed in this study for addressing clustering analysis problems by identifying optimal centroid positions. Given a dataset D = {x1, x2, ..., xn} intended to be partitioned into k clusters, each with m attributes of dimension, a solution is required to be constructed as a one-dimensional vector of size k × m. In the IQABC-K algorithm, each individual in the population corresponds to a candidate set of k centroids, denoted by P = {p1, p2, ..., pm}.
Several objective functions are commonly used in clustering, such as the sum of intra-cluster distances (SICD) [33], the sum of squares of errors (SSE) [34], and the sum of distances between cluster centroids (SDCC) [35]. Among these, SSE is widely adopted in K-means-based algorithms due to its effectiveness in measuring clustering quality through the total squared Euclidean distance between each data point and its assigned cluster centroid. Consequently, SSE is employed as the objective function in this paper, specified as Eqs. (40) and (41).
where, d(xi, Cj) points out the Euclidean distance within data xi to the centroids Cj to which it belongs. Gj denotes the jth cluster.
4 Experimental Results and Discussion
This section is used for experimentation and analysis. First, the clustering performance of the suggested IQABC-K algorithm is multi-dimensionally validated through comparative experiments on the UCI benchmark dataset. Subsequently, the effectiveness of intrusion detection systems built using IQABC-K and SC-QGA is evaluated using the KDD Cup99, NSL_KDD, and UNSW_NB15 datasets.
All simulations were performed in MATLAB R2023a, running on a machine equipped with an Intel Core i5-8300 processor (2.3 GHz) and 8 GB memory.
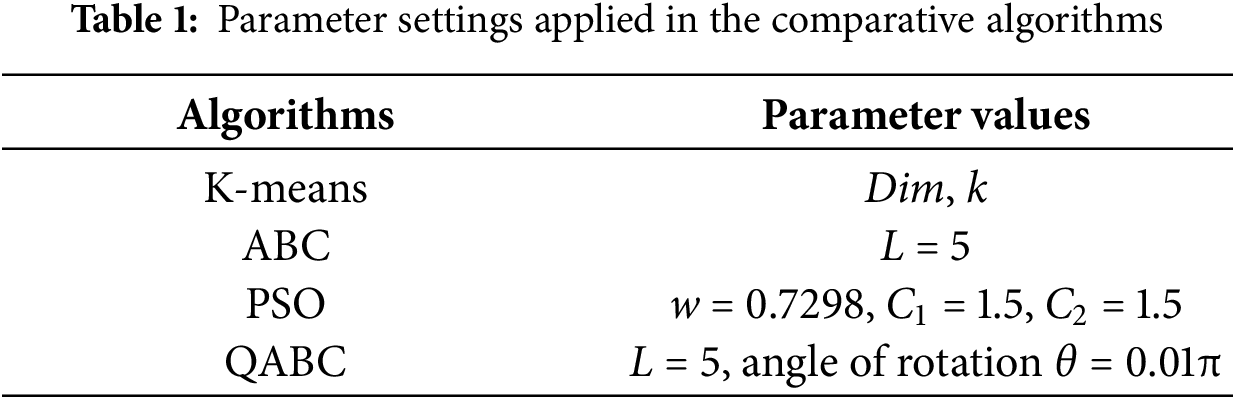
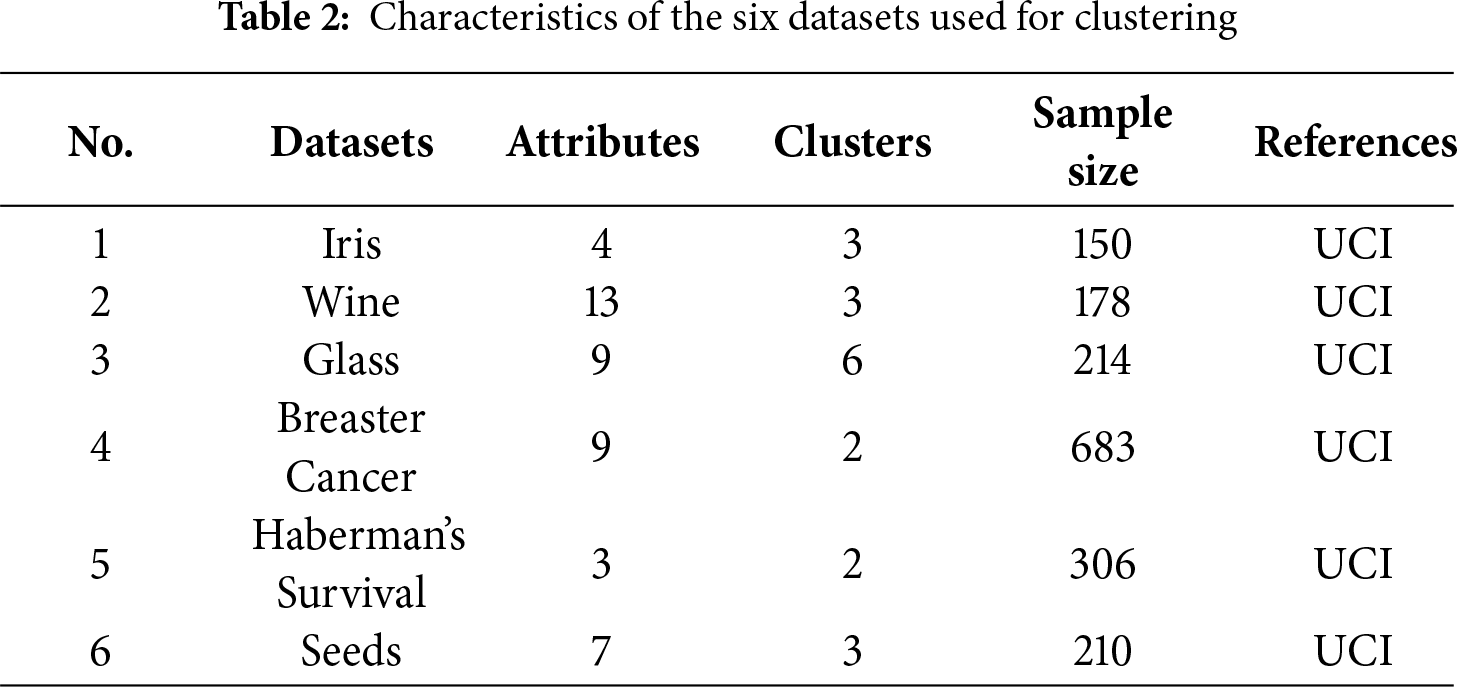
For clustering performance, comparative analysis is carried out between IQABC-K, K-means, and three nature-inspired optimization algorithms, including ABC, PSO, and QABC. The parameter variants for the different approaches are provided in Table 1. The experimental datasets are obtained from the UCI Machine Learning Repository, and six distinct sample types with different dimensions are selected, as listed in Table 2, which summarizes the dimensions, cluster sizes, sample sizes, and data sources of the six benchmark datasets. To assess the intrusion detection system, we validated it across four metrics—accuracy, false positive rate, false negative rate, and F-measure—using three network datasets. Here’s an explanation of the role of the dataset:(1) UCI datasets were used to assess clustering robustness on diverse data types; (2) network datasets (KDD CUP99, NSL_KDD, and UNSW_NB15) were employed for intrusion detection. An identical setting is applied to all algorithms for the maximum iteration count and population size.
4.2 Evaluation of the IQABC-K Clustering Algorithm
This section primarily conducts experiments and analyses on the IQABC-K algorithm and other comparative algorithms from three aspects: SSE, accuracy, and convergence. Additionally, it demonstrates statistically significant differences between IQABC-K and other algorithms through statistical tests.
4.2.1 Comparison the SSE Indicators of Algorithms
The SSE quantifies clustering quality by summing the squared distances from data points to their assigned centroids, aiming to minimize this value. Data should be as close together as feasible within an identical cluster; thus a smaller SSE value indicates better clustering quality. The SSE is described using Eq. (40). Table 3 presents the comparative SSE analysis of the proposed IQABC-K algorithm against the K-means and several existing nature-inspired algorithms across six datasets. The results are analyzed statistically based on the simulations of 10 runs. With only the value of Std, which is offered as two decimal places using scientific notation, other data in the table are displayed to four decimal places. In the table, “Best” denotes the best fitness value, “Worst” means the worst fitness value, “Mean” expresses the average fitness value, and “Std.” represents the standard deviation.
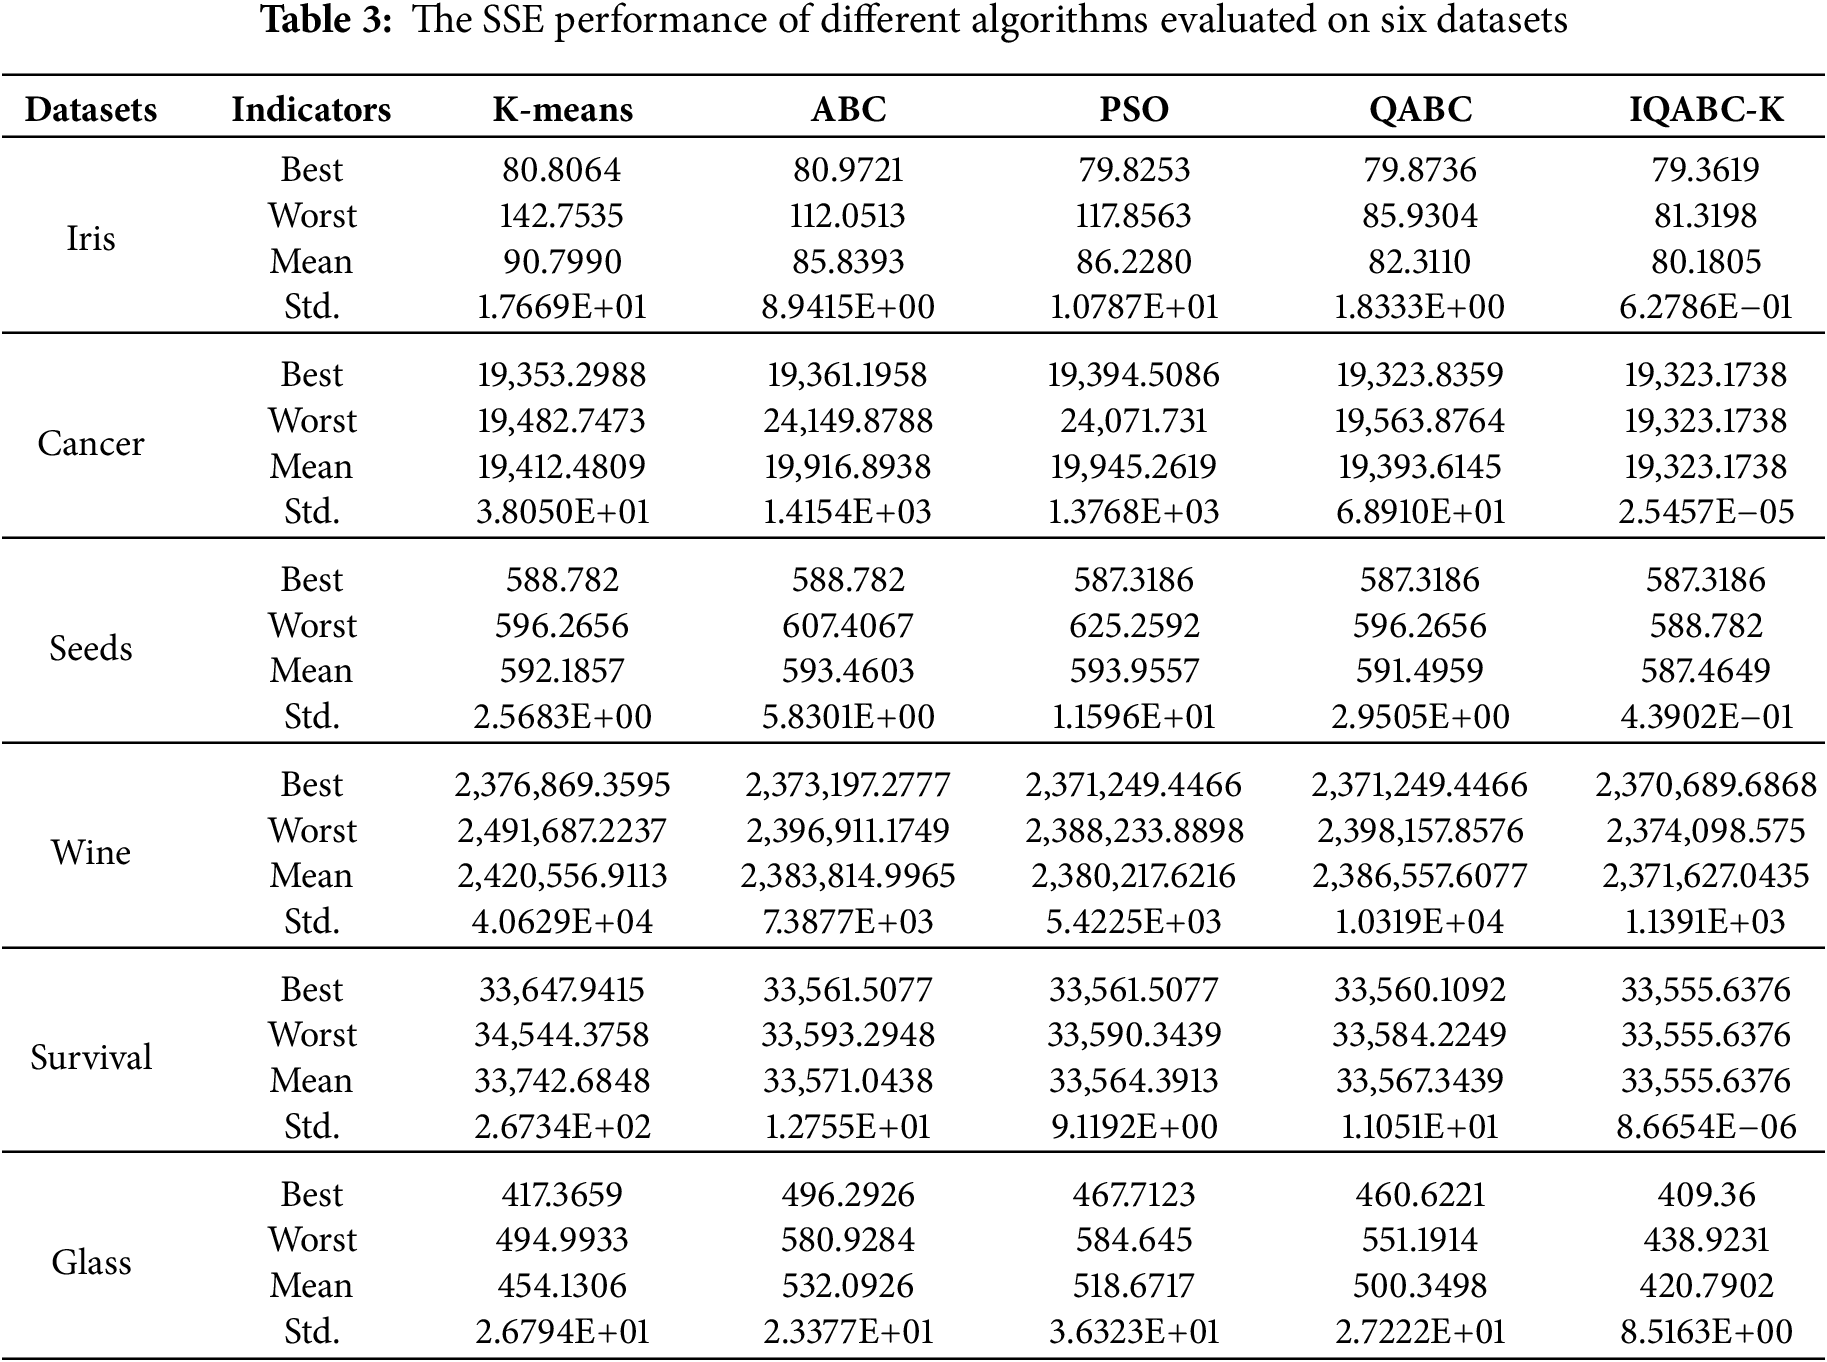
For the Iris dataset, the values of PSO and QABC actually lie close to IQABC-K on the Best values. However, Fig. 3 reveals that IQABC-K converges more quickly.
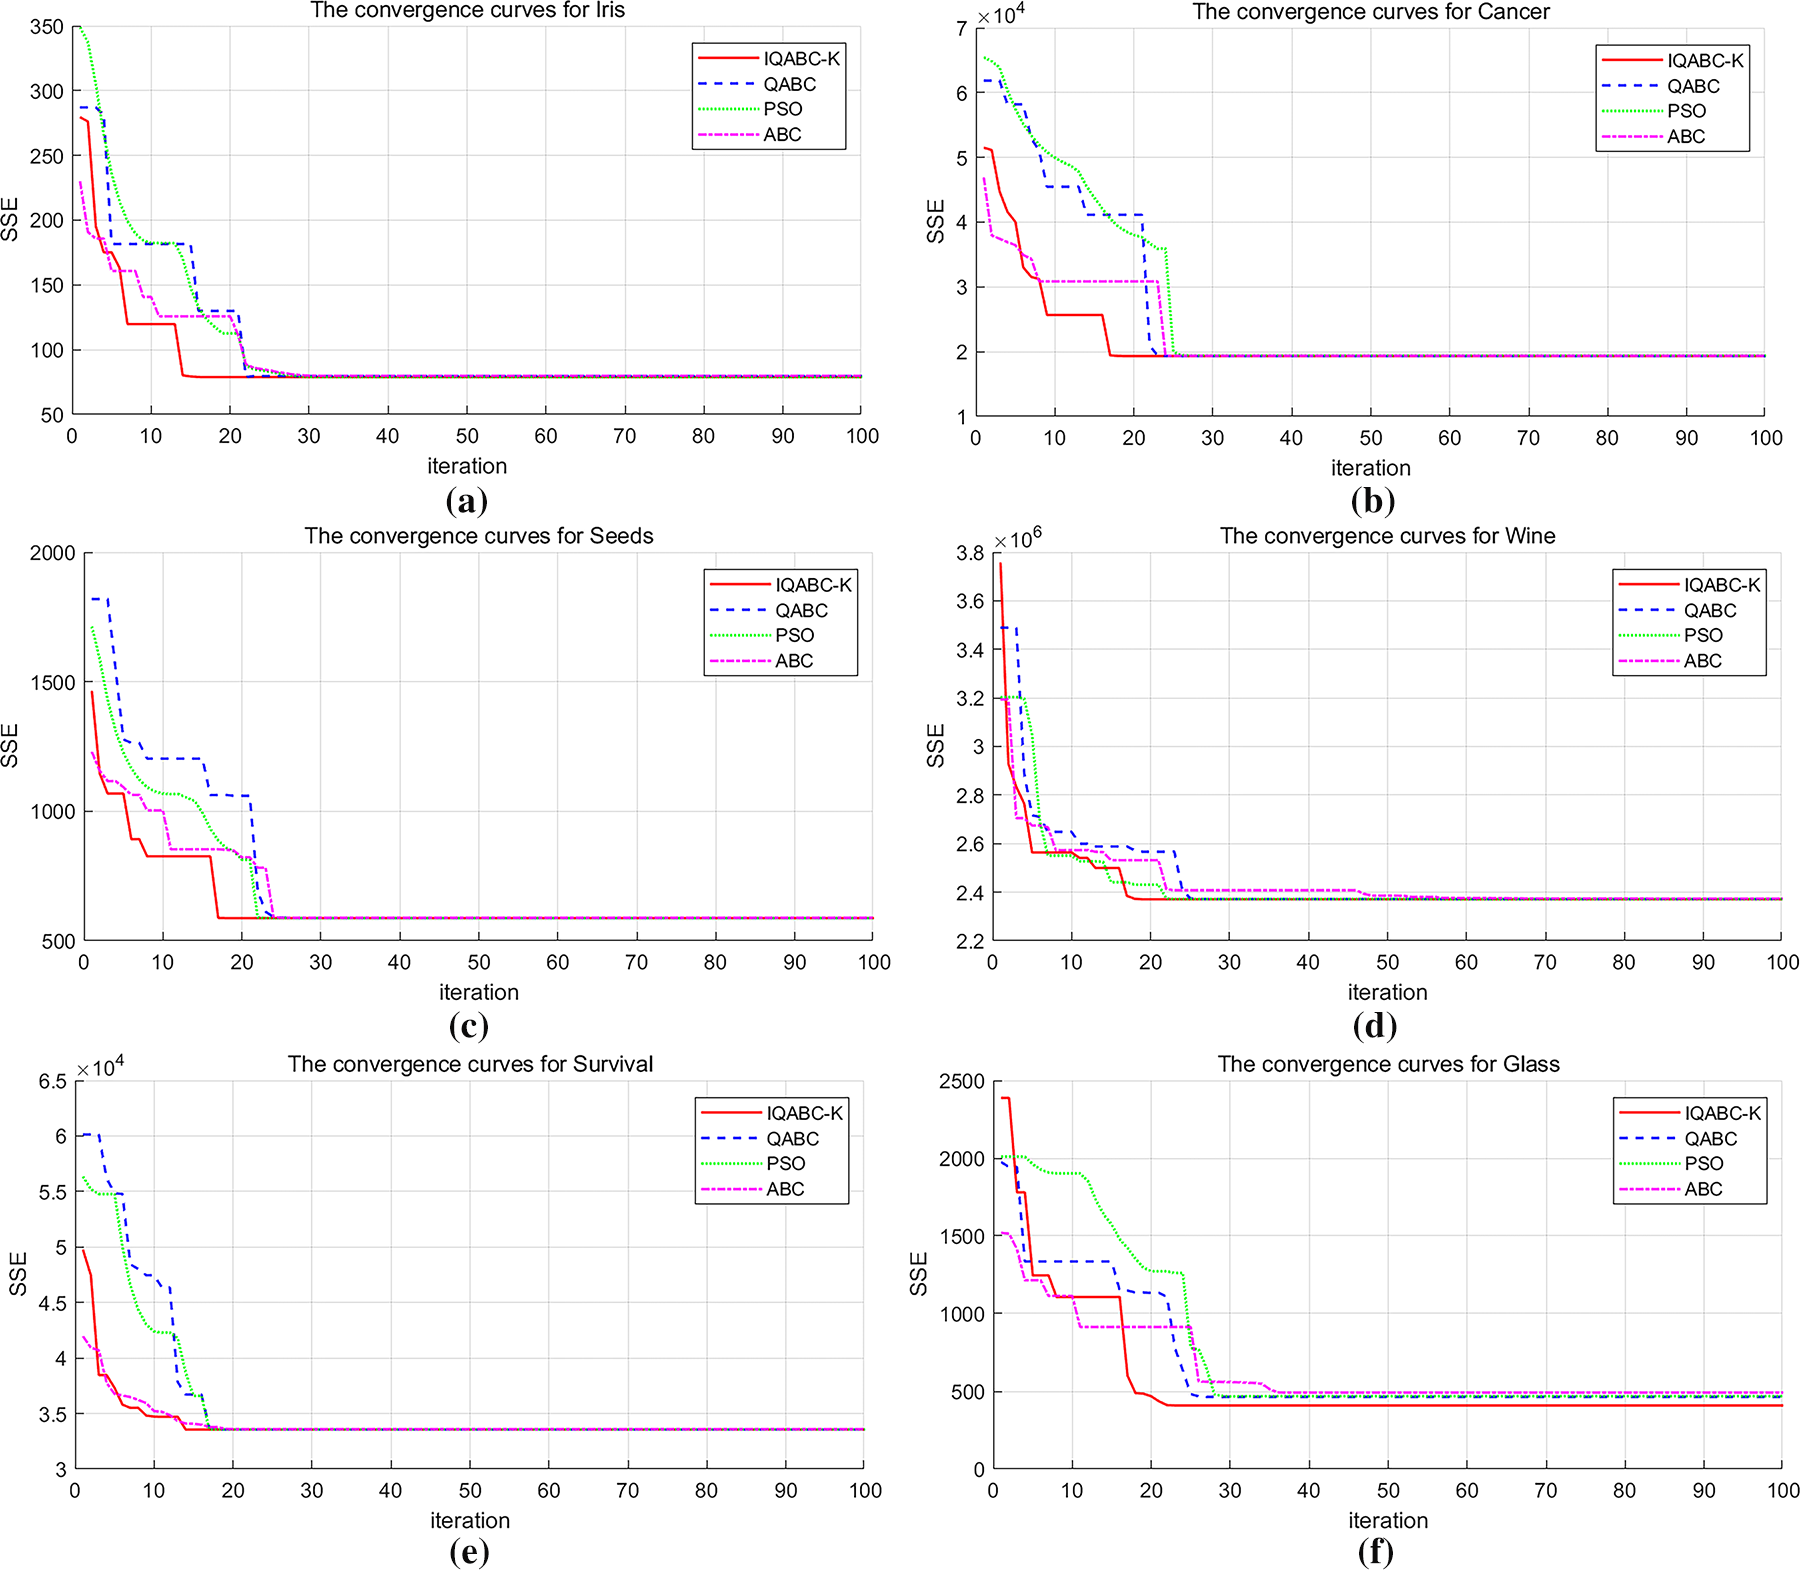
Figure 3: The convergence curves for algorithms across 6 datasets. (a) Iris. (b) Cancer. (c) Seeds. (d) Wine. (e) Survival. (f) Glass
For the cancer dataset, Table 3 indicates that IQABC-K achieves strong performance across Best, Worst, and Mean metrics, although the Best result of QABC is nearly comparable. For the standard value, IQABC-K exceeds all competing algorithms by no less than six orders of magnitude. The above shows that IQABC-K has good stability.
For the Wine dataset, the Best values of PSO and QABC are not significantly different from IQABC-K, but IQABC-K is apparently better than PSO and QABC in terms of Mean values. It can be mentioned that ABC and PSO achieve the same order of magnitude as IQABC-K with regard to Std.
For the Survival dataset, the Best values of ABC, PSO, and QABC are close to IQABC-K. Notably, the Worst value obtained by IQABC-K surpasses the Best values achieved by the comparison algorithms. IQABC-K surpasses the other algorithms by no less than six orders of magnitude in terms of standardized values.
For the Glass dataset, the Best performance achieved by IQABC-K is almost on par with K-means. Still, the gap between the other three algorithms is significant, which indicates that IQABC-K has certain optimization-seeking abilities. Still, its Std value is only one order of magnitude higher than that of the other algorithms.
4.2.2 Convergence Analysis of Algorithms
Fig. 3 displays the convergence curves for all algorithms on six datasets, based on the optimal fitness values recorded from ten runs of 100 iterations. Notably, as indicated in Fig. 3a, IQABC-K attains near-optimal fitness within 17 generations, demonstrating a significantly faster convergence rate than the alternative three algorithms. The IQABC-K convergence curve for the Cancer dataset is offered in Fig. 3b. In larger-scale datasets, the ABC algorithm has lower SSE values and converges faster than the IQABC-K algorithm in the initial 6 generations. This indicates that the classical algorithm outperforms IQABC-K in the early iterations of the large-scale dataset, which may be due to the computationally demanding nature of the quantum-inspired algorithm on the large-scale dataset. In the later stages, IQABC-K ultimately converges faster than all other algorithms, and the difference between the SSE values of IQABC-K and those of QABC and PSO is quite significant at 18 generations. For the Seeds dataset, as shown in Fig. 3c, the convergence of IQABC-K is achieved faster compared to other algorithms and almost reaches the optimal value in the 18th generation. For the remaining three datasets, depicted in Fig. 3d–f, IQABC-K also shows advantages with regard to fast convergence and high accuracy.
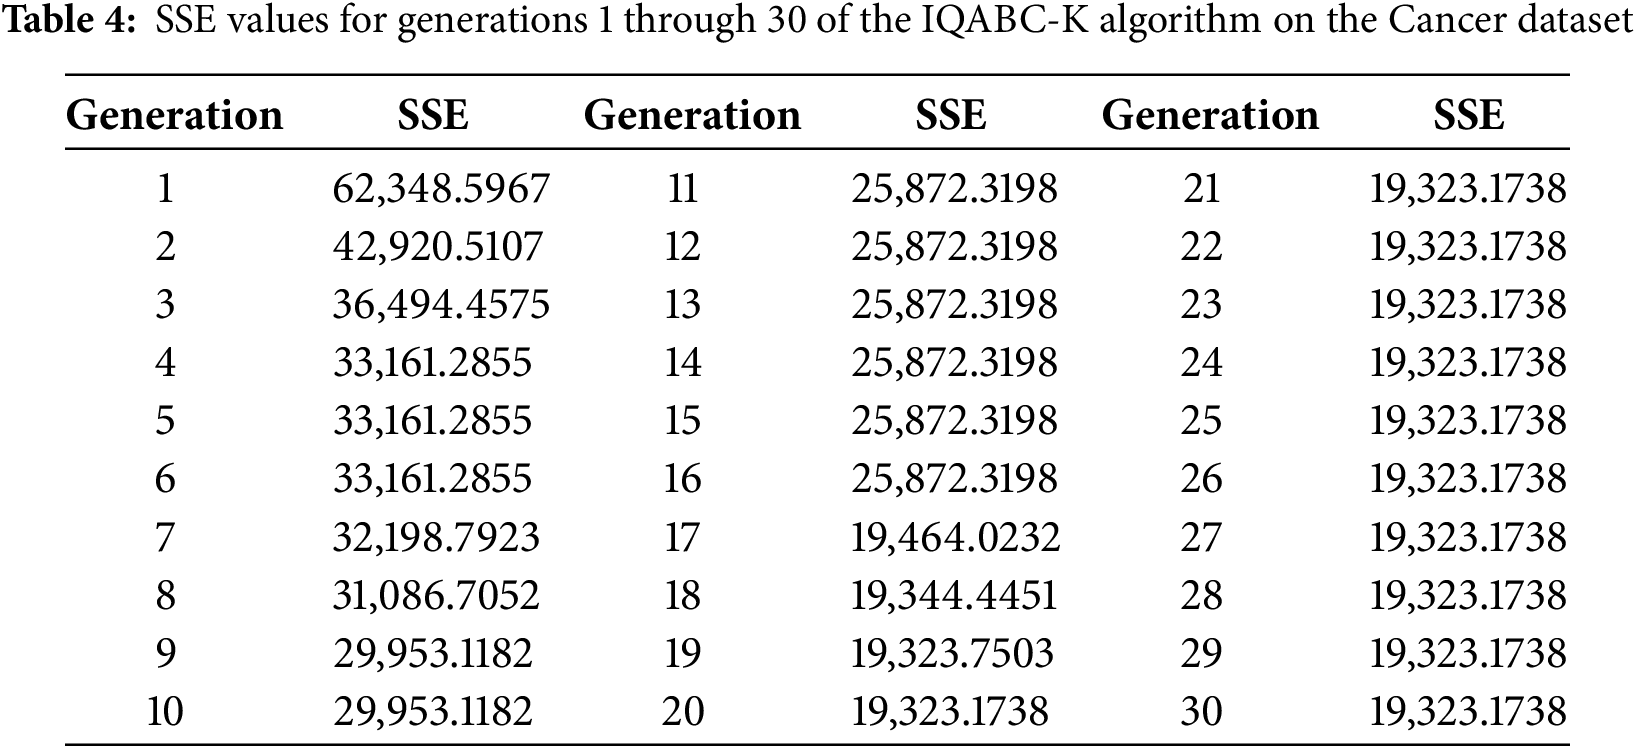
Next, the convergence properties of the algorithm will be theoretically analyzed in terms of both the definition of pointwise convergence and the asymptotic convergence rate. Table 4 displays the SSE values from generation 1 to generation 30 for the dataset, which was chosen as Cancer. They are not displayed again since the SSE values from generations 31 through 100 are 25,872.3198.
• Pointwise convergence
Verify that the output sequence {xt} (sequence of SSE values) of the proposed algorithm converges to a limit value
The SSE for each generation t denotes the value of the objective function of the proposed algorithm in generation t. It needs to be demonstrated that the sequence {xt} converges to some fixed value
(1) Data observations and define the convergence point. The SSE remains constant at 19,323.1738 from generation 21 to 100. Thus, it may be guessed that the limit value for point convergence is
(2) Mathematical formulation of pointwise convergence. Prove that
(3) For any given
• Asymptotic convergence rate
The asymptotic convergence rate describes the rate at which the error sequence {et} of an iterative algorithm converges to 0 and quantifies the convergence performance of the algorithm by analyzing the shrinkage of the error ek over the course of the iterations. The error ek is defined as:
where, xt denoted the solution at the tth iteration, and x* represented the limit or objective solution value.
Asymptotic convergence rates can be categorized into linear, superlinear, and sublinear convergence as shown in Eqs. (44)–(46), respectively.
According to the definition of asymptotic convergence rate, it is necessary to analyze the rate at which xt converges to the limit value
(1) Calculate the error ek for the first 20 generations according to Eq. (43), followed by the error ratio
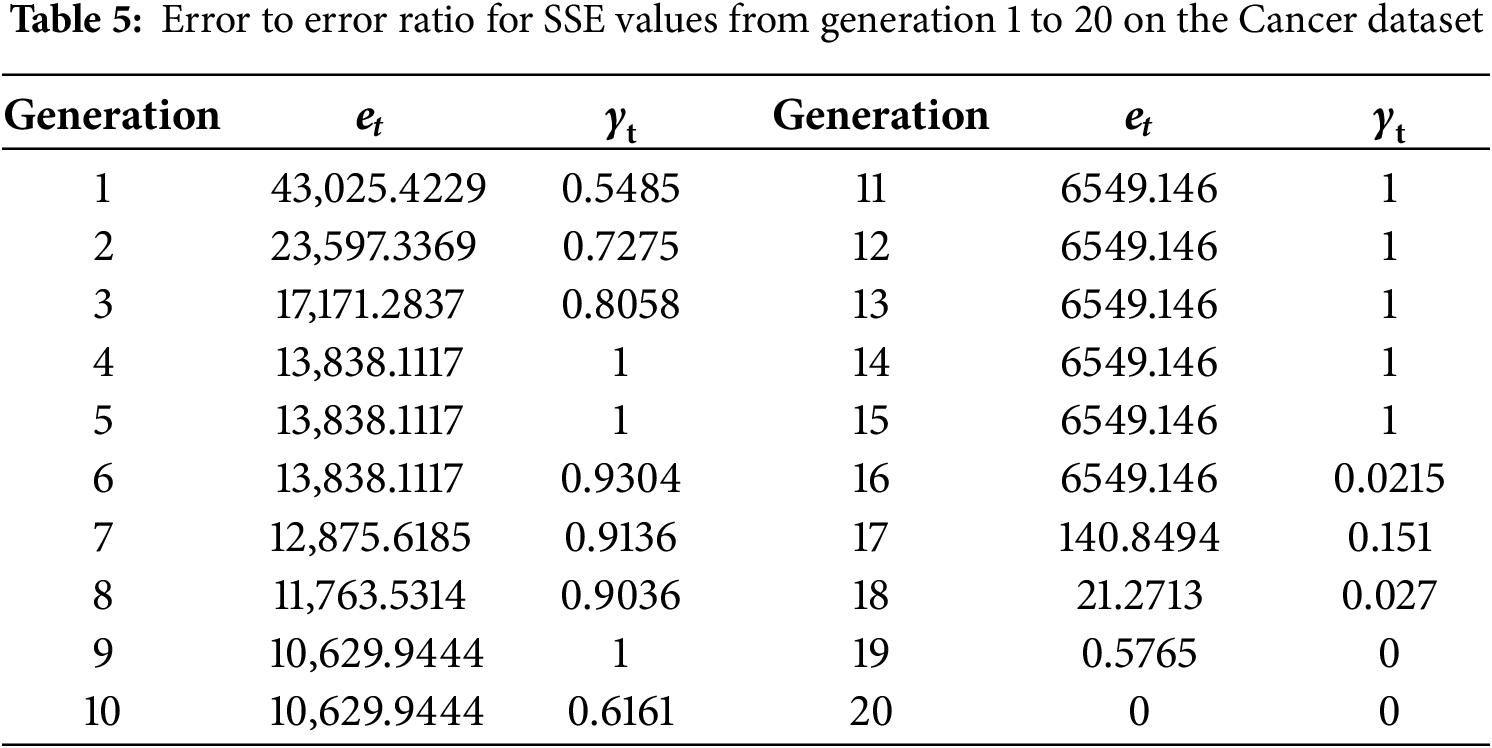
(2) Determining convergence rate. There is linear convergence if the error sequence satisfies Eq. (44), meaning that the error diminishes by a fixed ratio. The existence of a stable W can be inspected by calculating the ratio
Therefore, the convergence of the sequence of SSE values {xt} can be characterized as a superlinear convergence to a fixed point
4.2.3 Comparison Clustering Accuracy of Algorithms
Clustering Accuracy (AC) serves as a metric for evaluating the alignment between obtained labels and the dataset’s authentic labels. Here, AC is utilized to determine the efficacy of IQABC-K, considering both the differences from true labels and the performance relative to other algorithms. The equation for calculating AC as defined follows:
where, si and ri denote the ground-truth and predicted labels of the data point xi, n indicates the total sample size, and the map defines the optimal relabeling to support accurate statistical evaluation.
The Kuhn-Munkres or Hungarian algorithm [36] solves the label allocation issue in polynomial time and achieves general optimal reassignment. The indicator function is represented by
The AC values for all six datasets are summarized in Table 6. The IQABC-K algorithm consistently achieves the highest AC, indicating its superior clustering accuracy. In contrast, the Max, Min, and Mean results of the remaining four algorithms show variability across different datasets.
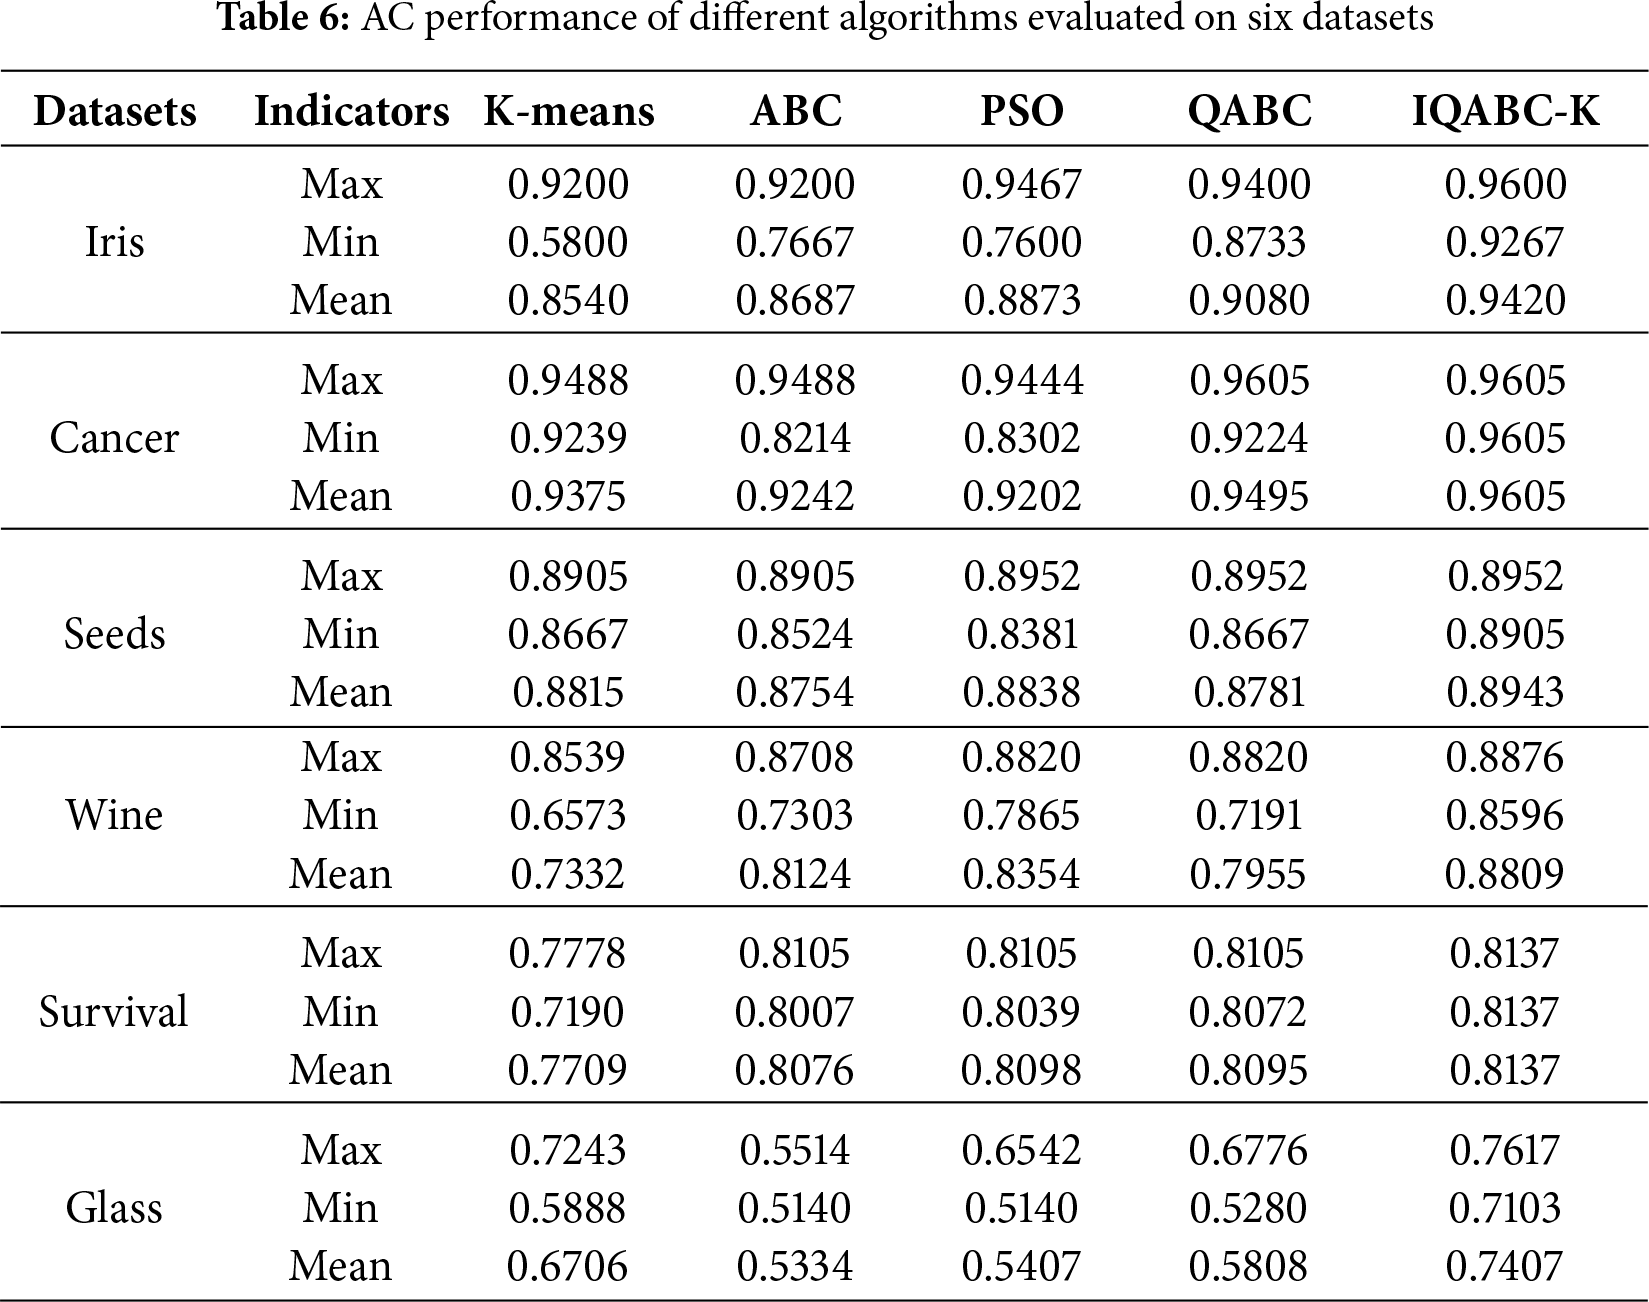
For the Iris dataset, the Max AC value of IQABC-K is 0.96, which is 4% higher than K-means. Despite both QABC and IQABC-K achieving a Max AC value of 0.9605 for the Cancer dataset, IQABC-K fares superior to QABC in terms of Mean and Min values, which indicates more stability in the clustering results. For the Seeds dataset, IQABC-K has the same Max AC as PSO and QABC, ABC has the worst Mean AC value, while PSO gets the lowest Min AC value. For the Wine dataset, IQABC-K outperforms the other four algorithms across the spectrum of Max, Min, and Mean values, which implies greater stability and works better on high-dimensional datasets, with less sensitivity to sample dimensions. The Max AC value of IQABC-K on the Glass dataset is almost 4% in excess of K-means. Beyond that, the Min and Mean AC values exceed those obtained by the other algorithms.
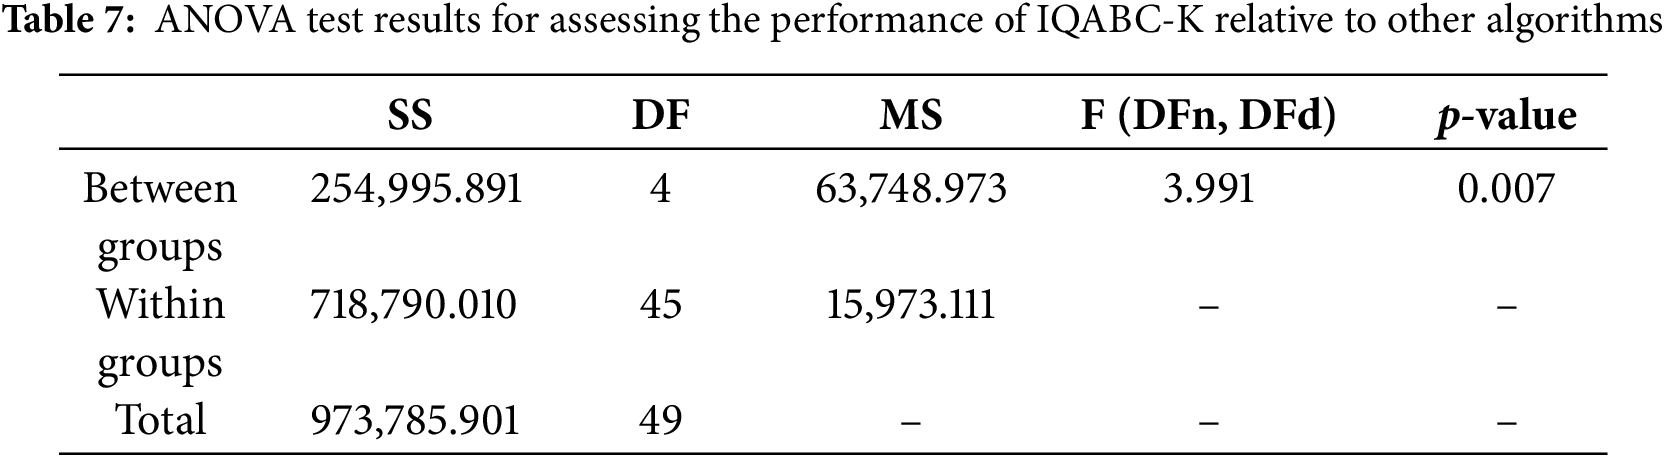
This section conducts a statistical experiment to perform hypothesis testing on the SSE metrics of five algorithms across six datasets. Specifically, the ANOVA test and the Wilcoxon rank-sum test are employed to statistically evaluate whether the IQABC-K demonstrates superior adaptability.
First, perform an ANOVA test, which is applied to assess the statistical variance between the presented algorithm and the different algorithms that are utilized for comparison. Hypothesis testing consists of two hypotheses: the null hypothesis (H0:
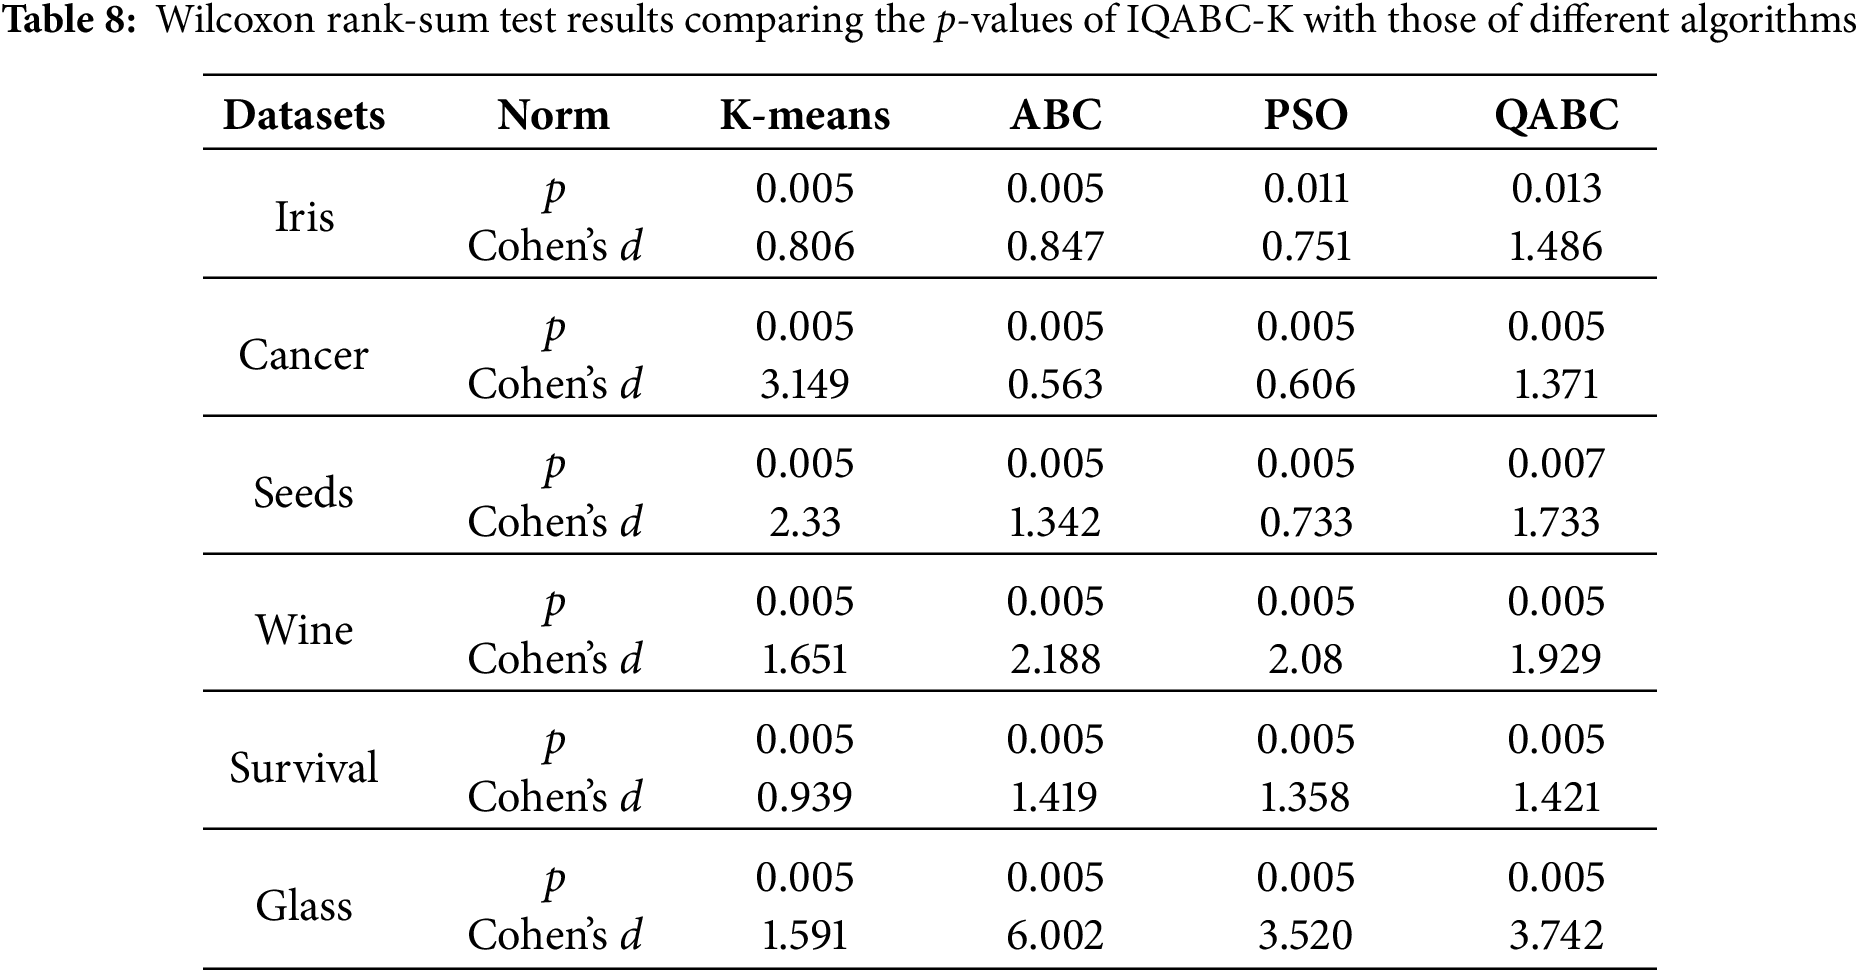
Further, the Wilcoxon rank-sum test is a non-parametric statistical test introduced in this paper with the aim of precisely validating the experimental results and verifying the statistical significance of how it impacts IQABC-K. Hypothesis testing is composed of two hypotheses: the null hypothesis (H0:
4.2.5 Visual Evaluation of the IQABC-K Clustering
After the aforementioned experiments, the IQABC-K algorithm is characterized by fast convergence, strong stability, and high accuracy, as demonstrated in Fig. 3, Tables 3 and 6. To offer a more vivid situation of the algorithm’s clustering capability, the clustering process will be shown graphically in this section.
The clustering process for IQABC-K will be visualized using the Iris dataset, which comprises four attributes and three distinct clusters. Here, three of the attributes are taken, and the x, y, and z axes are used to correspond to the three attributes, respectively. Data points in different clusters are labeled in green, dark blue, and yellow. Fig. 4 displays the IQABC-K clustering on the Iris dataset for iterations of 0, 5, 10, and 20. The original distribution from the Iris dataset is shown in Fig. 4a. When it comes to the fifth iteration, referring to Fig. 4b, there is a situation where the data points in one class are misallocated to another class during the classification process, such as the part of yellow being misclassified. Additionally, it has confusion in categorizing data between dark blue and green data. As the iterations carry on, the clustering outcomes after 10 iterations are displayed in Fig. 4c. While the dark blue is successfully classified, some data is still wrongly assigned for the yellow and green colors. Fig. 4d presents the clustering outcomes at the 20th iteration, clearly showing that the three categories are correctly classified. The clustering process of IQABC-K on the Iris dataset is depicted vividly by the four graphs from Fig. 4. The efficacy and fast classification speed are demonstrated by the 20th generation’s accurate categorizing effectiveness.
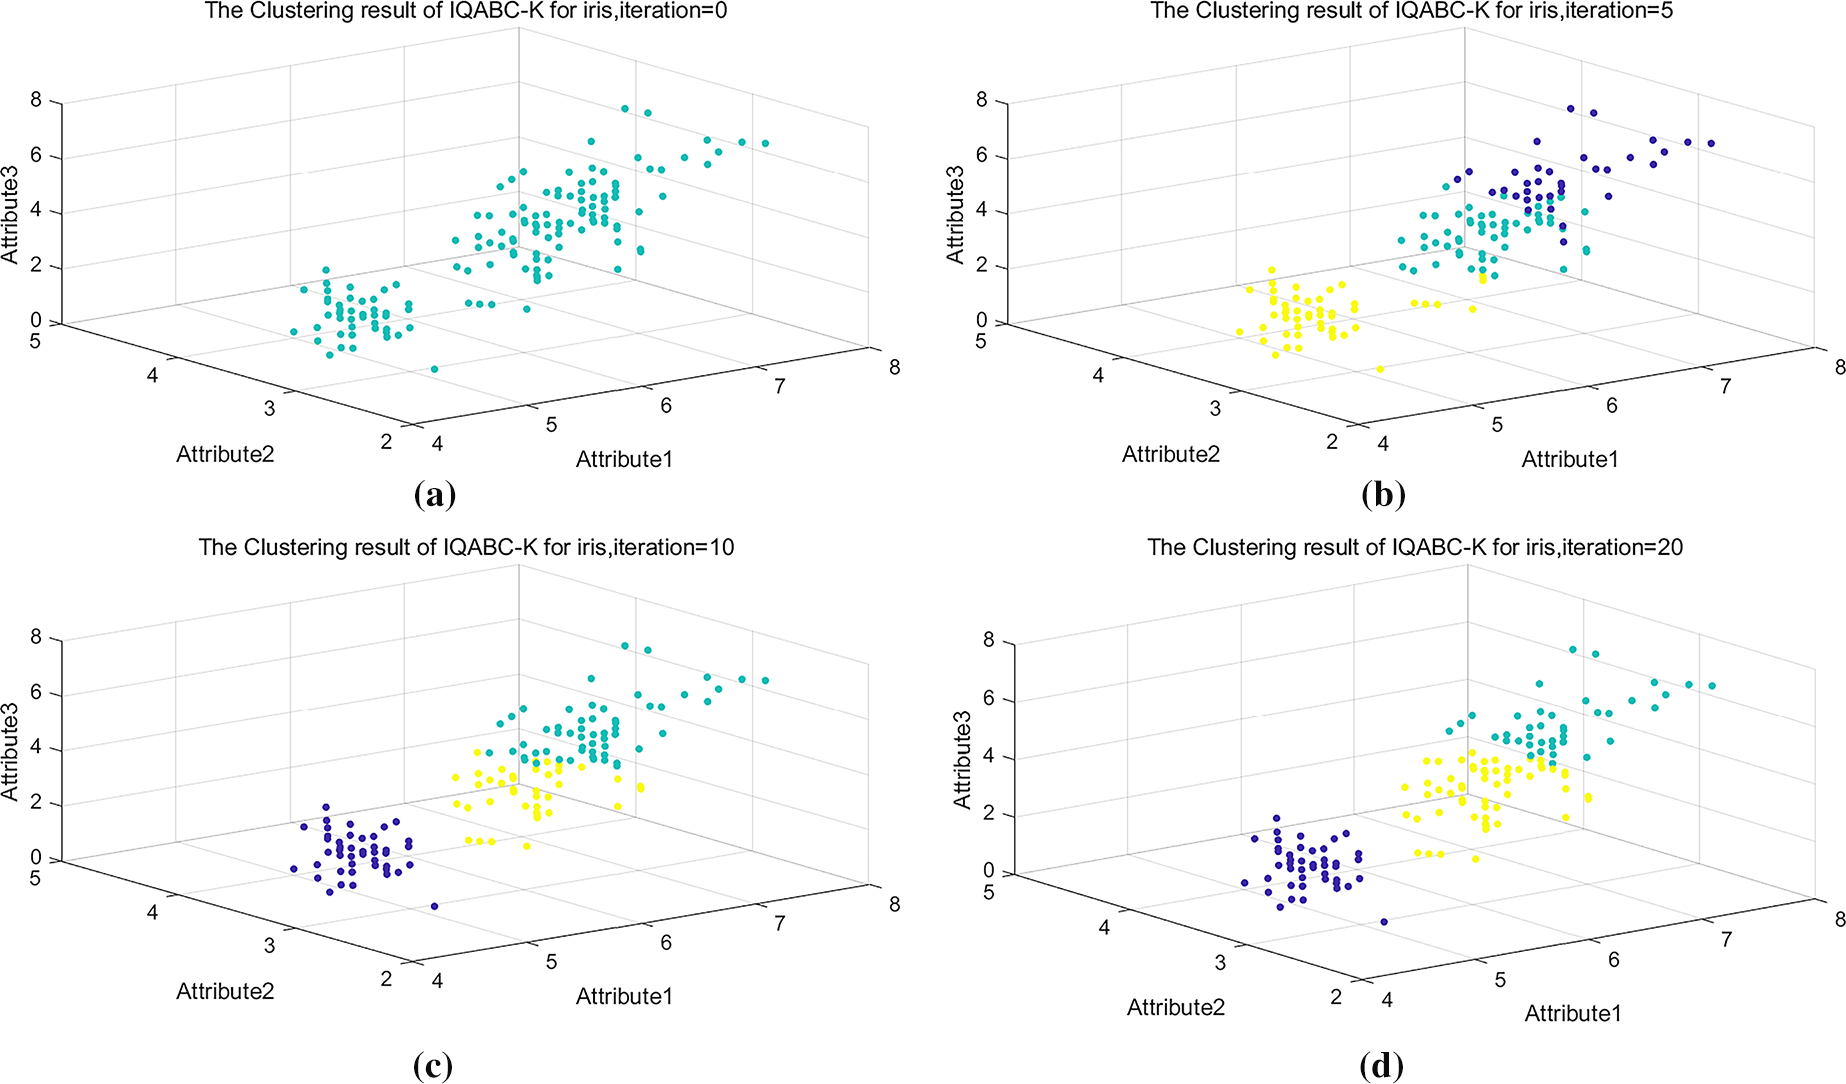
Figure 4: The clustering process of IQABC-K on the Iris dataset at iterations 0, 5, 10, and 20. (a) 0 iteration. (b) 5 iteration. (c) 10 iteration. (d) 20 iteration
Next, the outcomes of IQABC-K compared with other algorithms on the Iris dataset, Cancer dataset, and Seeds dataset are provided. The QABC clustering results with the 10th and 20th iterations on the Iris dataset are displayed in Fig. 5. Fig. 5a shows that there is data confusion in the category clusters and that not any one cluster is precisely classified. Although one category is successfully delineated in Fig. 5b, a significant degree of data confusion remains between the dark blue and green data, with significantly more green data than dark blue data. It is obvious from comparing Fig. 4c,d that IQABC-K resolves the clustering problem more accurately and efficiently than QABC.
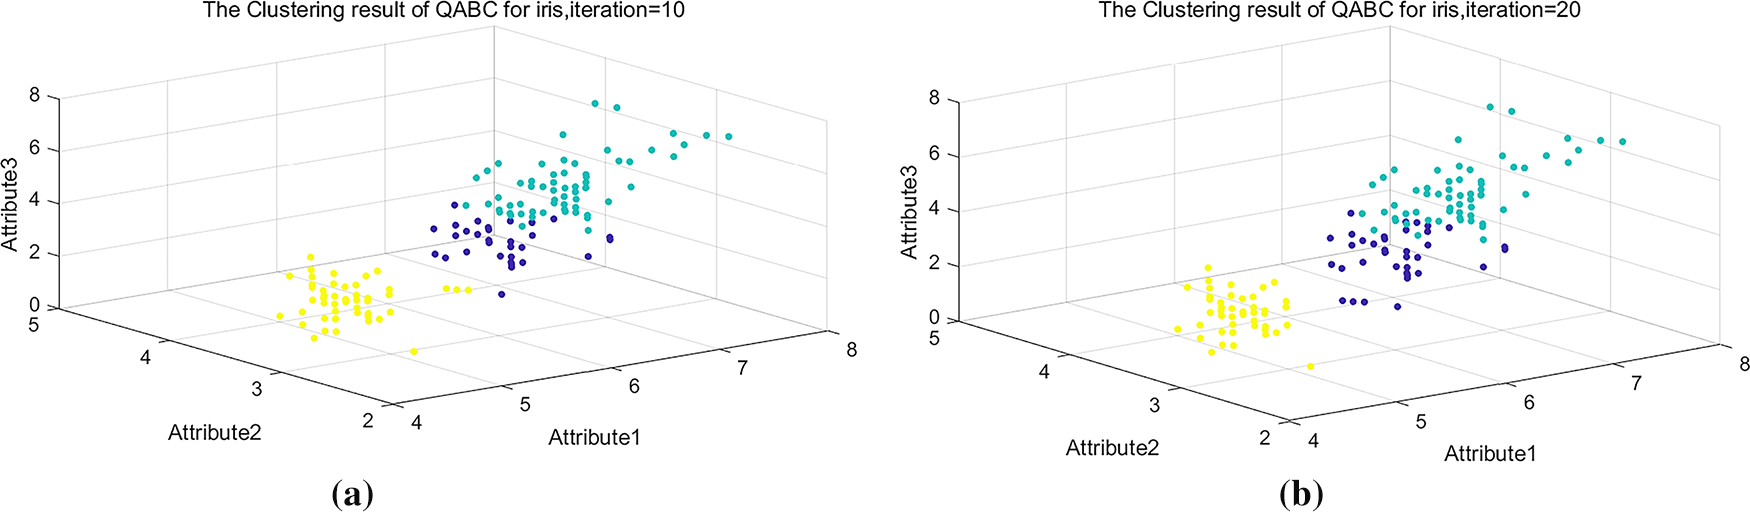
Figure 5: 10- and 20-iteration clustering outcomes for QABC on the Iris dataset. (a) Iteration = 10. (b) Iteration = 20
The data in Table 3 articulates that QABC is only surpassed by IQABC-K with regard to Best and Mean values on the Cancer dataset. Table 6 also illustrates that when it comes to the Max and Mean values, the QABC algorithm outperforms all other algorithms—with the exception of IQABC-K. To further emphasize the disparities in performance between IQABC-K and QABC, the clustering outcomes from the 20th iteration are chosen as a contrast. Fig. 6a,b displays the classification outcomes of QABC and IQABC-K for the Cancer dataset from attribute 1 to attribute 3 on the 20th generation. It displays that the yellow and dark blue data appear to be confusing in Fig. 6a. Comparing Fig. 6b to a, considerable advances have been made in the categorization of yellow and dark blue, suggesting that IQABC-K performs better.
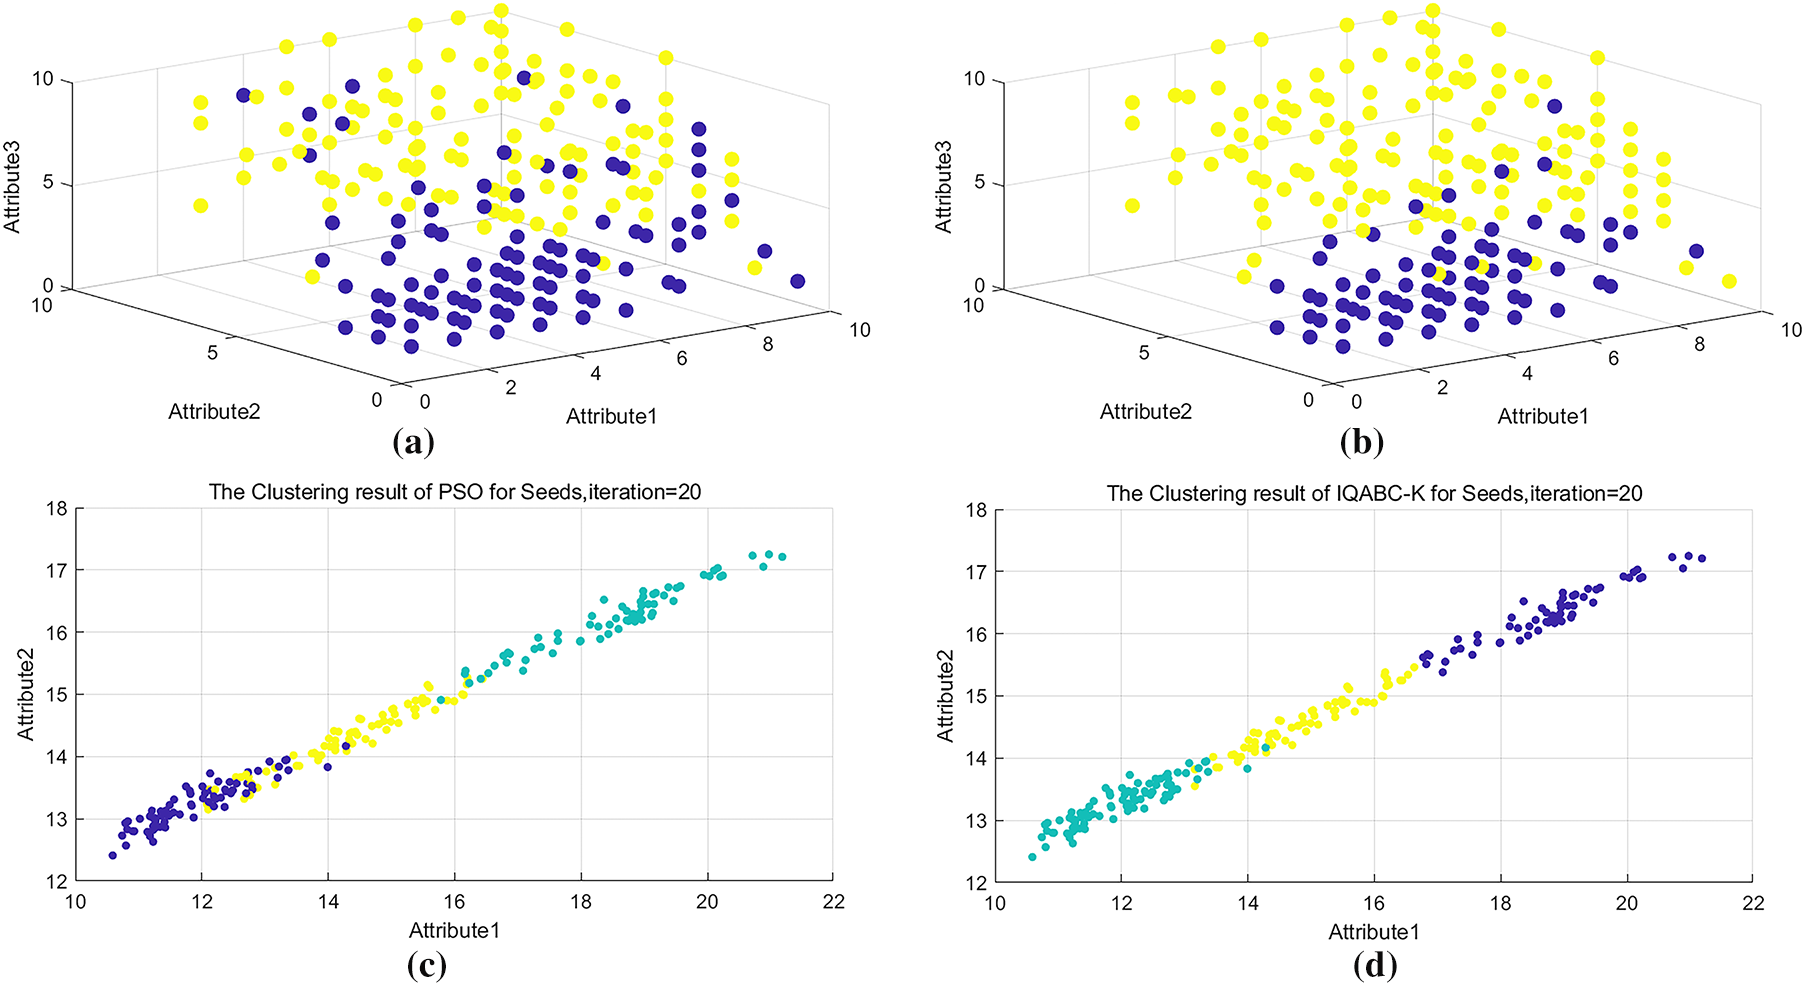
Figure 6: Clustering outcomes of IQABC-K and different algorithms on distinct datasets at iteration 20. (a) QABC for Cancer dataset. (b) IQABC-K for Cancer dataset. (c) PSO for Seeds dataset. (d) IQABC-K for Seeds dataset
Table 6 illustrates that on the Seeds dataset, PSO is following only IQABC-K with respect to Max and Mean values. Therefore, PSO has been chosen for further performance comparison with IQABC-K. For the first two attribute values on the Seeds dataset, the 20th generation clustering results of PSO and IQABC-K are visible in Fig. 6c,d, respectively. Fig. 6c shows that data confusion appears evident and that dark blue, yellow, and green in PSO are mistakenly classified. From Fig. 6d, it is observed that dark blue and yellow have been classified correctly. Even though some data confusion still exists for green and yellow, IQABC-K delivers more dominant classification results, as evidenced by its better classification effect in contrast to PSO.
4.3 Evaluation of the Intrusion Detection System
In this experimental section, the effectiveness of the novel attack detection method formed by combining the proposed SC-QGA and IQABC-K algorithms in the context of intrusion detection. Here, this hybrid approach is referred to as SC-QGA-IQABC-K for brevity.
4.3.1 Experimental Data Selection and Processing
This paper uses three datasets to validate the SC-QGA-IQABC-K algorithm, briefly described below.
The KDD Cup 1999 (KDD99) dataset, derived from the 1999 KDD Cup competition, serves as a widely adopted benchmark for network intrusion detection. It is divided into training and testing subsets, with each record representing a network connection characterized by 41 features and labeled as normal or attack. The training dataset includes one normal recognition category and 22 attack categories. The categories of attacks are presented in Table 9.
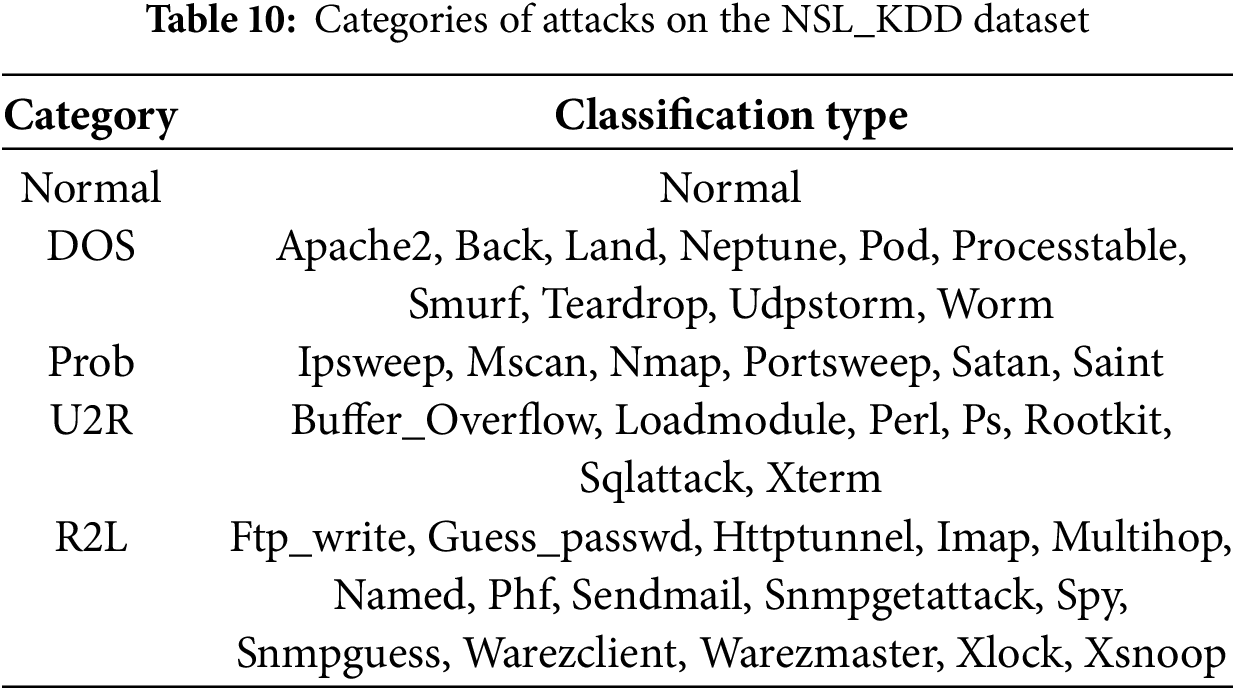
The NSL_KDD dataset is a revised version of the KDD99 dataset, similarly divided into training and test sets. Each record comprises 41 attributes, with the first 40 describing the network traffic characteristics and the final attribute specifying whether the instance corresponds to normal or attack behavior. The dataset contains four distinct attack types: DoS, Prob, U2R, and R2L. Detailed classifications are provided in Table 10.
The UNSW_NB15 dataset, established in 2015, is partitioned into training and testing subsets. It comprises 49 attributes and one label indicating whether a given record belongs to the normal or attack category. The attack category is further divided into nine specific types, as detailed in Table 11.

Prior to utilizing the datasets, preprocessing is typically required to guarantee data quality and suitability for subsequent evaluation. The following outlines the key preprocessing steps commonly applied to the datasets.
1. Numerical transformation processing. As the network datasets include a subset of features in symbolic format, to ensure that intrusion detection models can process the data, all features are converted into numeric values, as these models require inputs in vector form.
2. Numerical standardization. Let
3. Numerical Normalization. Numerical normalization scales each value in the dataset to the [0, 1] interval. The normalized value
where,
4. Feature selection. Each record in the dataset comprises multiple features; however, not all are essential for constructing an effective intrusion detection system. To maximize efficiency and minimize the unnecessary use of computational resources, it is crucial to select the most relevant features. The quantum genetic algorithm combined with similarity coefficients used in this paper to achieve feature selection is described in Section 3.1.
4.3.2 Performance of SC-QGA-IQABC-K
This study utilizes accuracy (AC), false positive rate (FPR), false negative rate (FNR), and F-measure (F1) as the core evaluation metrics to assess the performance of the SC-QGA-IQABC-K and comparative algorithms. The mathematical definitions of these metrics are defined as shown in the equations below.
where,
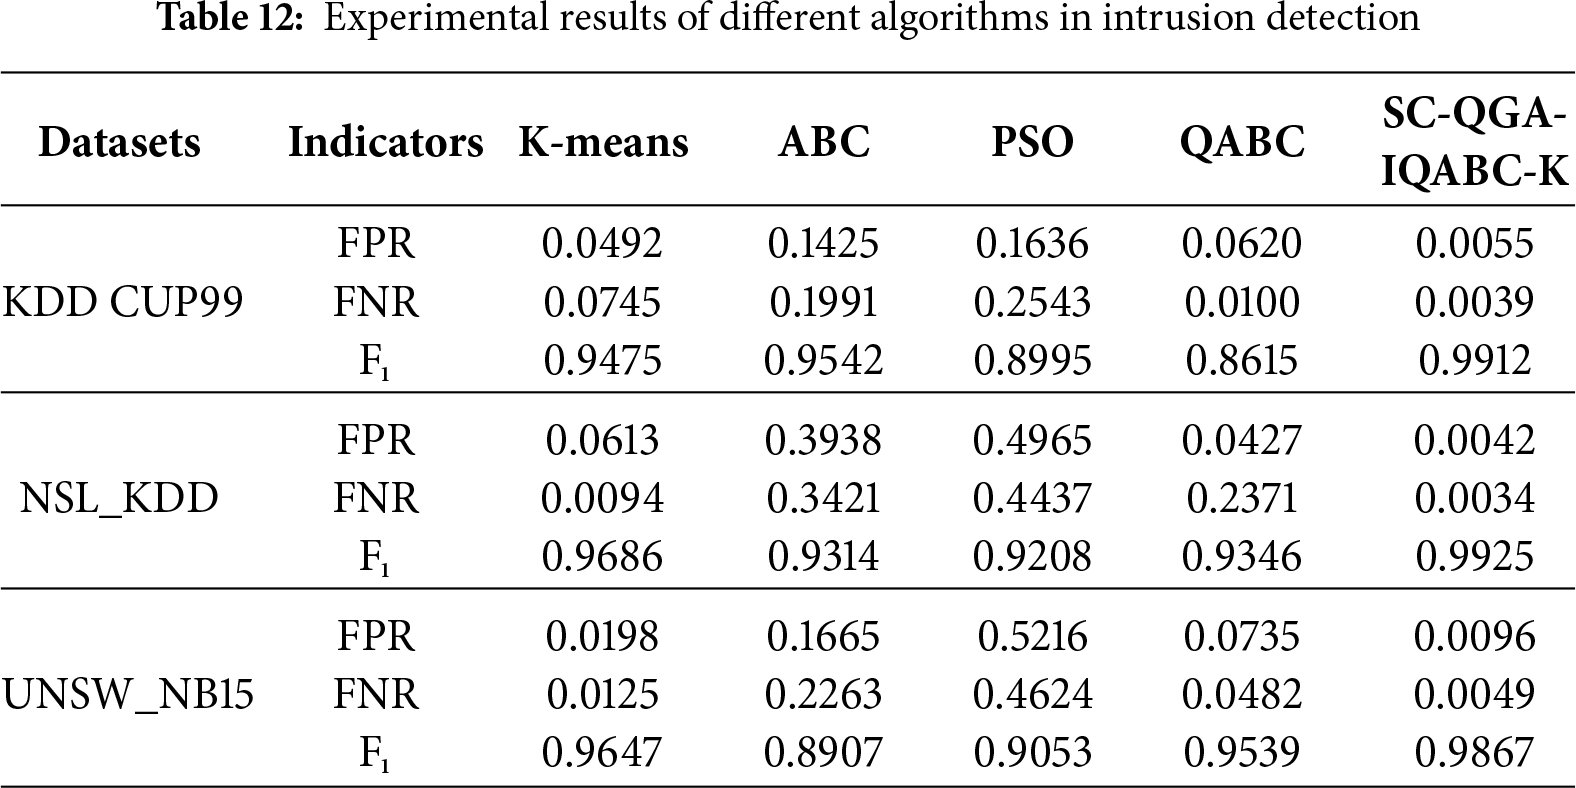
Table 12 presents the performance of K-means, ABC, PSO, QABC, and SC-QGA-IQABC-K in intrusion detection experiments. On the KDD CUP99 dataset, although the false positive rate of the K-means is lower than that of the ABC, PSO, and QABC algorithms, it remains 0.0437 higher than the FPR of 0.0055 achieved by the proposed SC-QGA-IQABC-K algorithm. Regarding the false negative rate, the SC-QGA-IQABC-K algorithm exhibits less than a 1% difference compared to QABC, but it attains the highest F-measure of 0.9912, significantly outperforming the other four algorithms. For the NSL_KDD dataset, the SC-QGA-IQABC-K algorithm outperformed QABC by nearly a factor of 10 in false positive rate, while the K-means algorithm showed little difference from SC-QGA-IQABC-K in false negative rate. For the UNSW_NB15 dataset, the SC-QGA-IQABC-K algorithm significantly outperformed the other four algorithms in both false positive rate and false negative rate. Its F-measure reached 0.9867, exceeding the K-means algorithm by over 2%.
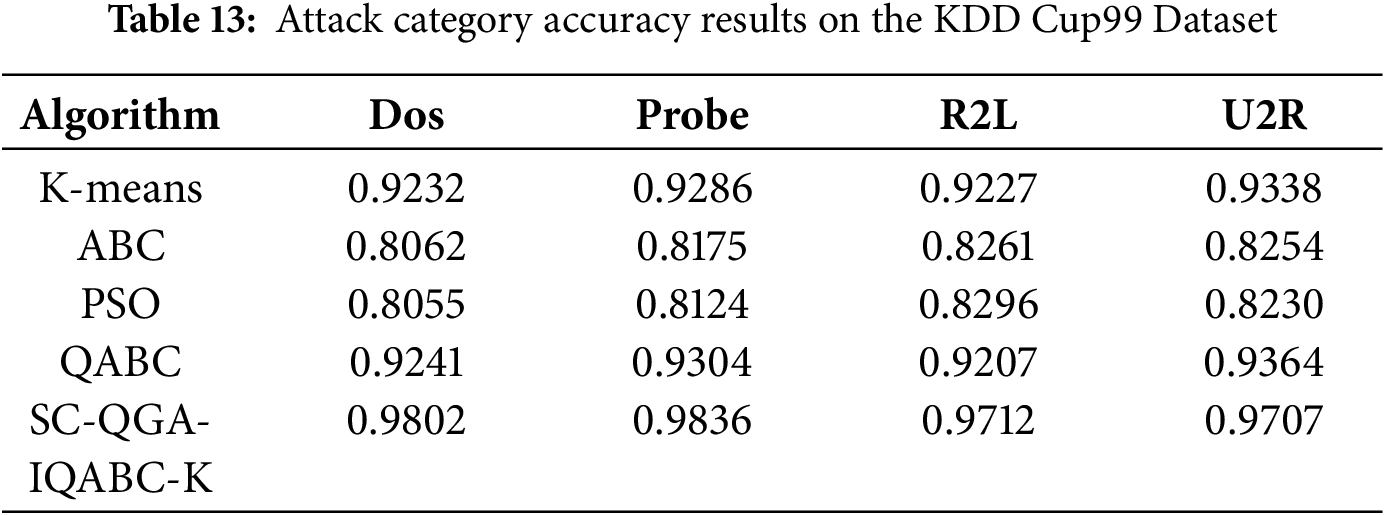
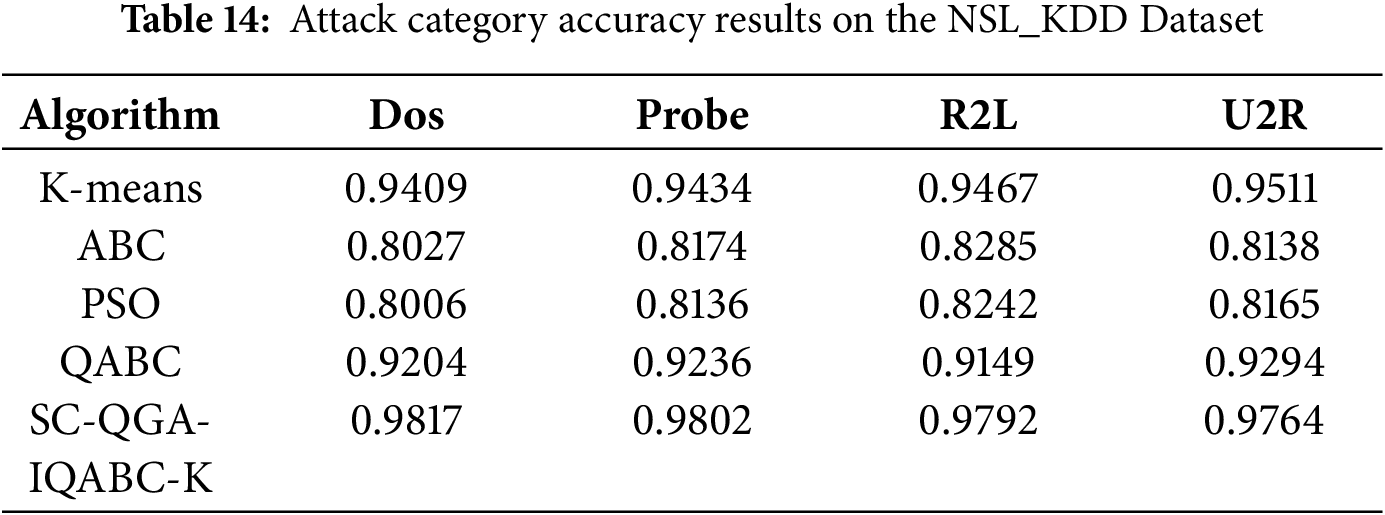
Tables 13 and 14 present detailed accuracy comparison results for the KDD CUP99 and NLS_KDD datasets, classified by attack category (DoS, Probe, R2L, U2R). It can be observed that the SC-QGA-IQABC-K algorithm achieves superior accuracy (exceeding 97% across all categories) compared to all baseline methods, with particularly notable advantages in detecting DoS and Probe attacks, where it achieves over 98% accuracy.
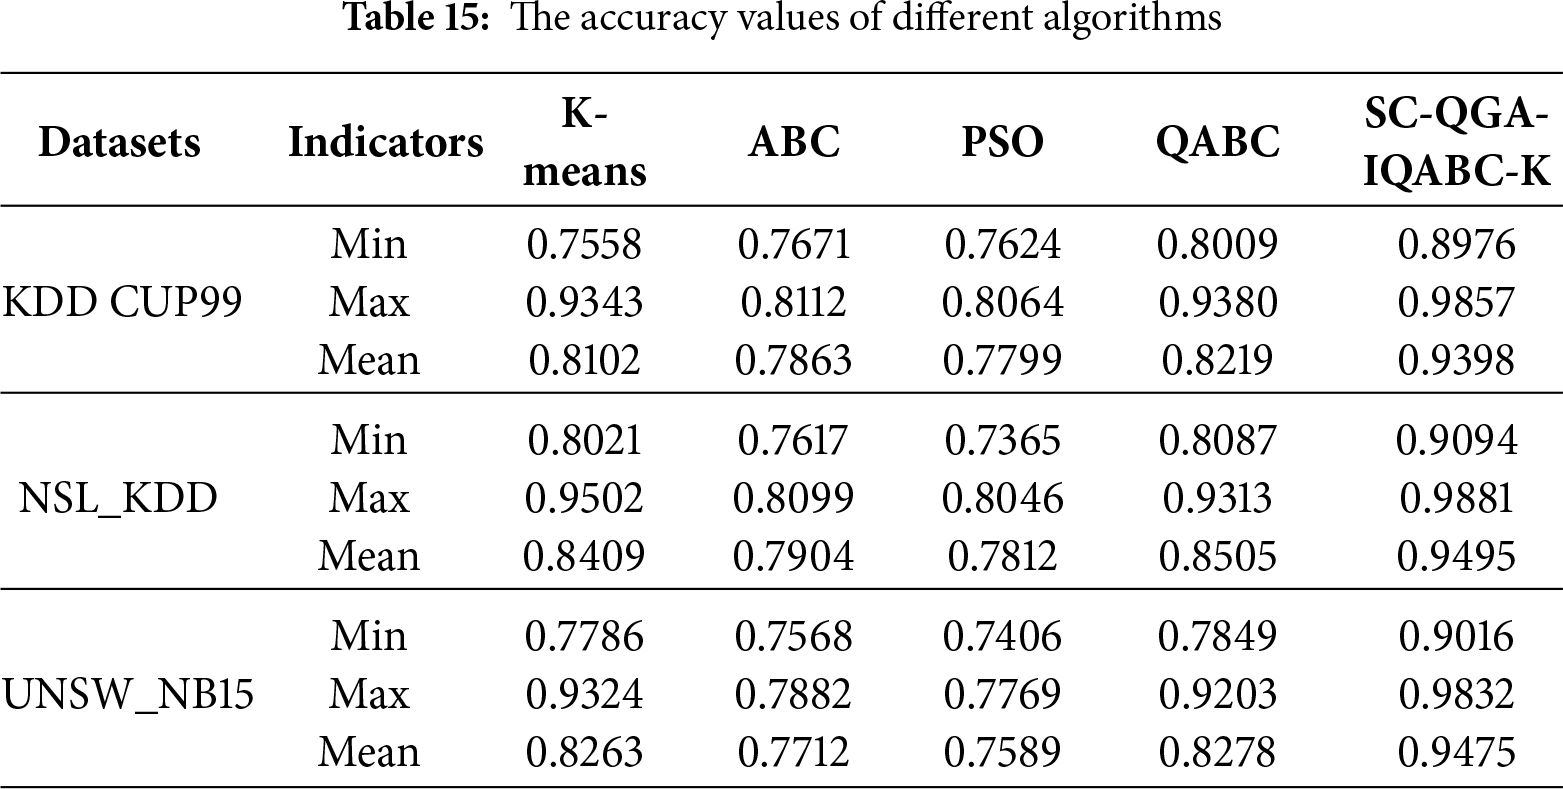
Figs. 7–9 illustrate the accuracy comparisons between the SC-QGA-IQABC-K algorithm and other methods over 50 iterations on the NLS_KDD, UNSW_NB15, and KDD CUP99 datasets. It can be observed that the SC-QGA-IQABC-K algorithm exhibits faster growth in the early stages. To facilitate understanding of the comparative results, Table 15 lists the minimum, maximum, and average values for each method across the three datasets. For the KDD CUP99 dataset, K-means yields the lowest minimum value of 0.7558. However, its maximum and average accuracies are superior to those of the ABC and PSO algorithms and differ from QABC by approximately 1%. In contrast, the SC-QGA-IQABC-K algorithm achieves the best performance across all three areas, including a maximum accuracy of 0.9857. On the NSL_KDD dataset, PSO achieved a minimum accuracy of 0.7365, while SC-QGA-IQABC-K attained a maximum accuracy of 0.9881, outperforming other algorithms by at least 9% in average accuracy. For the UNSW_NB15 dataset, the K-means algorithm achieved a maximum accuracy of 0.9324, second only to the 0.9832 obtained by the SC-QGA-IQABC-K algorithm. However, it was significantly lower than SC-QGA-IQABC-K in terms of both minimum and average values. Overall, the experimental results demonstrate that the SC-QGA-IQABC-K is a suitable and effective method for intrusion detection tasks.
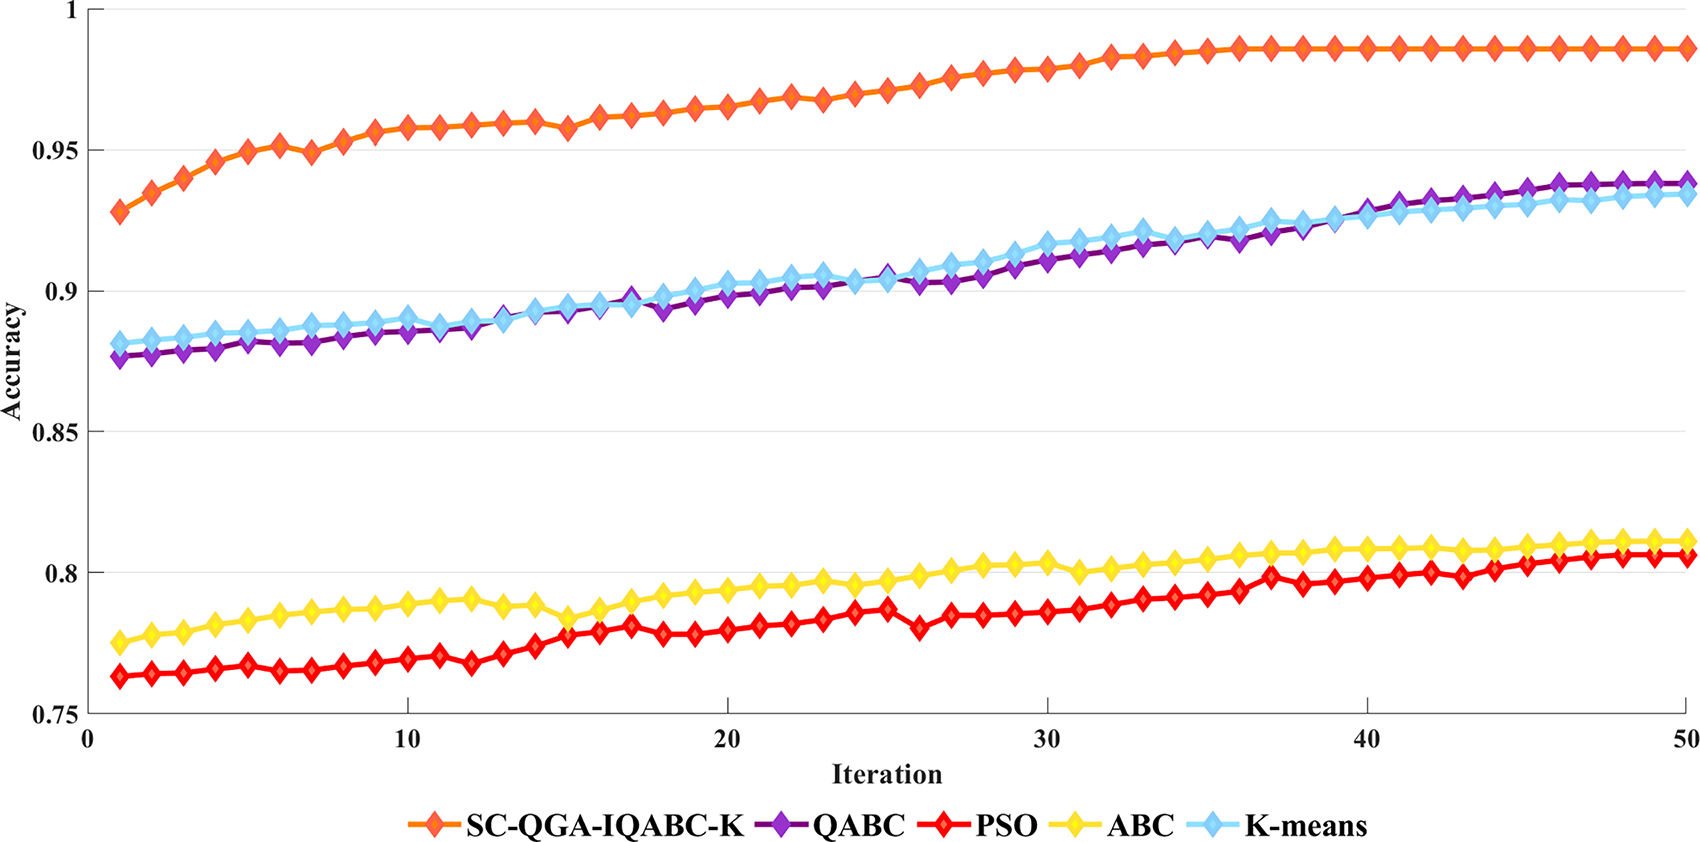
Figure 7: Comparison of Accuracy between SC-QGA-IQABC-K algorithm and different algorithms on KDD CUP99 dataset
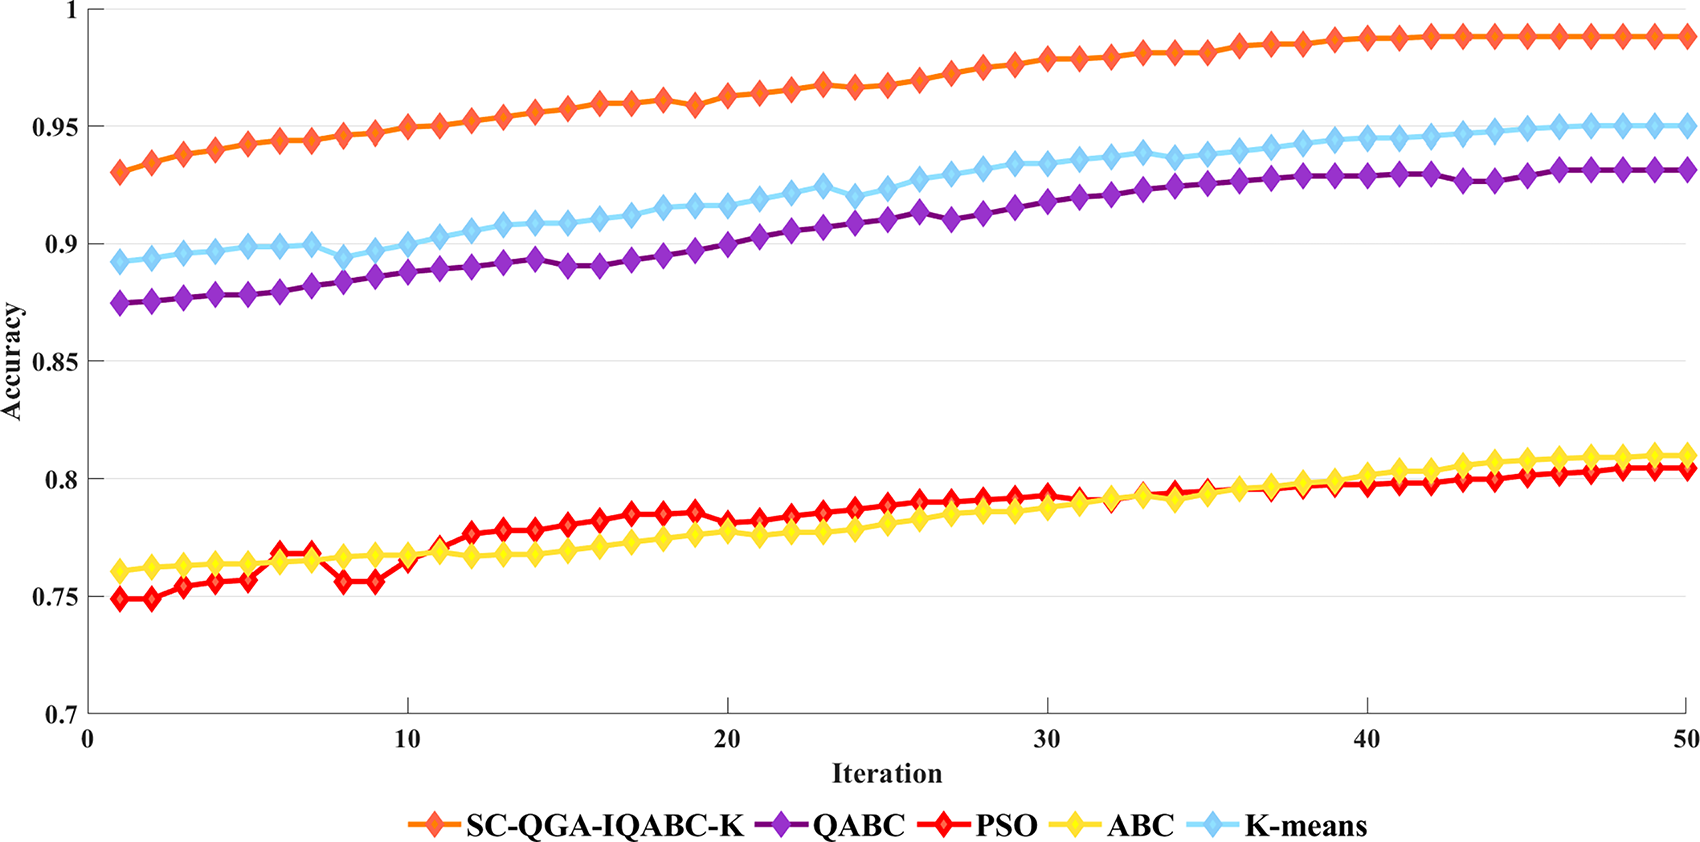
Figure 8: Comparison of Accuracy between SC-QGA-IQABC-K algorithm and different algorithms on NSL_KDD dataset
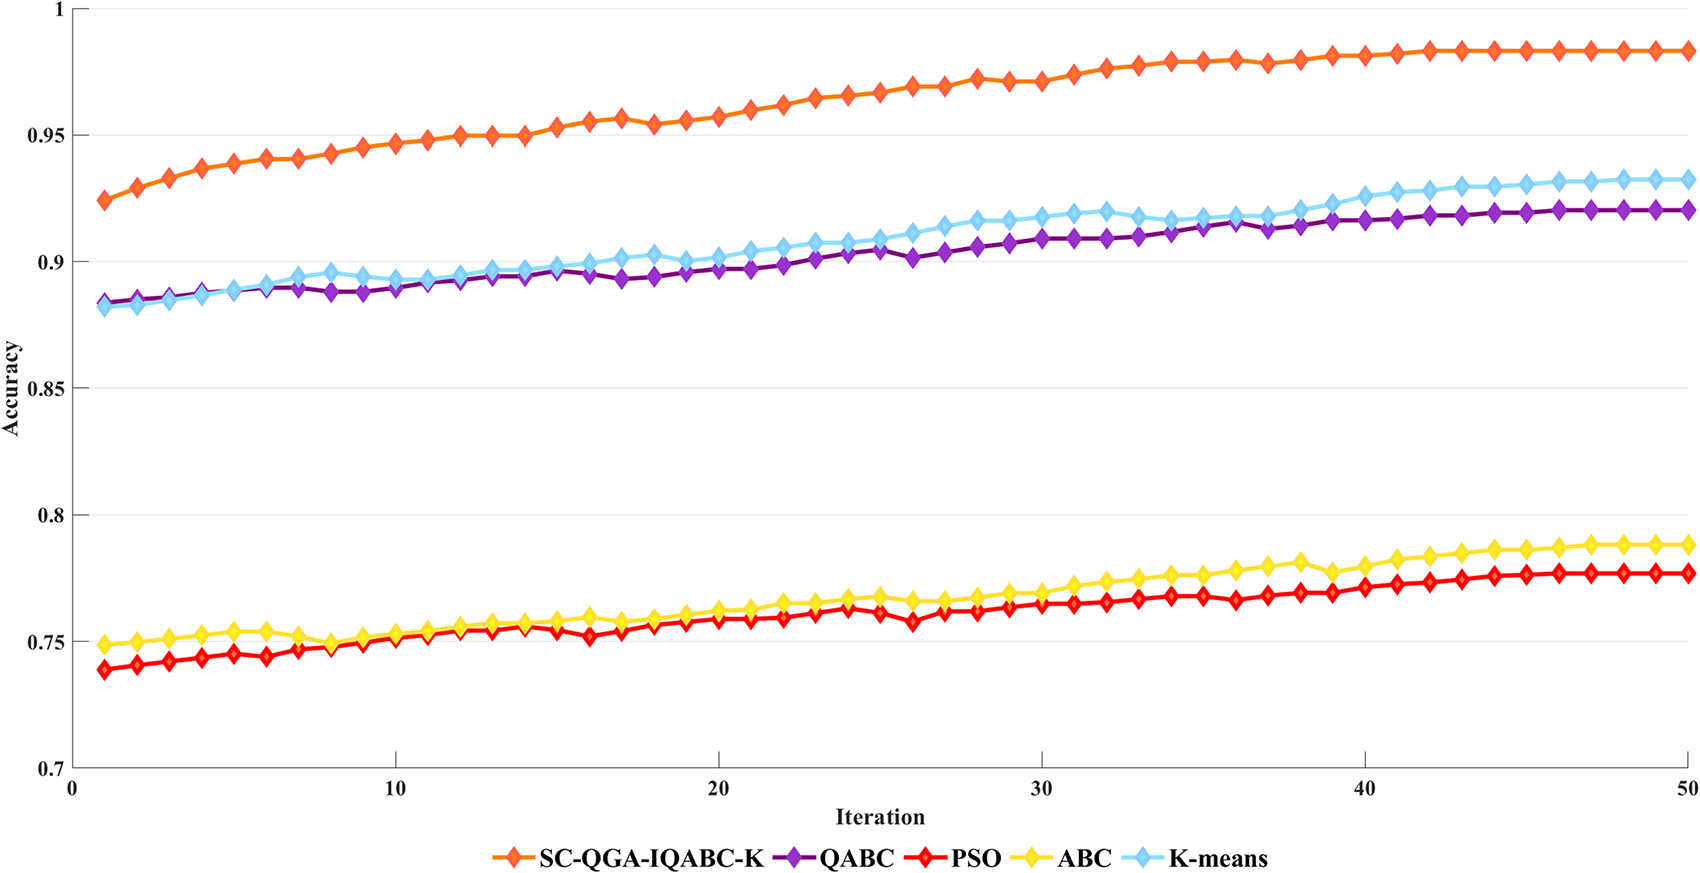
Figure 9: Comparison of Accuracy between SC-QGA-IQABC-K algorithm and different algorithms on UNSW_NB15 dataset
The overall computational complexity of the proposed framework can be analyzed by considering its two major components: the SC-QGA and the IQABC-K. For SC-QGA, each generation evaluates the fitness of N quantum chromosomes across D feature dimensions, leading to a per-iteration cost of
Compared with classical K-means (
This paper proposes a quantum-inspired clustering method designed for clustering analysis and intrusion detection. The proposed method comprises two core components: the SC-QGA algorithm for feature selection and the IQABC-K algorithm for attack detection and clustering. The SC-QGA algorithm leverages similarity coefficient theory to construct a class separability approximation matrix, which is seamlessly integrated into the quantum genetic algorithm to guide feature selection. Optimization is performed through a specially designed adaptive quantum rotation gate, ensuring efficient convergence. The IQABC-K algorithm utilizes quantum encoding to enhance population diversity and improve global exploration. Quantum rotation gates and dynamic adaptive angle updating strategies based on fitness and iteration guide the search toward optimal solutions. Two movement exploitation strategies based on global optimization and symmetric functions strengthen local exploitation, while dynamic adjustments in the scout bee phase further refine solution quality. A linear population reduction strategy improves population quality and reduces computational cost. To evaluate performance, IQABC-K is compared with other nature-inspired algorithms. Results show that IQABC-K achieves faster convergence, higher accuracy, and greater stability, outperforming other algorithms with a standard deviation at least one order lower and achieving a nearly 35% higher minimum AC value on the Iris dataset. Hypothesis-testing statistical analysis also validates the notable advantage of the presented algorithm. Finally, the SC-QGA and IQABC-K algorithms are integrated to form a new attack detection approach, which is applied to experiments using the KDD Cup99, NSL_KDD, and UNSW_NB15 datasets. The experimental results demonstrate that the proposed algorithm outperforms the K-means algorithm by around 3% in both the F1 indicator and maximum detection accuracy, indicating its effectiveness in accurately distinguishing between intrusion and normal data. In summary, the proposed quantum-inspired clustering algorithm performs well in clustering analysis and intrusion detection systems.
It should be noted that the proposed algorithm is a quantum-inspired algorithm rather than a genuine quantum algorithm executed on quantum hardware. In this approach, qubits, superposition, and rotation gates are mathematically simulated on classical computers to improve search diversity and convergence, without involving physical qubit manipulation or quantum entanglement. Real quantum algorithms, in contrast, operate on physical qubits through unitary transformations that exploit quantum coherence and interference. Notably, the qubit representations and rotation operators introduced in this work can be directly translated into parameterized quantum circuits on platforms such as Qiskit or PennyLane, establishing a viable pathway toward hybrid quantum–classical implementations. Furthermore, the feature selection and representation strategies developed here provide a conceptual foundation for designing efficient quantum feature maps—specialized quantum circuits that non-linearly embed classical data into high-dimensional quantum Hilbert spaces. Such embeddings may reveal complex patterns that are difficult to identify using classical methods. As quantum hardware continues to advance in scale and fidelity, replacing the classical simulation components with quantum processing units will become increasingly feasible. Thus, this study not only delivers an effective classical algorithm but also outlines a transition strategy toward quantum-enhanced intrusion detection systems. Future research will explore this integration to utilize genuine quantum parallelism on near-term quantum devices.
Acknowledgement: Not applicable.
Funding Statement: This work is supported by the NSFC (Grant Nos. 62176273, 62271070, 62441212); The Open Foundation of State Key Laboratory of Networking and Switching Technology (Beijing University of Posts and Telecommunications) under Grant SKLNST-2024-1-06; 2025 Major Project of the Natural Science Foundation of Inner Mongolia (2025ZD008).
Author Contributions: Gang Xu: Conceptualization, methodology, validation, writing—original draft preparation; Lefeng Wang: Conceptualization, methodology, software, data curation, writing—original draft preparation; Yuwei Huang: Conceptualization, methodology, data curation, writing—review and editing; Yong Lu: validation, investigation, writing—review and editing; Xin Liu: validation, formal analysis, project administration; Weijie Tan: validation, resources, visualization; Zongpeng Li: formal analysis, investigation, supervision; Xiu-Bo Chen: formal analysis, resources, project administration, funding acquisition. All authors reviewed the results and approved the final version of the manuscript.
Availability of Data and Materials: The data that support the findings of this study are available from the Corresponding Author, Xiu-Bo Chen, upon reasonable request.
Ethics Approval: Not applicable.
Conflicts of Interest: The authors declare no conflicts of interest to report regarding the present study.
References
1. Imrana Y, Xiang Y, Ali L, Abdul-Rauf Z. A bidirectional LSTM deep learning approach for intrusion detection. Expert Syst Appl. 2021;185:115524. doi:10.1016/j.eswa.2021.115524. [Google Scholar] [CrossRef]
2. Kayode Saheed Y, Idris Abiodun A, Misra S, Kristiansen Holone M, Colomo-Palacios R. A machine learning-based intrusion detection for detecting Internet of Things network attacks. Alex Eng J. 2022;61(12):9395–409. doi:10.1016/j.aej.2022.02.063. [Google Scholar] [CrossRef]
3. Wang Z, Li J, Yang S, Luo X, Li D, Mahmoodi S. A lightweight IoT intrusion detection model based on improved BERT-of-Theseus. Expert Syst Appl. 2024;238:122045. doi:10.1016/j.eswa.2023.122045. [Google Scholar] [CrossRef]
4. Lin WC, Ke SW, Tsai CF. CANN: an intrusion detection system based on combining cluster centers and nearest neighbors. Knowl Based Syst. 2015;78:13–21. doi:10.1016/j.knosys.2015.01.009. [Google Scholar] [CrossRef]
5. Hajimirzaei B, Navimipour NJ. Intrusion detection for cloud computing using neural networks and artificial bee colony optimization algorithm. ICT Express. 2019;5(1):56–9. doi:10.1016/j.icte.2018.01.014. [Google Scholar] [CrossRef]
6. Yang Y, Zheng K, Wu C, Niu X, Yang Y. Building an effective intrusion detection system using the modified density peak clustering algorithm and deep belief networks. Appl Sci. 2019;9(2):238. doi:10.3390/app9020238. [Google Scholar] [CrossRef]
7. Liang W, Li KC, Long J, Kui X, Zomaya AY. An industrial network intrusion detection algorithm based on multifeature data clustering optimization model. IEEE Trans Ind Inform. 2020;16(3):2063–71. doi:10.1109/TII.2019.2946791. [Google Scholar] [CrossRef]
8. Jain AK. Data clustering: 50 years beyond K-means. Pattern Recognit Lett. 2010;31(8):651–66. doi:10.1016/j.patrec.2009.09.011. [Google Scholar] [CrossRef]
9. Mahajan M, Nimbhorkar P, Varadarajan K. The planar k-means problem is NP-hard. Theor Comput Sci. 2012;442:13–21. doi:10.1016/j.tcs.2010.05.034. [Google Scholar] [CrossRef]
10. Mavrovouniotis M, Li C, Yang S. A survey of swarm intelligence for dynamic optimization: algorithms and applications. Swarm Evol Comput. 2017;33:1–17. doi:10.1016/j.swevo.2016.12.005. [Google Scholar] [CrossRef]
11. He Q, Wang L. An effective co-evolutionary particle swarm optimization for constrained engineering design problems. Eng Appl Artif Intell. 2007;20(1):89–99. doi:10.1016/j.engappai.2006.03.003. [Google Scholar] [CrossRef]
12. Dorigo M, Maniezzo V, Colorni A. Ant system: optimization by a colony of cooperating agents. IEEE Trans Syst Man Cybern Part B Cybern. 1996;26(1):29–41. doi:10.1109/3477.484436. [Google Scholar] [PubMed] [CrossRef]
13. Akay B, Karaboga D. A modified Artificial Bee Colony algorithm for real-parameter optimization. Inf Sci. 2012;192:120–42. doi:10.1016/j.ins.2010.07.015. [Google Scholar] [CrossRef]
14. Forrest S. Genetic algorithms. ACM Comput Surv. 1996;28(1):77–80. doi:10.1145/234313.234350. [Google Scholar] [CrossRef]
15. Guan T, Wen T, Kou B. Improved lion swarm optimization algorithm to solve the multi-objective rescheduling of hybrid flowshop with limited buffer. J King Saud Univ Comput Inf Sci. 2024;36(5):102077. doi:10.1016/j.jksuci.2024.102077. [Google Scholar] [CrossRef]
16. Al-Khatib RM, Al-qudah NEA, Jawarneh MS, Al-Khateeb A. A novel improved lemurs optimization algorithm for feature selection problems. J King Saud Univ Comput Inf Sci. 2023;35(8):101704. doi:10.1016/j.jksuci.2023.101704. [Google Scholar] [CrossRef]
17. Majhi SK, Biswal S. Optimal cluster analysis using hybrid K-Means and Ant Lion Optimizer. Karbala Int J Mod Sci. 2018;4(4):347–60. doi:10.1016/j.kijoms.2018.09.001. [Google Scholar] [CrossRef]
18. Premkumar M, Sinha G, Ramasamy MD, Sahu S, Subramanyam CB, Sowmya R, et al. Augmented weighted K-means grey wolf optimizer: an enhanced metaheuristic algorithm for data clustering problems. Sci Rep. 2024;14(1):5434. doi:10.1038/s41598-024-55619-z. [Google Scholar] [PubMed] [CrossRef]
19. Song Y, Wu Y, Wu S, Li D, Wen Q, Qin S, et al. A quantum federated learning framework for classical clients. Sci China Phys Mech Astron. 2024;67(5):250311. doi:10.1007/s11433-023-2337-2. [Google Scholar] [CrossRef]
20. Xu G, Xu S, Cao Y, Xiao K, Mao Y, Chen XB, et al. AAQ-PEKS: an attribute-based anti-quantum PublicKey encryption scheme with keyword search for E-healthcare scenarios. Peer Peer Netw Appl. 2025;18(2):64. doi:10.1007/s12083-024-01842-4. [Google Scholar] [CrossRef]
21. Wang Y, Kim JE, Suresh K. Opportunities and challenges of quantum computing for engineering optimization. J Comput Inf Sci Eng. 2023;23(6):060817. doi:10.1115/1.4062969. [Google Scholar] [CrossRef]
22. Li X, Fang W, Zhu S, Zhang X. An adaptive binary quantum-behaved particle swarm optimization algorithm for the multidimensional knapsack problem. Swarm Evol Comput. 2024;86:101494. doi:10.1016/j.swevo.2024.101494. [Google Scholar] [CrossRef]
23. Abdulhussien AA, Nasrudin MF, Darwish SM, Abdi Alkareem Alyasseri Z. Feature selection method based on quantum inspired genetic algorithm for Arabic signature verification. J King Saud Univ Comput Inf Sci. 2023;35(3):141–56. doi:10.1016/j.jksuci.2023.02.005. [Google Scholar] [CrossRef]
24. Gao H, Di Y, Guo L, Zhao L. Joint subchannel power allocation for downlink NOMA systems based on quantum carnivorous plant algorithm. J King Saud Univ Comput Inf Sci. 2024;36(5):102051. doi:10.1016/j.jksuci.2024.102051. [Google Scholar] [CrossRef]
25. Huang Y, Zhou T, Xu G, Wang L, Lu Y, Ma L, et al. A quantum artificial bee colony algorithm based on quantum walk for the 0–1 knapsack problem. Phys Scr. 2024;99(9):095132. doi:10.1088/1402-4896/ad6b55. [Google Scholar] [CrossRef]
26. Zhong HS, Wang H, Deng YH, Chen MC, Peng LC, Luo YH, et al. Quantum computational advantage using photons. Science. 2020;370(6523):1460–3. doi:10.1126/science.abe8770. [Google Scholar] [PubMed] [CrossRef]
27. Chen J, Qi X, Chen L, Chen F, Cheng G. Quantum-inspired ant lion optimized hybrid k-means for cluster analysis and intrusion detection. Knowl Based Syst. 2020;203(1):106167. doi:10.1016/j.knosys.2020.106167. [Google Scholar] [CrossRef]
28. Di Martino F, Sessa S. A novel quantum inspired genetic algorithm to initialize cluster centers in fuzzy C-means. Expert Syst Appl. 2022;191:116340. doi:10.1016/j.eswa.2021.116340. [Google Scholar] [CrossRef]
29. Naik D, Dharavath R, Qi L. Quantum-PSO based unsupervised clustering of users in social networks using attributes. Cluster Comput. 2024:1–19. doi:10.1007/s10586-023-03993-0. [Google Scholar] [PubMed] [CrossRef]
30. Yeung DY, Chang H, Dai G. Learning the kernel matrix by maximizing a KFD-based class separability criterion. Pattern Recognit. 2007;40(7):2021–8. doi:10.1016/j.patcog.2006.12.031. [Google Scholar] [CrossRef]
31. Karaboga D, Basturk B. On the performance of artificial bee colony (ABC) algorithm. Appl Soft Comput. 2008;8(1):687–97. doi:10.1016/j.asoc.2007.05.007. [Google Scholar] [CrossRef]
32. Ralambondrainy H. A conceptual version of the K-means algorithm. Pattern Recognit Lett. 1995;16(11):1147–57. doi:10.1016/0167-8655(95)00075-r. [Google Scholar] [CrossRef]
33. Shelokar PS, Jayaraman VK, Kulkarni BD. An ant colony approach for clustering. Anal Chim Acta. 2004;509(2):187–95. doi:10.1016/j.aca.2003.12.032. [Google Scholar] [CrossRef]
34. Steinley D. Validating clusters with the lower bound for sum-of-squares error. Psychometrika. 2007;72(1):93–106. doi:10.1007/s11336-003-1272-1. [Google Scholar] [CrossRef]
35. Gonzalez TF. Clustering to minimize the maximum intercluster distance. Theor Comput Sci. 1985;38:293–306. doi:10.1016/0304-3975(85)90224-5. [Google Scholar] [CrossRef]
36. Kuhn HW. The Hungarian method for the assignment problem. Naval Research Logistics. 2005;52(1):7–21. doi:10.1002/nav.20053. [Google Scholar] [CrossRef]
Cite This Article
 Copyright © 2026 The Author(s). Published by Tech Science Press.
This work is licensed under a Creative Commons Attribution 4.0 International License , which permits unrestricted use, distribution, and reproduction in any medium, provided the original work is properly cited.
 Downloads
 Citation Tools