
 Login
Login Register
 Submit a Paper
 Propose a Special lssue
 Open Access
ARTICLE
Enabling Bias-Dependent Electronic Morphology Analysis of Single Molecules in STM via Deep Segmentation with Noise-Aware Calibration
1 School of Integrated Circuits and Electronics & Yangtze Delta Region Academy, Beijing Institute of Technology (BIT), Beijing, China
2 Institute of Quantum Materials and Physics, Henan Academy of Sciences, Henan, China
3 CNR-IOM, Istituto Officina dei Materiali, Basovizza SS-14, Km 163.5, Trieste, Italy
* Corresponding Author: Teng Zhang. Email:
Computers, Materials & Continua 2026, 89(2), 22 https://doi.org/10.32604/cmc.2026.083413
Received 03 April 2026; Accepted 23 July 2026; Issue published 15 September 2026
 View Full Text
 Download PDF
Abstract
Scanning tunneling microscopy (STM) images are frequently affected by low-frequency vibrations, substrate-induced background variations, and bias-dependent contrast changes, which degrade molecular feature responses and hinder reliable segmentation. To address this challenge, we develop an STM-oriented Feature Pyramid Network (FPN) + Dual-Path Intensity Calibration (DPIC) framework by adapting a DPIC module, originally derived from a cloud-noise calibration mechanism, to the specific characteristics of STM molecular images. In this framework, DPIC is reformulated as a noise-aware feature calibration module that suppresses low-response background interference while preserving foreground molecular contours. We integrated DPIC into the FPN architecture and systematically evaluated the model on an in-house STM molecular image dataset. Expanded baseline comparisons and image-level five-fold cross-validation were further conducted to assess segmentation performance and stability. The proposed FPN + DPIC model achieved an Intersection over Union (IoU) of 0.8347 ± 0.0073 and a Dice score of 0.9077 ± 0.0050, outperforming representative deep learning, traditional segmentation, and scanning tunneling microscopy (STM)-related comparison methods under the same evaluation protocol. Furthermore, we applied the model to bias-dependent STM images of single 4,4′-Methylenebis(N,N-diphenylaniline) (MTDATA) molecules. By introducing Radial Skewness as a contour-derived geometric descriptor, we quantified the bias-dependent evolution of molecular electronic-state morphology. Statistical correlation analysis further showed that Radial Skewness is negatively associated with the Highest Occupied Molecular Orbital (HOMO)-related spectral response within the measured STM/scanning tunneling spectroscopy (STS) series. This work provides a noise-aware segmentation strategy for the tested MTDATA STM molecular images and demonstrates the potential of segmentation-assisted morphology analysis for quantitative interpretation of bias-dependent STM/STS data under the investigated molecular system and imaging conditions.Keywords
Organic molecular materials such as 4′,4″,4‴-tris(N-3-methylphenyl-N-phenylamino)triphenylamine (m-MTDATA) have been widely investigated as hole-injection and hole-transport materials in organic optoelectronic devices, including organic light-emitting diodes (OLEDs) [1,2]. Beyond their device-level applications, m-MTDATA and its derivatives also provide a useful molecular platform for studying molecule–substrate interactions, interfacial electronic structure, and bias-dependent molecular orbital distributions at surfaces [3–6]. m-MTDATA is a star-shaped tribranched molecule consisting of a central triphenylamine core connected to three N-phenyl-N-(3-methylphenyl)amino substituents (Fig. 1a). Its nonplanar molecular architecture gives rise to rich adsorption configurations and electronic-state distributions on surfaces. Previous spectroscopic and surface-science studies have investigated m-MTDATA on Au(111), electronic-interfaces [3–5]. More recently, STM/STS measurements revealed characteristic adsorption configuration structure modifications from triphenylamine to m-MTDATA, and hybridization states at the molecular of starburst m-MTDATA molecules and identified a HOMO-related resonance near −1.68 V [6]. These studies provide important physical insight into m-MTDATA electronic states; however, the analysis of bias-dependent real-space molecular morphology has largely remained qualitative. Quantitative descriptors that can connect STM image morphology with spectroscopic features are still needed.
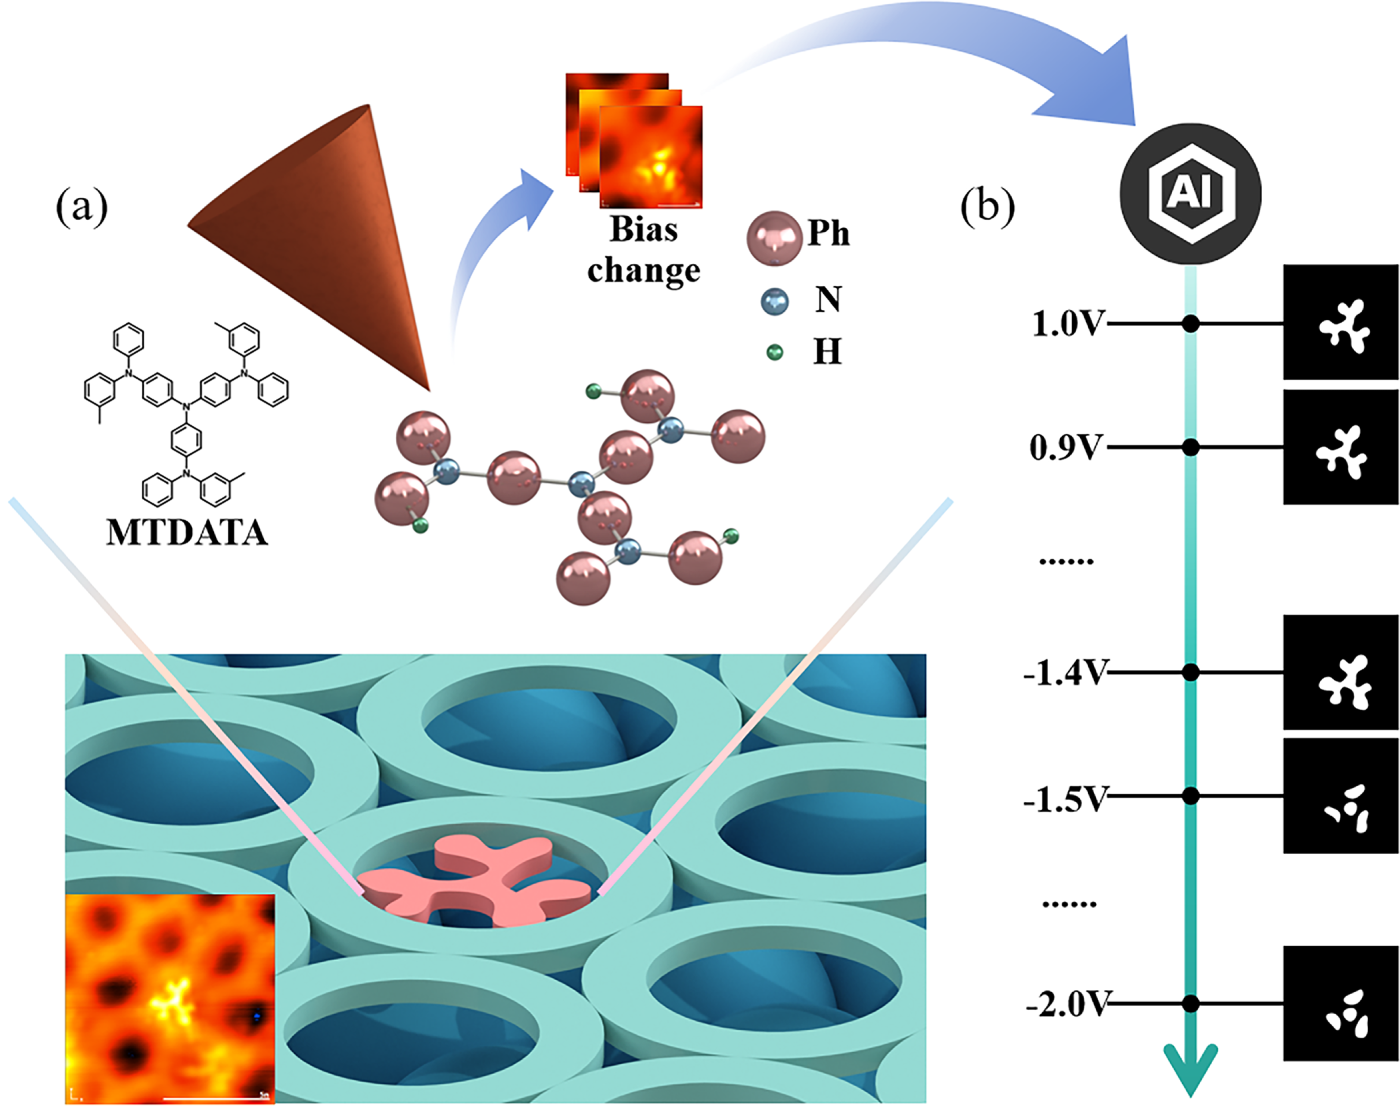
Figure 1: Investigating the electronic-state morphological characteristics of m-MTDATA molecules by combining scanning tunneling microscopy with deep learning-based image segmentation algorithms.
In recent years, “AI for Science” has shown strong potential in microscopy image analysis. Semantic segmentation networks, such as U-Net, can identify object boundaries and extract quantitative features, helping convert visual observations into measurable descriptors. In STM studies, artificial intelligence has also been applied to several tasks. At the preprocessing stage, machine learning has been used for denoising low-signal STM images, such as simulated graphene images [7], and for improving TMD image quality using encoder–decoder networks guided by visual-quality labels [8].
Beyond preprocessing, CNN-based methods have been used to automatically identify atoms and defects [9–11], as well as molecular chirality [12]. Deep learning has also been applied to identifying characteristic states of molecular junctions [13]. STM/SPM image segmentation and molecular recognition have received increasing attention. For example, Bui et al. proposed a variational segmentation method combined with empirical wavelets for STM image segmentation [14]. Zhu et al. developed a deep-learning framework for automated molecule recognition in scanning-probe-microscopy images [15]. Li et al. demonstrated machine-vision-based detection and classification of chiral molecules in molecular imaging [10]. More recently, Kurki et al. introduced an automated structure-discovery framework for STM images [16]. In addition, machine learning has been extended to broader SPM-related tasks, including AFM image analysis of polymer blends [17], interpretable deep-learning-assisted chemical transformations on surfaces [18], and autonomous site-specific atomic-level characterization using AI-equipped scanning probe microscopy [19]. AI-based automation has been used for atom manipulation [20], while deep reinforcement learning has enabled autonomous atom manipulation [21]. Machine learning has also been applied to automated STM tip functionalization [22].
Overall, AI-assisted STM analysis has progressed from image preprocessing to molecular recognition, segmentation, structure analysis, and automated manipulation. However, for low-signal molecular systems affected by complex substrate backgrounds or low-frequency noise, existing deep learning models still struggle to provide segmentation accuracy sufficient for reliable physical interpretation.
To address the limitations of qualitative STM image interpretation, this study develops an STM-oriented FPN + DPIC segmentation framework for molecular contour extraction. Rather than proposing DPIC as a completely new attention operator, we reformulate a noise-aware dual-path intensity calibration mechanism for STM images and integrate it into the Feature Pyramid Network (FPN). The module is designed to suppress low-response substrate/background interference and enhance molecular contour continuity under low signal-to-noise ratio and spatially non-uniform imaging conditions. The proposed FPN + DPIC framework was systematically evaluated on an in-house STM dataset of m-MTDATA molecules and compared with expanded baselines, including representative deep learning models, conventional segmentation methods, and an STM-related molecular recognition framework. Furthermore, the trained model was applied to bias-dependent STM images of single m-MTDATA molecules (Fig. 1b). By introducing Radial Skewness as a contour-derived geometric descriptor, we quantitatively analyzed the voltage-dependent evolution of molecular electronic-state morphology. Radial Skewness decreases near the HOMO onset region and reaches a minimum close to the HOMO-related resonance identified by STS. This trend is further supported by correlation analysis between Radial Skewness and the HOMO-related spectral response. These results suggest that the proposed noise-aware segmentation framework can assist quantitative analysis of STM molecular image features and their relation to underlying electronic properties.
2.1 Image Segmentation Techniques for STM Images
Image segmentation, as a core task in computer vision, enables precise object identification through pixel-level semantic segmentation, serving as a foundational data processing technique in medical imaging, remote sensing monitoring, and industrial inspection. With the leap in scientific imaging resolution, this technology has become pivotal in atomic-scale characterization. In the context of scanning tunneling microscopy (STM), a cornerstone for nanoscale research, image segmentation facilitates the extraction of molecular morphologies with high precision, providing researchers with reproducible geometric parameter quantification to enable objective analysis of microstructures. Derived morphological features can establish quantitative correlations with material physical properties, advancing mechanistic studies of “structure–function” relationships. Furthermore, segmentation results act as standardized inputs for multimodal data fusion, efficiently integrating with spectroscopic and electrical measurements to construct a comprehensive research framework linking “image features–physical properties–functional performance,” thereby bridging the paradigm gap from characterization to mechanistic understanding.
Historically, image segmentation relied heavily on manually crafted mathematical models and heuristic rules rather than data-driven learning. These conventional approaches typically partition images based on low-level visual cues, such as intensity, gradients, and textures, to create homogeneous regions without semantic priors. Common techniques include intensity-based thresholding, clustering, and region-growing, as well as boundary-focused edge detection and watershed algorithms [23]. Despite their utility in standard imaging, these methods remain sensitive to image-quality degradation in STM data, including noise, low contrast, and limited effective resolution [24]. Furthermore, because they lack semantic modeling, conventional methods may struggle to reliably distinguish molecular targets from surface contaminants and defects, limiting their applicability to atomic-scale morphological quantification.
To overcome these limitations, the field has increasingly shifted toward deep learning-based segmentation. These approaches utilize parameter-trainable, end-to-end neural networks to extract semantic features directly from raw pixels, enabling accurate pixel-wise classification. Several core paradigms have driven this progress. Fully convolutional networks (FCNs), for instance, eliminated fully connected layers to facilitate direct spatial predictions [25]. Following this, encoder-decoder architectures like U-Net introduced skip connections to preserve fine-grained morphological details alongside high-level semantic extraction [26]. More recently, multi-scale feature extraction and fusion frameworks, such as Feature Pyramid Networks (FPN) [27] and DeepLab [28], have improved target detection and segmentation across varying scales through hierarchical feature fusion and multi-scale contextual modeling.
Nevertheless, generic segmentation architectures often struggle to cope with the physical intricacies of STM images. The severe degradation in signal-to-noise ratio, combined with spatially non-uniform background interference and bias-dependent feature variations, renders existing models incapable of reliably extracting molecular structures from complex backgrounds.
In summary, advancing quantitative scientific research driven by scanning tunneling microscopy (STM) critically depends on specialized segmentation frameworks. These frameworks must be capable of explicitly modeling imaging noise mechanisms while preserving sub-nanometer structural details. However, current STM image recognition and segmentation algorithms remain constrained by localized adjustments to generic network architectures. They find it challenging to explicitly model the spatially non-uniform noise caused by tunneling current fluctuations and tip effects. Ultimately, this limitation hinders high-fidelity morphology reconstruction and geometric feature extraction at the molecular scale, highlighting the urgent need to develop next-generation, STM-specific segmentation models with physics-aware capabilities.
2.2 STM Noise-Aware FPN Segmentation Model
Drawing inspiration from noise-robust feature calibration techniques in remote sensing, we adapt a Dual-Path Intensity Calibration (DPIC) mechanism and its core component, the Noise Perception Module (NPM), to STM molecular image segmentation and integrate them into a Feature Pyramid Network (FPN) architecture. In this work, DPIC is not treated as a fundamentally new network operator, but as an STM-oriented adaptation of a dual-path feature calibration strategy. The detailed formulation of the adapted DPIC framework is presented in Section 2.3.
As illustrated in Fig. 2a, given a 512 × 512 × 1 STM image, the image is first converted into a tensor and fed into a ResNet-18 encoder to extract multi-level semantic features. ResNet-18 was selected because its residual structure supports stable optimization on relatively small datasets, while its lightweight design helps reduce overfitting and computational cost. This makes it suitable for the limited annotated STM dataset used in this study.
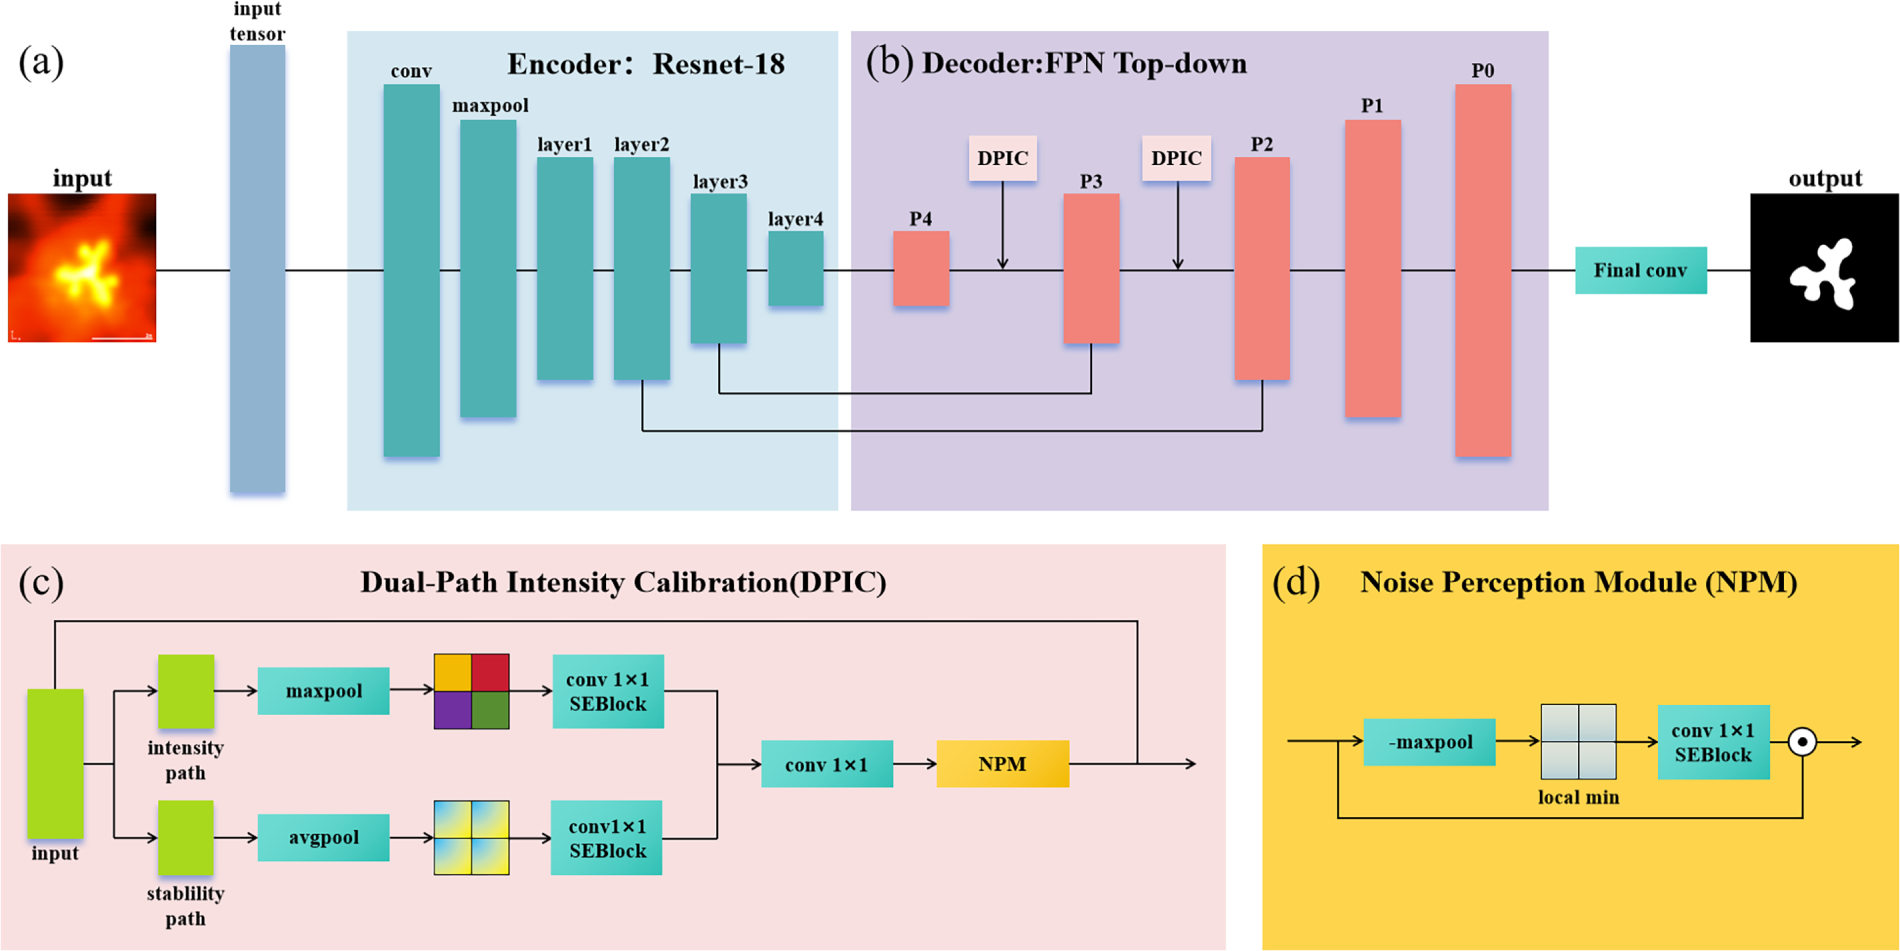
Figure 2: Network architecture overview. The proposed image segmentation network is built upon the Feature Pyramid Network (FPN) framework with ResNet-18 as the backbone, incorporating a Dual-Path Intensity Calibration (DPIC) module adapted for STM molecular segmentation. (a) The ResNet-18 encoder extracts multi-level semantic features. (b) The FPN decoder progressively fuses high-level semantic information and low-level spatial details through a top-down pathway, where DPIC modules are embedded at selected feature-fusion stages to calibrate background-interfered feature responses. (c) Detailed structure of the DPIC module: parallel max-pooling and average-pooling branches are used to capture local peak responses and averaged contextual information, respectively. (d) Structure of the Noise Perception Module (NPM): low-response background-dominated regions are estimated through a minimum-response prior, enabling adaptive feature calibration for suppressing background interference while preserving molecular contour information.
Following the encoding stage, feature maps are extracted from the second, third, and fourth layers of the ResNet-18 backbone, corresponding to downsampling ratios of 1/4, 1/8, and 1/16, respectively. These feature maps are used as lateral inputs to the FPN decoder. As shown in Fig. 2b, the decoder follows a standard top-down FPN design, progressively merging high-level semantic information with lower-level spatial details through upsampling and lateral fusion. To balance segmentation accuracy and computational efficiency, feature fusion is terminated at the P2 level, corresponding to 1/4 input resolution. This design avoids unnecessary high-resolution feature reconstruction at P1 and P0 levels while retaining sufficient spatial detail for STM molecular contour delineation.
The adapted DPIC module is embedded in selected intermediate feature-fusion stages of the FPN decoder. Its NPM component uses a minimum-response prior to estimate low-response, background-dominated feature regions and generates calibration weights to modulate feature responses during decoding. In this way, the model is encouraged to reduce substrate/background interference while preserving molecular contour information. Finally, the high-resolution feature map produced by the decoder is passed through a final convolutional layer to generate the binary segmentation mask of the target molecule.
2.3 Dual-Path Intensity Calibration (DPIC)
Zhang et al. proposed the Noise-Incentive Robust Network (NIRNet) to mitigate the performance degradation of remote sensing object detectors under atmospheric disturbances such as clouds and haze [29]. We observe that STM imaging noise shares certain similarities with cloud/haze noise: the interference is not globally uniform but rather spatially non-uniform, structured, and location-dependent; it does not completely obscure image features—regions with strong responses (e.g., highly activated molecular peaks) typically retain reliable feature signals. Although the physical origins of cloud obscuration and STM noise differ fundamentally, both lead to spatially non-uniform signal degradation, resulting in coexisting reliable foreground regions and unreliable background areas. This necessitates a mechanism capable of dynamically distinguishing “trustworthy” from “untrustworthy” regions and adaptively adjusting feature weights accordingly.
Motivated by this insight, we adapt the DPIC (Dual-Path Intensity Calibration) module from NIRNet to our STM image segmentation task. The architecture of DPIC is illustrated in Fig. 2c. DPIC consists of two parallel pathways: an intensity pathway and a stability pathway. The intensity pathway employs max pooling to extract local peak responses, thereby enhancing the discriminability of high-contrast regions such as molecular boundaries. In contrast, the stability pathway uses average pooling to capture global mean information, which helps suppress background fluctuations and random noise. Both pathways are followed by dedicated 1 × 1 convolutions and Squeeze-and-Excitation (SE) attention modules to refine feature representations. Subsequently, the outputs from the two pathways are fused via another 1 × 1 convolution and fed into the Noise Perception Module (NPM). This process can be mathematically formulated as follows:
In Eq. (1),
The dual-path design strategy based on max pooling and average pooling is a classic feature enhancement mechanism widely used in attention and feature calibration modules [30]. Therefore, we do not claim the pooling operation or SE attention itself as a newly invented component. Instead, in this work, the contribution lies in reformulating this calibration principle for STM molecular images, where low-response feature regions are interpreted as unreliable substrate/noise-dominated responses and calibrated during FPN decoding to improve molecular contour reconstruction.
Fig. 2d illustrates the architecture of the Noise Perception Module (NPM). The goal of NPM is to identify noise-dominated regions by applying a local minimum operation—implemented as negative max pooling (i.e.,
where
In summary, the DPIC module effectively addresses noise in STM images by leveraging the stability pathway to sense substrate undulation noise in low-response regions and the intensity pathway to capture foreground structures in high-response regions. The Noise Perception Module (NPM) then adaptively identifies and suppresses noise regions in the input features. The specific performance and effectiveness of this approach will be detailed in Section 3.1.
2.3.2 STM-Specific Redesign and Physical Interpretation
Although the dual-path calibration strategy is adapted from NIRNet, the present work does not simply transfer the original remote-sensing module to STM images. Instead, DPIC is reformulated for the specific characteristics of low-SNR molecular STM segmentation in three aspects. First, the calibration objective is changed from object-level robustness under cloud/haze-corrupted remote-sensing scenes to pixel-level molecular contour preservation in STM images. This is important because the segmented masks are not only used for IoU and Dice evaluation, but also serve as the basis for contour-derived electronic morphology descriptors such as Radial Skewness. Second, the minimum-response prior in the Noise Perception Module is reinterpreted as an STM-specific reliability prior. In STM images, low-response feature regions often correspond to substrate-induced background undulations, tunneling-current fluctuations, tip-state-related contrast variations, or other low-SNR regions, whereas molecular electronic-state features usually exhibit more spatially coherent responses [31]. Therefore, the NPM is used to suppress unreliable background responses while preserving molecular contours. Third, the module is embedded into the FPN decoding and feature-fusion stages, where high-level semantic features and low-level spatial details are progressively combined. This placement allows background-induced feature ambiguity to be reduced before high-resolution molecular masks are reconstructed. Thus, the novelty of this work does not lie in inventing new pooling or SE-attention operators, but in the STM-specific redesign, physical reinterpretation, and validation of noise-aware feature calibration for molecular STM segmentation and electronic morphology analysis.
2.4 Dataset and Implementation Details
The proposed model was evaluated on an in-house STM molecular image dataset consisting of 369 m-MTDATA images acquired using a low-temperature STM system at 5 K. The dataset covers a bias-voltage range from −2 to +2 V and contains images with different molecular contrasts, substrate-background variations, and bias-dependent electronic-state morphologies. Reference masks were first initialized using K-means clustering and were then manually inspected and corrected according to the visible molecular contrast in the original STM images. The manual correction was performed by several graduate students and PhD students with experience in condensed-matter experiments and STM image interpretation. The corrected masks were further cross-checked by multiple annotators to reduce subjective annotation errors. The correction mainly focused on weak molecular boundary regions, isolated background pixels, and local discontinuities in the molecular contour. No fully independent masks drawn without K-means initialization were used as final training labels in this study. Instead, the K-means-initialized masks were treated only as initial candidates, and the final reference masks were determined after manual correction and multi-person checking. The K-means baseline reported in the experiments was evaluated as an automatic segmentation method against the final manually corrected reference masks, rather than against the initial K-means masks themselves.
To assess annotation reliability and estimate the extent of manual correction, we conducted a random quality audit on 50 reference masks. Among them, 42 masks (84.0%) were accepted without modification, 7 masks (14.0%) required only minor boundary adjustment, and 1 mask (2.0%) required major correction. Thus, 49 of the 50 audited masks (98.0%) did not exhibit major annotation errors. These results suggest that the K-means initialization was generally consistent with the visible molecular regions, while manual correction mainly refined ambiguous low-contrast boundaries and removed occasional background artifacts. Residual annotation uncertainty therefore mainly arises from weak boundary regions rather than from the main molecular body.
All deep learning models were implemented in PyTorch and evaluated using the same image-level five-fold cross-validation protocol. Images and masks were resized to
3.1 Model Performance Analysis
3.1.1 Expanded Baseline Comparison with Five-Fold Cross-Validation
To comprehensively evaluate the segmentation performance of the proposed FPN + DPIC framework, we conducted image-level five-fold cross-validation on the in-house m-MTDATA STM dataset and compared it with a broad set of baseline methods. The comparison includes conventional segmentation methods, general deep learning segmentation networks, lightweight models, Transformer-based models, and an STM-related deep learning method. Specifically, the evaluated methods include Otsu thresholding, K-means clustering, Watershed, Chan–Vese active contour, Mask-R-CNN-STM, U-Net, U-Net++, Attention U-Net, FPN baseline, PSPNet, DeepLabV3, MobileNet-DeepLab, SegFormer, and the proposed FPN + DPIC.
As shown in Table 1, conventional segmentation methods achieved limited performance on the STM molecular images, indicating that simple intensity- or contour-based strategies are insufficient for separating weak molecular structures from substrate-induced background variations. Among deep learning methods, SegFormer and MobileNet-DeepLab achieved relatively strong results, with IoU values of 0.8178 ± 0.0214 and 0.8147 ± 0.0095, respectively. The STM-related Mask-R-CNN-STM baseline also performed competitively, achieving an IoU of 0.8068 ± 0.0080. FPN + DPIC achieved the highest mean IoU across the five cross-validation folds (0.8347 ± 0.0073), together with the highest Dice score (0.9077 ± 0.0050). Compared with the FPN baseline, DPIC improved the IoU from 0.7948 ± 0.0101 to 0.8347 ± 0.0073 and the Dice score from 0.8829 ± 0.0071 to 0.9077 ± 0.0050. FPN + DPIC contained 12.24 M trainable parameters, slightly fewer than the 13.04 M parameters of the FPN baseline, indicating that the performance improvement was achieved without increasing the overall model size. The parameter counts of all deep learning models are reported in Table 1. These results indicate that the proposed noise-aware calibration module improves molecular segmentation accuracy under the same cross-validation protocol.
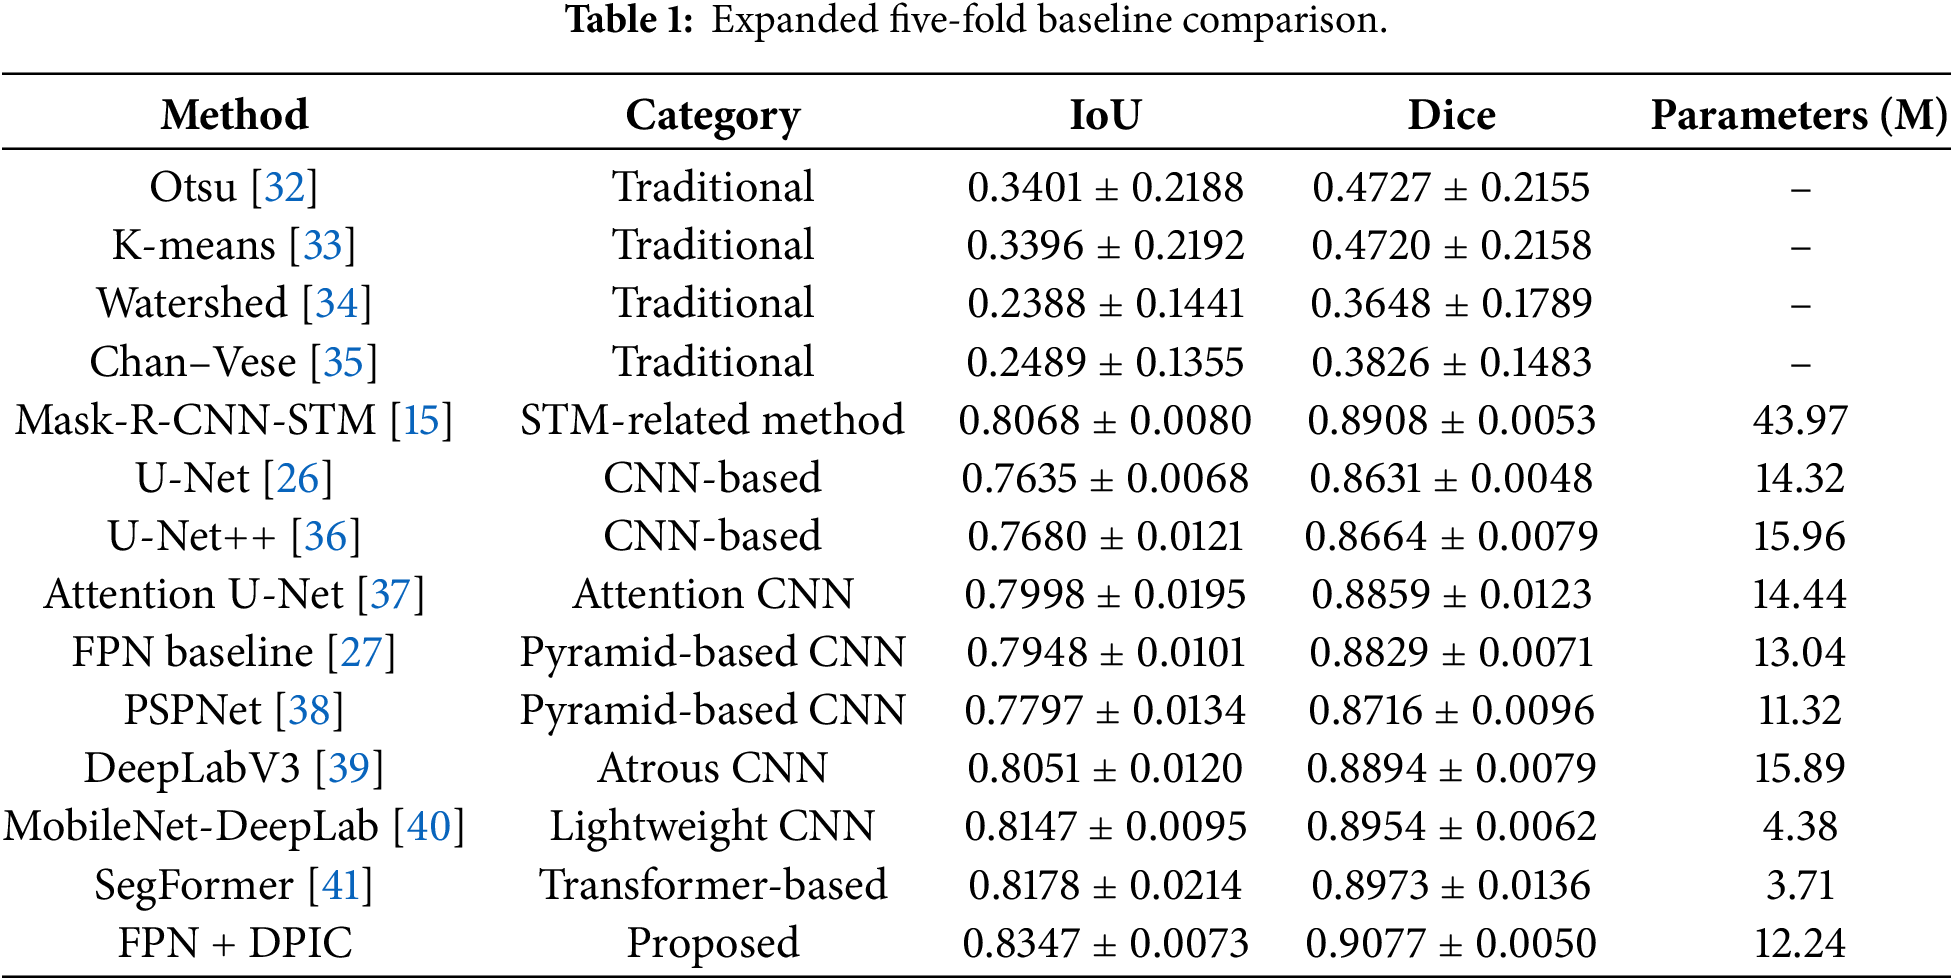
To further assess statistical significance, paired two-sided t-tests were performed on the fold-level IoU values. Compared with MobileNetV3-DeepLab, FPN + DPIC achieved a statistically significant improvement (mean difference = 0.0200, 95% CI: 0.0130–0.0270, p = 0.0014). Compared with SegFormer, FPN + DPIC obtained a higher IoU in all five folds (mean difference = 0.0169), although this difference did not reach statistical significance (p = 0.0849).
Representative qualitative results are shown in Fig. 3, where the segmentation overlays of FPN + DPIC and all comparison methods are visualized on the same fold-1 test sample. In the overlay images, red regions indicate model predictions, green regions indicate reference annotations, and yellow/orange regions indicate the overlap between prediction and ground truth. Compared with conventional segmentation methods and deep learning baselines, the proposed FPN + DPIC model shows a larger overlap with the reference mask and produces more continuous molecular contours, while reducing isolated background responses. These qualitative observations are consistent with the quantitative evaluation in Table 1 and further support the effectiveness of DPIC in improving molecular contour reconstruction under low-contrast STM imaging conditions. Because molecular boundaries in STM images can be visually ambiguous, the overlay comparison is interpreted as qualitative evidence of improved segmentation consistency and background suppression, rather than as proof that the model corrects annotation errors.
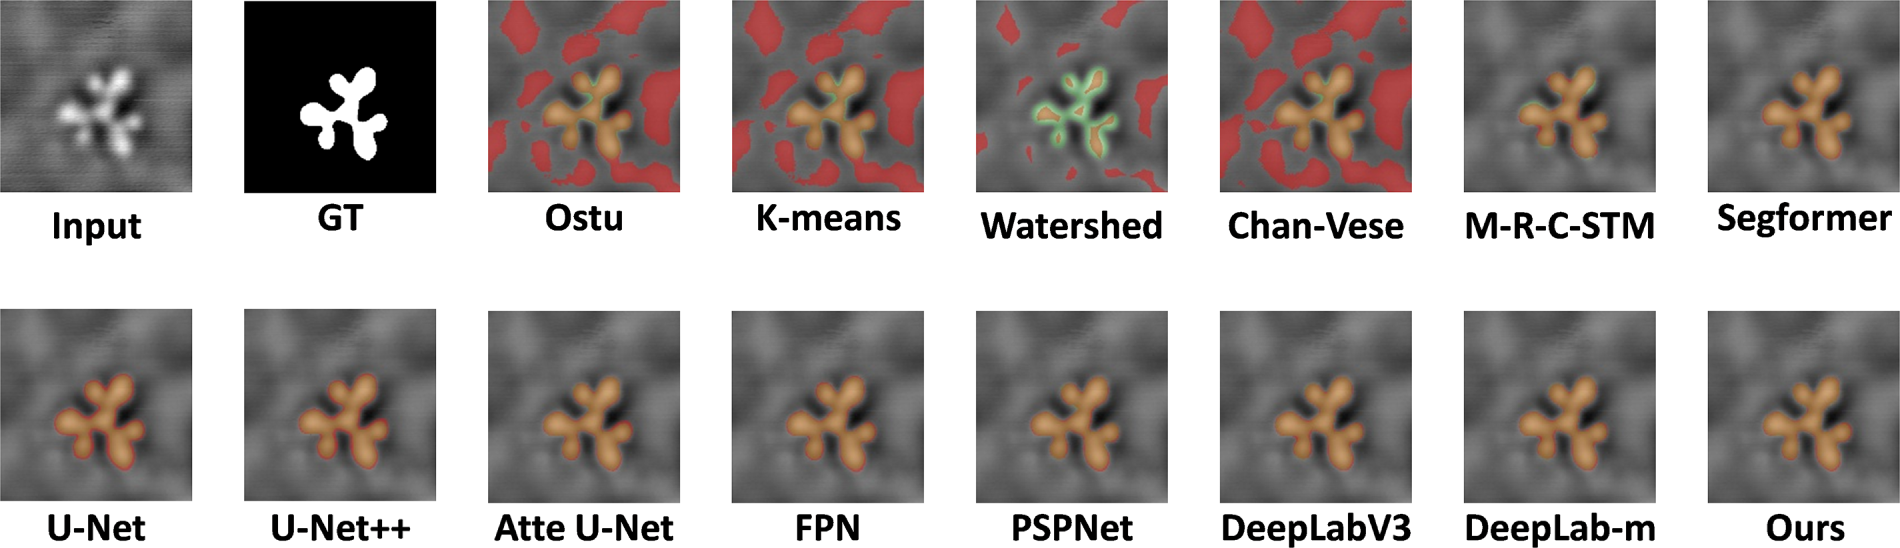
Figure 3: Qualitative overlay comparison of segmentation results on a representative fold-1 test STM image. The displayed methods are arranged from left to right as follows: first row, input STM image, ground-truth mask, Otsu, K-means, Watershed, Chan–Vese, Mask-R-CNN-STM (M-R-C-STM), and SegFormer; second row, U-Net, U-Net++, Attention U-Net, FPN, PSPNet, DeepLabV3, MobileNet-DeepLab (DeepLab-m), and the proposed FPN + DPIC model. In the overlay images, red regions indicate the predicted foreground mask, green regions indicate the reference annotation, and yellow/orange regions indicate the overlap between prediction and ground truth. Compared with the baseline methods, the proposed FPN + DPIC model shows a larger overlap with the reference mask, more continuous molecular contours, and fewer isolated background responses, indicating improved molecular contour reconstruction under low-contrast STM imaging conditions.
3.1.2 Ablation Analysis of DPIC
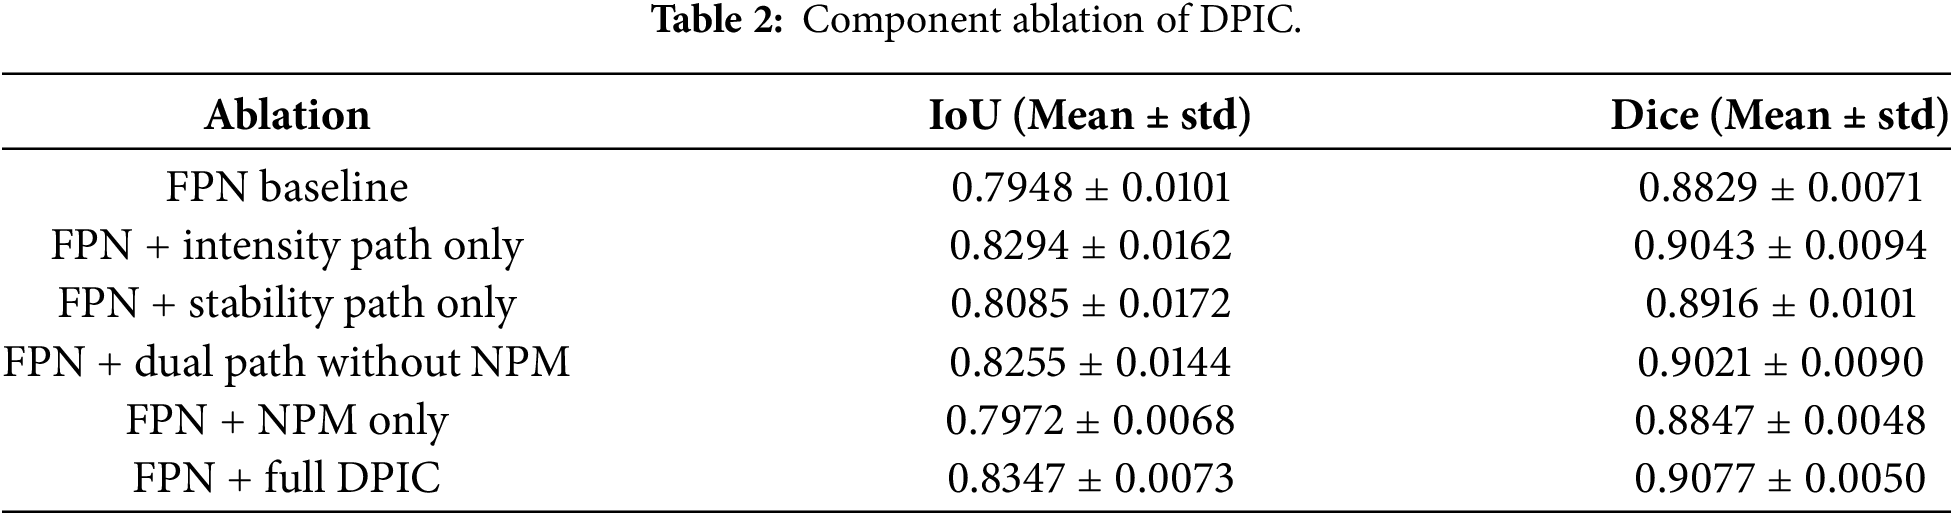
To further clarify the contribution of each component in DPIC, we conducted component-level and insertion-position ablation experiments. The component ablation results are summarized in Table 2. Compared with the FPN baseline, adding only the intensity path increased the IoU from 0.7948 ± 0.0101 to 0.8294 ± 0.0162, suggesting that local high-response features are useful for preserving molecular contours. Adding only the stability path resulted in a smaller improvement, reaching an IoU of 0.8085 ± 0.0172. The dual-path design without NPM achieved an IoU of 0.8255 ± 0.0144, indicating that the combination of local peak responses and averaged contextual information is beneficial for STM feature calibration. However, the full DPIC module achieved the highest performance, with an IoU of 0.8347 ± 0.0073 and a Dice score of 0.9077 ± 0.0050. These results show that the intensity path, stability path, and NPM contribute complementary effects, and that their combination provides the most effective noise-aware calibration.
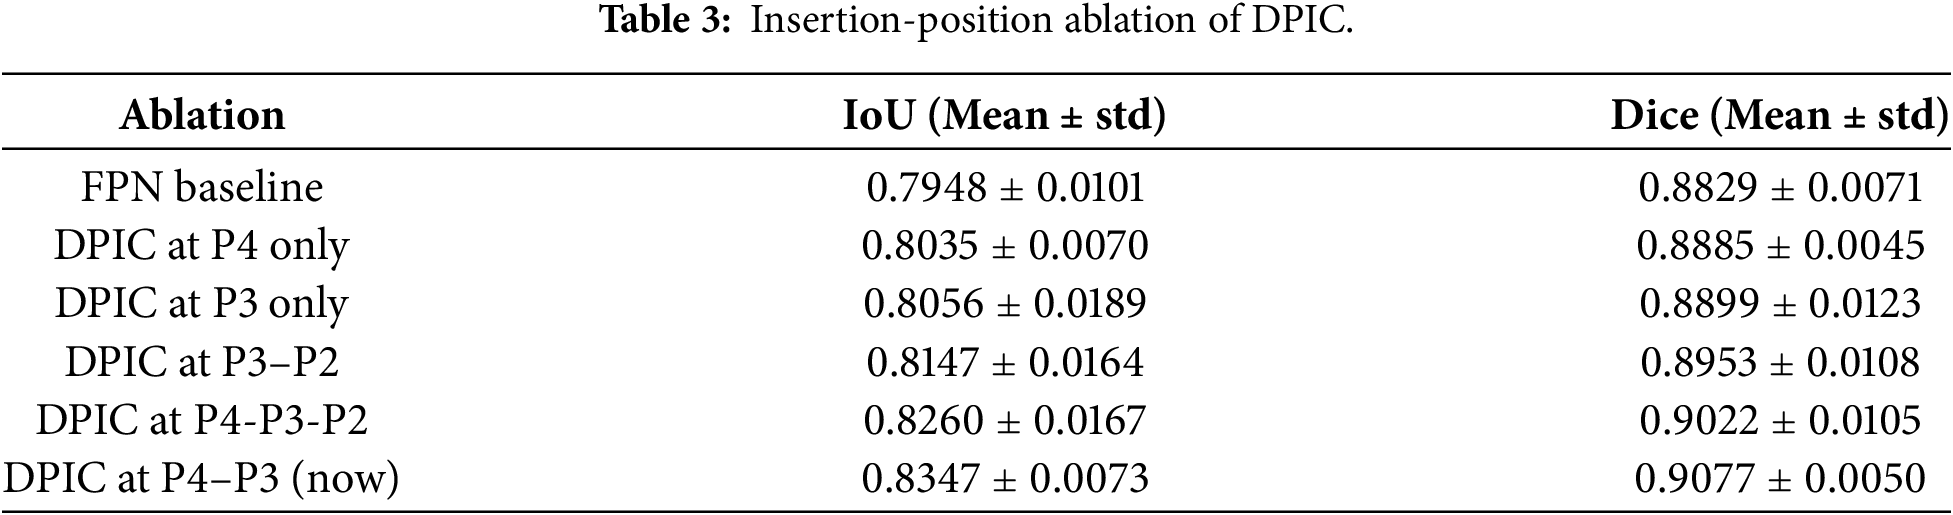
We also evaluated the effect of the DPIC insertion position within the FPN decoding pathway. As shown in Table 3, inserting DPIC at a single level, such as P4 or P3, improved performance only moderately.
3.1.3 External Validation on a WSe2 STM Defect Dataset
Applying DPIC across multiple fusion stages further improved the results. The best performance was obtained when DPIC was inserted at the P4–P3 fusion stages, achieving an IoU of 0.8347 ± 0.0073 and a Dice score of 0.9077 ± 0.0050. This suggests that calibrating features during the intermediate decoding and feature-fusion stages is more effective than applying DPIC only at a single resolution level. The result also supports our STM-specific design choice, where background-induced feature ambiguity is reduced before high-resolution molecular masks are reconstructed.
Feature-response visualization further supports this interpretation. As shown in Fig. 4, the FPN baseline exhibits stronger activations in background regions, especially in areas affected by substrate undulations and weak contrast. After introducing DPIC, the feature responses become more concentrated around molecular structures, while diffuse background activations are reduced. This indicates that DPIC improves the discriminability of molecular foreground features by suppressing unreliable low-response background interference during decoding.
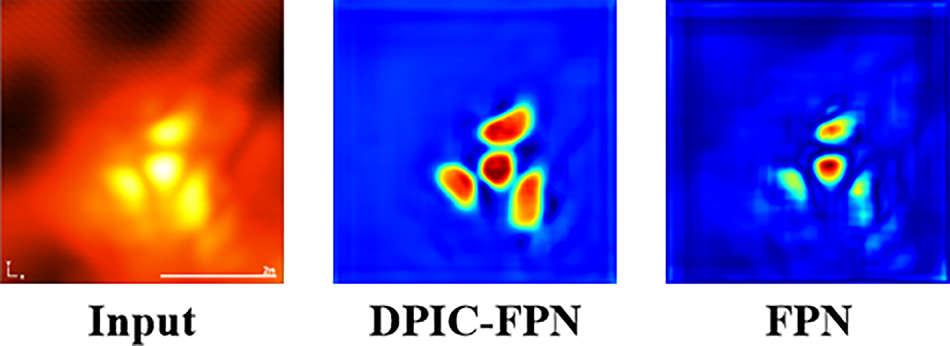
Figure 4: This figure presents the visualization of average responses from the P2-level decoder layer of the FPN architecture in the ablation study. As shown, the response map with the integrated DPIC module is notably cleaner, exhibiting stronger activation and less noise. This demonstrates that the DPIC module effectively enhances the clarity of feature responses and suppresses noise.
To further examine whether the proposed DPIC module provides benefits beyond the in-house m-MTDATA dataset, we performed an auxiliary external validation experiment on a public WSe2 STM defect dataset [42]. This dataset differs from our m-MTDATA molecular dataset in material system and target morphology, and therefore it was not used as a direct replacement for the main benchmark. Instead, it served as an independent STM imaging scenario to test whether DPIC can still improve the FPN baseline under different STM contrast and defect morphology conditions.
As shown in Table 4, FPN + DPIC achieved an IoU of 0.6708 ± 0.0050 and a Dice score of 0.8007 ± 0.0038 on the external WSe2 dataset, while the FPN baseline achieved an IoU of 0.6505 ± 0.0074 and a Dice score of 0.7854 ± 0.0057. These results suggest that the adapted DPIC module may provide useful noise-aware feature calibration in this auxiliary WSe2 STM defect-segmentation setting. However, because the WSe2 dataset differs from the m-MTDATA molecular dataset in both material system and target morphology, this experiment should be regarded as an auxiliary validation under another STM imaging condition rather than as full evidence of general single-molecule morphology extraction.

Overall, the expanded five-fold comparison, component-level ablation, insertion-position analysis, and external validation collectively demonstrate that the performance gain of FPN + DPIC is not solely due to a specific data split or a single baseline selection. Instead, the results support the effectiveness of STM-oriented noise-aware feature calibration for improving molecular or defect segmentation under low-contrast STM imaging conditions.
3.2 Voltage-Modulated Evolution of m-MTDATA Electronic Morphology
Based on the validated segmentation performance of FPN + DPIC, we further explore its practical application in STM data analysis. A major challenge in STM image processing is the spatially varying background induced by substrate undulations, which manifests as low-response regions that are difficult to distinguish from true molecular boundaries using conventional threshold-based methods. The Noise Perception Module (NPM) of the DPIC module directly addresses this challenge by identifying minimum-response priors, enabling the adaptive separation of the substrate background from molecular electronic states. Specifically, the minimum-response prior exploits the fact that substrate undulation regions typically exhibit weaker signal responses compared to molecular electronic state regions, thereby suppressing substrate interference while preserving the complete molecular contour. Thanks to this high-fidelity contour extraction, we can translate the segmented binary mask into a quantifiable geometric descriptor—In this study, we use Radial Skewness because the purpose of the following analysis is not only to measure the total size or regularity of the segmented molecule, but also to evaluate whether the apparent STM morphology shows a bias-dependent redistribution between the molecular center and the peripheral branches. For the star-shaped m-MTDATA molecule, bias-dependent STM contrast may appear as a relative enhancement or suppression of the central region and the outer branches, while the overall area or elongation may change only weakly. Therefore, a descriptor sensitive to the radial distribution of the segmented morphology is needed.
here,
This weighting scheme ensures that the mean radius is biased toward regions of higher spectral intensity, effectively tracing the ‘center of mass’ of the electronic state.
Radial Skewness is defined as the third standardized moment (skewness) of the one-dimensional radial intensity distribution, quantifying the asymmetry of this distribution relative to its mean. Geometrically, it indicates whether the “mass” of the distribution is concentrated closer to the center or skewed toward the periphery. In the context of STM single-molecule images, Radial Skewness effectively characterizes the geometric tendency of the electronic state distribution.
Fig. 5 presents the bias-dependent Radial Skewness analysis and representative segmented molecular morphologies of the same m-MTDATA molecule. Fig. 5a shows the Radial Skewness curve and the corresponding scanning tunneling spectroscopy (STS) spectrum as a function of bias voltage. Radial Skewness was used as a contour-derived geometric descriptor calculated from the segmented molecular masks. Specifically, the descriptor characterizes the skewness of the radial-distance distribution of foreground pixels relative to the molecular centroid, thereby providing a quantitative description of whether the segmented molecular contour is relatively more extended toward the periphery or more concentrated near the center. The shaded band around the Radial Skewness curve represents the 95% within-mask bootstrap confidence interval.
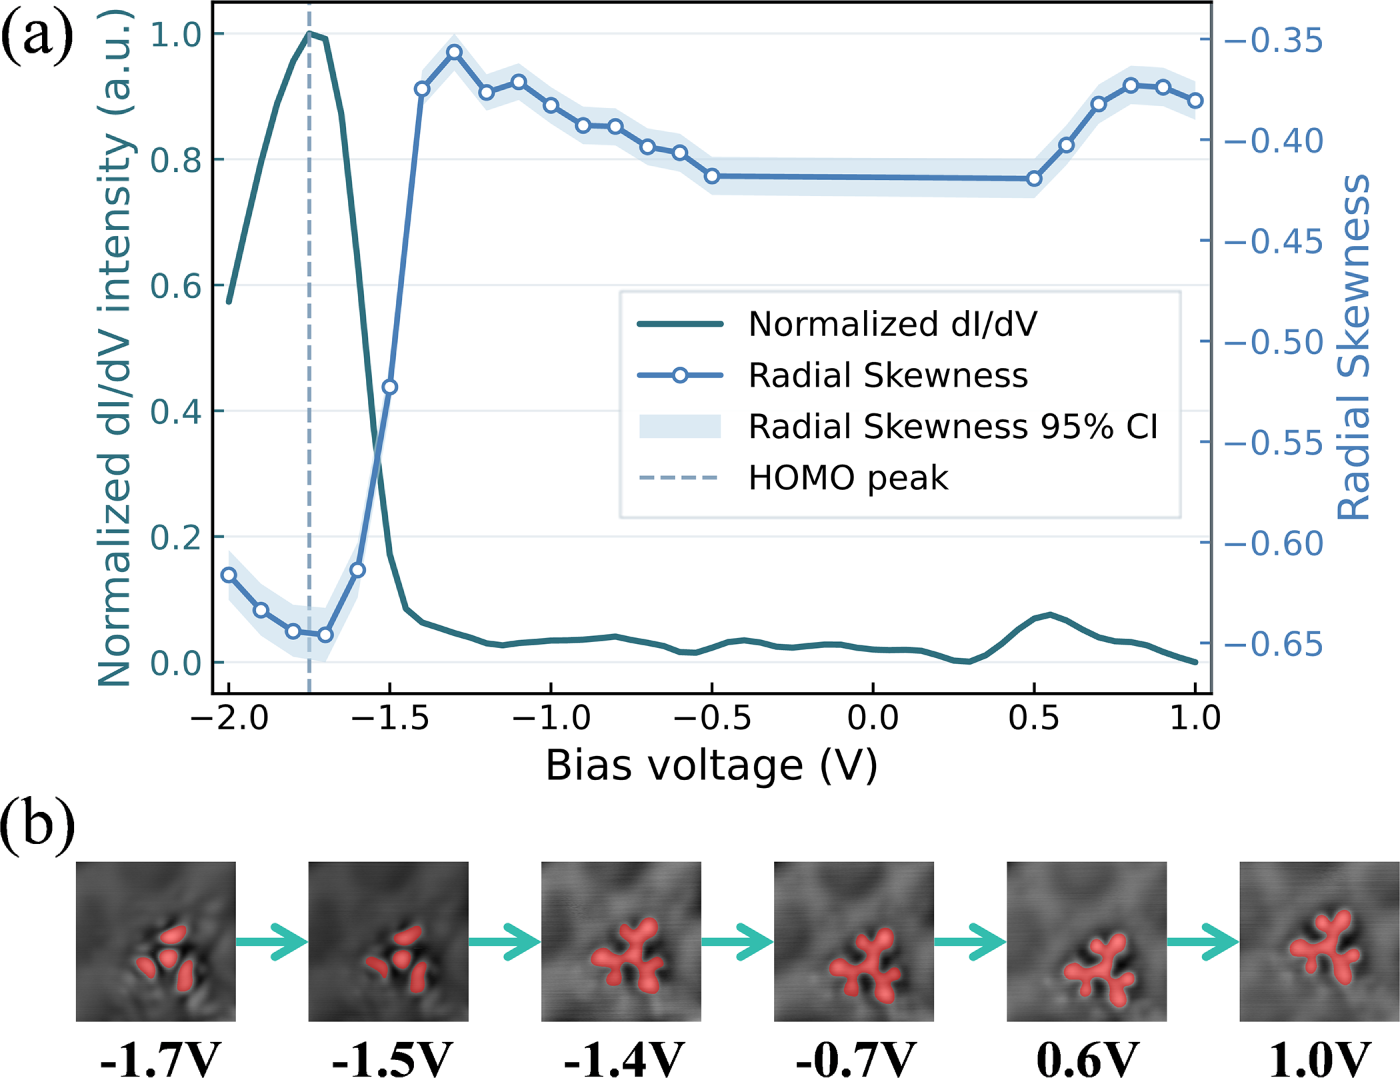
Figure 5: Bias-dependent Radial Skewness analysis of a single m-MTDATA molecule. (a) Normalized dI/dV spectrum and Radial Skewness curve as a function of bias voltage. The shaded region indicates the 95% confidence interval of Radial Skewness, and the dashed line marks the HOMO peak. (b) Representative STM images with segmentation-mask overlays at selected bias voltages, showing the bias-dependent evolution of the molecular contour used for Radial Skewness calculation.
The dashed segment of the Radial Skewness curve corresponds to the molecular bandgap region, where the apparent STM contrast is not dominated by a specific resonant molecular orbital state. Therefore, this region was not included in the subsequent HOMO-related correlation analysis. The quantitative analysis was restricted to the predefined HOMO-related bias window from −2.00 to −1.40 V.
Within this HOMO-related bias window, Radial Skewness exhibits a clear decreasing trend as the HOMO-related STS response increases. The minimum Radial Skewness occurs at approximately −1.70 V, while the HOMO resonance peak identified from the STS spectrum is located at approximately −1.75 V, corresponding to a voltage difference of 0.05 V. This proximity suggests that the extracted contour-derived descriptor is sensitive to the HOMO-related change in the apparent molecular electronic-state morphology within the measured bias series.
To further quantify this relationship, we performed correlation analysis between Radial Skewness and the corresponding STS intensity within the predefined HOMO-related bias window from −2.00 to −1.40 V. The full bias-dependent STM image series contained 22 STM images, and the STS spectrum was sampled at 61 bias points. For the correlation analysis, we used only the STM images within the HOMO-related window, with a bias interval of 0.1 V, resulting in 7 paired data points between Radial Skewness and the corresponding STS response. Because this analysis was based on a limited bias range and a single measured m-MTDATA molecule, the resulting correlation should be interpreted as a morphology-based indication within this specific STM/STS series, rather than direct evidence for a universal electronic-state localization mechanism. Fig. 5b further provides representative segmentation overlays at selected bias voltages of −1.70, −1.50, −1.40, −0.70, 0.60, and 1.00 V. These overlay images visually illustrate the bias-dependent evolution of the segmented molecular contours used for Radial Skewness calculation. Near the HOMO-related negative-bias region, the segmented morphology appears relatively more center-concentrated, whereas at other bias voltages the apparent contour is comparatively more extended or less centrally concentrated. This visual trend is consistent with the quantitative Radial Skewness curve in Fig. 5a. The confidence intervals shown in Fig. 5a represent within-mask bootstrap uncertainty of the Radial Skewness descriptor at each bias voltage, estimated by resampling the foreground-pixel radial-distance distribution within the corresponding segmented mask. Therefore, these intervals reflect the uncertainty of the Radial Skewness descriptor arising from the finite foreground-pixel distribution within each segmented mask, rather than variability across independent molecules or repeated STM measurements.
In this study, we developed an STM-oriented FPN + DPIC framework for noise-aware segmentation of molecular STM images. By reformulating a dual-path feature calibration mechanism for STM imaging characteristics and integrating it into the FPN architecture, the proposed model improves molecular contour reconstruction under substrate-induced background variations and low-SNR imaging conditions. Expanded baseline comparisons and image-level five-fold cross-validation show that FPN + DPIC achieves improved IoU and Dice performance compared with representative conventional segmentation methods, deep learning baselines, and an STM-related molecular recognition framework.
Beyond segmentation performance, we applied the trained model to bias-dependent STM images of single m-MTDATA molecules and introduced Radial Skewness as a contour-derived geometric descriptor. The extracted Radial Skewness showed a statistically supported negative association with the HOMO-related STS response within the measured bias-dependent STM/STS series. This result suggests that segmentation-assisted geometric analysis can provide quantitative support for connecting apparent STM molecular morphology with spectroscopic features.
Several limitations remain. First, although image-level five-fold cross-validation was conducted, the main dataset is still limited to 369 STM images from a specific m-MTDATA molecular system. Therefore, the conclusions of this study should be interpreted mainly within the tested molecular system and the corresponding STM imaging conditions. Second, although the auxiliary WSe2 defect dataset provides an additional STM imaging scenario, it differs from the m-MTDATA dataset in both material system and target morphology, and therefore does not fully validate general single-molecule morphology extraction. Third, although a random annotation quality audit indicated that major annotation errors were rare, weak molecular boundaries in low-SNR STM images may still involve boundary-level uncertainty. Fourth, the relationship between Radial Skewness and the HOMO-related STS response should be interpreted as a statistically supported association within the measured STM/STS series, rather than definitive proof of a universal electronic-state localization mechanism. Future work will extend this framework to larger STM datasets, additional molecular systems, broader imaging conditions, multi-expert annotations, and uncertainty-aware molecular contour analysis.
Acknowledgement: Not applicable.
Funding Statement: This work was supported by the National Key R&D Program of China, grant numbers 2024YFA1611300 and 2021YFA1400103, and the National Natural Science Foundation of China, grant numbers 62271048, 62471038, 12304205, and 92163206.
Author Contributions: The authors confirm contribution to the paper as follows: Conceptualization, Teng Zhang and Yeliang Wang; Methodology, Lingtao Zhan, Jiale Zhu, Quanzheng Zhang, and Huixia Yang; Software, Lingtao Zhan and Jiale Zhu; Validation, Lingtao Zhan and Jiale Zhu; Formal analysis, Lingtao Zhan, Xiaoyu Hao, Tingting Wang, Xiongbai Cao, and Cesare Grazioli; Investigation, Lingtao Zhan, Xiaoyu Hao, and Tingting Wang; Resources, Yeliang Wang and Teng Zhang; Data curation, Lingtao Zhan, Xiaoyu Hao, and Tingting Wang; Writing—original draft preparation, Lingtao Zhan; Writing—review and editing, Lingtao Zhan, Teng Zhang, Yeliang Wang, Xiongbai Cao, Cesare Grazioli, and all other authors; Visualization, Lingtao Zhan; Supervision, Teng Zhang and Yeliang Wang; Project administration, Yeliang Wang and Teng Zhang; Funding acquisition, Yeliang Wang and Teng Zhang. All authors reviewed and approved the final version of the manuscript.
Availability of Data and Materials: The data that support the findings of this study are available from the corresponding author upon reasonable request.
Ethics Approval: Not applicable.
Conflicts of Interest: The authors declare no conflicts of interest.
References
1. Bucinskas A, Bezvikonnyi O, Durgaryan R, Volyniuk D, Tomkeviciene A, Grazulevicius JV. New m-MTDATA skeleton-based hole transporting materials for multi-resonant TADF OLEDs. Phys Chem Chem Phys. 2022;24(45):27847–55. doi:10.1039/d2cp03811k. [Google Scholar] [CrossRef]
2. Kim GW, Lampande R, Choe DC, Bae HW, Kwon JH. Efficient hole injection material for low operating voltage blue fluorescent organic light emitting diodes. Thin Solid Films. 2015;589(7):105–10. doi:10.1016/j.tsf.2015.04.076. [Google Scholar] [CrossRef]
3. Zhang T, Brumboiu IE, Lanzilotto V, Grazioli C, Guarnaccio A, Johansson FOL, et al. Electronic structure modifications induced by increased molecular complexity: from triphenylamine to m-MTDATA. Phys Chem Chem Phys. 2019;21(32):17959–70. doi:10.1039/c9cp02423a. [Google Scholar] [CrossRef]
4. Zhang T, Grazioli C, Guarnaccio A, Brumboiu IE, Lanzilotto V, Johansson FOL, et al. m-MTDATA on Au(111spectroscopic evidence of molecule-substrate interactions. J Phys Chem C. 2022;126(6):3202–10. doi:10.1021/acs.jpcc.1c09574. [Google Scholar] [CrossRef]
5. Zhang T, Wang T, Grazioli C, Guarnaccio A, Brumboiu IE, Johansson FOL, et al. Evidence of hybridization states at the donor/acceptor interface: case of m-MTDATA/PPT. J Phys Condens Matter. 2022;34(21):214008. doi:10.1088/1361-648x/ac5aff. [Google Scholar] [CrossRef]
6. Hao X, Li Y, Zhang T, Niu M, Yang H, Qiao J, et al. Exploring the characteristic “plug-in” configuration of an adsorbed starburst molecule. Phys Chem Chem Phys. 2024;26(36):24151–6. doi:10.1039/d4cp01791a. [Google Scholar] [CrossRef]
7. Joucken F, Davenport JL, Ge Z, Quezada-Lopez EA, Taniguchi T, Watanabe K, et al. Denoising scanning tunneling microscopy images of graphene with supervised machine learning. Phys Rev Mater. 2022;6(12):123802. doi:10.1103/physrevmaterials.6.123802. [Google Scholar] [CrossRef]
8. Zhan LT, Fan HL, Zhang T, Wang TT, Cao XB, Li Y, et al. MAED-CNN: a deep learning model for atomic-scale image denoising. Chin J Vac Sci Technol. 2025;45(8):686–95. (In Chinese). doi:10.13922/j.cnki.cjvst.202503002. [Google Scholar] [CrossRef]
9. Yang SH, Choi W, Cho BW, Agyapong-Fordjour FO, Park S, Yun SJ, et al. Deep learning-assisted quantification of atomic dopants and defects in 2D materials. Adv Sci. 2021;8(16):2101099. doi:10.1002/advs.202101099. [Google Scholar] [CrossRef]
10. Li J, Telychko M, Yin J, Zhu Y, Li G, Song S, et al. Machine vision automated chiral molecule detection and classification in molecular imaging. J Am Chem Soc. 2021;143(27):10177–88. doi:10.1021/jacs.1c03091. [Google Scholar] [CrossRef]
11. Ziatdinov M, Maksov A, Kalinin SV. Learning surface molecular structures via machine vision. npj Comput Mater. 2017;3(1):31. doi:10.1038/s41524-017-0038-7. [Google Scholar] [CrossRef]
12. Seifert TJ, Stritzke M, Kasten P, Möller B, Fingscheidt T, Etzkorn M, et al. Chirality detection in scanning tunneling microscopy data using artificial intelligence. Small Meth. 2024;8(12):2400549. doi:10.1002/smtd.202400549. [Google Scholar] [CrossRef]
13. Fu T, Zang Y, Zou Q, Nuckolls C, Venkataraman L. Using deep learning to identify molecular junction characteristics. Nano Lett. 2020;20(5):3320–5. doi:10.1021/acs.nanolett.0c00198. [Google Scholar] [CrossRef]
14. Bui K, Fauman J, Kes D, Torres Mandiola L, Ciomaga A, Salazar R, et al. Segmentation of scanning tunneling microscopy images using variational methods and empirical wavelets. Pattern Anal Appl. 2020;23(2):625–51. doi:10.1007/s10044-019-00824-0. [Google Scholar] [CrossRef]
15. Zhu Z, Lu J, Zheng F, Chen C, Lv Y, Jiang H, et al. A deep-learning framework for the automated recognition of molecules in scanning-probe-microscopy images. Angew Chem Int Ed. 2022;61(49):e202213503. doi:10.1002/anie.202213503. [Google Scholar] [CrossRef]
16. Kurki L, Oinonen N, Foster AS. Automated structure discovery for scanning tunneling microscopy. ACS Nano. 2024;18(17):11130–8. doi:10.1021/acsnano.3c12654. [Google Scholar] [CrossRef]
17. Paruchuri A, Wang Y, Gu X, Jayaraman A. Machine learning for analyzing atomic force microscopy (AFM) images generated from polymer blends. Digit Discov. 2024;3(12):2533–50. doi:10.1039/D4DD00215F. [Google Scholar] [CrossRef]
18. Wu N, Aapro M, Jestilä JS, Drost R, García MM, Torres T, et al. Precise large-scale chemical transformations on surfaces: deep learning meets scanning probe microscopy with interpretability. J Am Chem Soc. 2025;147(1):1240–50. doi:10.1021/jacs.4c14757. [Google Scholar] [CrossRef]
19. Diao Z, Ueda K, Hou L, Li F, Yamashita H, Abe M. AI-equipped scanning probe microscopy for autonomous site-specific atomic-level characterization at room temperature. Small Meth. 2025;9(1):2400813. doi:10.1002/smtd.202400813. [Google Scholar] [PubMed] [CrossRef]
20. Okuyama J, Diao Z, Yamashita H, Abe M. Integrated AI framework for room-temperature atom manipulation in scanning probe microscopy. Nano Lett. 2025;25(51):17771–7. doi:10.1021/acs.nanolett.5c04982. [Google Scholar] [CrossRef]
21. Chen IJ, Aapro M, Kipnis A, Ilin A, Liljeroth P, Foster AS. Precise atom manipulation through deep reinforcement learning. Nat Commun. 2022;13(1):7499. doi:10.1038/s41467-022-35149-w. [Google Scholar] [CrossRef]
22. Alldritt B, Urtev F, Oinonen N, Aapro M, Kannala J, Liljeroth P, et al. Automated tip functionalization via machine learning in scanning probe microscopy. Comput Phys Commun. 2022;273:108258. doi:10.1016/j.cpc.2021.108258. [Google Scholar] [CrossRef]
23. He J, Ge H, Wang Y. Research review on image segmentation algorithms. Comput Eng Sci. 2009;31(12):58–61. (In Chinese). doi:10.3969/j.issn.1007-130X.2009.12.017. [Google Scholar] [CrossRef]
24. Li RT, Wijerathna S, Zhang Y. Breaking the limits of scanning tunneling microscopy using image super resolution. In: Proceedings of the 2023 International Conference on Machine Learning and Applications (ICMLA); 2023 Dec 15–17; Jacksonville, FL, USA. p. 1138–43. doi:10.1109/ICMLA58977.2023.00170. [Google Scholar] [CrossRef]
25. Shelhamer E, Long J, Darrell T. Fully convolutional networks for semantic segmentation. IEEE Trans Pattern Anal Mach Intell. 2017;39(4):640–51. doi:10.1109/tpami.2016.2572683. [Google Scholar] [CrossRef]
26. Ronneberger O, Fischer P, Brox T. U-Net: convolutional networks for biomedical image segmentation. In: Proceedings of the Medical Image Computing and Computer-Assisted Intervention—MICCAI 2015; 2015 Oct 5–9; Munich, Germany. p. 234–41. doi:10.1007/978-3-319-24574-4_28. [Google Scholar] [CrossRef]
27. Lin TY, Dollar P, Girshick R, He K, Hariharan B, Belongie S. Feature pyramid networks for object detection. In: Proceedings of the 2017 IEEE Conference on Computer Vision and Pattern Recognition (CVPR); 2017 Jul 21–26; Honolulu, HI, USA. p. 936–44. doi:10.1109/cvpr.2017.106. [Google Scholar] [CrossRef]
28. Chen LC, Papandreou G, Kokkinos I, Murphy K, Yuille AL. DeepLab: semantic image segmentation with deep convolutional nets, atrous convolution, and fully connected CRFs. IEEE Trans Pattern Anal Mach Intell. 2018;40(4):834–48. doi:10.1109/TPAMI.2017.2699184. [Google Scholar] [CrossRef]
29. Zhang P, Cheng G, Lang C, Xie X, Han J. NIRNet: noise incentive robust network in remote sensing object detection under cloud corruption. IEEE Trans Geosci Remote Sens. 2025;63:5629713–13. doi:10.1109/TGRS.2025.3581342. [Google Scholar] [CrossRef]
30. Woo S, Park J, Lee JY, Kweon IS. CBAM: convolutional block attention module. In: Proceedings of the Computer Vision—ECCV 2018; 2018 Sep 8–14; Munich, German. p. 3–19. doi:10.1007/978-3-030-01234-2_1. [Google Scholar] [CrossRef]
31. Ge JF, Ovadia M, Hoffman JE. Achieving low noise in scanning tunneling spectroscopy. Rev Sci Instrum. 2019;90(10):101401. doi:10.1063/1.5111989. [Google Scholar] [CrossRef]
32. Otsu N. A threshold selection method from gray-level histograms. IEEE Trans Syst Man Cybern. 1979;9(1):62–6. doi:10.1109/TSMC.1979.4310076. [Google Scholar] [CrossRef]
33. MacQueen J. Some methods for classification and analysis of multivariate observations. In: Proceedings of the 5th Berkeley Symposium on Mathematical Statistics and Probability; 1965 Jun 21–Jul 18, 1966 Dec 27–Jan 7; Berkeley, CA, USA. [Google Scholar]
34. Vincent L, Soille P. Watersheds in digital spaces: an efficient algorithm based on immersion simulations. IEEE Trans Pattern Anal Mach Intell. 1991;13(6):583–98. doi:10.1109/34.87344. [Google Scholar] [CrossRef]
35. Chan TF, Vese LA. Active contours without edges. IEEE Trans Image Process. 2001;10(2):266–77. doi:10.1109/83.902291. [Google Scholar] [CrossRef]
36. Zhou Z, Siddiquee MM R, Tajbakhsh N, Liang J. UNet++: a nested U-Net architecture for medical image segmentation. In: Proceedings of the Deep Learning in Medical Image Analysis and Multimodal Learning for Clinical Decision Support; 2018 Sep 20; Granada, Spain. [Google Scholar]
37. Oktay O, Schlemper J, Folgoc LL, Lee M, Heinrich M, Misawa K, et al. Attention U-Net: learning where to look for the pancreas. arXiv:1804.03999. 2018. [Google Scholar]
38. Zhao H, Shi J, Qi X, Wang X, Jia J. Pyramid scene parsing network. In: Proceedings of the IEEE Conference on Computer Vision and Pattern Recognition; 2017 Jul 21–26; Honolulu, HI, USA. [Google Scholar]
39. Chen LC, Papandreou G, Schroff F, Adam H. Rethinking atrous convolution for semantic image segmentation. arXiv:1706.05587. 2017. [Google Scholar]
40. Howard A, Sandler M, Chen B, Wang W, Chen LC, Tan M, et al. Searching for MobileNetV3. In: Proceedings of the 2019 IEEE/CVF International Conference on Computer Vision (ICCV); 2019 Oct 27–Nov 2; Seoul, Republic of Korea. p. 1314–24. doi:10.1109/iccv.2019.00140. [Google Scholar] [CrossRef]
41. Xie E, Wang W, Yu Z, Anandkumar A, Alvarez JM, Luo P. SegFormer: simple and efficient design for semantic segmentation with transformers. Adv Neural Inf Process Syst. 2021;34:12077–90. [Google Scholar]
42. Smalley D, Lough SD, Holtzman LN, Holbrook M, Hone JC, Barmak K, et al. Determining the density and spatial descriptors of atomic scale defects of 2H-WSe2 with ensemble deep learning. APL Mach Learn. 2024;2(3):036104. doi:10.1063/5.0195116. [Google Scholar] [CrossRef]
Cite This Article
 Copyright © 2026 The Author(s). Published by Tech Science Press.
This work is licensed under a Creative Commons Attribution 4.0 International License , which permits unrestricted use, distribution, and reproduction in any medium, provided the original work is properly cited.
 Downloads
 Citation Tools
