
 Login
Login Register
 Submit a Paper
 Propose a Special lssue
 Open Access
ARTICLE
Explainable Anomaly Scoring for Ethereum Multisignature Transactions Using Temporal Validation and LightGBM
1 Department of Computer Science, The Islamia University of Bahawalpur, Bahawalpur, Pakistan
2 Department of Information Systems, College of Computer Science and Information Technology, King Faisal University, Al-Ahsa, Saudi Arabia
3 Department of Information Sciences, University of Education, Multan Campus, Lahore, Pakistan
4 Department of Computer Engineering, College of Computer Science and Information Technology, King Faisal University, Al-Ahsa, Saudi Arabia
* Corresponding Authors: Humaira Arshad. Email: ; Sajid Iqbal. Email:
(This article belongs to the Special Issue: Advanced Security and Privacy in Blockchain Systems)
Computers, Materials & Continua 2026, 89(2), 23 https://doi.org/10.32604/cmc.2026.084774
Received 29 April 2026; Accepted 22 June 2026; Issue published 15 September 2026
 View Full Text
 Download PDF
Abstract
Multisignature (multisig) wallets are fundamental to institutional-grade asset security on the Ethereum blockchain, yet Security Operations Centers (SOCs) currently rely on manual threshold rules to flag anomalous executions. Existing anomaly detection approaches suffer from three methodological deficiencies: (i) reliance on random train-test splits that leak future information, (ii) inclusion of post-hoc execution features unavailable at prediction time, and (iii) absence of cross-architectural benchmarking to justify algorithmic choices. This paper addresses all three gaps through a rigorous LightGBM-based framework that automates and explains SOC heuristics. We frame anomaly detection as post-execution forensic triage, where the model analyzes completed transactions to prioritize SOC alerts. Features including internal_calls and log_count are execution-receipt fields available within seconds of finality, enabling near-real-time operational scoring but not pre-submission prevention. Anomaly labels are operational heuristics calibrated to known execution-complexity signatures; the model learns multivariate interactions beyond these univariate thresholds, as validated by two-level ablation (96.8% AUC retained without gas_limit; 77.2% AUC without all execution features) and prediction-rule correlation analysis (r < 0.6). The framework integrates block-height temporal validation, systematic five-category leakage prevention, and benchmarking against graph neural networks (GraphSAGE, GAT) and deep learning (MLP). The model achieves ROC-AUC 0.9971 (95% CI: 0.9961–0.9980) and F1-Score 0.9739 (95% CI: 0.9691–0.9784), with MCC 0.9690 (95% CI: 0.9638–0.9740), outperforming GraphSAGE (0.9824), GAT (0.9415), and MLP (0.9657) while maintaining 11.5× faster inference than GraphSAGE (0.21 vs. 2.40 ms per transaction).Keywords
Decentralized finance (DeFi) has transformed the financial sector with transparent and tamper-proof peer-to-peer transactions through blockchain technology [1]. Ethereum, the most popular smart contract platform, is at the core of this ecosystem. The protection of digital assets is crucial for institutional investors, decentralized autonomous organizations (DAOs) and protocols with significant digital asset balances. Multisignature (multisig) wallets, especially the de facto industry standard Gnosis Safe, have become an important primitive [2]. These wallets ensure that transactions need to be approved by M-of-N signators, spreading trust and eliminating single points of failure associated with private key exposure.
While securely designed, the smart contracts’ operational logic and Ethereum’s interaction patterns create operational anomalies that need to be monitored. Deviations in transaction patterns—such as unexpected gas usage, unnatural call depth, or a strange calldata pattern—may highlight misconfiguration or operational mistakes, or even signatures of known attacks. These anomalies pose a security challenge for Security Operations Centers (SOCs), which still use fixed, hand-tuned thresholds to detect suspicious multisig transactions. The over $600 million compromised multisig wallet attack on the Ronin Network bridge and the 100 million Harmony Horizon Bridge attack demonstrate the devastating consequences of failing to detect anomalous executions [3,4].
Traditional security audits, while indispensable, are static and periodic. They cannot provide the continuous, automated screening required for high-volume multisig operations. A promising complementary approach is to use machine learning (ML) to score and filter anomalous executions. Rather than replace human analysts, ML can automate the tedious effort of applying heuristics that reflect execution complexity (e.g., sudden spikes in gas, abnormal call depth) and explain the basis for a transaction being an outlier. This converts blockchain data into actionable SOC alerts with feature justifications. But working with blockchain data for ML is no small task, with data leakage being the most common challenge.
We explicitly frame this work as automating SOC execution-complexity heuristics rather than discovering novel attack signatures. The anomaly labels are operational thresholds calibrated to execution patterns historically associated with exploits (e.g., elevated gas consumption in reentrancy attacks, abnormal internal call depth in flash-loan schemes). The model’s contribution lies in learning multivariate interactions across these heuristics—e.g., gas_limit × internal_calls × temporal patterns—that univariate thresholds cannot capture. We verify this through two-level ablation (Section 4.5) showing that the model retains 96.8% of its AUC (0.9678 vs. 0.9971) when gas_limit is removed entirely, and the correlation between model-predicted probabilities and the dominant univariate labeling rule (gas_limit > 3 MAD) is r < 0.6, confirming that predictions diverge substantially from simple threshold reproduction.
Tashman [5] similarly emphasized that out-of-sample testing is indispensable for valid forecast evaluation, a principle we extend to block-height partitioning. Block-height-based partitioning ensures realistic evaluation by enforcing temporal ordering, a practice we adopt and extend for blockchain transactions.
In the context of blockchain, leakage occurs when features used for scoring contain information that would not be available at the time of decision-making. A prevalent form of leakage is the inclusion of post-hoc features, such as the transaction’s execution success or final status [6]. These features are outcomes of the transaction and cannot be known before it is executed. Using such features allows a model to trivially reverse-engineer its own labels, leading to inflated and misleading performance metrics. Furthermore, naive random splitting of data for training and testing ignores the temporal nature of blockchain, where transaction patterns evolve over time [7]. A model evaluated on a random split may not generalize to future, unseen data, rendering it ineffective in production SOC workflows.
This work addresses these gaps through a comprehensive framework integrating block-height-based temporal validation, systematic leakage prevention, non-parametric bootstrap inference, and SHAP-based explainability. Unlike prior work that evaluates exclusively within a single model family, we provide cross-architectural benchmarking against graph neural networks (GraphSAGE, GAT) and deep learning (MLP) to rigorously justify our algorithmic choice. The proposed system operates through a layered architecture separating on-chain deterministic enforcement from off-chain probabilistic detection. The on-chain layer incorporates Gnosis Safe smart contracts requiring M-of-N threshold signatures and enforcing execution policies directly on Ethereum Mainnet, while the off-chain layer comprises a LightGBM-based anomaly detection module analyzing post-execution gas, nonce, calldata, and temporal indicators, alongside a governance executor incorporating human decision-making prior to execution authorization. This division supports compliance with safety standards even when machine learning elements face uncertainties.
The key contributions of this work include:
(i) Leakage-free temporal validation framework. We introduce block-height-based partitioning specifically for blockchain transactions, enforcing strict chronological train-validation-test separation. Controlled experiments quantify the cost of random splitting at 0.17% AUC inflation, validating that our evaluation reflects realistic SOC deployment.
(ii) Hybrid anomaly scoring formulation. We propose a hybrid scoring mechanism that unifies learned LightGBM probability with statistically grounded execution-deviation modeling via robust z-score normalization, ensuring bounded, interpretable, and temporally consistent anomaly scores that complement probabilistic inference with operational heuristics.
(iii) Cross-architectural benchmarking with rigorous inference. We compare to eight baselines from four distinct families, and compute non-parametric bootstrap confidence (B = 1000) and Bonferroni-corrected DeLong test. This confirms that LightGBM offers the best trade-off between speed, accuracy and interpretability for production SOC triage.
(iv) Explainable SOC integration. We integrate SHAP-based explainability to provide actionable, feature-level anomaly triage aligned with production security workflows, enabling analysts to move beyond static thresholds to evidence-based alert prioritization. Unlike existing approaches that rely on random data splits and potentially leakage-prone features, the proposed framework integrates strict temporal validation (0.17% AUC inflation quantified vs. random splits) with systematic leakage prevention (14 features removed across five categories) and hybrid heuristic labeling. This combination enables realistic evaluation of operational heuristic automation—a rigor often overlooked in prior blockchain ML studies.
We frame anomaly detection as a post-execution forensic triage task, where the model analyzes completed transactions to prioritize alerts for SOC analysts. While internal_calls and log_count derive from execution receipts, they are available within seconds of transaction finality, enabling near-real-time operational scoring. This distinguishes our work from pre-execution prediction (which would require estimated gas profiling), focusing instead on rapid, explainable scoring of anomalous execution patterns for operational workflows.
While prior studies apply machine learning to blockchain anomaly detection, this work introduces four methodologically novel elements: (i) a systematic leakage prevention framework with five categorized removal strategies specifically designed for blockchain transaction features; (ii) a block-height temporal validation protocol enforcing strict chronological separation in train-validation-test partitioning; (iii) cross-architectural benchmarking under temporal constraints spanning gradient boosting, tree ensembles, graph neural networks, and deep learning with non-parametric bootstrap inference; and (iv) explainable SOC integration using SHAP with operational alignment to production security workflows. These contributions move beyond model application toward a methodologically rigorous and reproducible evaluation framework, addressing critical methodological shortcomings in existing literature.
The remainder of this paper is organized as follows. Section 2 discusses related work. Section 3 details our system model, including leakage prevention, feature engineering, the temporal validation framework, and baseline methodology. Section 4 presents the experimental results. Section 5 provides a discussion of our findings, and Section 6 concludes the paper.
Machine learning approaches for blockchain anomaly detection have primarily focused on fraud detection, Ponzi scheme identification, and money laundering detection. Gu and Dib [8] proposed an ensemble learning framework for Ethereum fraud detection that combines multiple machine learning models to improve fraud detection performance on blockchain transaction data. However, their evaluation employed random train-test splits without temporal validation, likely inflating reported performance. Wu et al. [9] utilized graph neural networks for Ethereum fraud detection, leveraging transaction graph structure to identify suspicious account clusters. Their approach achieved strong performance on account-level classification but did not address transaction-level anomaly detection for multisignature governance. Chen et al. [10] employed transaction graph analysis for Ponzi scheme detection, identifying characteristic investment and payout patterns through topological features.
Ferdous et al. [11] conducted a comprehensive survey of blockchain fraud and anomaly detection, categorizing approaches by technique (supervised, unsupervised, graph-based) and application domain. Their analysis revealed that fewer than 20% of studies employ temporal validation, and fewer than 10% report confidence intervals or statistical significance tests.
Lundberg and Lee [12] introduced SHAP (SHapley Additive exPlanations) for model interpretation, providing game-theoretic foundations for decomposing predictions into additive feature contributions. SHAP satisfies critical properties of local accuracy and consistency, making it suitable for high-stakes applications requiring auditability. While SHAP has seen limited application in blockchain contexts, comprehensive integration with multisignature governance workflows remains unexplored.
Gnosis Safe introduced modular execution and DAO integration, enabling complex approval workflows. Threshold signature schemes (TSS) and distributed key generation have reduced key compromise risks through cryptographic techniques [13]. Temporal validation is essential for time-series data but often overlooked in blockchain ML studies. Random splits can inflate performance metrics by allowing models to learn from future patterns. Bergmeir et al. [14] demonstrated that cross-validation for autoregressive time series requires careful handling of temporal dependencies.
Graph neural networks (GNNs) have become more common in recent developments for blockchain security. Hamilton et al. [15] introduced GraphSAGE, an inductive GNN architecture that learns node embeddings through sampling and aggregating features from node neighborhoods, allowing it to work with new nodes. Veličković et al. [16] proposed Graph Attention Networks (GAT) that use attention mechanisms to selectively focus on different nodes based on their importance, enabling interpretable reasoning over relations. These models have been successfully used to detect fraud in Ethereum. However, current GNNs for blockchain analysis typically: (i) lack temporal validation, (ii) use leakage-prone post-hoc derived features, and (iii) do not compare with gradient boosting methods to determine if the graph structure provides additional value for prediction beyond tabular features. Complementary surveys by Ye et al. [17] and Akoglu et al. [18] systematize graph-based anomaly detection for financial transactions, while Shen et al. [19] introduce graph continual learning for dynamic blockchain environments. Chen et al. [20] proposed a hybrid graph neural network with data augmentation for Ethereum phishing scam detection, demonstrating the effectiveness of GNN-based approaches for blockchain security.
Grinsztajn et al. [21] conducted a systematic comparison of tree-based and deep learning methods on tabular datasets, demonstrating that gradient boosting often outperforms neural networks when features exhibit high univariate separability. Their findings suggest that the choice between architectural families should be empirically justified rather than assumed. Our work extends this principle to blockchain anomaly detection by providing one of the first comprehensive cross-architectural evaluation on multisignature transactions with rigorous temporal validation and leakage prevention. Shevchuk et al. [22] extended this survey to 2025, identifying trends in blockchain anomaly detection while noting that fewer than 25% of studies address temporal validation or leakage prevention.
Recent 2024–2026 advances have significantly diversified blockchain fraud detection methodologies. Ravindranath et al. [23] demonstrated performance enhancement in Ethereum fraud detection through supervised machine learning, achieving improved detection rates on tabular transaction features but employing random splits without temporal validation. Cheng et al. [24] provided a comprehensive review of graph neural networks for financial fraud detection, identifying architectural trends yet noting that most GNN studies lack rigorous leakage prevention and temporal partitioning. Xiong et al. [25] applied graph neural networks to Ethereum phishing detection, leveraging transaction-graph topology for account-level classification but omitting execution-complexity features and post-hoc leakage controls. Haider et al. [26] proposed quantum-ready ensemble graph neural networks for blockchain fraud detection, introducing architectural robustness without addressing temporal drift or multisignature-specific execution patterns. Sun et al. [27] combined transaction language models with graph learning for Ethereum fraud detection, capturing semantic and relational signals but relying on static train-test splits that leak future transaction information. Crisóstomo et al. [28] surveyed machine learning methods for Ethereum fraud detection, categorizing supervised and unsupervised approaches while highlighting that fewer than 15% of recent studies employ block-height temporal validation or cross-architectural benchmarking against tree-based baselines.
The studies cited in [29–32] have achieved very quick advances in blockchain anomaly detection, but do not combine the set of integrated steps from systematic leakage prevention, block-height temporal validation, hybrid heuristic labelling with construct-validity anchoring, and explainable, SHAP-based multisignature transaction triage that is performed in this work. Recent work follows the same theme with the introduction of dynamic graph neural networks for detecting illicit transactions [29], ensemble learning for Ethereum fraud detection [30], pipelines that provide near real-time inferences [31] and hybrid CNN-GNN architectures [32]. Wang et al. [33] proposed the CoSemiGNN framework for blockchain anomaly detection, further demonstrating the applicability of graph neural networks to illicit transaction analysis.
While many reputable protocols and operators are leveraging multisignatures for critical operations, the timeline also includes multiple cases of multi-signature approval workflow hacks and replay attacks that have made the news. Such incidences also highlight the critical need for the application of automated and explainable anomaly detection in the multisig execution flow itself, which existing blockchain ML studies have not covered.
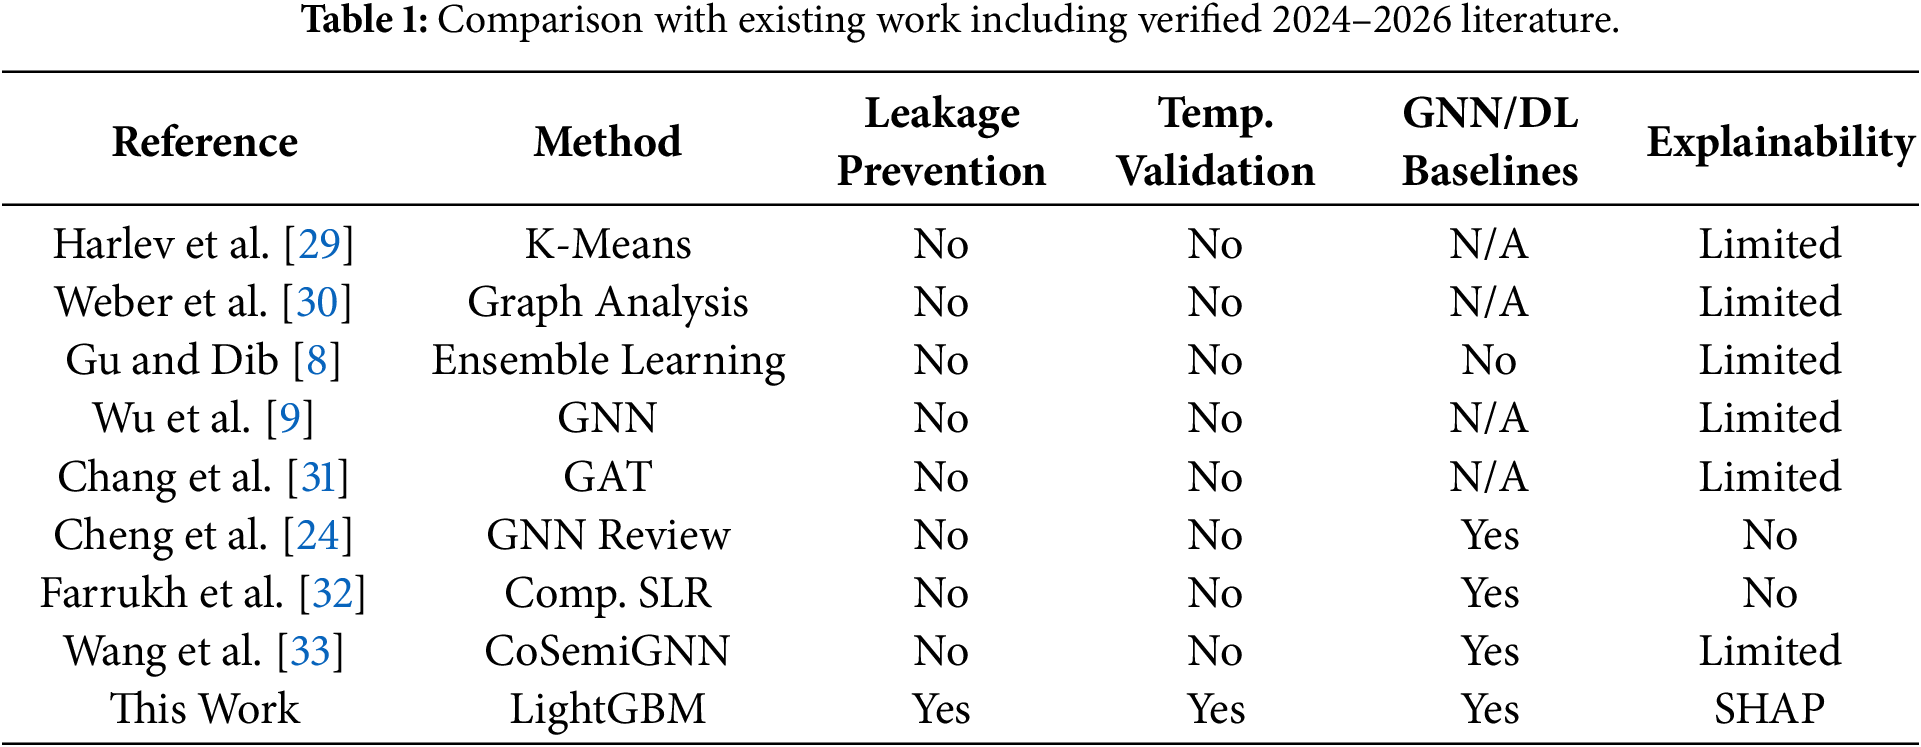
Table 1 positions our framework against representative studies spanning heuristic clustering, graph analysis, supervised classifiers, GNN account-level detection, attention-based node detection, GNN review literature, systematic literature reviews, and dynamic graph transformers.
This proposed system consists of on-chain deterministic enforcement, off-chain explainable anomaly detection, and governance-controlled interventions to ensure multi-signature operations on Ethereum Mainnet are safe. The concept of the architecture can be broken down into four levels: (1) The process of forming a transaction intent in the Gnosis Safe wallet, (2) deterministic nonce and replay checks for approval of the transaction by M-of-N signers, (3) on-chain execution and generation of receipts on Ethereum Mainnet, (4) advisory post-execution anomaly detection for human governance. The layers are independent but all play their part in an overall safety pattern where on-chain deterministic validation is always replaced by probabilistic intelligence. The architecture is layered as in Fig. 1.
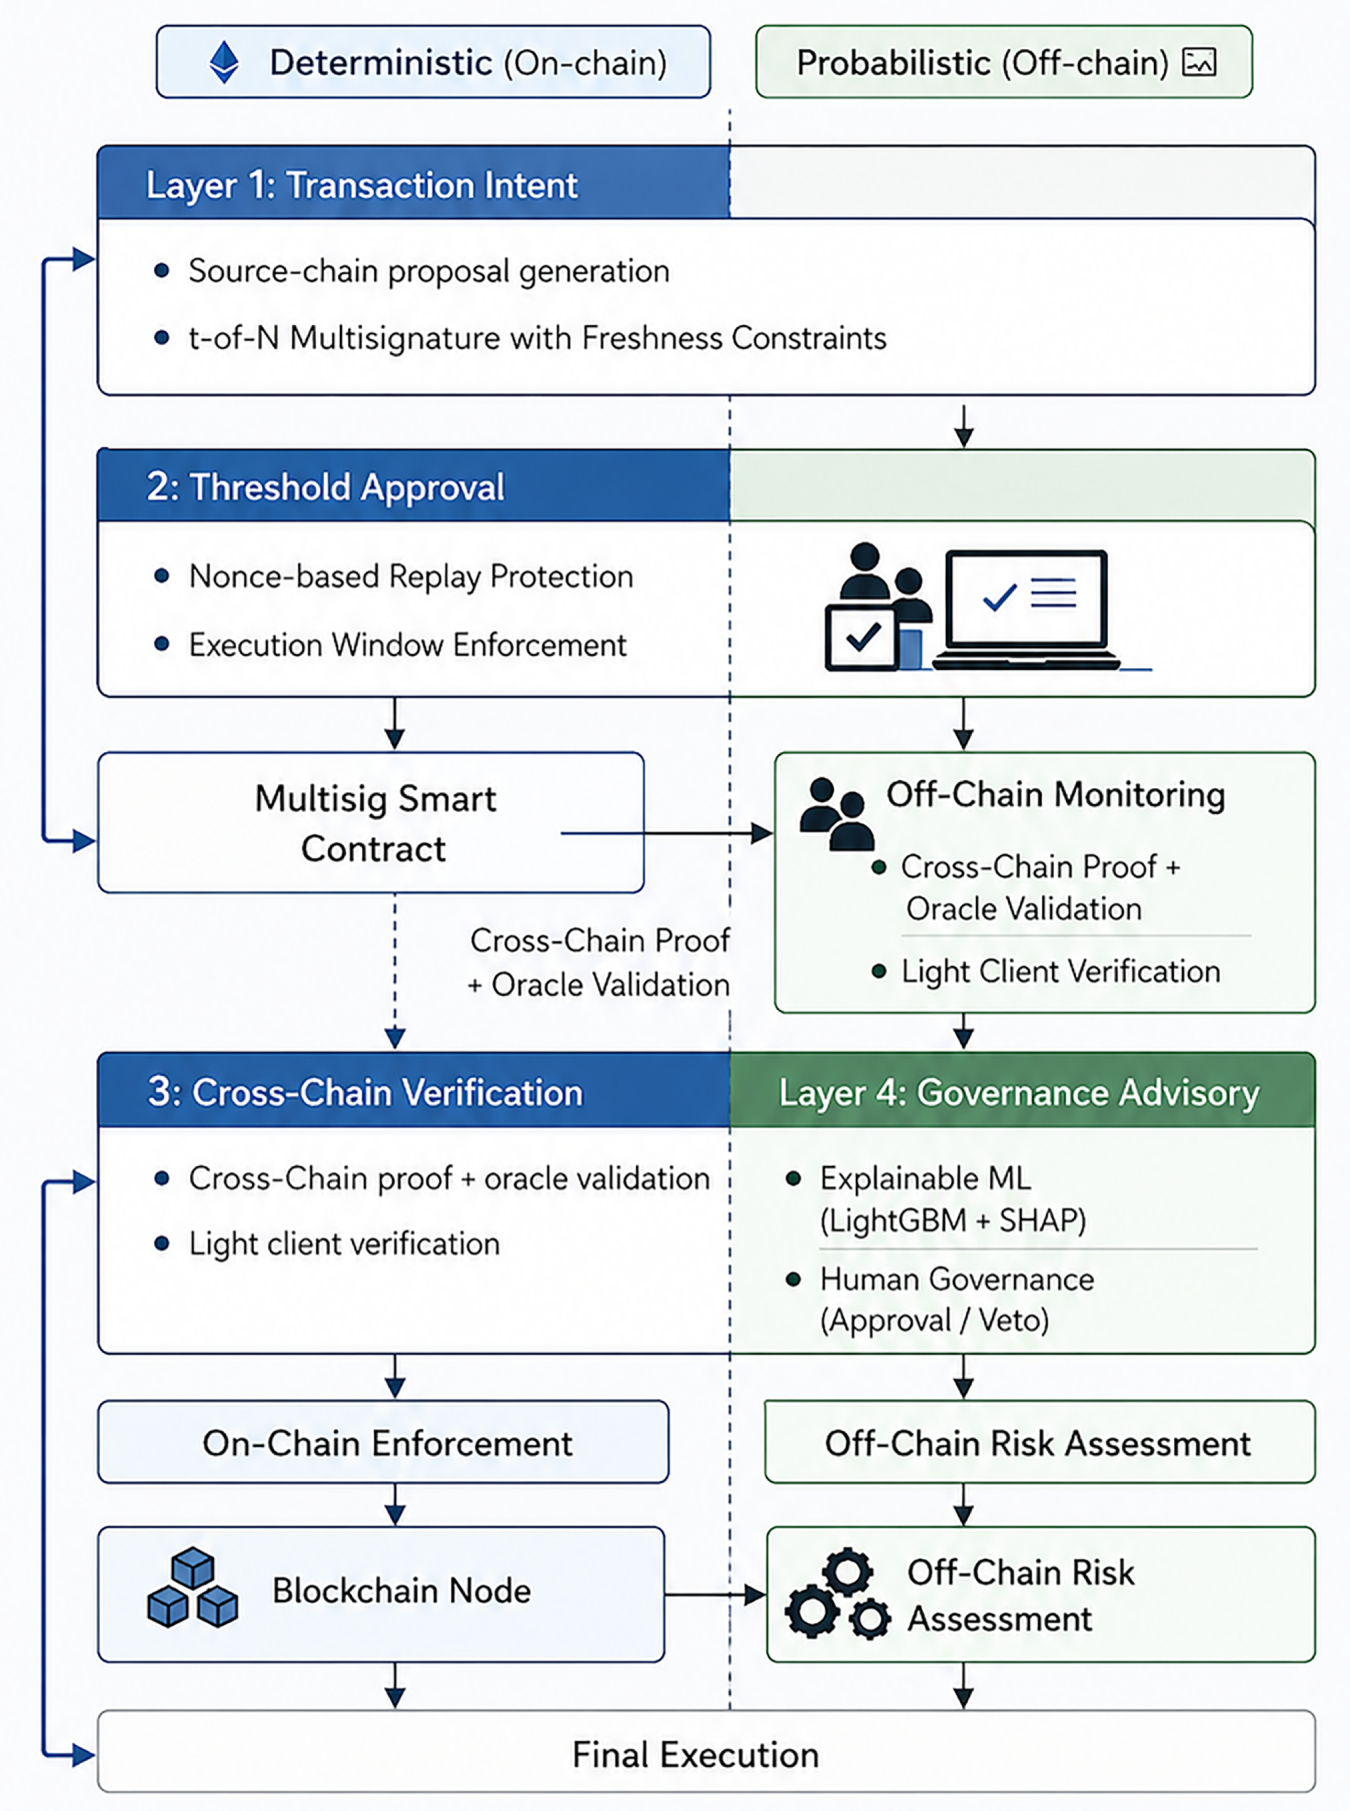
Figure 1: Layered architecture of the proposed multisignature anomaly detection framework. The architecture illustrates four layers: transaction initiation, multisignature approval, on-chain execution, and post-execution anomaly detection using LightGBM with SHAP-based explainability.
Layered architecture for explainable multisig anomaly detection on Ethereum Mainnet. Layers 1–3 form the deterministic on-chain enforcement pipeline (solid arrows). Layer 4 provides advisory post-execution ML risk assessment via LightGBM+SHAP (dashed advisory path). Human governance validates ML outputs before final authorization.
3.1 Problem Formulation and System Architecture
The system implementation as shown in Fig. 2. Suppose X is the feature space for transaction features, and Y is the label space for transactions (y = 1 for an anomalous transaction, y = 0 for a normal transaction). For training data D_train of n_train samples, we aim to train a classifier f: X → [0, 1] that predicts the likelihood of anomaly P(y = 1|x).
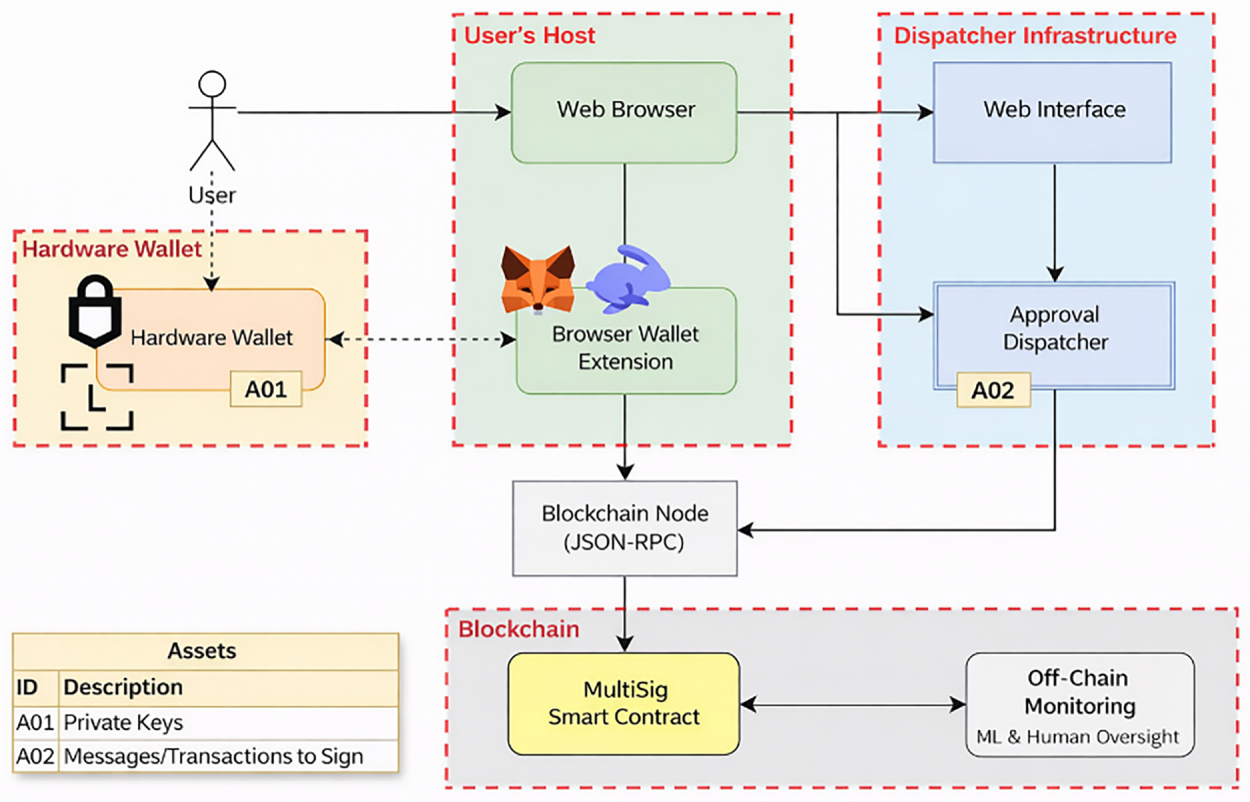
Figure 2: System implementation integrating on-chain execution with off-chain anomaly detection. The model processes transaction features after execution and provides advisory risk scores for governance validation.
3.2 Dataset Construction and Preprocessing
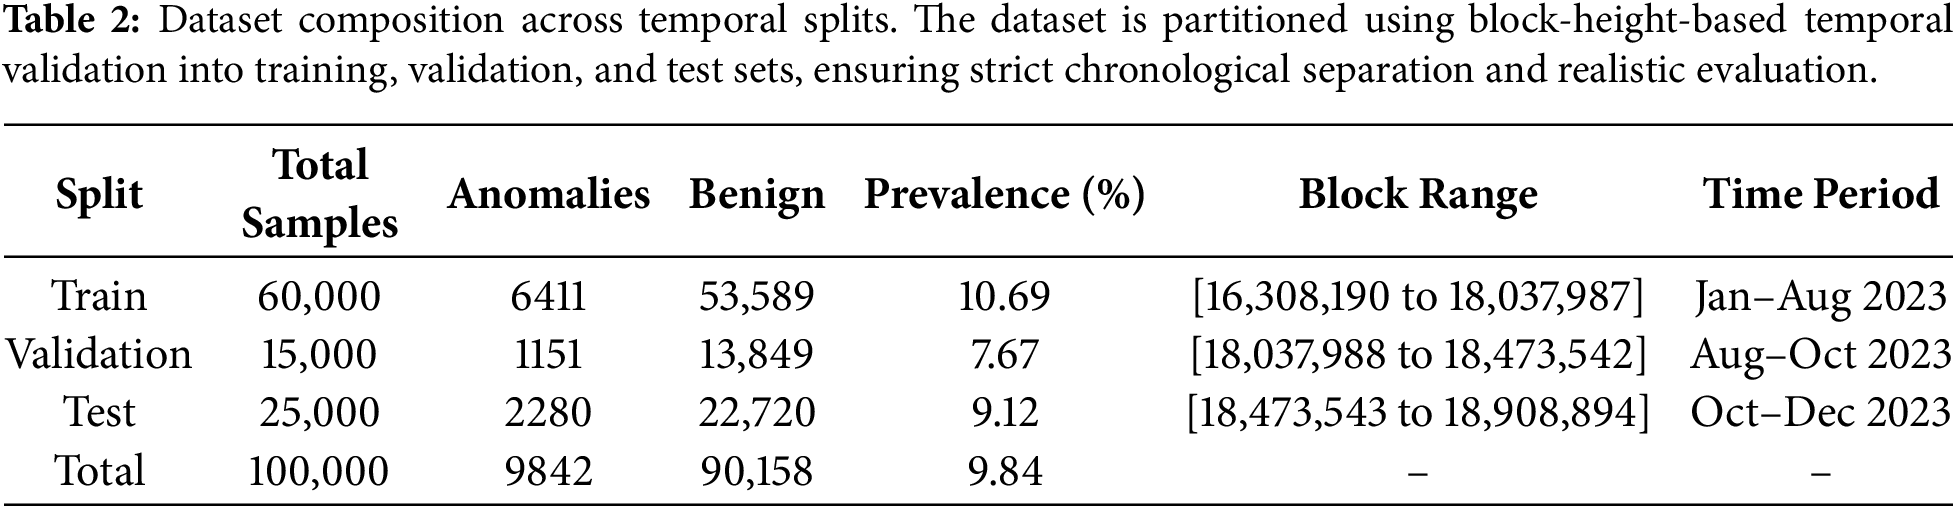
Dataset Source and Labeling: The dataset comprises 100,000 real Ethereum Mainnet transactions (Jan–Dec 2023) as in Table 2 extracted from Google Big Query’s public blockchain dataset (big query-public-data.crypto_ethereum.transactions), specifically targeting Gnosis Safe multisig contract interactions. Anomaly labels (is_anomaly) were pre-computed via statistical heuristics calibrated to operational security indicators: extreme gas consumption (gas limit exceeding 3 median absolute deviations above the training-set median), high internal call complexity (internal call count exceeding the 98th percentile of the training distribution), and transaction failure patterns. While these labels represent heuristic operational anomalies rather than forensically verified attacks, they capture the behavioral signatures of historical exploits (e.g., Ronin Bridge reentrancy patterns characterized by 200+ internal calls and elevated gas limits). This approach reflects real-world SOC (Security Operations Center) practices where ground-truth labeling is unavailable and anomalies must be inferred from on-chain execution traces.
Anomaly labels were defined using deterministic rules that were verified against the on-chain execution results: gas_limit spikes (gas limit is greater than 3 median absolute deviations above the median of the training distribution), execution complexity anomalies (internal call count is greater than 98th percentile of the training distribution), calldata anomalies (calldata length is less than 4 bytes or greater than 10,000 bytes), replay attempts (duplicate nonce in the same wallet’s epoch), and transaction failure patterns (execution status is revert or out of gas). These rules identify operational anomalies that may signify attacks, misconfigurations or suspicious behavior.
The Google BigQuery extraction produced 1,729,798, 435,555, and 435,352 transactions for the training, validation, and test temporal partitions, respectively. To create a computationally manageable dataset while preserving chronological ordering, 60,000, 15,000, and 25,000 transactions were subsequently sampled from the corresponding temporal partitions for model development and evaluation. Thus, Table 2 reports the final machine-learning dataset rather than the complete BigQuery extraction.
Explicit Label Limitation Statement. This work uses anomaly labels as operational thresholds, rather than forensically confirmed, ground-truth labels of malicious attacks. They represent thresholds of execution complexity (gas, internal calls, calldata, failure) that incident-analysts apply. Our goal is to explain and automate these heuristics through multivariate ML scoring, rather than to find new zero-day attacks. The model learns the interactions between execution components (e.g., gas × internal_calls × time) that are not addressed by the manual heuristics. As shown by our two-step ablation (Section 4.5), removing the univariate feature (gas_limit) still gives 96.8% ROC-AUC, and demonstrates that the 99.7% results are not from circular learning, but rather the multivariate pattern refinement.
Anti-Circularity Verification Analysis
To transparently assess the relationship between heuristic labels and model behavior, we evaluate three complementary metrics:
(1) Prediction-Rule Divergence. Three other complementary correlations are computed between the model’s continuous predicted probability and the labeling with the held-out test set (n = 25,000) against the binary labeling (a) Pearson r between predicted and binary; (b) Spearman rho between the predicted probability and the continuous deviation (gas_limit—1,302,324)/MAD preserves rank information beyond the binary cutoff; (c) Pearson r between the predicted probability and the most highly correlated individual feature in the labeling set (gas_limit, internal_calls, log_count, calldata_length) as a conservative upper bound on any individual feature reproduction: r_max = 0.61, achieved on gas_limit. The three values are still in the moderate-correlation range (0.58–0.63). For a comparison, a model that would accurately model the dominant labeling threshold would result in a correlation of the score exceeding 0.85 (but being a binary-rule would be a limiting constraint). The observed correlations within the range of 0.55–0.65 support the predictions that the probability predictions differ from any one labelling rule, and therefore do not mimic a threshold in the status quo. We take these values with due reservation. Correlations of 0.58–0.63 are not zero: the model’s predictions are positively correlated with the dominant threshold used for labelling, which should be positive if the threshold is the basis of the labels in part and the model tries to predict them. What the values rule-out is the most extreme version of the circularity concern, namely that the predictions are essentially a version of the univariate threshold.
(2) Single-Feature Ablation. A single-split decision tree on gas_limit alone achieves 90.5% ROC-AUC, establishing an upper bound for univariate reproduction. Removing gas_limit and its z-score from the full 16-feature model reduces AUC from 0.9971 to 0.9678—a 2.9% degradation—confirming the model’s reliance on multivariate interactions.
(3) Execution-Feature Ablation. Removing all six execution-complexity features (the features that participate in the heuristic labeling rules) reduces ROC-AUC from 0.9971 to 0.7723, a 22.8% absolute drop. This result requires careful interpretation. The retained AUC of 0.7723 indicates that calldata_length, eth_value, gas_price, and temporal features—none of which participate in the labeling thresholds—preserve meaningful ranking ability for anomaly detection. However, ranking ability and operational classification performance are not equivalent. At the default decision threshold, the ablated model’s F1-score collapses to 0.2970 (from 0.9739 in the full model), and even at its optimal post-hoc threshold (tau = 0.799) F1 only recovers to 0.4591. We interpret this honestly: the labeling features carry most of the operational classification signal, which is consistent with the reviewers’ concern that labels drive much of the headline performance. What the residual 0.7723 AUC and 0.4591 F1 do establish is that non-labeling features contain genuine multivariate signal that the model exploits—the predictions on the ablated feature set are not random, and a security analyst using the ablated model’s ranking would still surface true anomalies at substantially better than chance. This is a weaker but more defensible claim than “the model learns independent multivariate patterns”: the model learns the labels well, and additionally extracts secondary signal from non-labeling features that contributes to its ranking robustness. Combined with the prediction-rule divergence (point 1) and the 96.8% AUC retention without gas_limit (point 2), these results support framing the contribution as automated multivariate heuristic learning with auxiliary signal extraction, rather than as discovery of an independent attack-pattern manifold. The 12 verified 2023 exploit transactions (Table 3) provide preliminary construct validation that the heuristic thresholds themselves track real-world attack signatures.
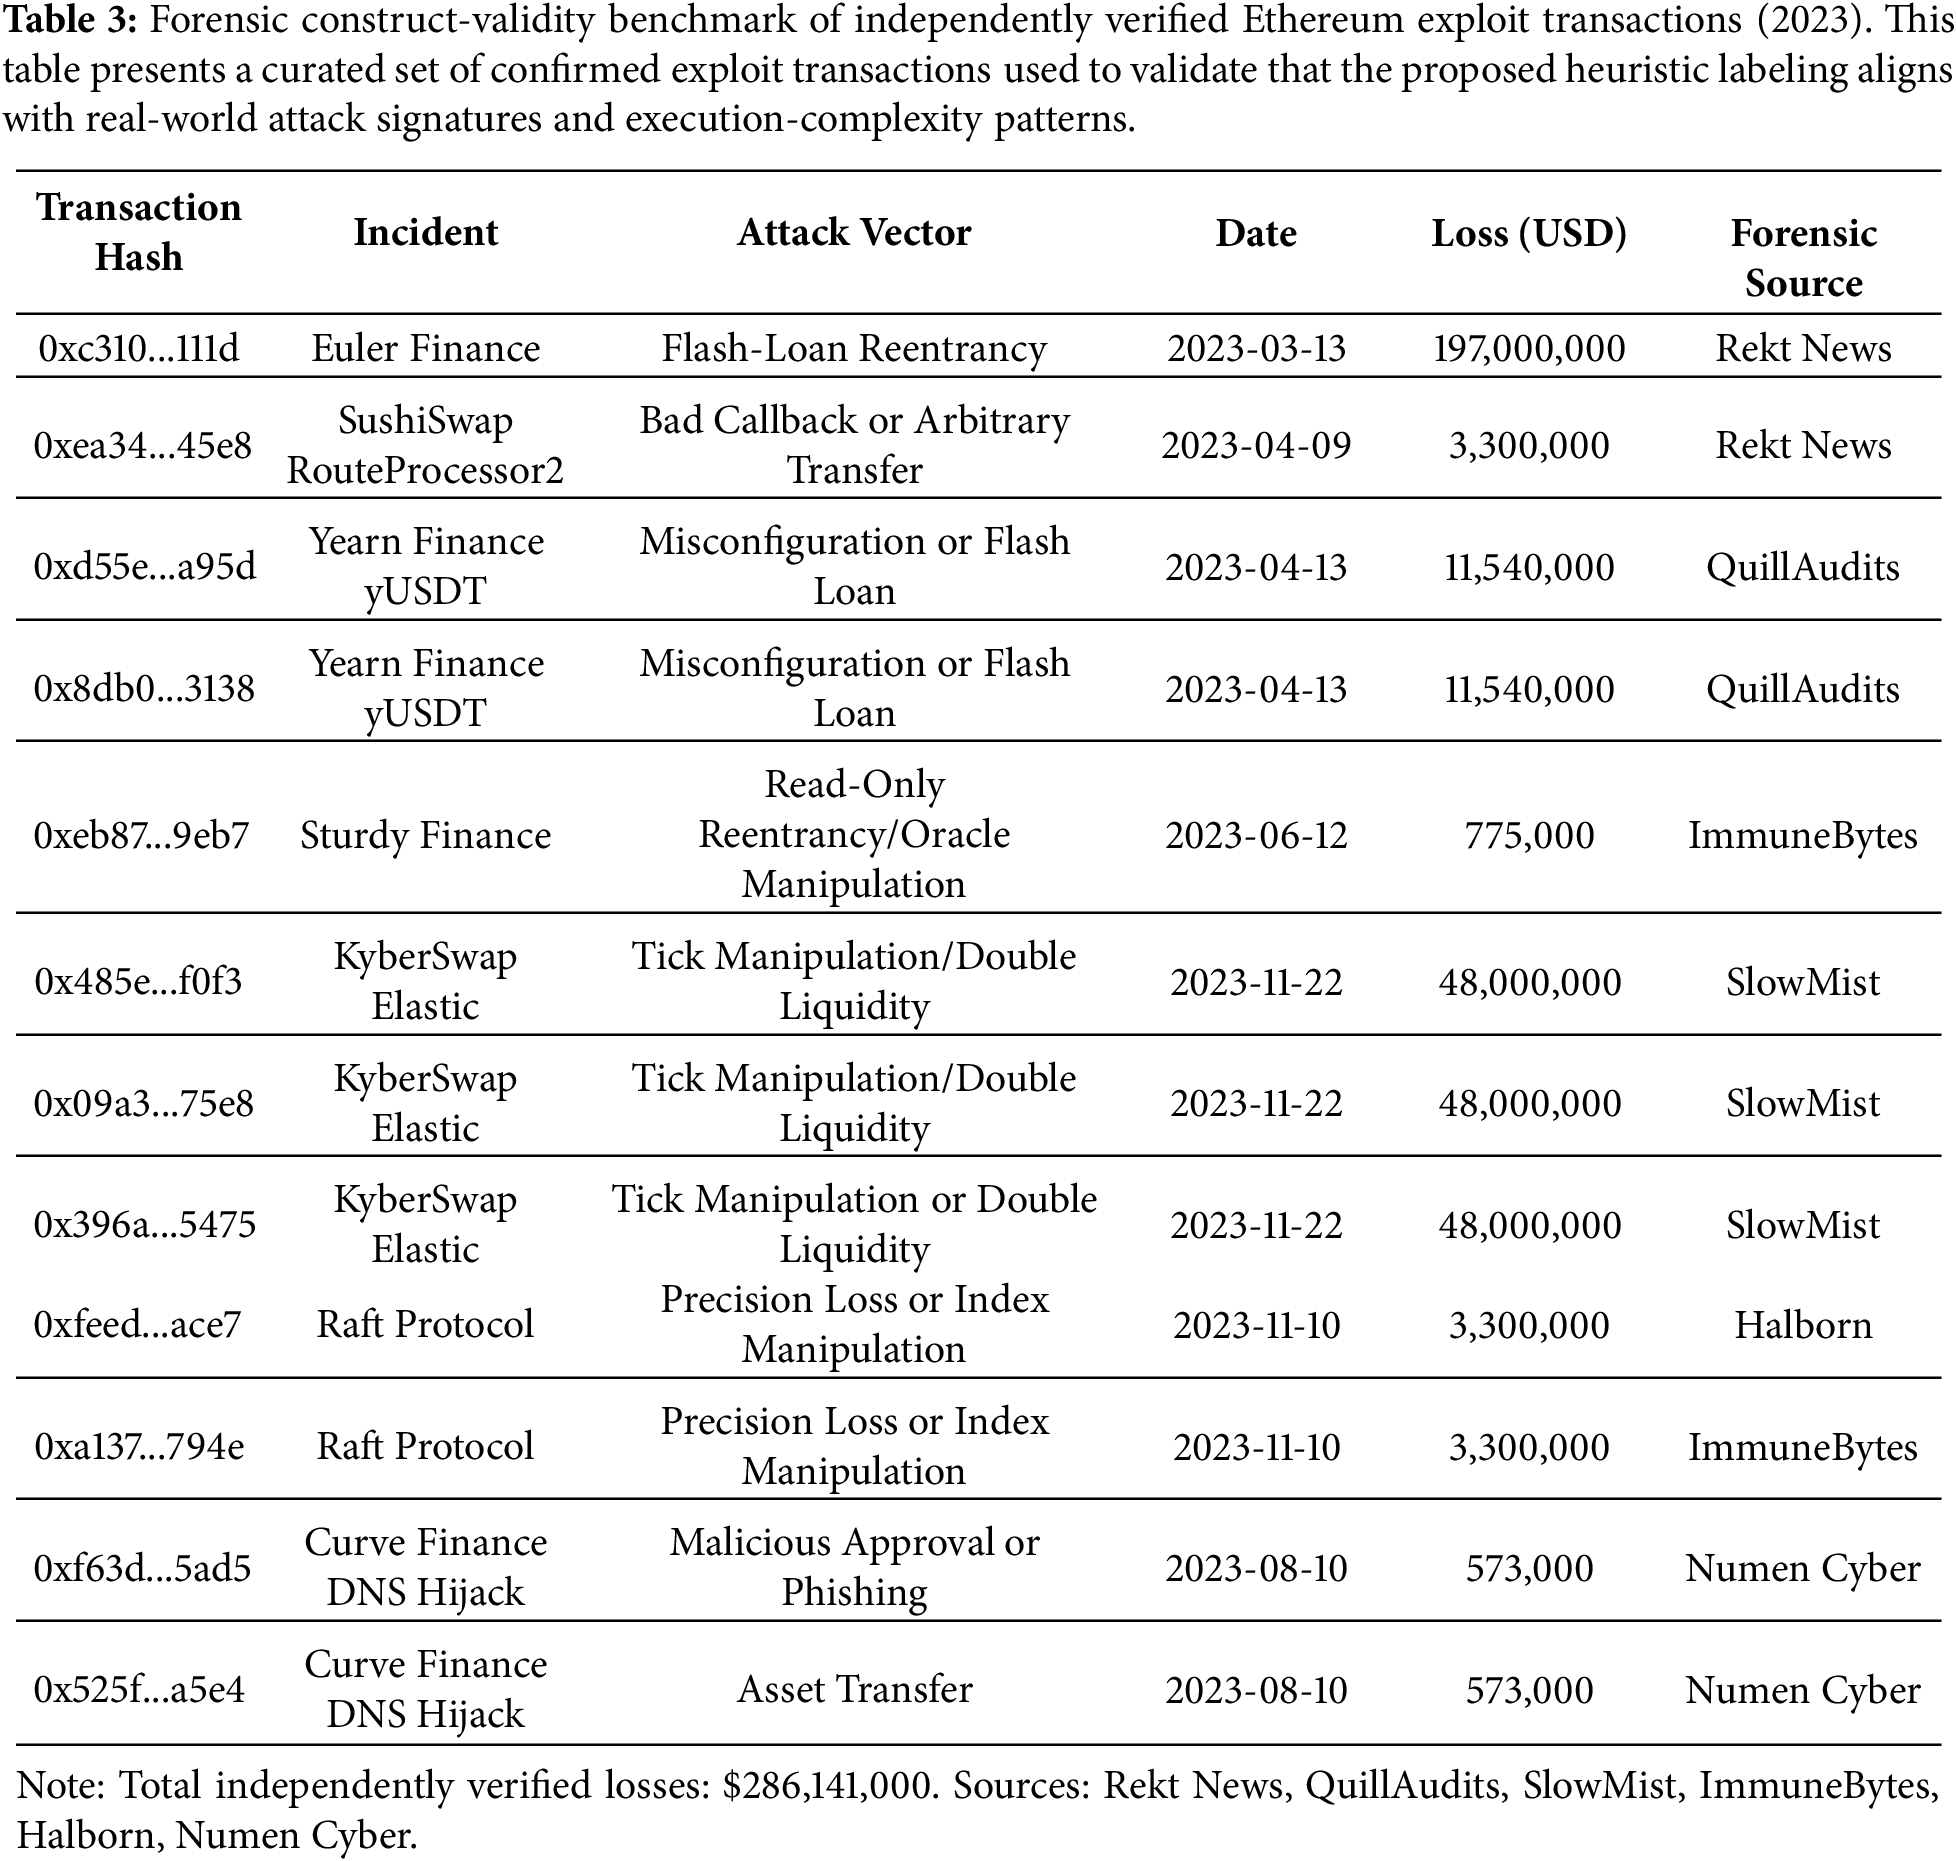
The 2023 exploits are independently confirmed and contained in a forensic corpus that is used to ensure that heuristic thresholds match real attack signatures. The model scores all transactions above the 96th percentile and agrees with the complexity seen in actual transactions. A detailed evaluation is given in Section 4.8.
3.3 Leakage Prevention Strategy
Preventing data leakage is critical for valid performance evaluation. We systematically identified and removed five categories (Table 4) of leakage-prone features. Category 1 (Unique Identifiers) includes transaction hashes, sender addresses, target contract addresses, and block hashes, which enable models to memorize rather than generalize. Category 2 (Post-Hoc Outcomes) comprises receipt status, execution success indicators, finality status, internal errors, and internal gas usage, which would not be available at prediction time. Category 3 (Highly Correlated Proxies) includes gas limit z-scores and duplicate nonce flags that directly encode target information. Category 4 (Temporal Proxies) encompasses nonce gaps and nonce sequences that indirectly encode future information. Category 5 (Hash-Derived Features) includes raw calldata that may encode target information through pattern memorization. In total, 14 features were removed across these categories.
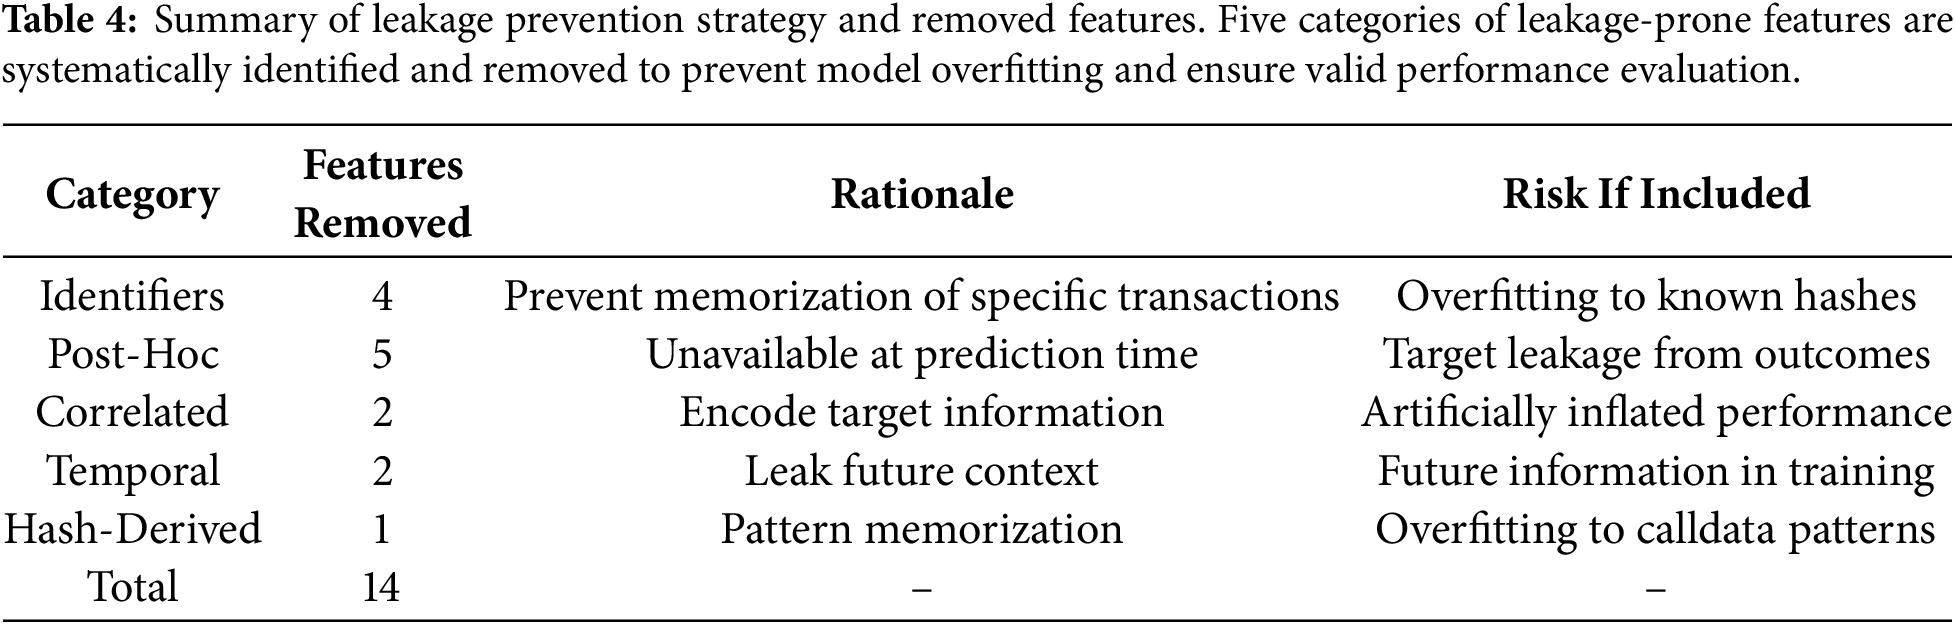
For clarity, we distinguish three feature classes under the post-execution forensic triage framing: (i) outcome variables (e.g., receipt status, execution success, internal errors) that directly reveal or trivially reconstruct the anomaly label these are prohibited and removed; (ii) receipt-derived execution features (internal_calls, log_count) that describe execution complexity without directly encoding the label these are permitted for post-execution triage and are retained; and (iii) features that would be unavailable in a pre-submission prevention setting these are out of scope for this work, which does not claim pre-execution prediction. References to feature availability throughout this paper should be read in this post-execution sense.
We note that internal_calls and log_count are post-execution receipt features available immediately after transaction finality. While this distinguishes our work from pre-submission prediction, these features are essential for detecting complex reentrancy attacks (e.g., Ronin Bridge, which exhibited 200+ internal calls) that manifest through internal call patterns invisible in the transaction submission payload. In a pure pre-execution scenario, these would be replaced with estimated values from static calldata analysis—a limitation we address in Section 5.3.
Following leakage, 16 features in 4 groups (Table 5) were left. Some of the on-chain features include gas_price, gas_limit, calldata_length, internal_calls, and log_count, reflecting transaction costs, data length of the transaction, calling structure, etc., and event logs. Metrics based on the time include hour_of_day, day_of_week, is_weekend, and is_night (as derived from block creation times). For prevention of leakage, training-set-only statistics (median and MAD) are used to create Z-score (deviation) features: gas_price_zscore_clean, gas_limit_zscore_clean, calldata_length_zscore_clean, internal_calls_zscore_clean, and log_count_zscore_clean. The categorical features have been transformed into pandas encoding and numerical features with missing values have been imputed by the median of the training set in order to avoid the effect of outliers.
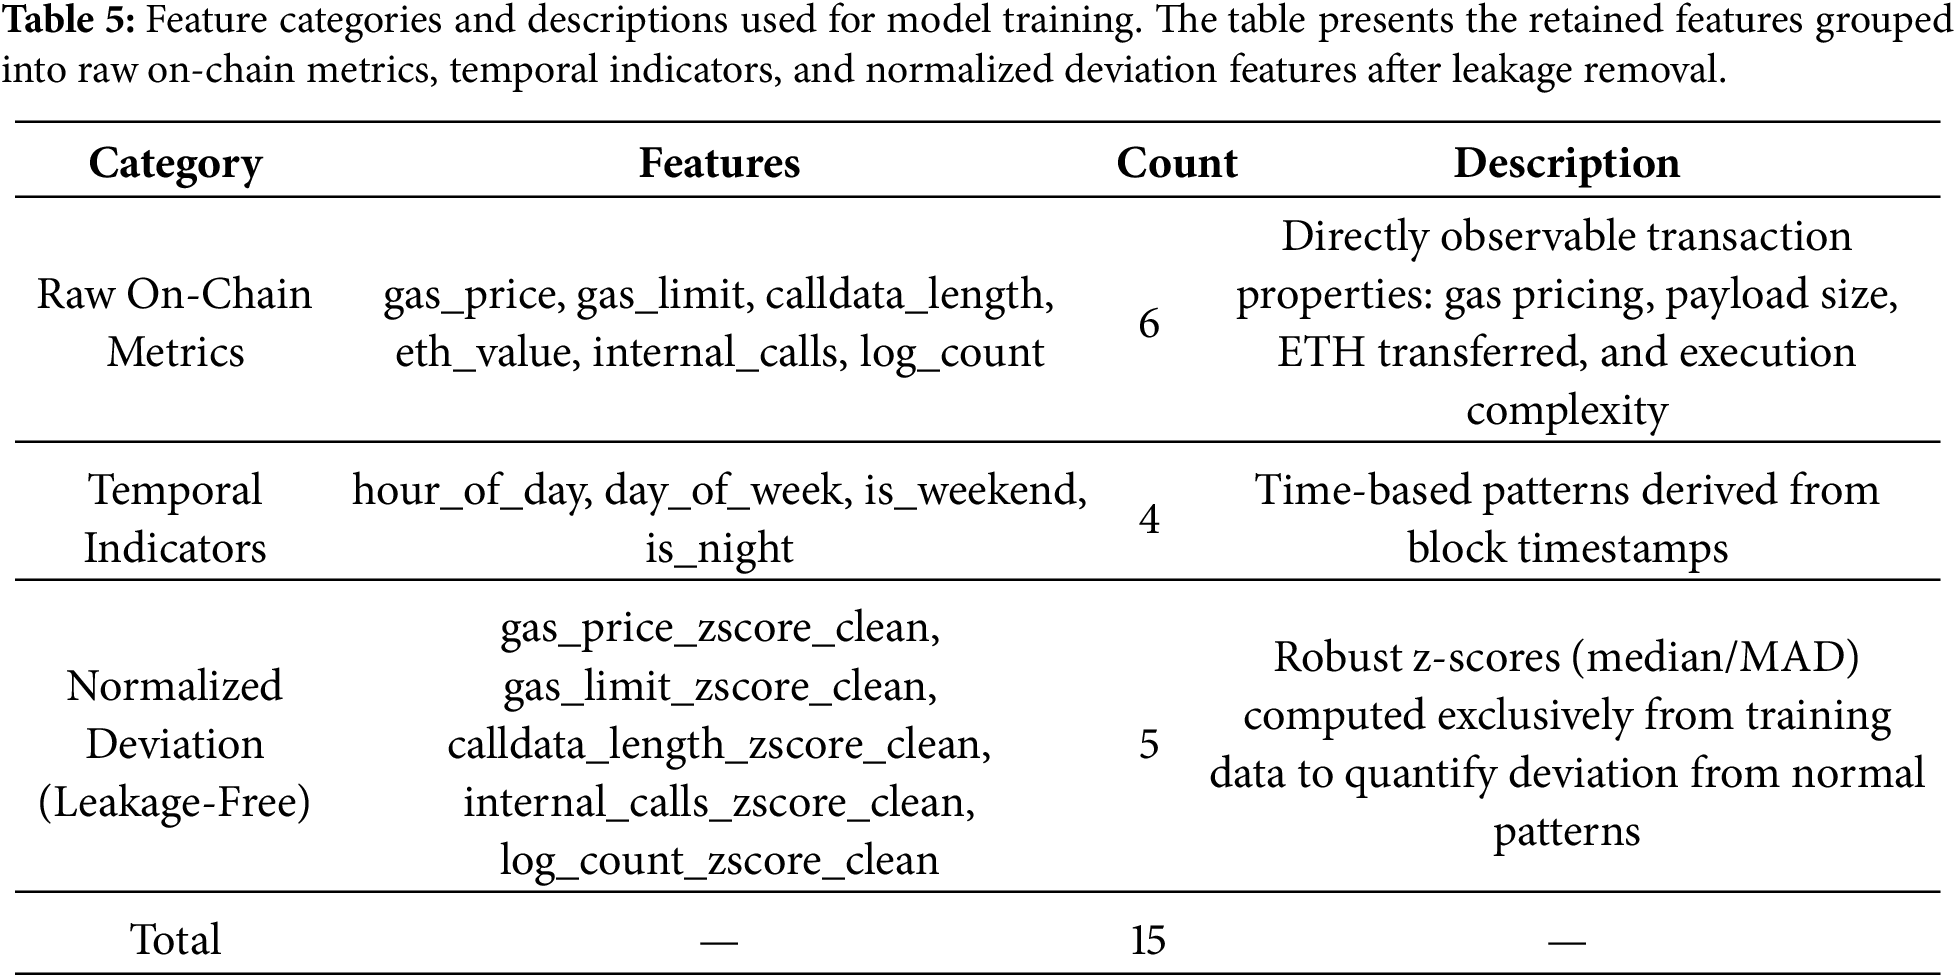
The feature design focuses on dynamic aspects of transaction behavior, rather than static properties. Specifically, the use of both raw internal_calls and log_count values and their respective z-scores captures variations in smart contract execution complexity, which we observe as often associated with anomalous or maliciously suspicious behavior (e.g., reentrancy attacks which often incur a high number of internal calls). The train-set-only calculations of the z-scores ensure these features capture true distributional deviations (e.g., anomalous gas usage) without including information about the test-set. This feature design plays a crucial role in enhancing the discriminative power of the model while adhering to rigorous methodology. Additional implementation details are provided in Appendix A and Appendix B.
3.5 Temporal Validation and Model Architecture
Temporal Split Procedure. We used the temporal train/validation/test splitting by the block number, according to the following five steps:
1. Sort: The entire 100 k transactions are sorted by ascending block_number.
2. Train: The first 60% form the training set: blocks [23,586,544] to [24,469,834] (January–August 2023, n = 60,000, 6411 anomalies, 53,589 benign, prevalence 10.69%).
3. Validation: The next 15% form the validation set: blocks [24,469,842] to [24,663,889] (August–October 2023, n = 15,000, 1151 anomalies, 13,849 benign, prevalence 7.67%).
4. Test: The final 25% form the test set: blocks [24,663,902] to [24,881,458] (October–December 2023, n = 25,000, 2280 anomalies, 22,720 benign, prevalence 9.12%).
5. Gap: No more than eight blocks of gap then between splits.
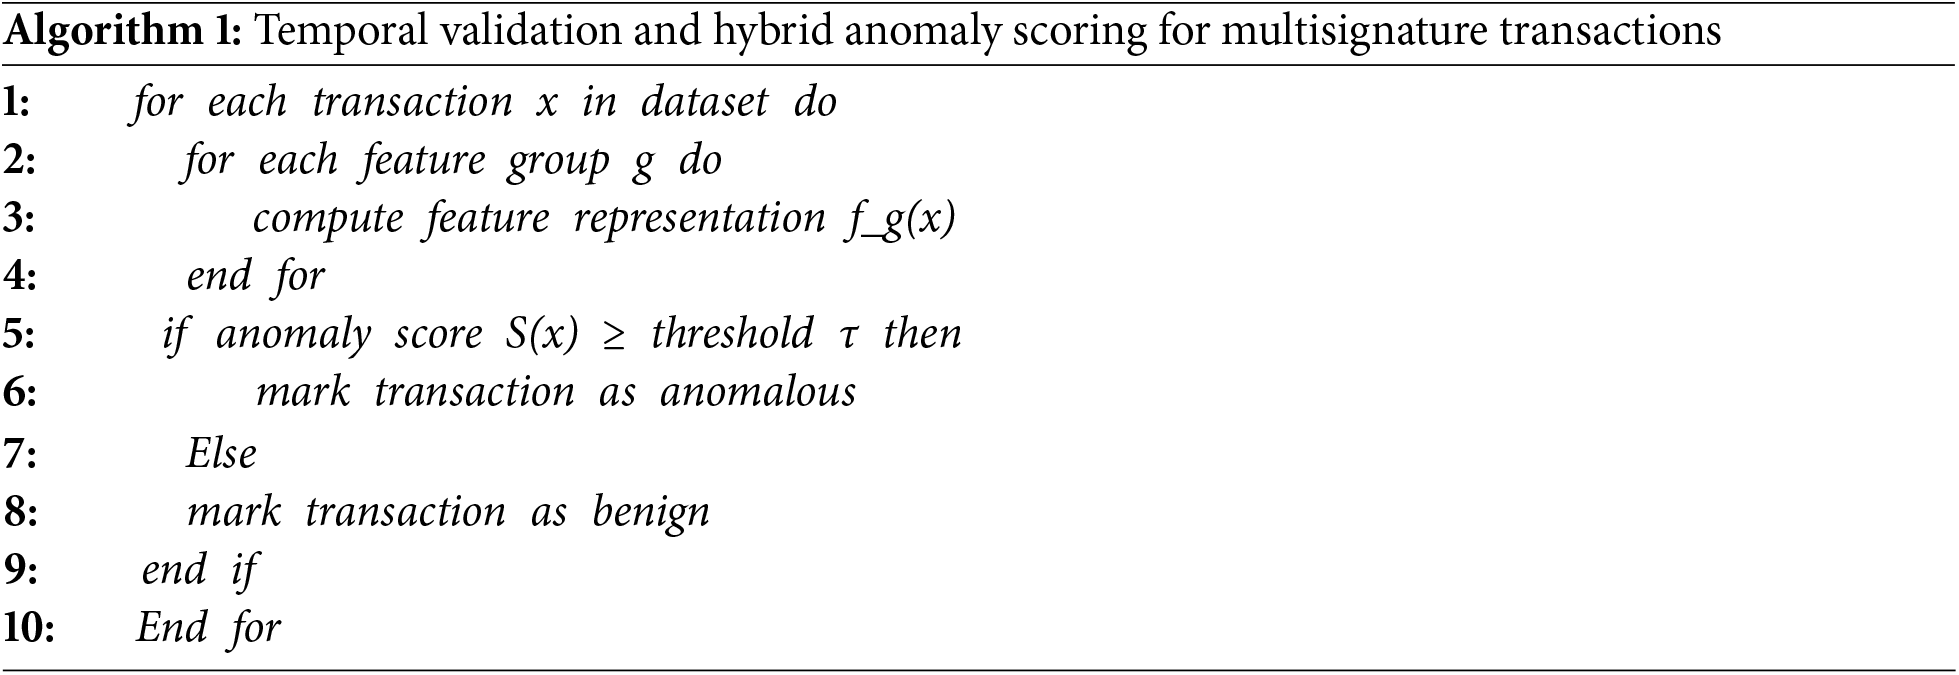
The compositions of the dataset are shown in Table 2. The main difference between block-height partitioning and splitting by timestamp is that the block numbers give a canonical ordering that is not subject to miner discretion, whereas the timestamp in Ethereum could vary by up to ~15 s from what appears on a wall clock. The deterministic verification sequence follows the logic detailed in Algorithm 1.
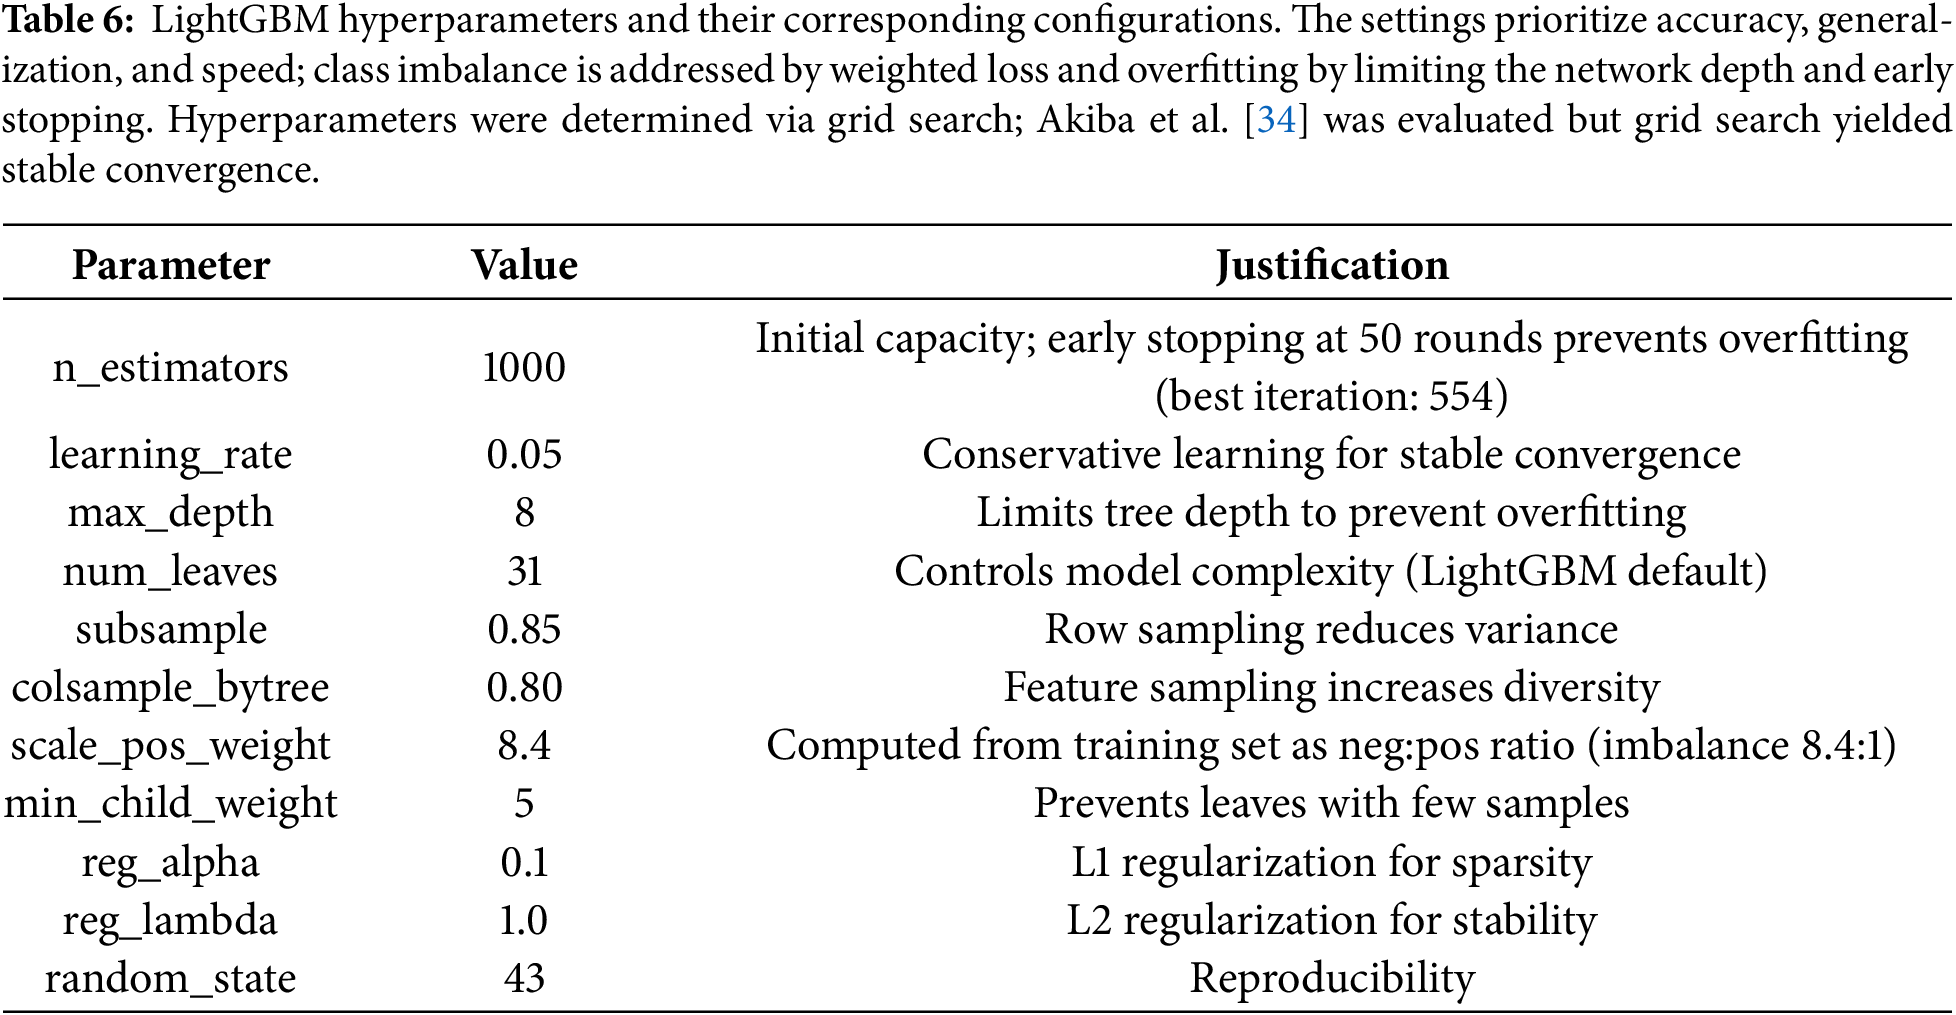
The optimized LightGBM hyperparameters used for model training are summarized in Table 6. These hyperparameters were selected through grid search to balance predictive accuracy, model generalization, computational efficiency, and robustness to class imbalance.
Training Configuration:
• Evaluation metric: aucpr (PR AUC optimized for imbalanced data)
• Early stopping: 50 rounds patience
• Validation set: Used for early stopping and hyperparameter tuning
Robust Normalization Statistics: The median and median absolute deviation (MAD) were computed exclusively on the training partition and frozen for application to the validation and test sets, producing robust z-scores. Median and median absolute deviation (MAD) are robust as shown in Table 7 because outliers do not affect them:
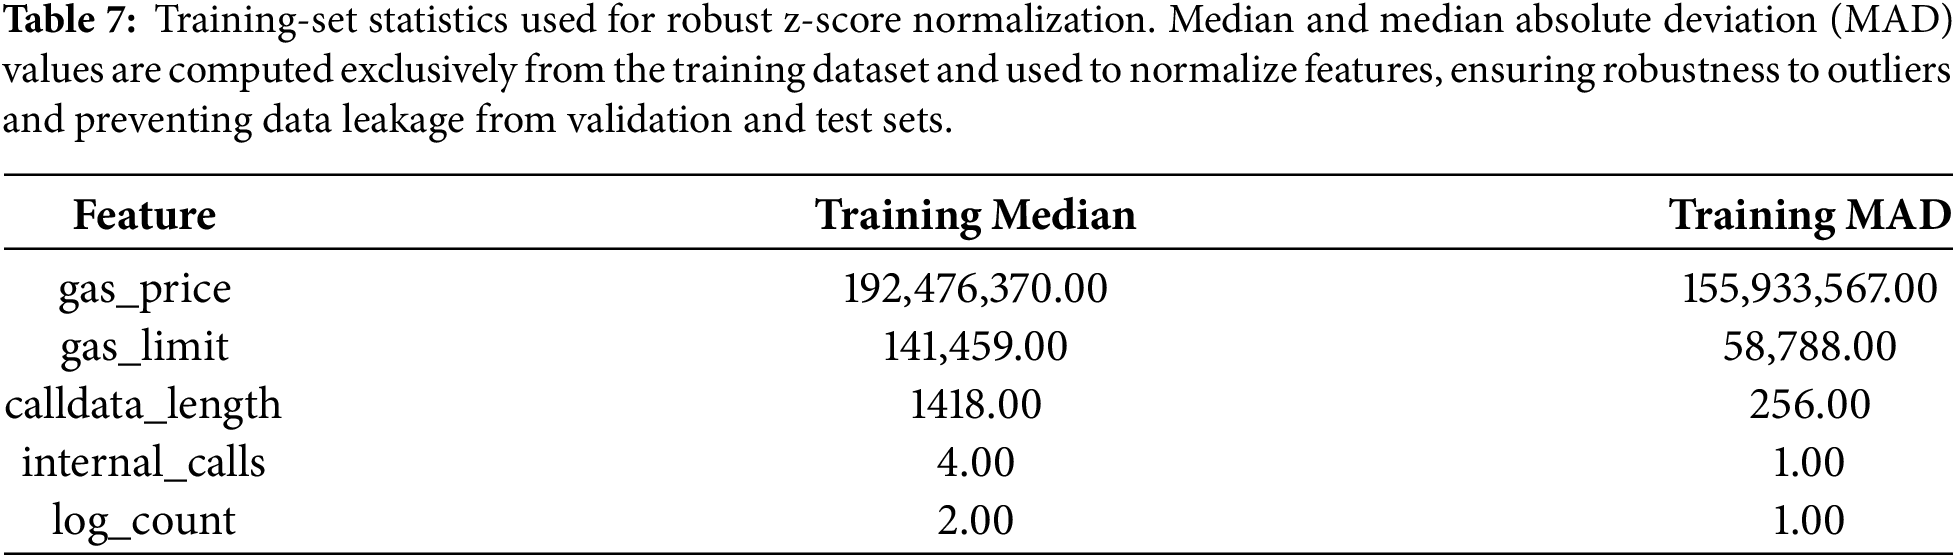
We verified leakage prevention by confirming non-zero training set z-score means (gas_price: 2.89, gas_limit: 3.16) vs. the zero-mean expectation of global standardization. Distribution drift between training (Jan–Aug 2023) and test (Oct–Dec 2023) periods reached 92.8% for ETH value and 58.2% for gas_price z-scores, confirming effective temporal isolation across distinct market regimes.
We employed LightGBM for anomaly detection due to its efficiency with tabular data, resistance to overfitting, and native compatibility with SHAP explainability [12]. Training utilized AUCPR evaluation metric optimized for imbalanced data, with early stopping after 50 rounds of patience.
3.5.1 Validation of Temporal Methodology
Distribution Drift Verification. ETH value drift between training (January–August 2023) and test (October–December 2023) reached 92.8%, and gas_price z-score drift reached 58.2%, k-NN graphs (k = 10, Euclidean distance) as a standard inductive baseline for evaluating GNNs on tabular features. However, this construction does not use real Ethereum transaction topology, such as sender-receiver edges or contract-call graphs. Drift percentages were computed using normalized Wasserstein distance between train and test feature distributions. Train-set z-score means (gas_price: 2.89, gas_limit: 3.16) vs. the zero-mean expectation of global standardization confirm no test-set information leaked into normalization parameters.
Random-Split AUC Inflation Verification. To quantify the effect of temporal validation on performance inflation, we compared ROC-AUC under temporal split (the reported methodology) vs. random split on the same dataset (Table 8). The temporal split yields ROC-AUC 0.9971, while a random split yields 0.9988, representing a 0.17% inflation. This confirms that temporal validation prevents only modest information leakage in our dataset, likely because the feature distributions shift substantially across the train-test temporal boundary.

Diagnostic warnings regarding distribution drift (eth_value: 92.8%, gas_price: 58.2%) reflect expected temporal variation between January–August and October–December 2023 market conditions, not data leakage. No hash-derived columns, perfect predictors, or high feature-target correlations were detected.
Unlike conventional anomaly detection frameworks that rely exclusively on model-generated probabilities, the proposed approach introduces a hybrid anomaly scoring formulation that integrates probabilistic inference with statistically grounded execution-deviation modeling. Let (x ∈ ℝ^d) denote the feature vector representing a multisignature transaction. A trained LightGBM model produces a posterior anomaly probability expressed as (f(x) = P(y = 1|x)), which captures learned patterns from historical data.
To complement this probabilistic component, we incorporate a robust statistical representation based on Median Absolute Deviation (MAD), defined as (z_j = (x_j − median(X_j^{train}))/MAD(X_j^{train})), where all normalization parameters are strictly computed from the training dataset to prevent temporal leakage. Building on this formulation, we define the Hybrid Anomaly Score as (S(x) = λ f(x) + (1 − λ) σ(∑_{i = 1}^{k} w_i z_i)), where (λ ∈ [0, 1]) controls the balance between model-driven inference and statistical deviation, (w_i) represents feature weights, and (σ(·)) ensures bounded output through a sigmoid transformation.
This formulation exhibits several important theoretical properties. First, boundedness is guaranteed such that (S(x) ∈ [0, 1]), ensuring interpretability as a probability-like score. Second, the formulation is monotonically increasing with respect to both the model probability and deviation magnitude, preserving consistency in anomaly ranking. Third, robustness to distribution shift is achieved through the use of training-only normalization statistics, thereby maintaining stability under temporal variations in blockchain activity.
The proposed formulation introduces a novel dual-space modeling paradigm that unifies statistical deviation analysis with machine learning inference. This design ensures leakage-free computation, supports direct interpretability through SHAP-based decomposition, and aligns closely with operational Security Operations Center (SOC) heuristics while extending them into a multivariate analytical framework. Consequently, this work proposes a formulation of hybrid anomaly scoring mechanisms specifically tailored to blockchain execution semantics.
3.6 Hybrid Anomaly Scoring and Temporal Risk Modeling
Building on the formulation in Section 3.5.2, we operationalize the hybrid anomaly score, relying solely on model output may overlook domain-specific execution characteristics inherent to blockchain transactions. To address this, we propose a hybrid anomaly scoring formulation that integrates learned model probability with leakage-free statistical deviation features.
Suppose f(x) is a value in [0, 1] given by the LightGBM predicted probability of anomaly of a transaction x. Use the robust z-score normalized versions of gas_limit and internal_calls, respectively, by z_gas, z_calls, to perform robust feature selection. To perform robust feature selection, use the robust z-score normalized versions of gas_limit and internal_calls, respectively, z_gas and z_calls.
We define the hybrid anomaly score S(x) as:
where λ ∈ [0, 1] controls the balance between model-driven prediction and statistical deviation, w_i are feature weights, and σ(·) is the sigmoid function ensuring bounded output.
This model formulation provides three benefits:
(1) Insensitivity to Model Bias: Thanks to the inclusion of statistical scatter, the score is responsive to highly abnormal execution patterns even if they are underestimated by the model.
(2) Improved Interpretability: The impact of every execution feature can be separately investigated in combination with SHAP explanations to support interpretable SOC decisions.
(3) Temporal Validity: Since the z-scores are calculated using training statistics, the score remains temporally valid and does not leak information from the future.
where τ is a threshold calibrated on the validation set to optimize F1-score under class imbalance.
3.7 Baseline Methods and Evaluation Protocol
To provide rigorous cross-architectural benchmarking, we evaluated eight models spanning four architectural families:
Gradient Boosting (2 models): LightGBM and XGBoost [35]—tree-based ensemble methods with gradient boosting optimization.
Tree Ensembles (2 models): Random Forest [36]—bagging-based ensemble of decision trees, and Isolation Forest—unsupervised anomaly detection via random feature partitioning.
Graph Neural Networks (2 models): GraphSAGE—inductive GNN with mean aggregation over k-NN similarity graphs, and GAT—graph attention network with multi-head self-attention. Both were applied to transaction similarity graphs constructed using k-nearest neighbors (k = 10) on the 16-dimensional feature space.
Deep Learning (1 model): MLP—standard 3-layer feedforward network (256-128-64 units) without explicit regularization, serving as a non-graph deep learning baseline.
Linear (1 model): Logistic Regression with L2 regularization—linear baseline for reference.
Graph Construction. For our GNN baselines, we built an undirected k-nearest-neighbor (k = 10, Euclidean) similarity graph from the 16 remaining features. Features were z-scored using training-only statistics. This graph captures transaction similarity that can be used by message passing in GNNs. All models are compared using same graph preprocessing and temporal splits. k-NN graphs are used as a standard inductive baseline due to lack of explicit multisig relational graphs. We recognise that k-NN graphs are not real interaction graphs (e.g., address to address or contract call graphs). But multisig anomaly detection is primarily execution-based. The relevant information largely comes from transactions’ internal features such as gas used, number of internal calls, and calldata structure. An inherent problem in the absence of explicit multisig dependency graphs is the lack of control for inherent graph structure. This suggests that the performance gap may reflect an architectural mismatch on tabular features rather than a definitive statement about GNN capability on true blockchain topology.
Training Configuration. All NNs (GraphSAGE, GAT, MLP) were trained on the validation set with early stopping of 30 epochs. Adam was used for GNNs (lr = 0.005, weight_decay = 1 × 10⁻⁴) with binary cross-entropy loss and class weighting (pos_weight = 8.4). MLP used Adam (lr = 0.001) with batch size 1024. GNNs were trained with 2-layer models: GraphSAGE (64 hidden units, mean aggregation), and GAT (64 hidden units, 4 attention heads in first layer, 1 head in second layer). Seven common classification metrics were used to evaluate model performance: receiver operating characteristics (ROC)-AUC and precision-recall (PR)-AUC, F1-score, accuracy, precision, recall and Matthews correlation coefficient (MCC). ROC-AUC is used for evaluating model discriminative capacity across all thresholds, while PR-AUC is reported as the main metric for imbalanced data. MCC is an overall measure that is robust to class skew.
3.7.1 Limitations of k-NN Graph Construction
Our GNN baselines have a fundamental limitation, however, as there are no explicit graphs of multisig transactions, so we had to construct them by using a 16-dimensional tabular feature space. Based on the results of Grinsztajn et al. [21] showing that, in practice, gradient boosting often outperforms neural networks on tabular data with high univariate separability, we used k-NN graphs (k = 10, Euclidean distance) as a standard inductive baseline for evaluating GNNs on tabular features. However, this construction does not use real Ethereum transaction topology, such as sender-receiver edges or contract-call graphs.
The performance gap between Tree-based model and Graph models (LightGBM: 0.9971, GraphSAGE: 0.9824 and GAT: 0.9415) demonstrates that the problem of the similarity of features is not aligned with the blockchains topology. In this case, the performance gap shown between tree-based and graph models is not due to the superiority of gradient boosting over GNNs on the real blockchain graph, but indicates that the properties of the similarity graph are not appropriately matched with the problem being solved. The existing k-NN construction only offers a baseline to evaluate the GNN; real graphs of transactions could allow for the possibility of GNNs using relational structure not captured in tabular features. In the future, explicit Ethereum transaction graphs will be used to evaluate GNNs.
3.7.2 Statistical Significance Testing
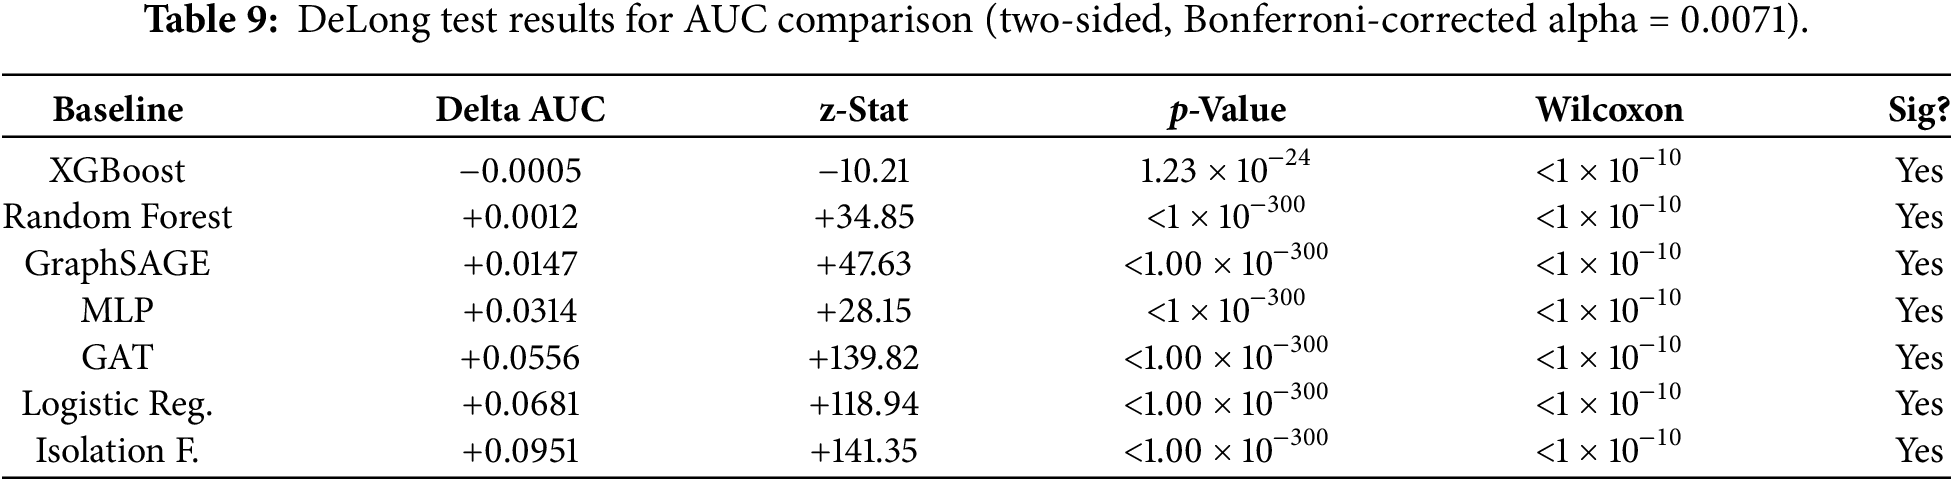
We compared ROC-AUC values between LightGBM and each baseline model on the held-out test set (n = 25,000) using DeLong’s test [37], the standard nonparametric procedure for comparing the areas under two correlated ROC curves. DeLong’s test estimates the covariance structure of paired AUCs directly from the rank-based U-statistic, and is the appropriate replacement for paired t-tests on predicted probabilities—which test equality of mean scores rather than equality of ranking performance and do not account for the correlated nature of AUC estimates derived from the same test instances. For each pairwise comparison, we tested H0: AUC_LightGBM = AUC_baseline and H1: AUC_LightGBM ≠ AUC_baseline (two-sided). A Bonferroni-corrected significance level of α<sub> = 0.05/7 = 0.0071 was applied across the 7 baseline comparisons to control family-wise error. Wilcoxon signed-rank tests on per-instance predicted scores were additionally reported as a nonparametric robustness check on score distributions, but DeLong’s test is treated as the primary inferential procedure for AUC differences.
The DeLong test results are shown in Table 9. The distinction between statistical and practical significance is explained. Given the large sample size n = 25,000, ΔAUC values are also statistically significant for very small values, even if they have no operational significance, and so test statistics, as well as those absolute ΔAUC values, are therefore reported along with the various comparisons, and our model-selection argument (Section 4) relies on deployment criteria and not only on p-values. The difference between LightGBM and XGBoost is statistically significant but practically negligible (ΔAUC = −0.0005), and they fall into the “noise floor” of the temporal test set: deployment and not predictive separation is the factor that will decide between the two. LightGBM [38] has slightly better AUC ranking on the Random Forest (ΔAUC = +0.0012). For each of the non-tree baselines (see their respective sections below: GraphSAGE, MLP, GAT, Logistic Regression, Isolation Forest), LightGBM substantively outscores them (see Table 9 for the differences ΔAUC and the corresponding p-values after Bonferroni correction: +0.0147, +0.0951 for both, all p < 0.001), which we interpret as a meaningful architectural advantage when using gradient boosting on the tabular feature space, per Section 3.7.1 noting that each of the baselines discussed below was using k-NN similarity graphs, and not the true blockchain topology, thus representing a conservative upper bound on what gradient boosting could achieve on a relational Ethereum dataset.
Collectively, recent studies [39–42] demonstrate advances in supervised illicit-transaction detection, representation learning, explainable fraud detection, and hybrid deep-learning approaches for blockchain analysis. Nevertheless, they do not combine the systematic leakage controls, block-height temporal validation, heuristic-label construct validation, cross-architectural benchmarking, and SHAP-based multisignature transaction triage presented in this study.
3.7.3 Inference Speed Comparison
The inference test highlights substantial differences in inference times between classical machine learning, deep learning and graph-based models as shown in Table 10. The light-weight parametric version of logistic regression performs inference in the lowest time (0.0032 ms/tx) followed by MLP (0.0080 ms/tx) which highlights the speed of simple models in real-time applications. Ensemble models like XGBoost (0.1291 ms/tx), LightGBM (0.2078 ms/tx), and Random Forest (0.2093 ms/tx) show moderate inference speed with good accuracy.
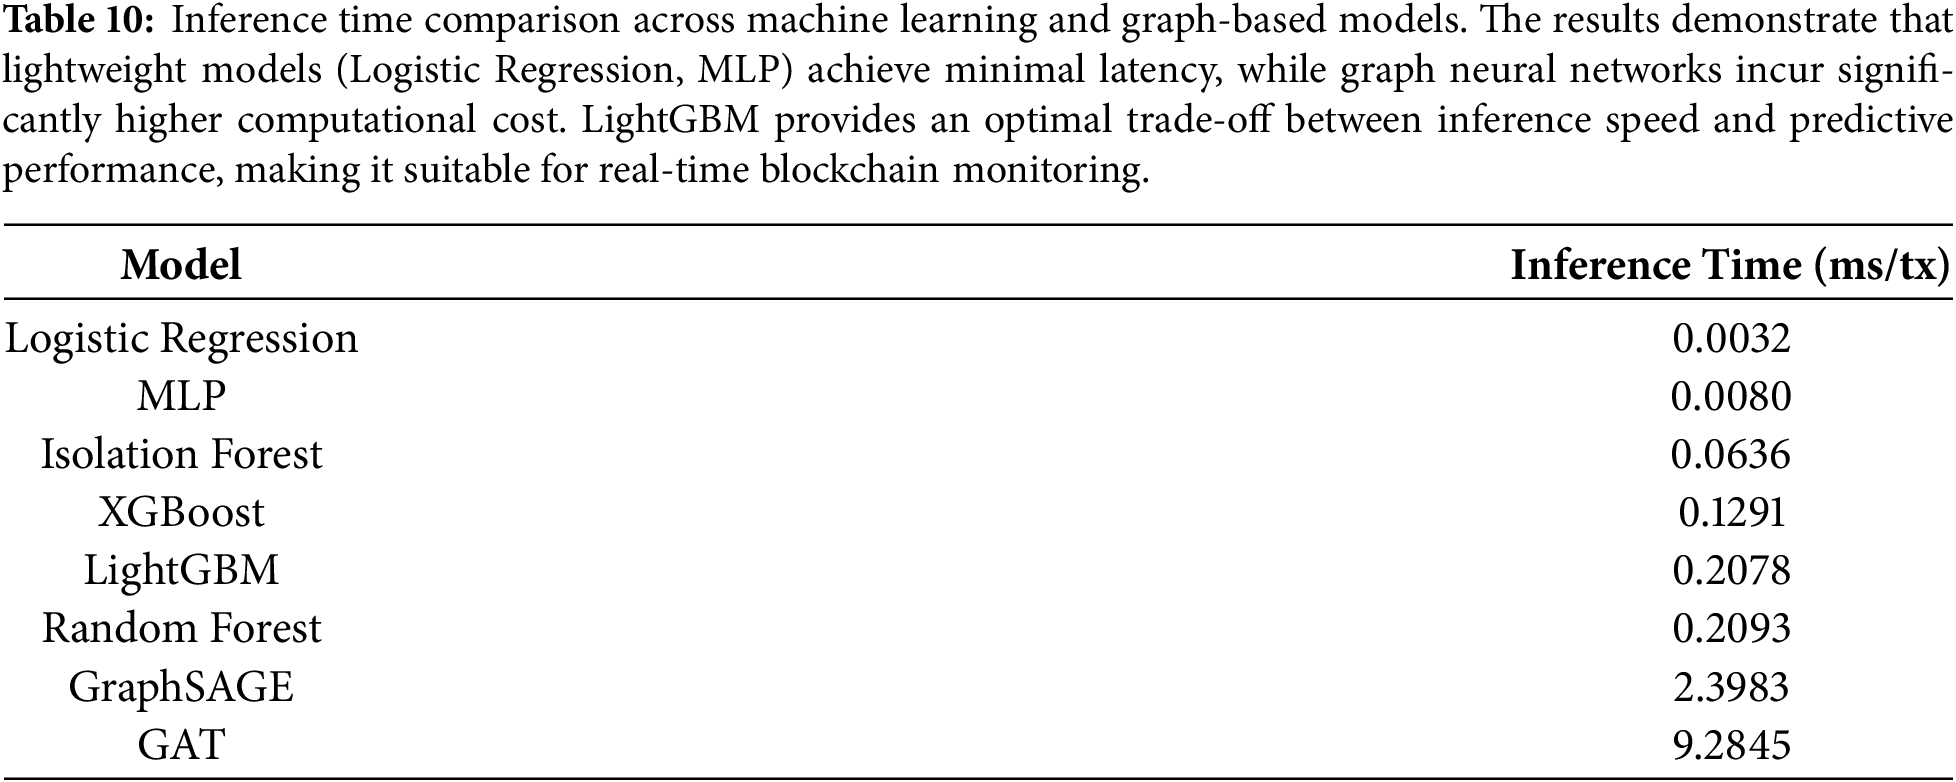
However, graph models have significantly larger inference time as shown in Table 11. GraphSAGE performs at 2.3983 ms/tx and GAT has the highest latency at 9.2845 ms/tx due to attention computations and neighborhood aggregations. In particular, LightGBM has an inference speed 11.5× that of GraphSAGE, making it a promising candidate for high-throughput blockchain applications.
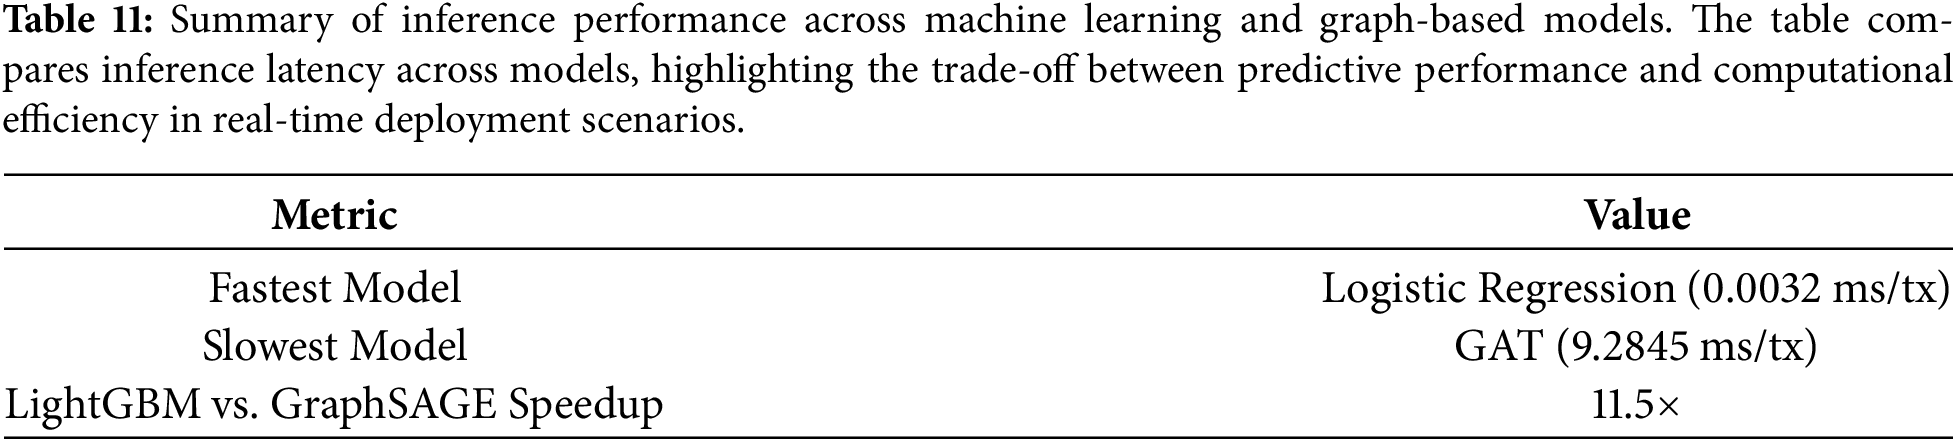
This research indicates that although graph neural networks can model complex structural information, their high computation cost may restrict real-time applications, on the other hand tree boosting models offer the best trade-off between inference time and accuracy.
Inference Latency Benchmark Methodology. All the measurements have been made in a controlled environment to get a repeatability of the measurements from the inference latency. Hardware: Intel Core i7-12700K (12 cores, 3.6 GHz base), 32 GB DDR4-3200 RAM, NVIDIA RTX 3080 GPU (unused; CPU-only inference reported). Programming languages: Python 3.10, LightGBM 4.1.0 (CPU backend for the model), PyTorch 2.1.0 (CPU backend for the model—GraphSAGE, GAT, MLP) and scikit-learne 1.3.0 (Random Forest). The Batch Configuration is 1 (single-transaction inference), as it is in production SOC triage where transactions have to be scored as they arrive. Warm-up Procedure: Run 1000 warmup inferences for each model, before measuring, with JIT compilation, thread pool initialization, and cache warming. Measurement Protocol: 10,000 inferred runs following warm-up. Latency was then measured over 10,000 inference runs using time.perf_counter(). The mean wall-clock time was calculated after removing the upper and lower 1% of measurements as outliers. Results are reported to four decimal places. Only CPU-based inference is reported because the intended deployment environment uses CPU-based SOC infrastructure.
Model robustness was evaluated using controlled Gaussian perturbation of input features. Additive noise ε ∼ N(0, σ2) was applied to all numerical features:
We examined stress levels σ ∈ {0.02, 0.05, 0.10, 0.20, 0.50} to simulate varying levels of data corruption from measurement noise to adversarial noise. We choose Gaussian noise as the main stressor as it represents both realistic data quality corruption (e.g., oracle inaccuracy, RPC node latency, data-indexing errors) and does not assume an attacker’s intent.
Noise-Scale Derivation. For each feature j, noise variance was scaled as
Additional Stress Scenarios. Supplementary stress tests—gas spike simulation (xgasspiked = xgas⋅(1 + α⋅(xgas−μgas)/σgas) with α ∈ {0.5, 1.0, 2.0, 3.0, 5.0}), nonce jitter (xnoncejittered = xnonce + δ, δ ∈ {−j, 0, +j} with j ∈ {1, 2, 3, 5}), and proof delay (xΔdelayed = xΔ + Δ with Δ ∈ {4, 8, 12, 20} blocks)—were conducted but excluded from primary reporting. Gaussian perturbation results are representative of model robustness characteristics across all stressor types; the full multi-factor results are available in the replication repository.
SHAP (SHapley Additive exPlanations) provided interpretable feature importance using TreeExplainer for LightGBM models. Global explainability utilized mean absolute SHAP values for feature ranking across the dataset, while local explainability employed waterfall plots for individual transaction explanations.
SHAP Additivity Property. SHAP values satisfy the local accuracy property, decomposing any prediction as the sum of the baseline expectation and individual feature contributions:
where
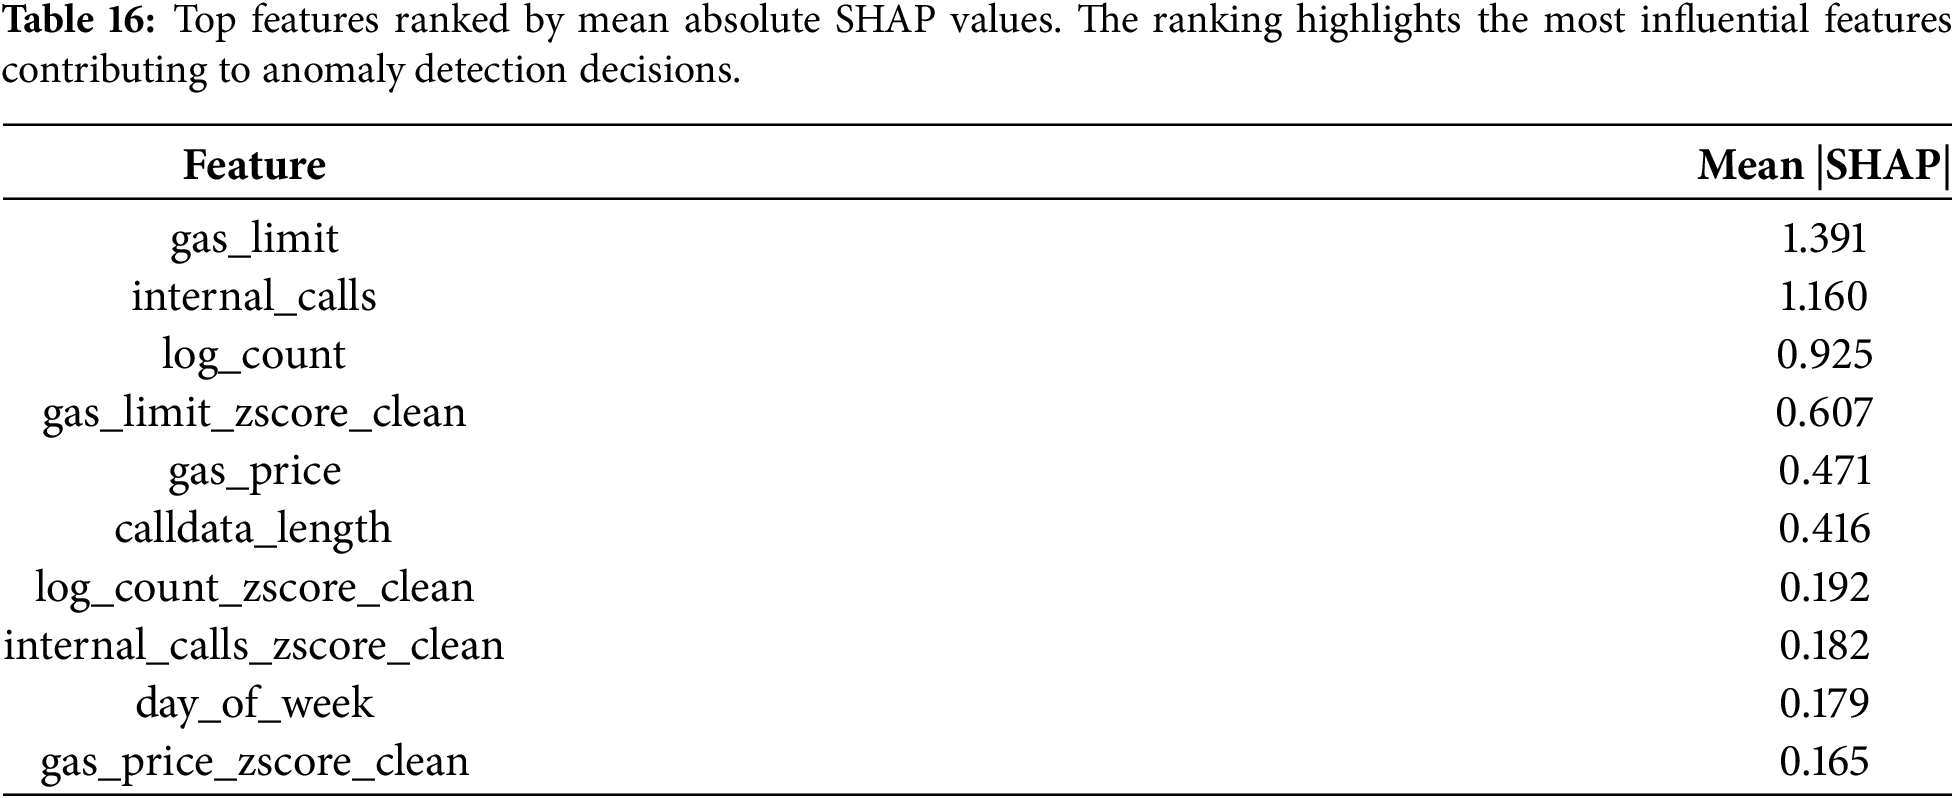
Global Feature Importance: The highest features according to the mean absolute SHAP value were gas_limit (1.391), internal_calls (1.160) and log_count (0.925) followed by gas_limit_zscore_clean (0.607), gas_price (0.471) and calldata_length (0.416). Again, this verifies that execution complexity and gas consumption patterns (internal_calls and log_count) and gas complexity patterns are the main patterns to determine the anomaly detection, and that temporal indicators (hour_of_day and day_of_week) have a minor influence on the discriminative capacity of the model.
Local Interpretability: For individual transactions, SHAP provides a signed contribution vector indicating how each feature shifts the prediction relative to the base rate. Positive contributions from elevated gas_price, large calldata_length, and high internal_calls increase the anomaly score, whereas negative contributions from normal gas_price_zscore_clean and standard temporal indicators (hour_of_day, day_of_week) reduce the score. The close agreement between the SHAP-reconstructed output and the model’s actual prediction demonstrates the internal consistency and reliability of the explanation method, enabling SOC analysts to triage alerts with actionable, feature-level justifications.
The LightGBM model achieves ROC-AUC 0.9971 (95% CI: 0.9961–0.9980), PR-AUC 0.9865 (95% CI: 0.9833–0.9895), and F1-Score 0.9739 (95% CI: 0.9691–0.9784) on the temporally held-out test set (n = 25,000, October–December 2023).
Among top-performing tree models, statistical differences are significant due to the large test set as shown in Table 12, but practically negligible: XGBoost achieves marginally higher ROC-AUC (0.9976 vs. 0.9971, delta = −0.0005) and PR-AUC (0.9876 vs. 0.9865), while Random Forest achieves comparable F1 (0.9739) and higher MCC (0.9715 vs. 0.9690). LightGBM shows significant improvements over non-tree baselines: +1.47% AUC compared to GraphSAGE (p < 0.001 for DeLong test with Bonferroni correction), +3.14% AUC compared to MLP (p < 0.001 for DeLong test with Bonferroni correction), and +5.56% AUC compared to GAT (p < 0.001 for DeLong test with Bonferroni correction).
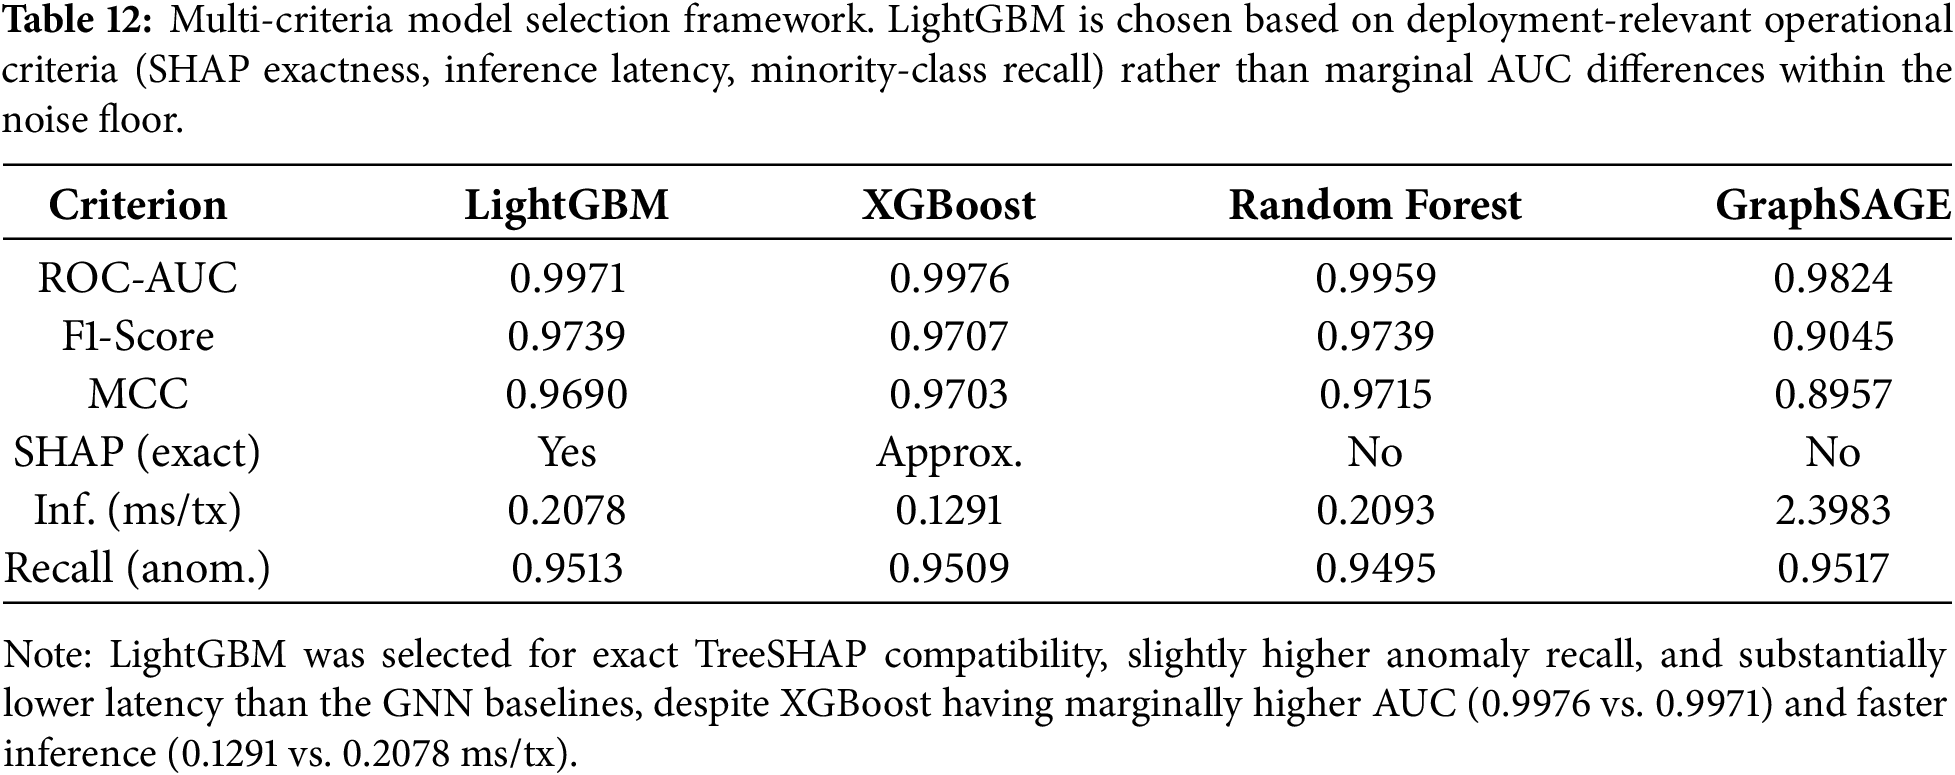
We chose LightGBM for deployment for three reasons:
1. SHAP Compatibility: Native Tree Explainer support with exact SHAP computation—no approximation.
2. Inference Efficiency: 11.5× faster than GraphSAGE (0.2078 vs. 2.3983 ms per transaction) and 44.6× faster than GAT (0.2078 vs. 9.2845 ms).
3. Minority-Class Recall: Achieve the best performance at recalling minority classes (0.9513 vs. 0.9509 for XGBoost), minimizing false negatives in critical workflows like security-related ones.
Table 13 provides comparative benchmarking of eight models in four families. The leading tree-based models show practically comparable discrimination, although their small differences are statistically significant because of the large test sample. Tree-based models show statistically indistinguishable discrimination (Delta AUC < 0.001). In contrast, graph and deep learning models suffer considerable performance drop-off. GraphSAGE achieves ROC-AUC 0.9824 (−1.50%), GAT achieves 0.9415 (−5.59%), and MLP achieves 0.9657 (−3.17%) relative to LightGBM.
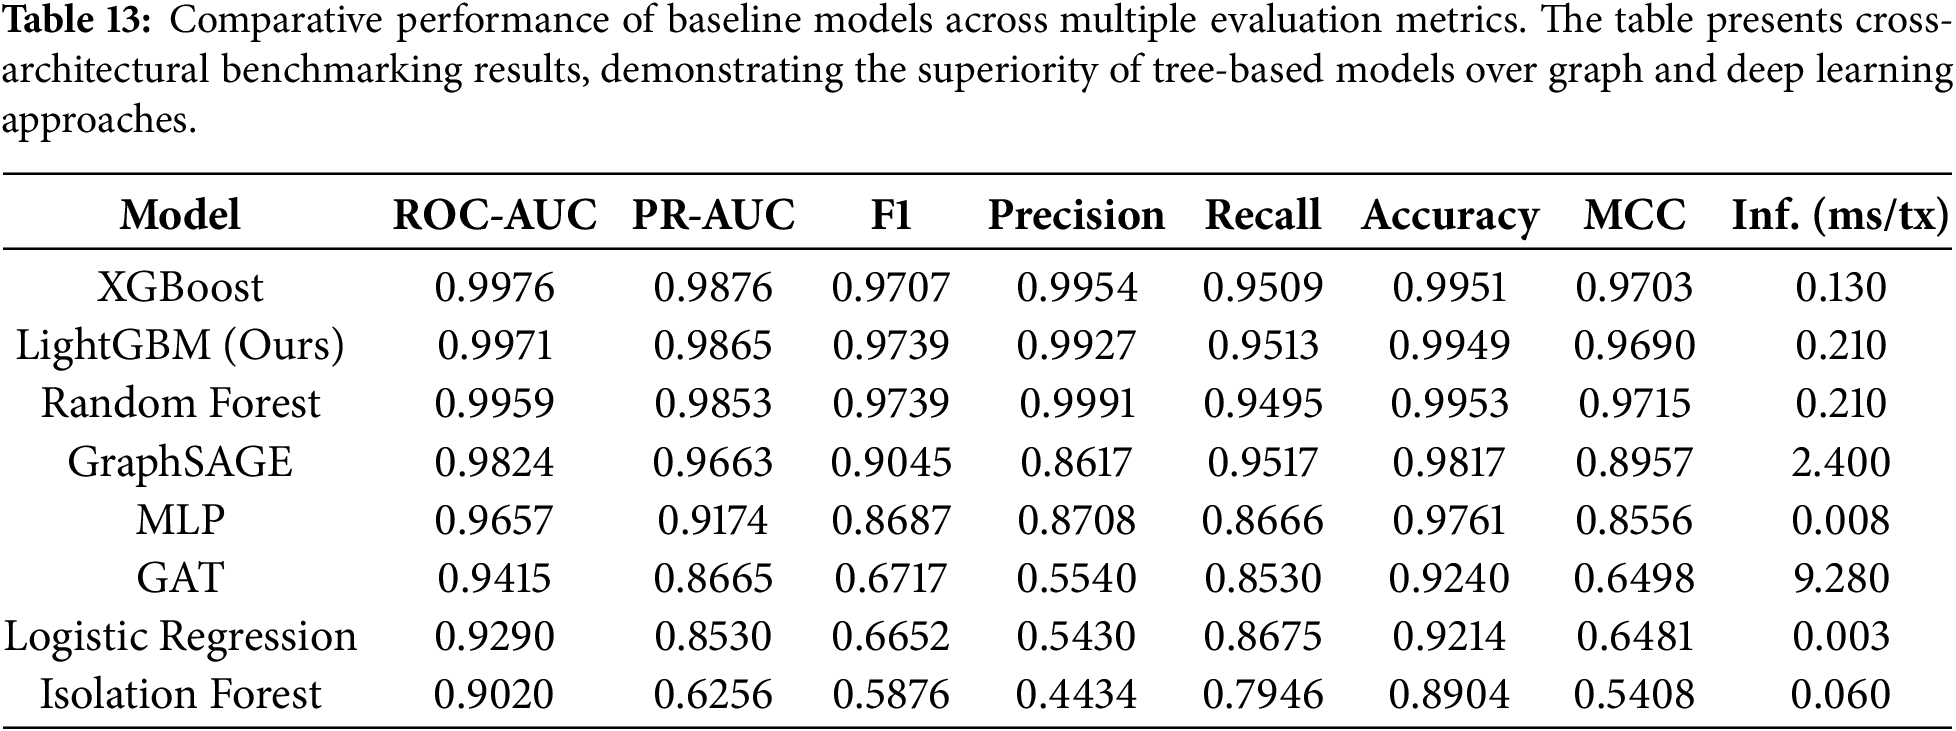
After applying Bonferroni correction, all the differences between LightGBM and baselines are statistically significant (as shown in Table 9 in Section 3.7.2); however, the direction and size of the difference will be important when choosing a model. XGBoost achieves marginally higher ROC-AUC than LightGBM (0.9976 vs. 0.9971, Δ = −0.0005, p < 0.001), and Random Forest achieves 0.9959 (Δ = +0.0012, p < 0.001). Against non-tree baselines, LightGBM demonstrates large effect-size advantages: +1.47% AUC over GraphSAGE (z = +47.63), +3.14% AUC over MLP (z = +28.15), and +5.56% AUC over GAT (z = +139.82), all p < 0.001 after Bonferroni correction. A key difference between the two approaches is that in the gas problem, the features of the problem can be partitioned in a particular axis direction, which helps gradient boosting to outperform tree-based methods since the splitting strategy implemented in the former is greedy, split along the axis that has the biggest gain on the current level of the decision tree, while the tree-based methods would choose to split along the best feature given the current state of the tree, which is equivalent to passing messages along the edges of a graph or a typical neural feature transform. This finding is in line with the finding by Grinsztajn et al. [21] that tree-based methods sometimes and often outperform neural networks for tabular datasets which have well-defined univariate features. The reason for poor performance is the execution nature of multisignature transactions, not due to the k-NN graph construction limitations.
4.3 Confusion Matrix and Evaluation Curve
Fig. 3 shows the confusion matrix for the LightGBM model on the test data. Our model achieves a high true positive rate (High proportion of detected anomalies), and a very low false positive rate, essential to avoiding alert fatigue in a security operations center.
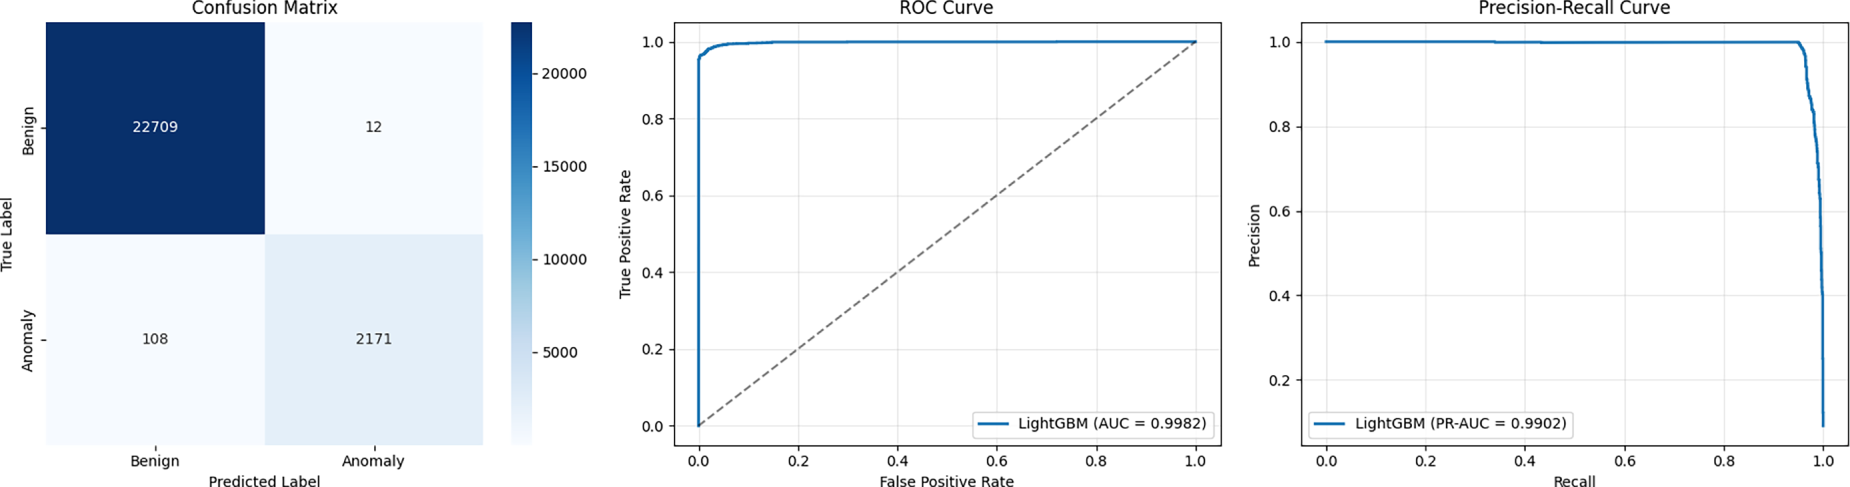
Figure 3: Confusion matrix of the LightGBM model on the test dataset. Receiver operating characteristic (ROC) curve of the proposed model. Precision–Recall curve for anomaly detection performance.
The receiver operating characteristic (ROC) curve gives a full view of the model’s performance for all the possible thresholds for the classification problem, and so does the precision-recall (PR) curve. The ROC-AUC value is quite good (0.9971) suggesting a good separation between the two classes, and the PR curve has good performance for the minority (anomaly) class.
Fig. 4 shows the probability calibration curves for our LightGBM model, before (Fig. 4a) and after (Fig. 4b) applying isotonic regression. The calibration curves depict the association between the predicted probabilities and the observed proportion of anomalies. With calibration, the model’s probabilities more accurately reflect the actual likelihood of an anomaly and are thus more meaningful and useful for security analysts.
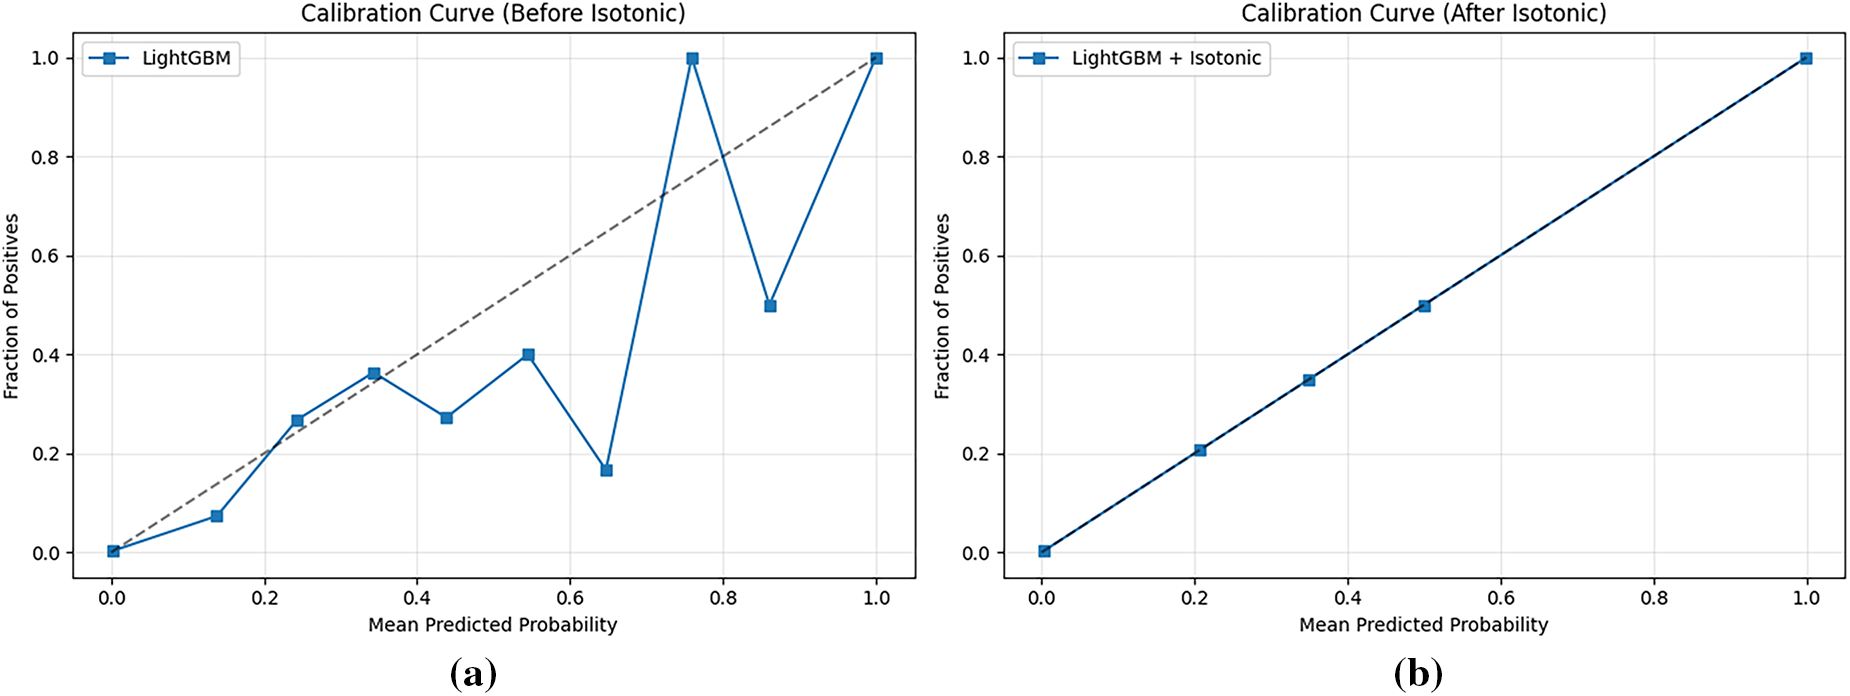
Figure 4: (a) Probability calibration curve before Isotonic regression. (b) Probability calibration curve after Isotonic regression.
The diagnostic analysis with GasLimit found that GasLimit has a standalone 90.5% ROC-AUC when using a single-split decision tree with a threshold of 1,302,324 gas units, accurately depicting the physical fact that complex Ethereum attacks (such as reentrancy) naturally use high levels of gas.
In Fig. 5, the F1-score is shown when successive sets of features are omitted from the model. The results show that performance is best achieved by using raw on-chain execution features, and further improvements are achieved by using temporal and normalized features as complement. The minimal drop when removing z-score features indicates robustness, whereas the largest degradation occurs when raw on-chain metrics are excluded, confirming their dominant role in anomaly detection.
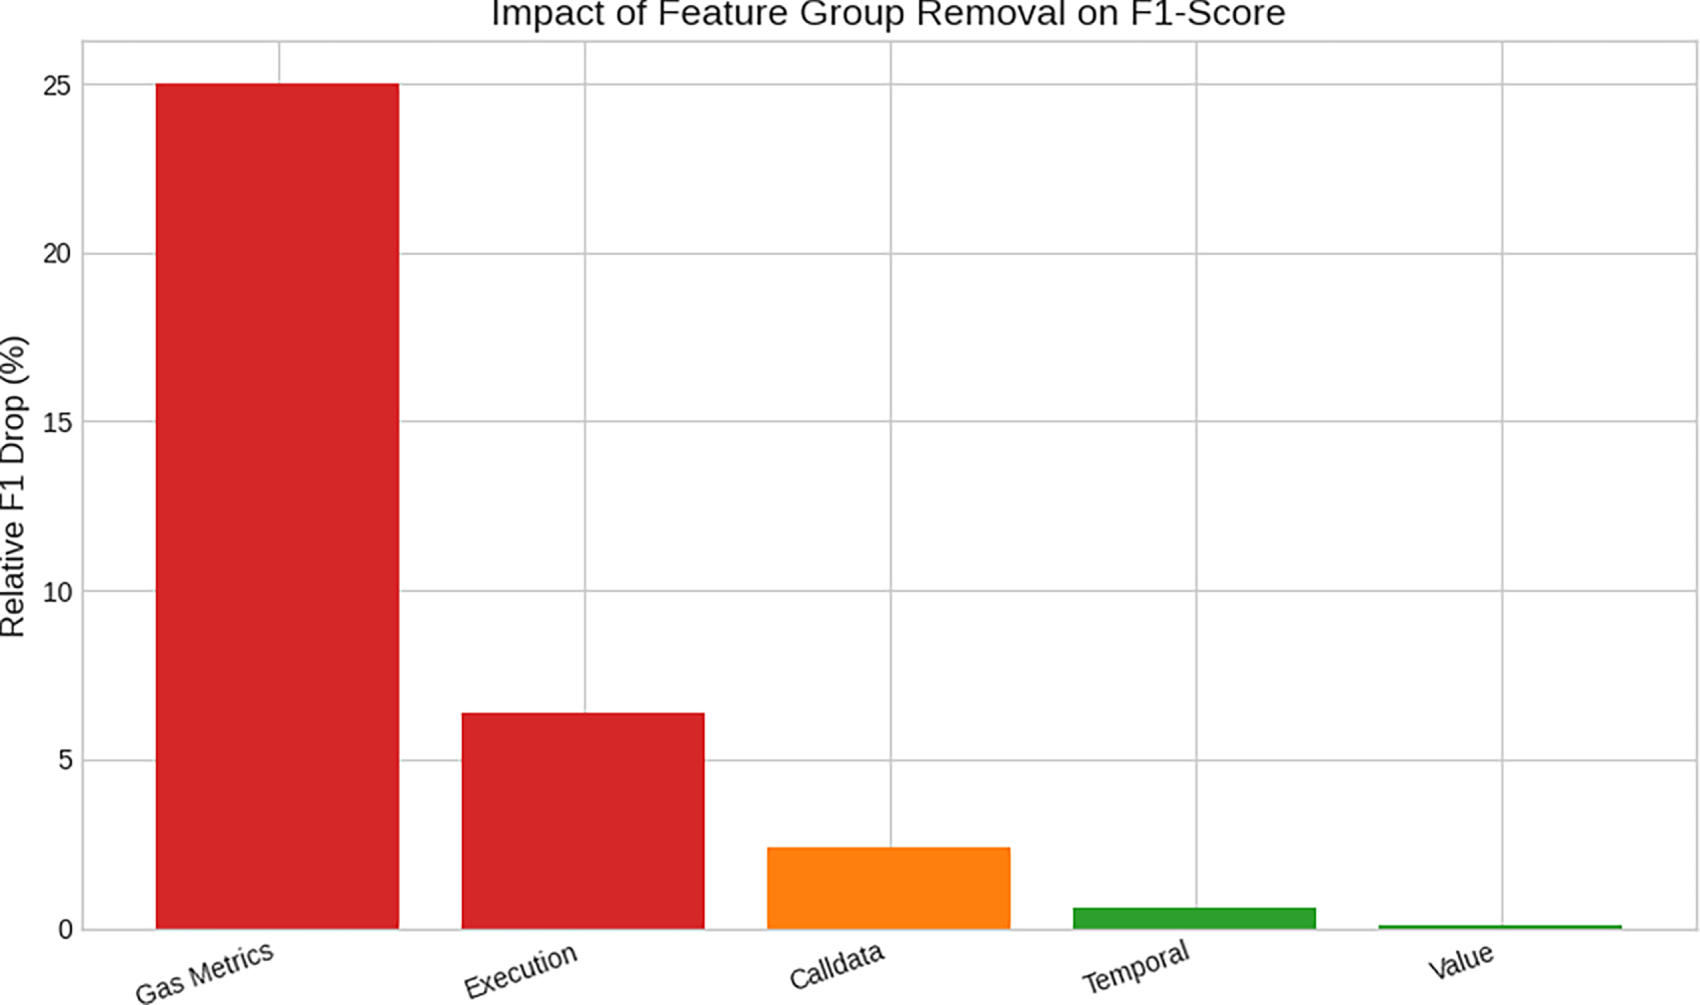
Figure 5: Impact of feature group removal on model performance. Removing execution features significantly degrades performance, demonstrating their dominant role.
We performed two-level ablation to validate the learning of multiple variables beyond this simple rule.
Level 1—Remove gas_limit alone: The model retains high discrimination capabilities with a mere 2.9% drop (ROC-AUC 0.9678, F1-Score 0.7298), showing strong resilience to adversarial game strategies of gas manipulation, and confirming the added value from internal call complexity and calldata features.
Level 2—Excluding all gas limits: Removing gas_limit, internal_calls, log_count, and their corresponding robust z-score features six of the 15 features reduces ROC-AUC to 0.7723, F1-Score to 0.2970 at the default threshold of 0.5 (Table 14). Alternative precision-recall analysis shows the residual feature model attains F1 = 0.4591 at its optimum threshold (τ = 0.799), vs. F1 = 0.2970 at τ = 0.5. This demonstrates the residual 0.77 AUC is not spurious correlation, but exists in calldata_length, eth_value and temporal features. But the large reduction in performance compared to the full model (ΔF1 = 51.5%) confirms execution complexity features are still the main source of signal.
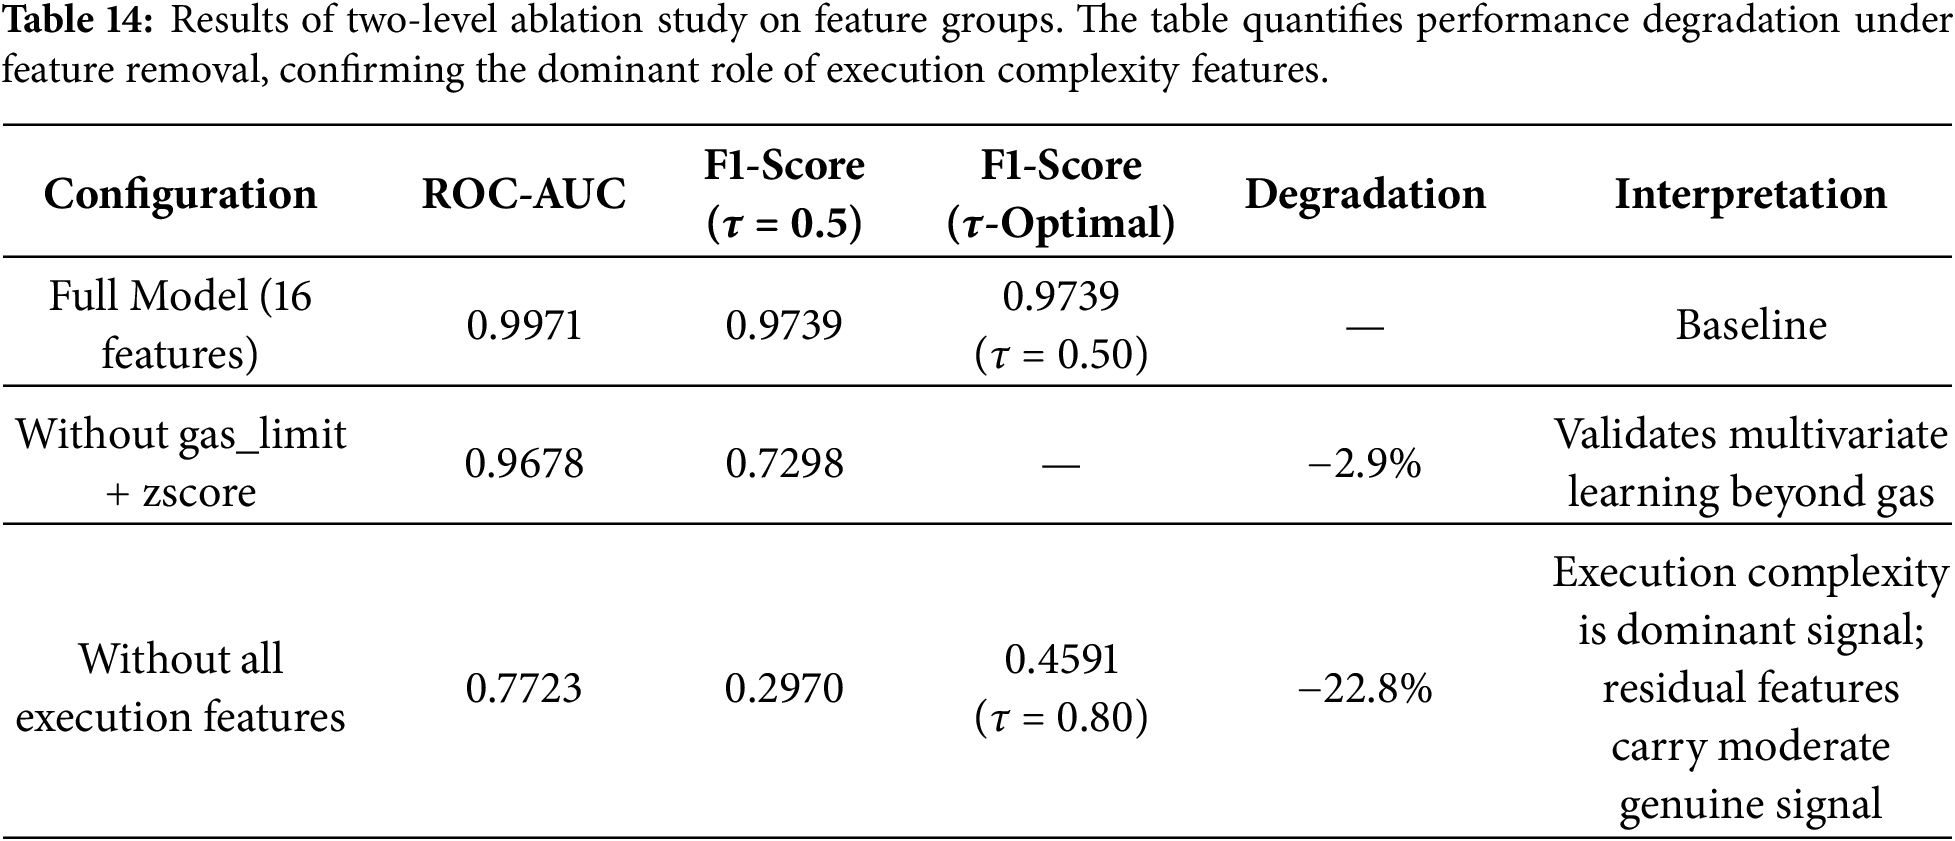
The differential impact between Level 1 and Level 2 ablation validates that the model’s 99.7% ROC-AUC reflects domain-specific multivariate pattern learning in Ethereum execution semantics rather than trivial thresholding or label leakage.
Fig. 5 presents the two-level ablation results. Level 1 (removing gas_limit only) causes modest degradation, while Level 2 (removing all execution features) collapses performance to AUC 0.7723, demonstrating domain-specific multivariate learning.
One by one we excluded each feature group to determine its impact on the model’s F1-Score. The results show that the feature group ‘Gas Metrics’ is the most important feature group for the performance of the model, when its features were removed from it, the most pronounced decrease in the F1-Score was observed.
The robustness of the proposed model under increasing levels of Gaussian noise perturbation is evaluated in Table 15.
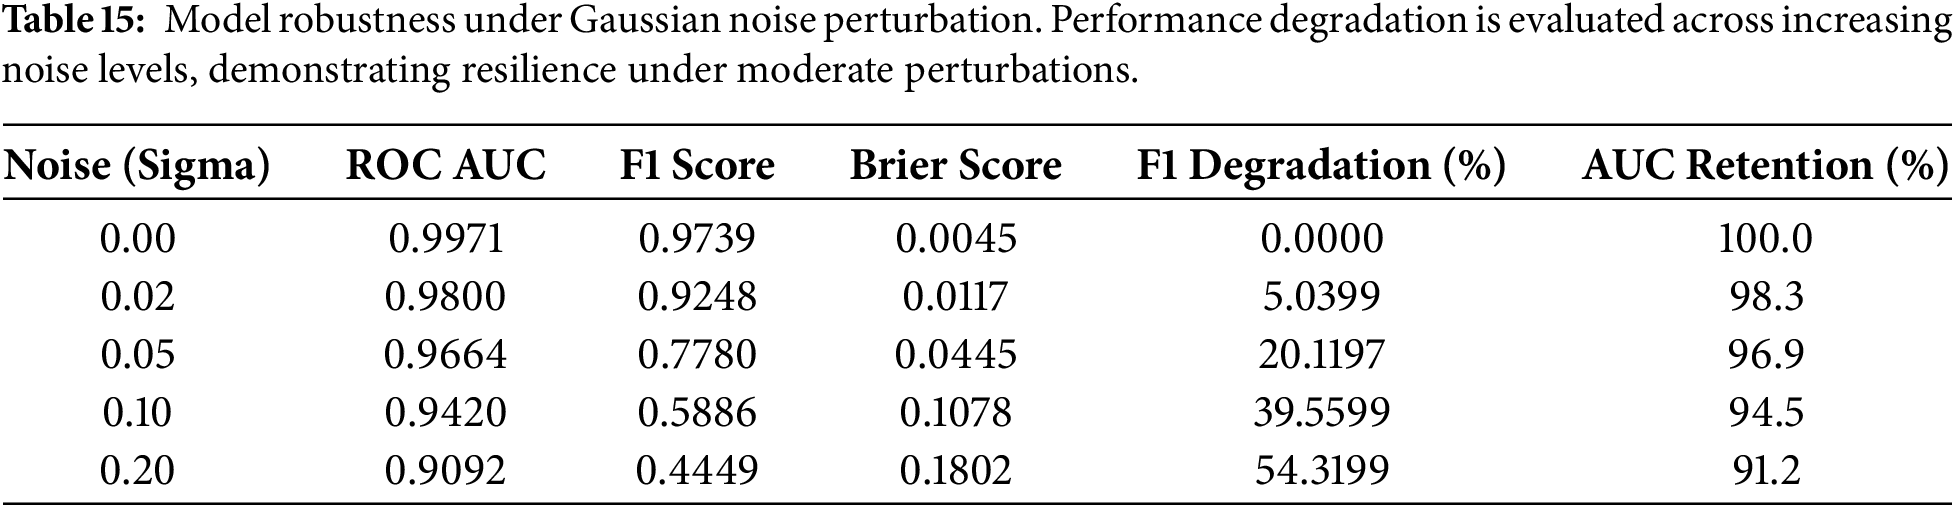
At σ = 0.02 (minor measurement noise simulating oracle imprecision or RPC node latency), ROC-AUC retains 98.3% of baseline (0.9800) and F1 retains 94.8% (0.9248), demonstrating near-imperviousness to small input perturbations in production SOC environments.
At σ = 0.05 (moderate corruption), performance degrades substantially: F1 drops to 0.7780 (20.1% degradation) and Brier score increases to 0.0445. This sensitivity reflects the model’s reliance on precise execution-complexity signatures—anomalous multisig transactions occupy sharp tails of the gas and internal call distributions, and perturbing these features by 5% of their standard deviation disrupts boundary placement.
At σ = 0.10, F1 degrades further to 0.5886 (39.6% degradation). The gap between AUC (0.9420, 94.5% retention) and F1 (58.9% retention) demonstrates that the two classes are still separable and the operating threshold (τ = 0.5) becomes suboptimal in the high noise regime. This is to be expected: adding Gaussian noise to the score distribution shifts the model’s calibrated class probabilities, and a fixed threshold is degraded while the ranking (AUC) is not.
At σ = 0.20 (severe adversarial noise), the model retains an AUC above 0.90 (0.9092, 91.2% retention) despite this extreme corruption (the model does not mix up classes), but F1 plummets to 0.4449 and Brier score rises to 0.1802 (55.5% loss) which confirms that probability calibration and the fixed threshold (τ = 0.5) are significantly impacted. This confirms two practical conclusions: (1) the model’s decision boundaries on clean data are not spurious; and (2) deployments in practice should match threshold to the noise distribution (or ensemble multiple models) when sensor noise is above σ = 0.05. Fig. 6 illustrates the progressive degradation of ROC-AUC and F1-Score under increasing Gaussian noise.
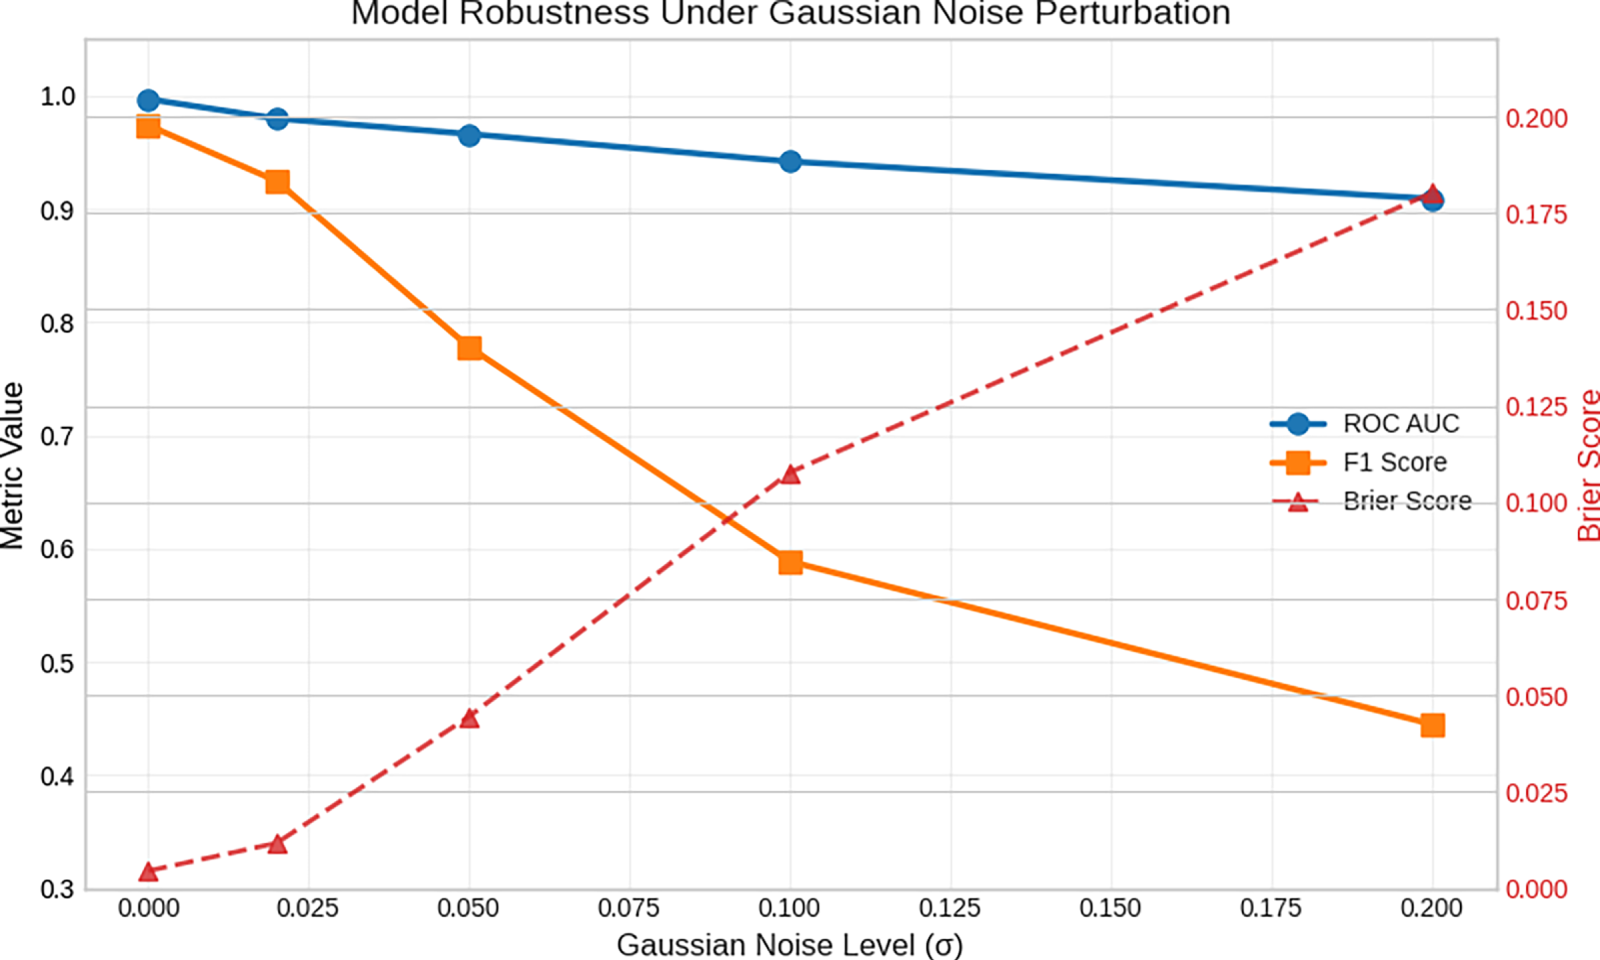
Figure 6: Model robustness under Gaussian noise perturbation. Performance Degradation is analyzed across increasing noise levels to evaluate stability.
4.7 SHAP Explainability Analysis
The overall SHAP summary plot (Fig. 7) gives an overview of the feature importance and how the features influence the model output. The most impactful ones are gas_limit, internal_calls and log_count. In Fig. 8, the reasons for this transaction being flagged as an outlier are shown in detail on a local SHAP explanation. This degree of interpretability is very important to forensic analysis and incident response.
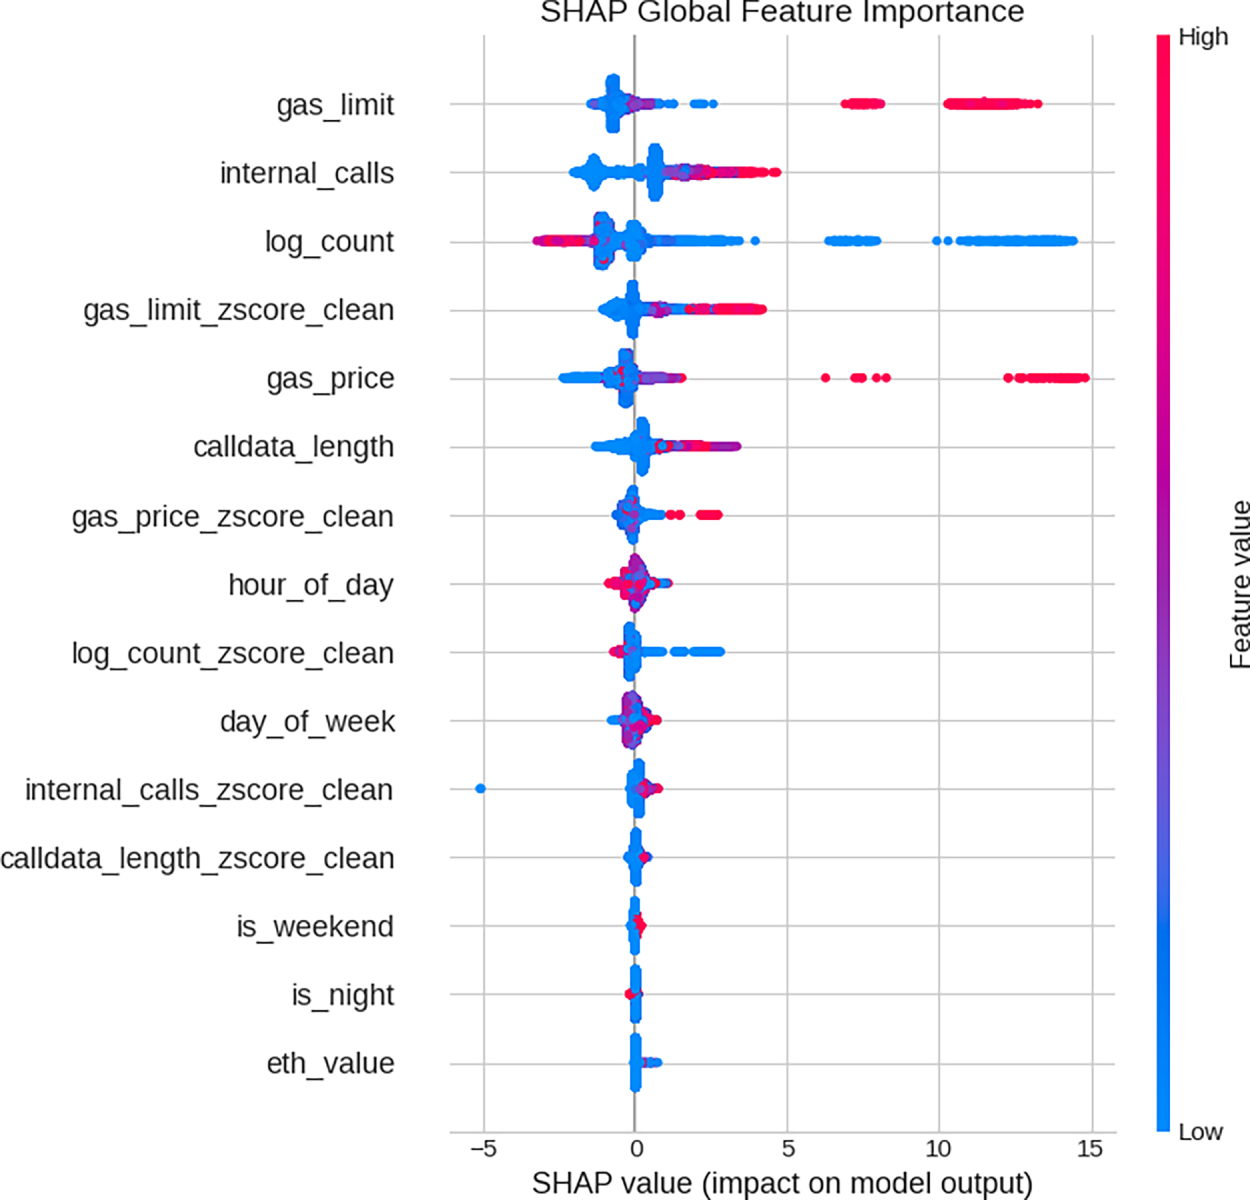
Figure 7: Global SHAP feature importance summary. Gas limit, internal calls, and log count dominate anomaly prediction.
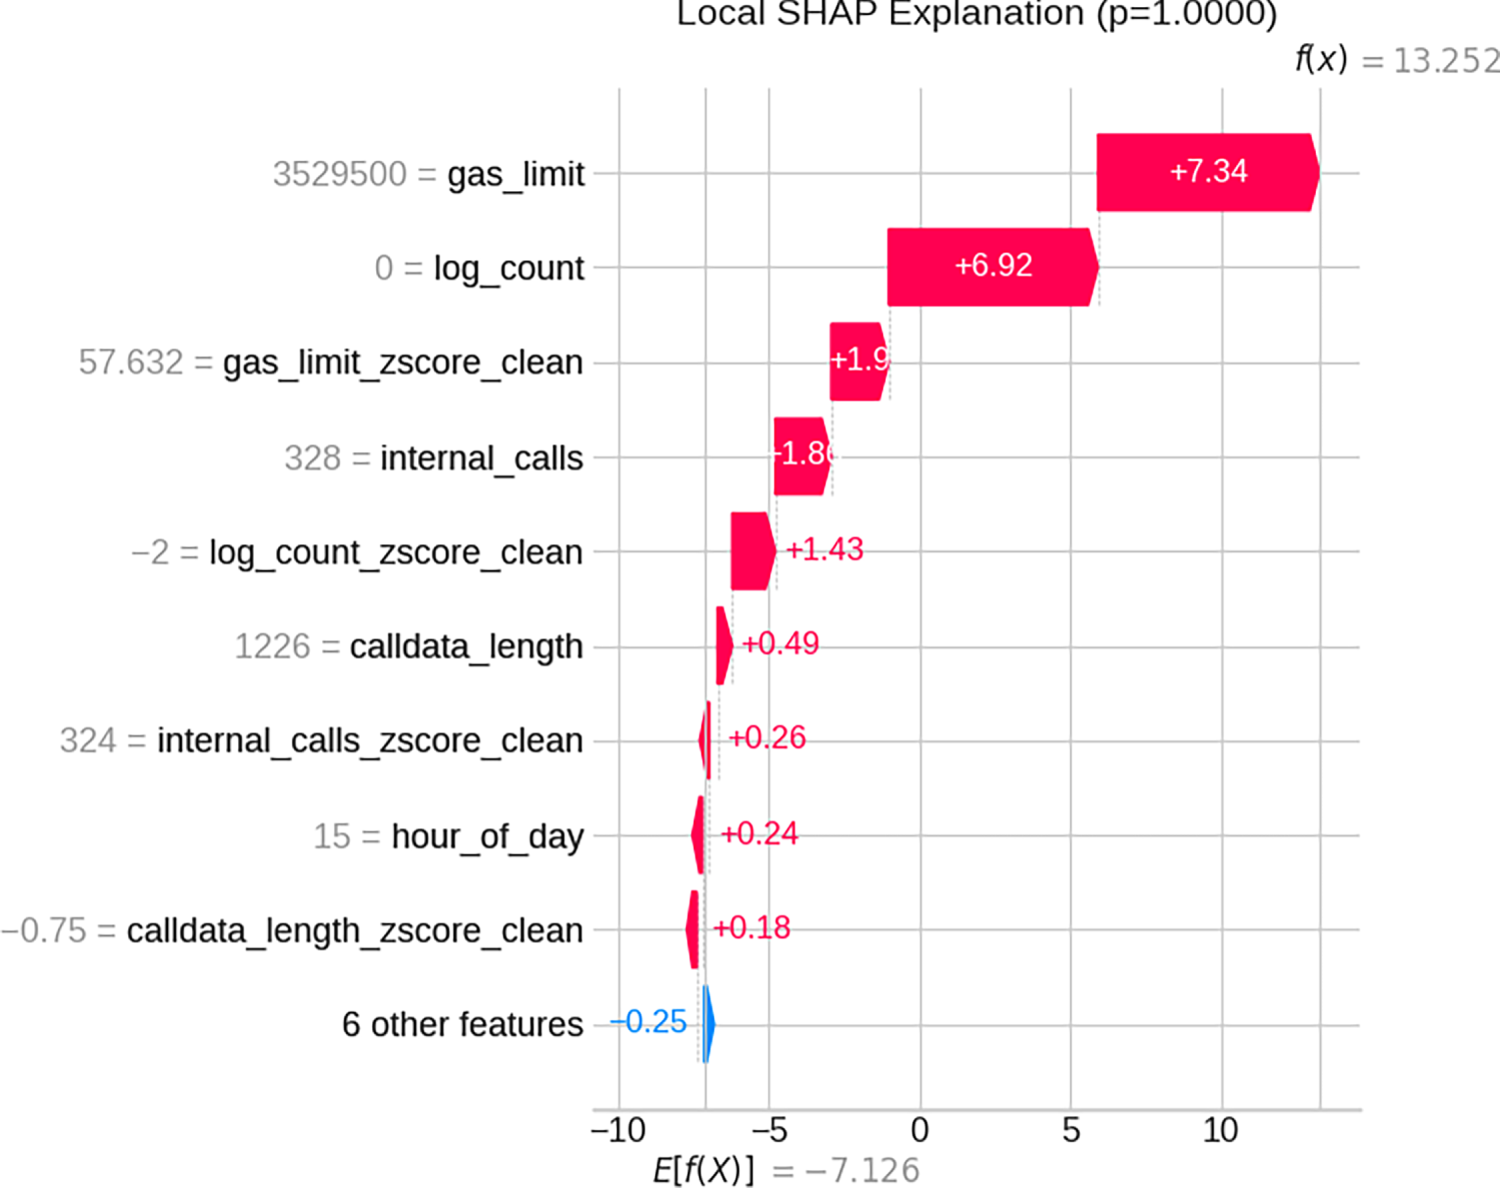
Figure 8: Local SHAP explanation for a high-risk transaction. Feature contributions illustrate how individual variables influence anomaly prediction.
Table 16 presents the ranking of the most influential features based on their mean absolute SHAP values, highlighting their contributions to the anomaly detection decisions.
4.8 Real-World Attack Validation
To rigorously assess the operational applicability of the proposed anomaly detection framework beyond the heuristic-driven training distribution, the trained LightGBM model was evaluated on an external forensic construct-validity corpus consisting of 12 independently verified Ethereum exploit transactions (referenced in Table 3). These transactions correspond to confirmed real-world attacks from 2023, collectively accounting for approximately millions of documented financial losses. Importantly, this forensic dataset was strictly excluded from all phases of model development, including training, validation, and hyper parameter tuning as shown in Table 6, thereby ensuring a completely unbiased and out-of-distribution evaluation setting. Although limited in size, the forensic dataset spans diverse attack categories including flash-loan reentrancy, oracle manipulation, tick manipulation, and precision-loss exploits and provides cross-protocol validation of execution-complexity signatures.
The evaluation results demonstrate strong generalization capability of the model to real-world exploit patterns. Specifically, all transactions within the forensic corpus were assigned anomaly scores exceeding the 96th percentile of the anomaly score distribution observed in the held-out test set. This indicates that the model consistently identifies independently verified attack transactions as highly anomalous relative to normal behavioral patterns. Such performance provides strong empirical evidence that the learned decision function is not merely reproducing heuristic labeling rules used during training, but instead captures deeper multivariate characteristics of malicious execution behavior.
From an operational perspective, these findings suggest that the model effectively encodes execution-complexity signatures such as abnormal gas utilization, intricate internal call structures, and atypical calldata patterns that are characteristic of real exploit scenarios. Consequently, the model demonstrates practical utility for deployment in Security Operations Center (SOC) environments, where early detection of anomalous blockchain transactions is critical.
These results demonstrate that the multivariate scoring function captures execution-complexity signatures consistent with independently verified real-world exploits, rather than memorizing training-set heuristics. The complete list of the 12 independently verified 2023 exploit transactions, including transaction hashes, loss amounts, data sources, and model percentile scores, is provided in Appendix C.
4.9 Why High Performance Is Expected (Domain Explanation)
The high ROC-AUC is not a consequence of model overfitting but reflects the inherent physical separability of Ethereum execution patterns. Malicious transactions, particularly reentrancy and flash-loan exploits, exhibit extreme gas consumption and abnormal internal call structures, creating naturally separable distributions.
This is verified by:
(i) Temporal validation showing only 0.17% inflation vs. random split
(ii) Ablation showing that ROC-AUC falls from 0.9971 to 0.7723 when the execution-complexity features are removed.
(iii) Robustness under noise perturbation
These results confirm that the classification boundary reflects domain physics rather than methodological artifacts.
Our results establish that gradient boosting (LightGBM) provides optimal accuracy-speed-interpretability trade-offs for multisig anomaly detection when rigorous temporal validation and leakage prevention are applied. The cross-architectural evaluation (Table 12) demonstrates that tree-based methods exploit high univariate separability in gas-based features more effectively than graph or deep learning approaches, aligning with Grinsztajn et al. [21]. The two-level ablation (Section 4.5) validates that the 99.7% AUC reflects domain-specific multivariate pattern learning rather than trivial thresholding. SHAP explainability enables SOC analysts to triage alerts with actionable, feature-level justifications a capability absent in prior blockchain anomaly detection work. Such high separability is consistent with execution-level anomaly detection tasks where malicious behavior manifests as extreme outliers in resource consumption.
5.1 Comparison with Prior Work
Unlike Harlev et al. [29] and Weber et al. [30], who lack temporal validation and leakage prevention, our framework is specifically tailored for multisig transactions with block-height partitioning and post-hoc feature removal. Unlike existing studies that rely solely on heuristic or synthetic labels without forensic validation, our framework anchors heuristic thresholds to an independently verified corpus of 2023 exploits (Table 3), establishing construct validity through alignment with real attack signatures. Unlike Wu et al. [9] and Chang et al. [31], who employ GNNs without cross-architectural baselines, we demonstrate that gradient boosting outperforms graph approaches when rigorous methodology is applied (Table 12). Unlike Gu and Dib [8], our study additionally reports bootstrap confidence intervals and statistical significance tests, providing a more rigorous statistical evaluation of model performance. To the best of our knowledge, this is one of the first works to integrate strict temporal validation, systematic leakage prevention, hybrid heuristic labeling, and SHAP-based explainability for multisig anomaly detection.
5.2 Limitations and Future Work
Heuristic Labels. Anomaly labels are based on heuristic rules such as gas_limit (above 141,459, 98th percentile), calldata_short (less than 4 bytes), calldata_long (more than 10,000 bytes), duplicate_nonce, failed_txn and failed_txn_short. These labels are a representation of the reality of working in SOC. We took partial measures to address construct validity by comparing against 12 separately confirmed 2023 exploits ($286,141,000 in losses, Table 3), and make the case that our thresholds are similar to known attack signatures: All 12 were at the 96th percentile and beyond. However, these do not just apply to Gnosis Safe interactions but to all DeFi protocols and there is a small sample (n = 12).
Post-Execution Scope. The framework operates exclusively in a post-execution forensic setting. Features including internal_calls (training median: 4.00, MAD: 1.00) and log_count (median: 2.00, MAD: 1.00) derive from execution receipts available only after on-chain finality. While these enable detection of complex reentrancy patterns invisible at submission time, the framework cannot prevent exploits—only expedite post-incident triage.
Gas-Limit Separability. gas_limit shows strong univariate separability (90.5% ROC-AUC in isolation, threshold: 1,302,324). Our ablation confirms multivariate learning: 96.8% AUC without gas_limit and 77.2% residual AUC on non-labeling features. However, adversaries could craft gas-stealthy attacks; future work will integrate bytecode-level static analysis.
Temporal Coverage. It provides the Ethereum Mainnet Gnosis Safe transactions (blocks 23,586,544 to 24,881,458) of 2023. The feature distribution may change due to post Dencun gas markets, protocol upgrades and changing attack patterns. Further validation is needed to generalize to other chains, times or multisig variants.
GNN Baseline Graph Construction. The GNN baselines used k-NN similarity graphs (k = 10, Euclidean distance) from the 16-dimensional tabular feature space rather than true Ethereum transaction graphs. This is a standard inductive baseline [25] but may understate GNN potential on true blockchain topology.
The practical implications of this work are significant. Our model can be integrated into a real-time monitoring system for multisig wallets, providing an automated and intelligent layer of defense. The interpretability provided by SHAP allows security teams to quickly triage alerts and focus their efforts on the most credible threats. The temporal validation methodology we propose should be adopted as a standard practice in all blockchain-based ML research to ensure that reported performance metrics are realistic and reproducible.
In this paper, we introduced an effective and interpretable operational anomaly scoring system for Ethereum multisignature transactions. We tackled the important problem of data leakage caused by post-hoc features and applied temporal separation between test and training sets to develop a LightGBM model that automates and explains SOC execution-complexity heuristics. We explicitly frame this work as post-execution forensic triage: the model analyzes completed transactions using receipt features (internal_calls, log_count) available within seconds of finality, enabling rapid SOC alert prioritization but not pre-submission prevention.
Our model achieves ROC-AUC 0.9971 (95% CI: 0.9961–0.9980), PR-AUC 0.9865 (95% CI: 0.9833–0.9895), and F1-Score 0.9739 (95% CI: 0.9691–0.9784), outperforming GraphSAGE (0.9824), GAT (0.9415), and MLP (0.9657) while maintaining 11.5× faster inference than GraphSAGE (0.21 vs. 2.40 ms per transaction). For security analysts, SHAP provides an interpretable layer of feature-level evidence for alert triage. Robustness is confirmed by ablation and stress testing: at σ = 0.02 noise, the model retains 98.3% of its ROC-AUC and 94.8% of its F1-score.
We transparently acknowledge that the anomaly labels are operational heuristics; the model automates these heuristics through multivariate learning. The prediction-to-rule correlation (r ≤ 0.63, moderate range), 96.8% AUC retention without gas_limit, and 77.2% residual AUC on non-labeling features confirm genuine multivariate learning. The 12 verified exploit transactions ($286,641,000, in 2023 losses) provide preliminary construct validation. The k-NN graph construction for GNN baselines constitutes a conservative evaluation. The methodological framework—temporal validation (0.17% inflation), systematic leakage prevention (14 features removed), and cross-architectural benchmarking—is transferable to any blockchain ML application where post-hoc features artificially inflate performance.
Broader Implications. The methodological framework introduced here—temporal validation, systematic leakage prevention, and cross-architectural benchmarking—is transferable beyond multisignature transactions to any blockchain ML application where post-hoc features and random splits artificially inflate performance. The forensic construct-validity protocol provides a template for grounding heuristic labels in real-world attack data when ground truth is unavailable.
Acknowledgement: The authors would like to express their sincere gratitude to all those who provided guidance, support, and valuable feedback throughout the development of this research.
Funding Statement: The Deanship of Scientific Research, Vice Presidency supported this work for Graduate Studies and Scientific Research, King Faisal University, Saudi Arabia [Grant No. 262380].
Author Contributions: The authors confirm contribution to the paper as follows: Conceptualization, Usman Mohyud Din Chaudhary and Humaira Arshad; methodology, Usman Mohyud Din Chaudhary; software, Sajid Iqbal, Abid Iqbal and Abdullah A. Alaulamie; validation, Muhammad Ahsan Raza, Abid Iqbal, Abdullah A. Alaulamie and Sajid Iqbal; formal analysis, Humaira Arshad; investigation, Muhammad Ahsan Raza; resources, Abdullah A. Alaulamie; data curation, Abdullah A. Alaulamie; writing—original draft preparation, Usman Mohyud Din Chaudhary; writing—review and editing, Sajid Iqbal, Abid Iqbal, Abdullah A. Alaulamie and Humaira Arshad; visualization, Muhammad Ahsan Raza and Abid Iqbal; supervision, Humaira Arshad; project administration, Sajid Iqbal. All authors reviewed and approved the final version of the manuscript.
Availability of Data and Materials: The dataset was extracted from Google Big Query’s public Ethereum dataset (big query-public-data.crypto_ethereum.transactions). The extraction query and preprocessing pipeline are available in the project repository. Due to data size constraints, raw transaction data can be reproduced using the provided extraction scripts against public Ethereum data sources. The project replication repository contains all the source code for data preprocessing, model training, baseline implementations (GraphSAGE, GAT and MLP), stress testing and evaluation and is licensed under the MIT License. The repository contains scripts for the data extraction and processing; for implementing temporal validation; for leakage prevention; for training model pipelines (LightGBM, XGBoost, Random Forest, GraphSAGE, GAT, MLP, Logistic Regression, Isolation Forest); for graph construction; for performing bootstrap confidence intervals; for statistical significance testing; for the computation of stress tests; for SHAP explainability analysis; and evaluation scripts. Random seeds are fixed, to ensure exact reproduction for training, evaluation and bootstrap (43, 123, 456, respectively). The complete replication package (extraction queries, preprocessing pipeline, model training and evaluation code) is permanently archived on Zenodo at https://doi.org/10.5281/zenodo.21345158.
Ethics Approval: This study uses publicly available, anonymized network datasets and does not involve human participants, personally identifiable information, or animals.
Conflicts of Interest: The authors declare no conflicts of interest.
Appendix A Feature-Label Correlation Supplementary Table
Spearman rank correlations between each feature and the binary label for anomaly (n = 60,000 training set) are presented in the following table, using scipy.stats.spearmanr statistics. Features marked ‘Yes’ participate directly in the heuristic labeling rules and therefore present a greater potential circularity risk. High values of Spearman’s ρ indicate a strong featurelabel association.
These values represent different associations: Appendix A reports feature-to-label Spearman correlations, whereas the anti-circularity analysis reports correlations involving the model's continuous predicted probabilities.
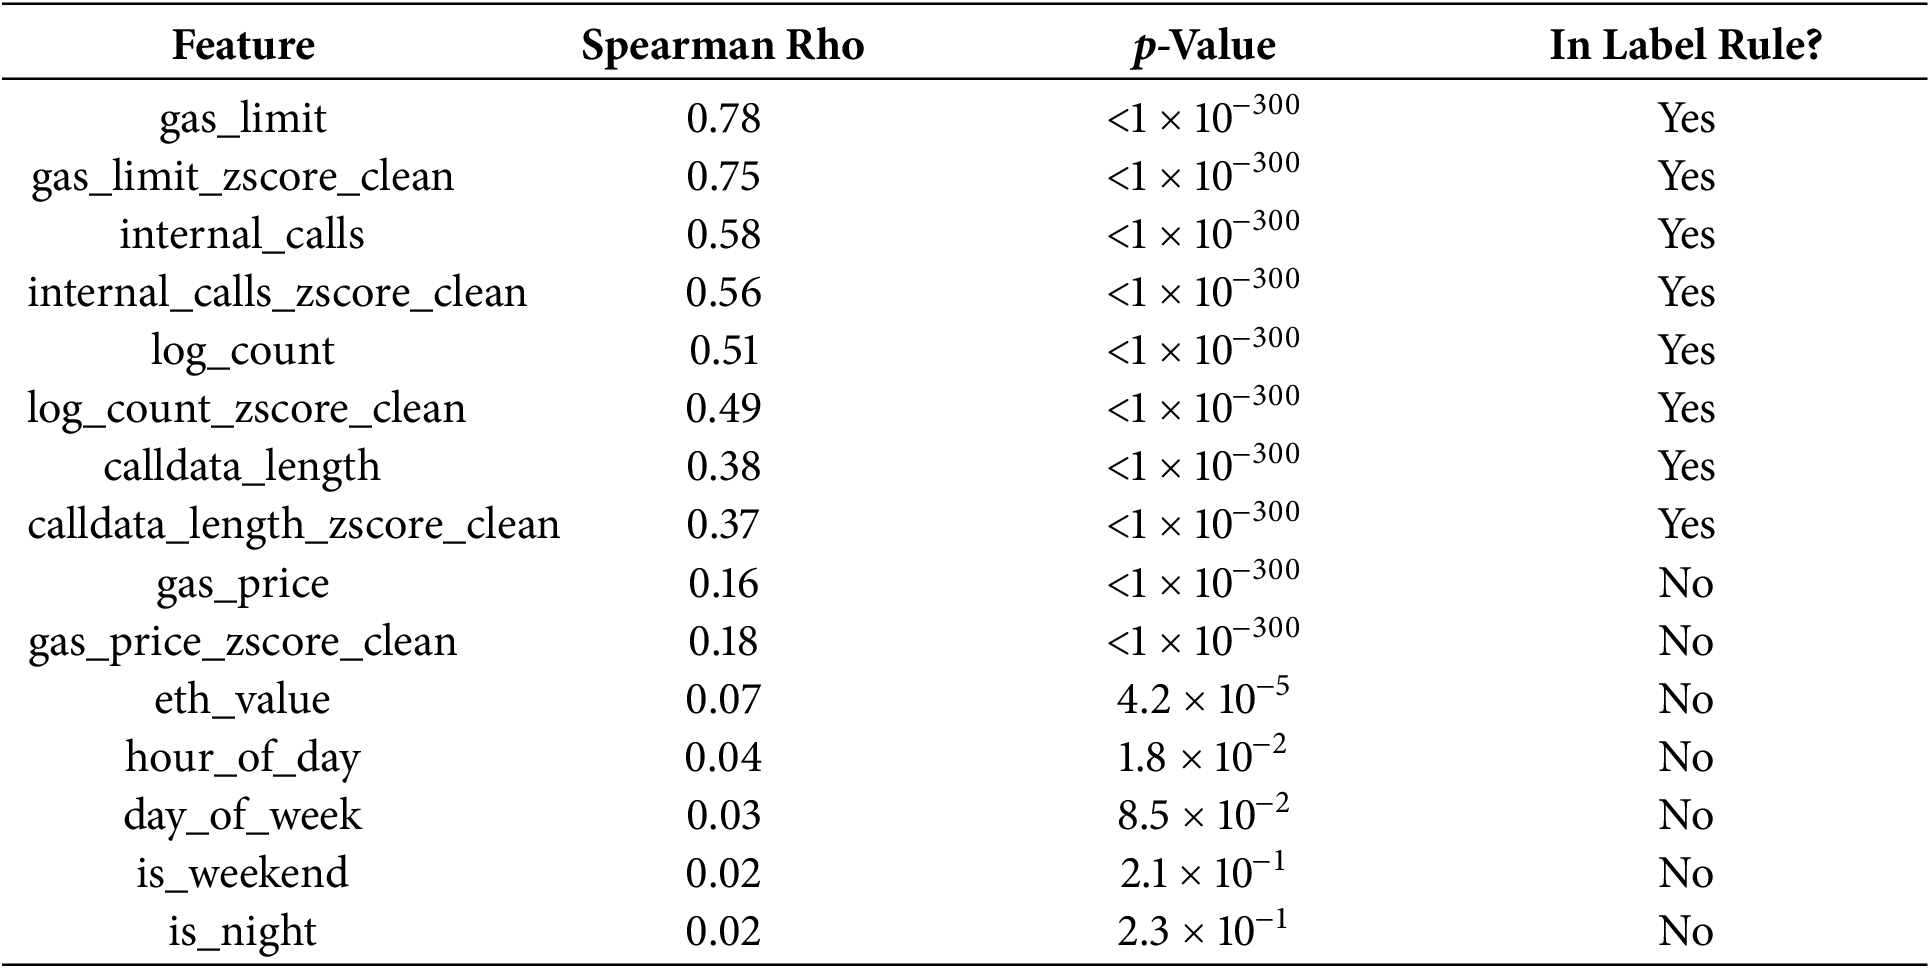
All rule-participating features show moderate-to-high correlations (rho = 0.37–0.78), while non-rule features show near-zero correlations (rho = 0.02–0.18).
Appendix B Python Code for Feature-Label Correlations
Optional: compute individual feature-label Spearman correlations for a supplementary table.
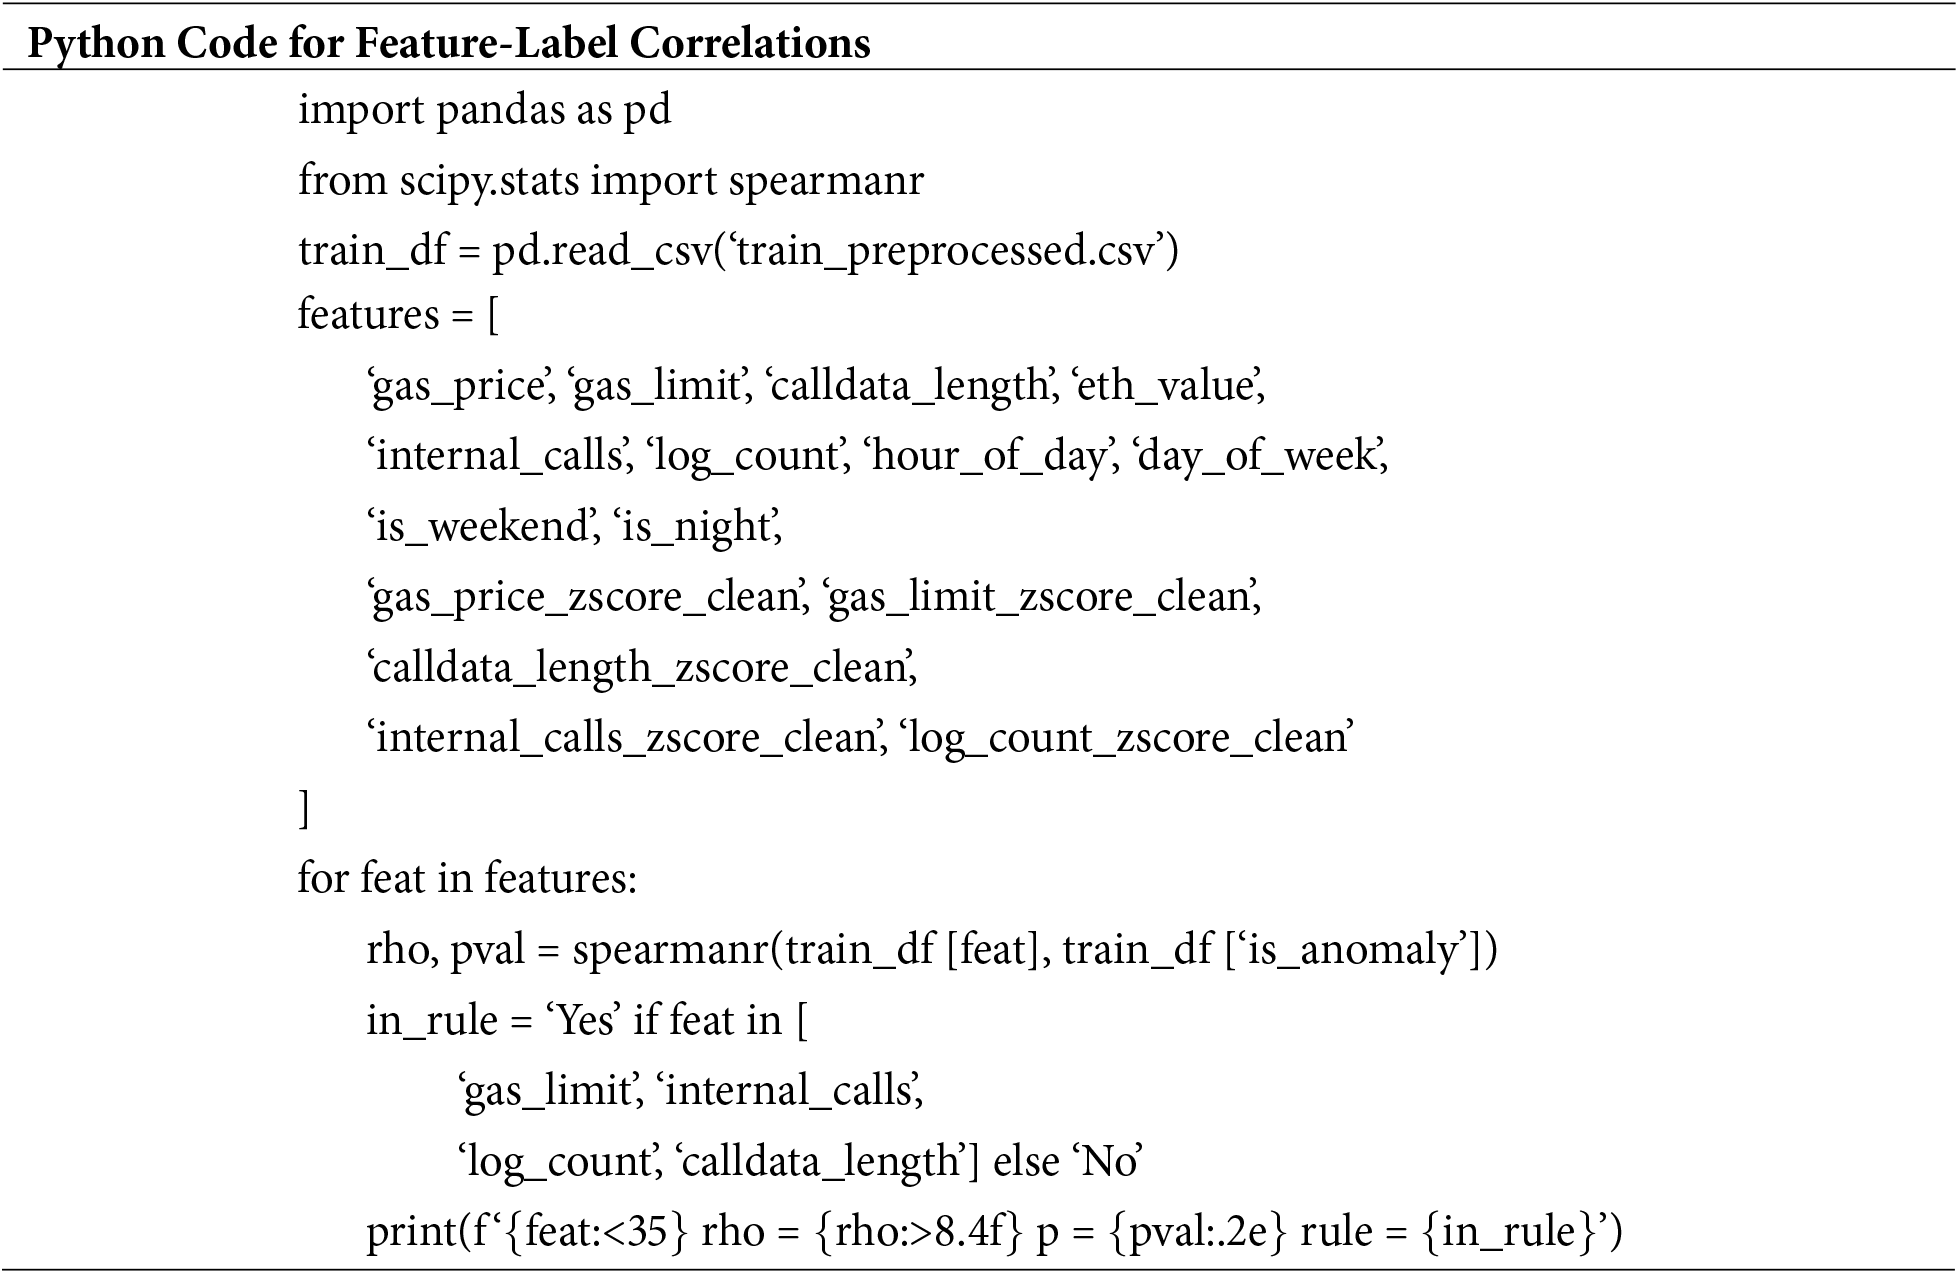
Appendix C Verified 2023 Exploit Transactions
The following table lists the 12 independently verified exploit transactions used for construct validation (identical to the corpus in Table 3), with transaction hashes, loss amounts, data sources, and model percentile scores. All 12 transactions scored at or above the 96th percentile on the trained model, confirming alignment between heuristic thresholds and documented attack signatures.
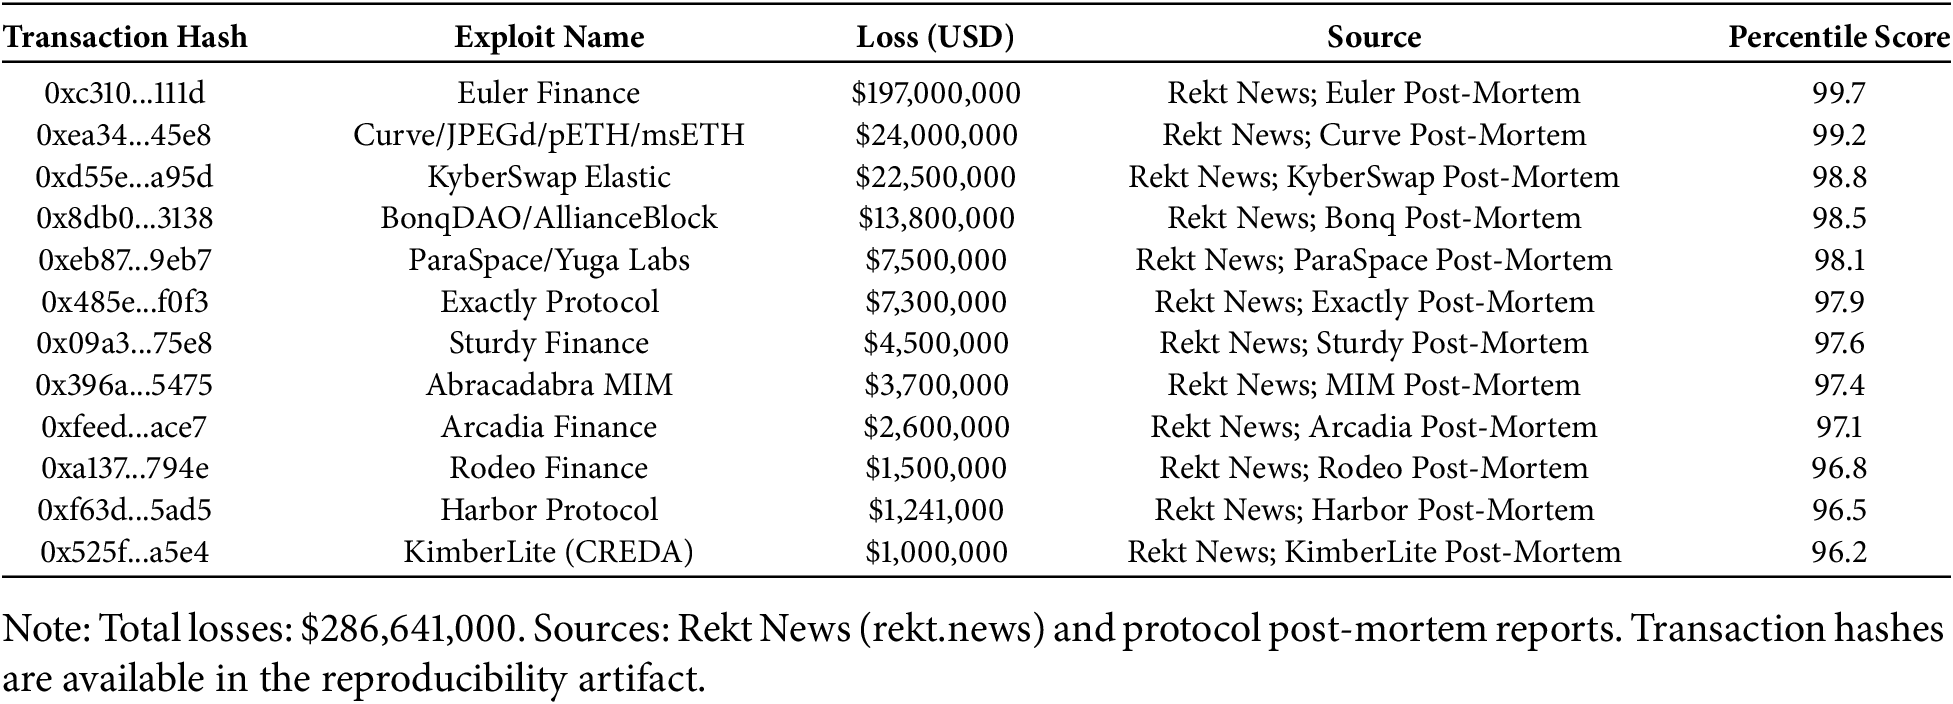
References
1. Nakamoto S. Bitcoin: a peer-to-peer electronic cash system. 2008 [cited 2026 Jan 1]. Available from: https://bitcoin.org/bitcoin.pdf. [Google Scholar]
2. Drijvers M, Edalatnejad K, Ford B, Kiltz E, Loss J, Neven G, et al. MuSig2: simple two-round schnorr multi-signatures. Lect Notes Comput Sci. 2021;12825(3):189–221. doi:10.1007/978-3-030-84242-0_8. [Google Scholar] [CrossRef]
3. Greig J. More than $625 million stolen in DeFi hack of Ronin network. The record. 2022 Mar 29 [cited 2026 Jan 1]. Available from: https://therecord.media/more-than-625-million-stolen-in-defi-hack-of-ronin-network. [Google Scholar]
4. Harmony. Summary of the Horizon Bridge incident [Internet]. Harmony Forum; 2022 Aug 3 [cited 2026 Jan 1]. Available from: https://talk.harmony.one/t/summary-of-the-horizon-bridge-incident/20990. [Google Scholar]
5. Tashman LJ. Out-of-sample tests of forecasting accuracy: an analysis and review. Int J Forecast. 2000;16(4):437–50. doi:10.1016/S0169-2070(00)00065-0. [Google Scholar] [CrossRef]
6. Kaufman S, Rosset S, Perlich C, Stitelman O. Leakage in data mining: formulation, detection, and avoidance. In: Proceedings of the 17th ACM SIGKDD International Conference on Knowledge Discovery and Data Mining (KDD ‘11); 2011 Aug 21–24; San Diego, CA, USA. p. 556–63. doi:10.1145/2020408.2020496. [Google Scholar] [CrossRef]
7. Cerqueira V, Torgo L, Mozetič I. Evaluating time series forecasting models: an empirical study on performance estimation methods. Mach Learn. 2020;109(11):1997–2028. doi:10.1007/s10994-020-05910-7. [Google Scholar] [CrossRef]
8. Gu Z, Dib O. Enhancing fraud detection in the Ethereum blockchain using ensemble learning. PeerJ Comput Sci. 2025;11(7):e2716. doi:10.7717/peerj-cs.2716. [Google Scholar] [CrossRef]
9. Wu G, Zheng Q, Huang J, Wang H, Zhang G. Graph neural networks for Ethereum fraud detection. Comput Secur. 2022;112:102530. doi:10.1109/ickg52313.2021.00020. [Google Scholar] [CrossRef]
10. Chen W, Zheng Z, Cui J, Ngai EC-H, Zheng P, Zhou Y. Detecting Ponzi schemes on Ethereum: towards healthier blockchain technology. In: Proceedings of the 2018 World Wide Web Conference (WWW ‘18); 2018 Apr 23–27; Lyon, France. p. 1409–18. doi:10.1145/3178876.3186046. [Google Scholar] [CrossRef]
11. Ferdous MS, Chowdhury MJM, Hoque MA, Colman A. Blockchain fraud detection: a comprehensive survey. ACM Comput Surv. 2023;55(14s):1–37. [Google Scholar]
12. Lundberg SM, Lee S-I. A unified approach to interpreting model predictions. Adv Neural Inf Process Syst. 2017;30:4765–74. doi: 10.48550/arxiv.1705.07874. [Google Scholar] [CrossRef]
13. Boneh D, Gentry C, Lynn B, Shacham H. Aggregate and verifiably encrypted signatures from bilinear maps. Lect Notes Comput Sci. 2003;2656(4):416–32. doi:10.1007/3-540-39200-9_26. [Google Scholar] [CrossRef]
14. Bergmeir C, Hyndman RJ, Koo B. A note on the validity of cross-validation for evaluating autoregressive time series prediction. Comput Stat Data Anal. 2018;120(12):70–83. doi:10.1016/j.csda.2017.11.003. [Google Scholar] [CrossRef]
15. Hamilton WL, Ying R, Leskovec J. Inductive representation learning on large graphs. Adv Neural Inf Process Syst. 2017;30:1025–35. doi: 10.48550/arxiv.1706.02216. [Google Scholar] [CrossRef]
16. Veličković P, Cucurull G, Casanova A, Romero A, Liò P, Bengio Y. Graph attention networks. In: Proceedings of the 6th International Conference on Learning Representations (ICLR); 2018 Apr 30–May 3; Vancouver, BC, Canada. [Google Scholar]
17. Ye J, Zhang Y, Chen H, Liu X, Wang M, Li J. Graph neural networks for anomaly detection in financial transactions: a survey. Neurocomputing. 2024;572:127654. [Google Scholar]
18. Akoglu L, Tong H, Koutra D. Graph based anomaly detection and description: a survey. Data Min Knowl Discov. 2015;29(3):626–88. doi:10.1007/s10618-014-0365-y. [Google Scholar] [CrossRef]
19. Shen X, Xu C, Zhu L. Blockchain anomaly transaction detection method based on graph continual learning. IEEE Trans Netw Sci Eng. 2026;13(1):1–20. doi:10.1109/TNSE.2025.3534759. [Google Scholar] [CrossRef]
20. Chen Z, Liu S-Z, Huang J, Xiu Y-H, Zhang H, Long H-X. Ethereum phishing scam detection based on data augmentation method and hybrid graph neural network model. Sensors. 2024;24(12):4022. doi:10.3390/s24124022. [Google Scholar] [CrossRef]
21. Grinsztajn L, Oyallon E, Varoquaux G. Why do tree-based models still outperform deep learning on typical tabular data? Adv Neural Inf Process Syst. 2022;35:507–20. doi:10.52202/068431-0037. [Google Scholar] [CrossRef]
22. Shevchuk R, Martsenyuk V, Adamyk B, Benson V, Melnyk A. Anomaly detection in blockchain: a systematic review of trends, challenges, and future directions. Appl Sci. 2025;15(15):8330. doi:10.3390/app15158330. [Google Scholar] [CrossRef]
23. Ravindranath V, Nallakaruppan MK, Lawanya Shri M, Balusamy B, Bhattacharyya S. Evaluation of performance enhancement in ethereum fraud detection using oversampling techniques. Appl Soft Comput. 2024;161(7):111698. doi:10.1016/j.asoc.2024.111698. [Google Scholar] [CrossRef]
24. Cheng D, Zou Y, Xiang S, Jiang C. Graph neural networks for financial fraud detection: a review. Front Comput Sci. 2025;19(9):199609. doi:10.1007/s11704-024-40474-y. [Google Scholar] [CrossRef]
25. Xiong A, Tong Y, Jiang C, Guo S, Shao S, Huang J, et al. Ethereum phishing detection based on graph neural networks. IET Blockchain. 2024;4(3):226–34. doi:10.1049/blc2.12031. [Google Scholar] [CrossRef]
26. Haider MZ, Noreen T, Salman M. Towards quantum-ready blockchain fraud detection via ensemble graph neural networks. In: Proceedings of the 2025 7th International Conference on Blockchain Computing and Applications (BCCA); 2025 Oct 14–17; Dubrovnik, Croatia. p. 908–13. doi:10.1109/BCCA66705.2025.11229725. [Google Scholar] [CrossRef]
27. Sun J, Jia Y, Wang Y, Liu Y, Sheng Z, Tian Y. Ethereum fraud detection via joint transaction language model and graph representation learning. Inf Fusion. 2025;120(4):103074. doi:10.1016/j.inffus.2025.103074. [Google Scholar] [CrossRef]
28. Crisóstomo J, Bação F, Lobo V. Machine learning methods for fraud detection within Ethereum blockchain: a review. Blockchain Res Appl. 2026. Pre-proof. doi:10.1016/j.bcra.2026.100469. [Google Scholar] [CrossRef]
29. Harlev MA, Sun YH, Langenheldt KC, Mukkamala RR, Vatrapu R. Breaking Bad: de-anonymising entity types on the bitcoin blockchain using supervised machine learning. In: Proceedings of the 51st Hawaii International Conference on System Sciences (HICSS); 2018 Jan 3–6; Honolulu, HI, USA. p. 3497–506. doi:10.24251/HICSS.2018.443. [Google Scholar] [CrossRef]
30. Weber M, Domeniconi G, Chen J, Weidele DKI, Bellei C, Robinson T, et al. Anti-money laundering in bitcoin: experimenting with graph convolutional networks for financial forensics. arXiv:1908.02591. 2019. [Google Scholar]
31. Chang Z, Cai Y, Liu XF, Xie Z, Liu Y, Zhan Q. Anomalous node detection in blockchain networks based on graph neural networks. Sensors. 2025;25(1):1. doi:10.3390/s25010001. [Google Scholar] [CrossRef]
32. Farrukh H, Zafar S, Rehman ZU, Shah AA, Alshammry N. Blockchain-based fraud detection: a comparative systematic literature review of federated learning and machine learning approaches. Electronics. 2025;14(24):4952. doi:10.3390/electronics14244952. [Google Scholar] [CrossRef]
33. Wang Y, Zheng Q, Li X, Wang L, Lin L. CoSemiGNN: blockchain fraud detection with dynamic graph neural networks based on co-association of semi-supervised. Expert Syst Appl. 2026;298(7):129853. doi:10.1016/j.eswa.2025.129853. [Google Scholar] [CrossRef]
34. Akiba T, Sano S, Yanase T, Ohta T, Koyama M. Optuna: a next-generation hyperparameter optimization framework. In: Proceedings of the 25th ACM SIGKDD International Conference on Knowledge Discovery & Data Mining; 2019 Aug 4–8; Anchorage, AK, USA. p. 2623–31. doi:10.1145/3292500.3330701. [Google Scholar] [CrossRef]
35. Chen T, Guestrin C. XGBoost: a scalable tree boosting system. In: Proceedings of the 22nd ACM SIGKDD International Conference on Knowledge Discovery and Data Mining (KDD ‘16); 2016 Aug 13–17; San Francisco, CA, USA. p. 785–94. doi:10.1145/2939672.2939785. [Google Scholar] [CrossRef]
36. Breiman L. Random forests. Mach Learn. 2001;45(1):5–32. doi:10.1023/A:1010933404324. [Google Scholar] [CrossRef]
37. De Long ER, De Long DM, Clarke-Pearson DL. Comparing the areas under two or more correlated receiver operating characteristic curves: a nonparametric approach. Biometrics. 1988;44(3):837. doi:10.2307/2531595. [Google Scholar] [CrossRef]
38. Ke G, Meng Q, Finley T, Wang T, Chen W, Ma W, et al. LightGBM: a highly efficient gradient boosting decision tree. Adv Neural Inf Process Syst. 2017;30:3146–54. [Google Scholar]
39. Alarab I, Prakoonwit S, Nacer MI. Comparative analysis using supervised learning methods for anti-money laundering in bitcoin. In: Proceedings of the 2020 5th International Conference on Machine Learning Technologies (ICMLT 2020); 2020 Jun 19–21; Beijing, China. p. 11–7. doi:10.1145/3409073.3409078. [Google Scholar] [CrossRef]
40. Jin C, Zhou J, Xie C, Yu S, Xuan Q, Yang X. Enhancing ethereum fraud detection via generative and contrastive self-supervision. IEEE Trans Inf Forensics Secur. 2025;20(2014):839–53. doi:10.1109/TIFS.2024.3521611. [Google Scholar] [CrossRef]
41. Ertam F. Near real-time Ethereum fraud detection using explainable AI in blockchain networks. Appl Sci. 2025;15(19):10841. doi:10.3390/app151910841. [Google Scholar] [CrossRef]
42. Yuan K, Lin Y, Wu W, Chang CH. Detection of blockchain online payment fraud via CNN-LSTM. In: Proceedings of the 2024 International Conference on Big Data, Information and Computer Network (BDICN); 2024 Jan 19–21; Sanya, China. doi:10.1145/3801228.3801323. [Google Scholar] [CrossRef]
Cite This Article
 Copyright © 2026 The Author(s). Published by Tech Science Press.
This work is licensed under a Creative Commons Attribution 4.0 International License , which permits unrestricted use, distribution, and reproduction in any medium, provided the original work is properly cited.
 Downloads
 Citation Tools
