
 Submit a Paper
 Propose a Special lssue
 Open Access
ARTICLE

Turbulent Kinetic Energy of Flow during Inhale and Exhale to Characterize the Severity of Obstructive Sleep Apnea Patient
1 Faculty of Mechanical Engineering & Technology, University Malaysia Perlis, Padang Besar, 02100, Malaysia
2 Department of Mechanical Engineering, Faculty of Engineering, University of Malaya, Kuala Lumpur, 50603, Malaysia
3 Department of Oral & Maxillofacial Clinical Science, Faculty of Dentistry, University of Malaya, Kuala Lumpur, 50603, Malaysia
4 Department of Paediatric Dentistry and Orthodontics, Faculty of Dentistry, University of Malaya, Kuala Lumpur, 50603, Malaysia
* Corresponding Author: W. M. Faizal. Email:
(This article belongs to the Special Issue: Computer Methods in Bio-mechanics and Biomedical Engineering)
Computer Modeling in Engineering & Sciences 2023, 136(1), 43-61. https://doi.org/10.32604/cmes.2023.022716
Received 23 March 2022; Accepted 15 September 2022; Issue published 05 January 2023
 View Full Text
 Download PDF
Abstract
This paper aims to investigate and present the numerical investigation of airflow characteristics using Turbulent Kinetic Energy (TKE) to characterize the upper airway with obstructive sleep apnea (OSA) under inhale and exhale breathing conditions. The importance of TKE under both breathing conditions is that it show an accurate method in expressing the severity of flow in sleep disorder. Computational fluid dynamics simulate the upper airway’s airflow via steady-state Reynolds-averaged Navier-Stokes (RANS) with k–ω shear stress transport (SST) turbulence model. The three-dimensional (3D) airway model is created based on the CT scan images of an actual patient, meshed with 1.29 million elements using Materialise Interactive Medical Image Control System (MIMICS) and ANSYS software, respectively. High TKE were noticed around the region after the necking (smaller cross-sectional area) during the inhale and exhale breathing. The turbulent kinetic energy could be used as a valuable measure to identify the severity of OSA. This study is expected to provide a better understanding and clear visualization of the airflow characteristics during the inhale and exhale breathing in the upper airway of patients for medical practitioners in the OSA research field.Graphic Abstract
Keywords
| List of symbols | ||
| D | Diameter of the cross-sectional | m |
| KE | Kinetic energy | - |
| N | Number of samples in the signal | - |
| p | Pressure | Pa |
| Re | Reynolds Number | - |
| Rey | Turbulent Reynolds Number | - |
| W | Work of friction | - |
| t | Time | s |
| mean velocity | m/s | |
| u | Fluid velocity component in x-direction | m/s |
| v | Fluid velocity component in y-direction | m/s |
| w | Fluid velocity component in z-direction | m/s |
| x, y, z | Cartesian coordinates | - |
| i, j, k | Unit vector of the coordinates system | - |
| Greek letters | ||
| ρ | Density | kg/m3 |
| μ | Dynamic viscosity | kg/ms |
Obstructive sleep apnea (OSA) affects the quality of sleep for many patients. The OSA results in a temporary blockage of a patient’s airway by several obstructions, such as collapse or laxity of airway tissues, which prevent normal airflow during breathing. The obstruction of the airway leads to hypopnea or apnea. Apnea is the complete blockage of air, while hypopnea is the partial blockage of air. Several situations differ the severity of blockage: relaxation of throat muscle, excessively bulky airway tissues, thick fatty tissue, and tongue falling back to the throat area. Apnea-Hypopnea Index (AHI) is practically used to determine the severity of OSA. Clinical data are collected to determine the severity of OSA via the average number of hypopnea or apnea events per hour of sleep.
Previously, Faizal et al. [1] showed the importance of TKE in visualizing the accurate method in expressing flow concentration during light and heavy breathing for OSA patients. The high intensity of TKE shown in flow concentration during light and heavy breathing might induce high vibration to the soft tissue around the upper airways. Due to this, many previous researchers discovered that the vibration of soft tissue and snoring phenomena during a night of sleep might cause damage to the soft tissues, vessels, and nerves, thus resulting in sleep apnea for the patient [2]. However, the metrics of vibration and snoring are rarely correlated with the airflow effects. According to the principles of fluid mechanics, a turbulent airflow in a passage could cause vibration, leading to structural damage. This phenomenon has already been established in other engineering disciplines, such as in nuclear plants [3], aircraft design [4], and structural design [5]. Thus, it could be argued that a turbulent flow would cause vibration that could damage soft tissues, vessels, and nerves.
Computational fluid dynamics (CFD) has emerged as one of the powerful tools for attaining a deep insight into many medical disorders, including that of OSA [6]. Recently, many researchers focused on fluid mechanics in understanding the flow mechanism inside the upper airway [7–9]. It has been applied to study the upper airway anatomy and airflow and discover the virtual reality surgery in sleep-disordered breathing (SDB) [10]. Recently, Faizal et al. [11] reviewed the importance of computational simulation for understanding the human upper airway (HUA) in sleep apnea assessment. Powell et al. [12] constructed a complete CFD model that includes the details of the pharyngeal to investigate the human upper airway that has been used for surgery. Zhao et al. [13] utilized CFD to establish the pharyngeal airway model before and after surgery. The generalized airflow and pressure profile were used to determine the possible relationship with the treatment outcome. The research mentioned above considered seven OSA patients in investigations of the upper airway. It was found that two OSA patients still experienced OSA even after treatment. The flow pattern in the human upper airway [14,15] has been studied using experimental means or via CFD, where the results are focused on the velocity, pressure, and wall shear stress. Similarly, Mylavarapu et al. [16] used the CFD model to simultaneously model the airflow velocity, pressure, and wall shear stress in the human upper airway. With the knowledge of turbulent flow in the human upper airway, it is possible to avoid OSA. Besides, the simulation technique is also applicable in the study of human cough jet development and expiratory droplet dispersion [17]. The large eddy simulation (LES) model has been incorporated with the weakly compressible smoothed particle hydrodynamics method in simulating the cough jet from the human mouth. The cough turbulent flow correlated with the virus droplet dispersion was crucially affected by the two-way coupling of the droplets and ambient air.
Understanding the upper airway flow pattern can help with sleep apnea and respiratory disease treatment. The flow pattern visualization in the actual airways is complex and challenging. Thus, the flow pattern during the inhalation and exhalation breathing can be visualized in CFD simulation and particle image velocimetry experiments [18]. The “glottal jet” phenomenon is less noticeable at higher flow rates, and the separation zone is smaller during inhalation. However, the maximum velocity was significantly lower than during inhalation. The flow fields in the trachea region were unaffected by the exhalation breathing modes [7]. The simulation of inhale/exhale breathing also facilitates the visualization and understanding of the particle motion in the human airway. The steady flow replaced the asymmetric cycle simulation for nonstationary flow. The volumetric flow rates were used as the combinations of maximum and average flow rates during inhalation [19]. The CFD simulation during inhalation and exhalation with prescribed wall motion by magnetic resonance imaging provides new insight into the realistic flow behaviors of breathing. The active motion of the airway could produce physiologically realistic results in the CFD simulation [20]. Thus, the CFD simulation is significant in studying the flow pattern visualization of the upper airways.
Therefore, the current study is the continuity research from our previous finding [1], and it is motivated to investigate the turbulent airflow in the pharyngeal airway for a patient diagnosed with OSA, mainly focusing on the inhale and exhale flow condition. The CFD simulation was applied for the task undertaken. The novelty is explained by visualizing the turbulent kinetic energy (TKE) to relate the severity of OSA patients with eddies of the airflow in the pharyngeal airway during inhale and exhale breathing. The CFD result indicates a more reliable but relatively simplified upper airway model to understand OSA. As far as the authors are aware, the literature lacks a study on the effect of TKE on the breathing pattern of OSA patients. Thus, this field has a significant research gap, particularly in simulation modelling analysis. The present study focuses primarily on body characteristics to comprehend the OSA phenomenon, but it does not adequately demonstrate the airflow details that contribute to our understanding of OSA. This study proposes and describes the impact of inhalation and exhalation on OSA patients’ airways. The findings contribute to the visualization of TKE of the airflow, which is related to the severity of OSA patients with pharyngeal airway eddies. In addition, the examination of the flow pattern breathing contributes to the understanding of TKE airflow characteristics.
2 Method to Study the Human Upper Airway
The method used in this work includes CFD modelling and segmentation of computed tomography scan (CT scan) acquisition, which has been described and explained in previous research [1]. Therefore, Fig. 1 portrays the CFD modelling in which the model was a segmentation of the pharyngeal in the human upper airway. The volume of the model was created based on real patient computed tomography (CT) images. The focus was on both flow simulations. Thus, the marked locations of P6 and P1 are defined as the inlet and outlet boundary conditions for inhaling, but for exhaling, P6 is defined as outlet and P1 as an inlet. The TKE in the upper airway was obtained in the simulation by considering all essential parameters and boundary conditions adopted in previous research.
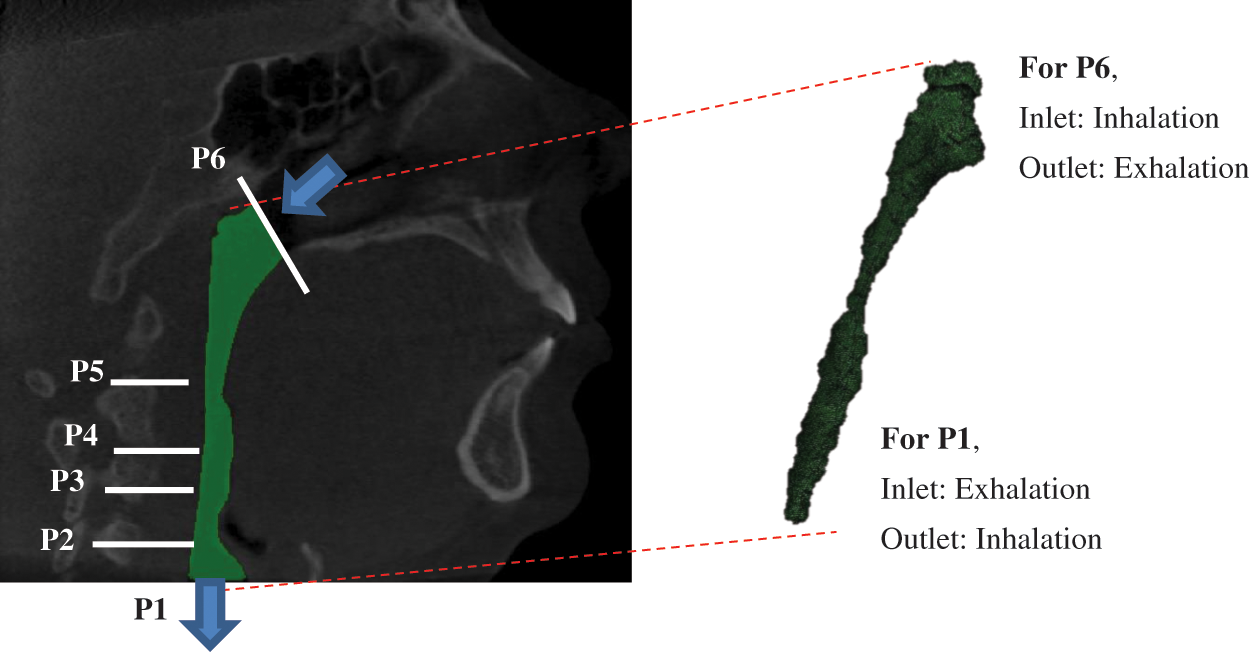
Figure 1: Breathing condition for inhaling and exhaling for OSA patient
2.1 Method to Study the Human Upper Airway
All procedures in this study were conducted in accordance with the Universiti Malaysia Perlis Research Ethics Committee, Perlis, Malaysia-UniMAP/PTNC(P&I)/JKETIKA (10/11/2021) approved protocols. Written informed consents were received from all the patients, and the study was conducted according to the tenets of the Declaration of Helsinki for research involving human subjects. The upper airway geometry is extracted from CT scan images of 24-year-old female nonsmoking OSA patient volunteers. The BMI of the patient is 70.3 kg/m2, and the AHI is 99.5. The summarized characteristics of the OSA subject that were selected for the conduction of the upper airway CT scan. According to previous works, the focus of the subject of interest was decided to be from the nostril until the pharyngeal [13]. A total of 431 frames with 0.3 mm of slice thickness covering the upper airway CT scan of the subject were performed using an i-CAT Cone Beam 3D Dental Imaging System (version 3.1.62 supplied by Imaging Science International, Hatfield, USA), as shown in Fig. 2.
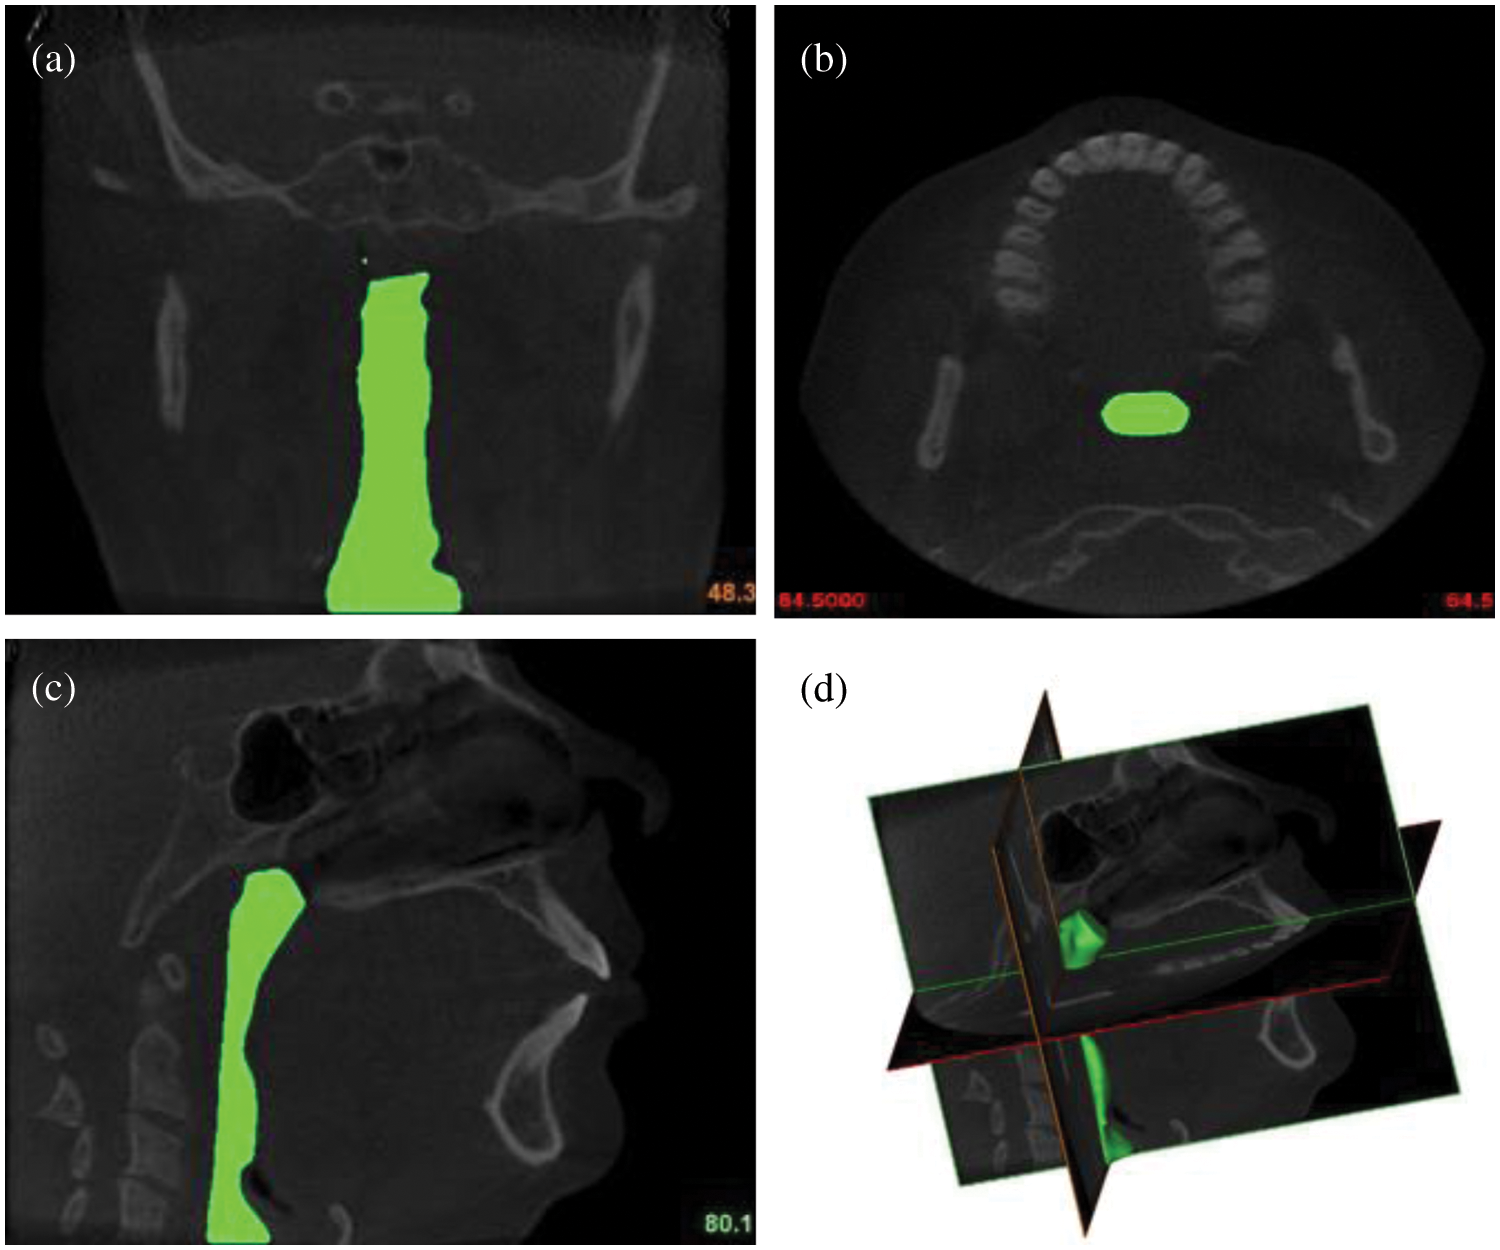
Figure 2: The airways of OSA patient: (a) coronal view; (b) axial view; (c) sagittal view; and (d) 3D volume pharyngeal airway
The airway boundary is identified from the CT scan images via a threshold based on the intensity of the grey image. The thresholding method divides images into sub-images and then determines the threshold value for each portion in order to find different threshold values for various parts of the images. The results of the thresholding are then combined for each component of the image. This technique splits an image into vertical and horizontal parts containing a section of the object’s background. Finally, interpolation is required to achieve the desired outcomes [21]. The images were captured while the patient was awake and lying down with their face upward, as explained in the works of Chan et al. [22]. Each CT scan has 534 pixels × 534 pixels, and the pixel spacing is 0.3 mm × 0.3 mm. A series of CT scan images were stored in a Digital Imaging and Communications in Medicine (DICOM) format. Then, the DICOM images were imported into a three-dimensional (3D) medical image processing MIMICS software (version 15.0; Materialise, Leuven, Belgium). The image segmentation of the upper airway was carried out to identify the 3D airway region based on the pixel value (Hounsfield unit) from the DICOM image series. The airway surface model was generated using segment airway in pulmonary function test, as shown in Fig. 2. Then, the 3D volume of the pharyngeal airway was created and exported for the 3D model mesh generation.
The model generated by the MIMICS software was transferred to 3-Matic (version 15.0; Leuven, Belgium) to create the volume mesh. The preprocessor, ICEM (ANSYS, USA), generated unstructured tetrahedral meshes for airway volume. The mesh quality was controlled to ensure the highest level of result accuracy. The surfaces of the pharyngeal airway have meshed with 2.0 mm of Maximum face size. The maximum and minimum size of the mesh is 2 mm and 0.002 mm, respectively. An inflation of the pharyngeal airway mesh was considered around the wall boundary to increase the accuracy of the simulation. This consideration also ensures an excellent fine mesh is created next to the wall, thus providing an adequately small mesh close to the size of the wall mesh. The y+ (dimensionless distance) approach was used to accurately estimate the initial boundary layer thickness [12] that corresponds to the near-wall cell size (0.272). The quality of the meshed airway model was examined in ANSYS, where the quality of the mesh is measured by the average skewness value and standard deviation. The skewness value is 0.2142, which indicates an excellent cell quality (0–0.25), as recommended by ANSYS. Then, the mesh sensitivity grid study was performed on the 3D airway model with different grid scales. The 5-grid size was performed to establish acceptable accuracy, as shown by the previous research approach.
2.3 Numerical Modelling of the Upper Airway
Inhalation and exhalation breathing involve the airflow passing through the pharyngeal airway. The airflow characteristics may vary due to the uniqueness of the pharyngeal airway. Thus, in the simulation analysis, the flow field in the pharyngeal airway for OSA patients is computed by using a steady-state Reynolds-averaged Navier-Stokes (RANS) formulation, with the k–ω shear stress transport (SST) turbulence model with low Reynolds number correction [23]. The popular k–ω SST turbulence model was considered in this work instead of the k–ϵ model due to the greater accuracy of the former in viscous near-wall region treatment while considering the effects of adverse pressure gradient [24]. The solver used in the simulation had been validated in our previous studies [1]. The comparison of the simulation and previous experimental results showed a good agreement on the wall static pressure induced by the airflow 1.
The fluid governing equations were solved in ANSYS Fluent 16.2 (ANSYS, USA). Considering the UA airflow (0.05) low Mach number during inhalation, the flow was modelled as incompressible and Newtonian. The standard shear stress transport (SST)
where
2.3.2 Turbulent Kinetic Energy (TKE) Equation
The TKE equation is developed from the mass and momentum conservation equations to describe how the mean flow feeds kinetic energy into turbulence, given its essential role in developing the turbulent model in CFD modelling. The Reynolds decomposition method was used to decompose the velocity signal,
where
Using this equation, the velocity fluctuation used in calculating the TKE around the upper airway may be useful in identifying the severity of blockage to breathing in the upper airway.
Previous researcher explained the flow mechanism in the upper airways, and two Reynolds numbers were used in this study. In terms of definitions, there is a significant difference between Turbulent Reynolds number, Rey and Reynolds number, Re. The Turbulent Reynolds number is the ratio between the kinetic energy and work of friction. However, the Reynolds number is the ratio between the inertia force and viscosity force.
The definition of Turbulent Reynolds Number,
The definition of Reynolds Number,
where
The boundary conditions of the 3D model were defined via the surface of the model, as mentioned in Fig. 1. The inlet and outlet boundary conditions in the simulation were referred from the works of Mihaesu et al. [9]. The steady-state turbulent airway flow is computed by ANSYS Fluent, which solves finite volume using fitted grids. During breathing, the velocity profile was assumed to be uniform, and the axial component of the velocity was perpendicular to the flow inlet, the nasopharynx [12]. Light breathing was considered at the inlet for both breathing conditions, where a volume flow rate of 7.5 L/min was considered in the simulation [26]. A turbulent intensity of 10% was considered to mimic the real condition, where the outlet was defined by an average gauge pressure of 0 Pa [27].
Some of the limitations of this study include the limited extent of the airway understudy, the fact that the velocity of breathing is considered uniform, patients were awake and in an upright posture during the scans, the absence of a sleep study, the lack of sleepiness scales or questionnaires, the unknown stage of respiration, and the lack of tongue control. In addition, the airway is not a rigid structure, and the effects of the soft tissue placidness could not be taken into consideration. Besides, the biomechanical model's design and analysis are excluded in the current study.
The CFD simulation result of the airway analysis is significant and valuable to a medical practitioner because it provides a clear airflow visualization. The current airway analysis assessment focuses on various aspects, such as the cross-sectional area, airflow patterns, velocity, pressure, wall shear stress, turbulent kinetic energy, and turbulent Reynolds number. Fig. 3 shows the variation of airway cross-sectional area in thirty-four-plane images, with the location of the cross-sectional plane in the z-direction (i.e., flow direction). This indicates that the patient has a minimum cross-sectional area of 7.68 mm2 at 28 mm from the inlet.
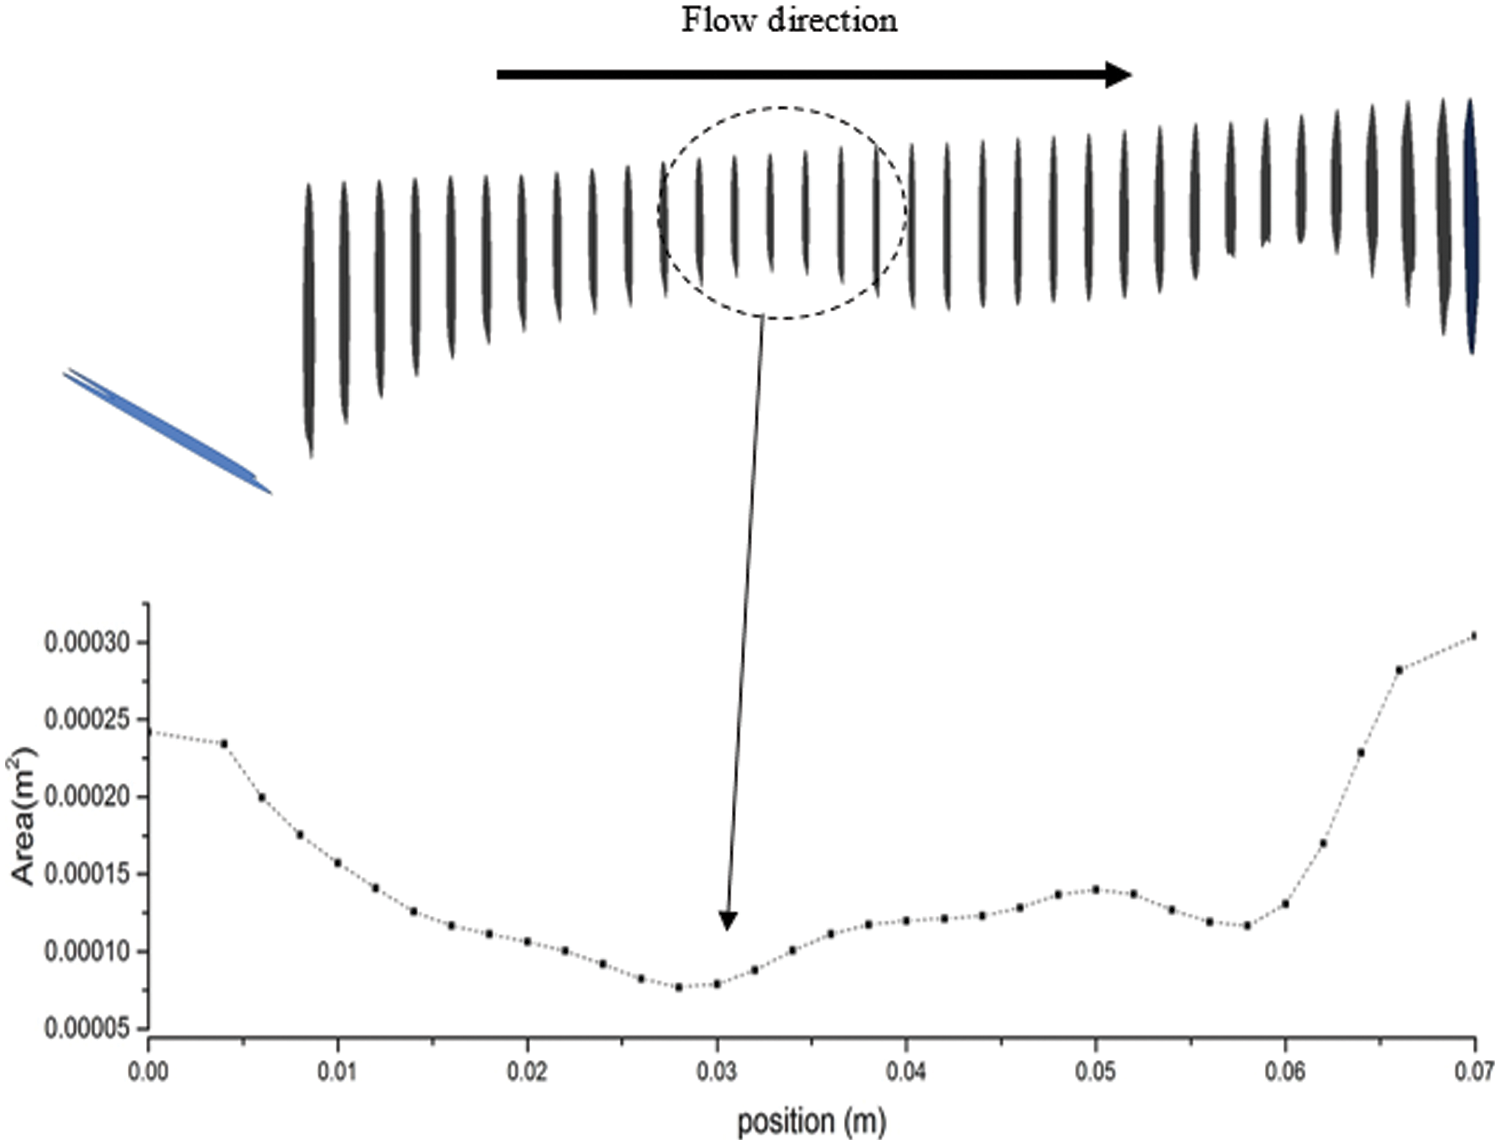
Figure 3: Cross-sectional area along the flow direction of the airway model generated through CT Scan data that refers to a region with obstructions
The minimum area is crucial for patients with sleep apnea. Contraction of the cross-sectional area influences the smoothness of the airflow when passing through the upper airway. This situation is also defined as the obstruction of airflow during inhalation. The narrow airway area in a patient with OSA might have been caused by the collapse or laxity of airway tissue. Most researchers, such as Lantz et al. [28], Chouly et al. [29], and Djukic et al. [30], have discussed and employed the flow values (i.e., velocity, pressure, and wall shear stress) to describe the characteristics of the upper airway. In this work, the additional flow parameter, TKE, is considered to describe the characteristics of the upper airway. Other flow parameters were also considered to visualize the phenomena and flow patterns in the upper airway.
3.2 Flow Pattern in Pharyngeal Airway
Fig. 4a depicts the axial velocity contour (m/s) and streamlines along the upper airway's midsagittal plane in the nasopharynx, oropharynx, and hypopharynx. The results show that the highest velocity began after the airflow at the oropharynx. As the airflow approached the minimum cross-sectional area of the airway (retropalatal pharynx), the velocity increased, and the airflow seemed to have developed a turbulent flow pattern that also generated the flow recirculation regions (negative axial velocity), as shown in Fig. 4b. The dilation of the cross-sectional area after the narrow area had affected the airflow in the OSA patient's airway. Thus, the flow recirculation is concentrated around this region, typically formed downstream with obstructions (narrow area). The existence of negative axial velocity may lead to the vibration of airway tissue due to continuous breathing. Hence, it is highly likely that this region will generate vibration, causing the snoring. Snoring is known to reduce the strength of the tissue in patients with sleep apnea [31].
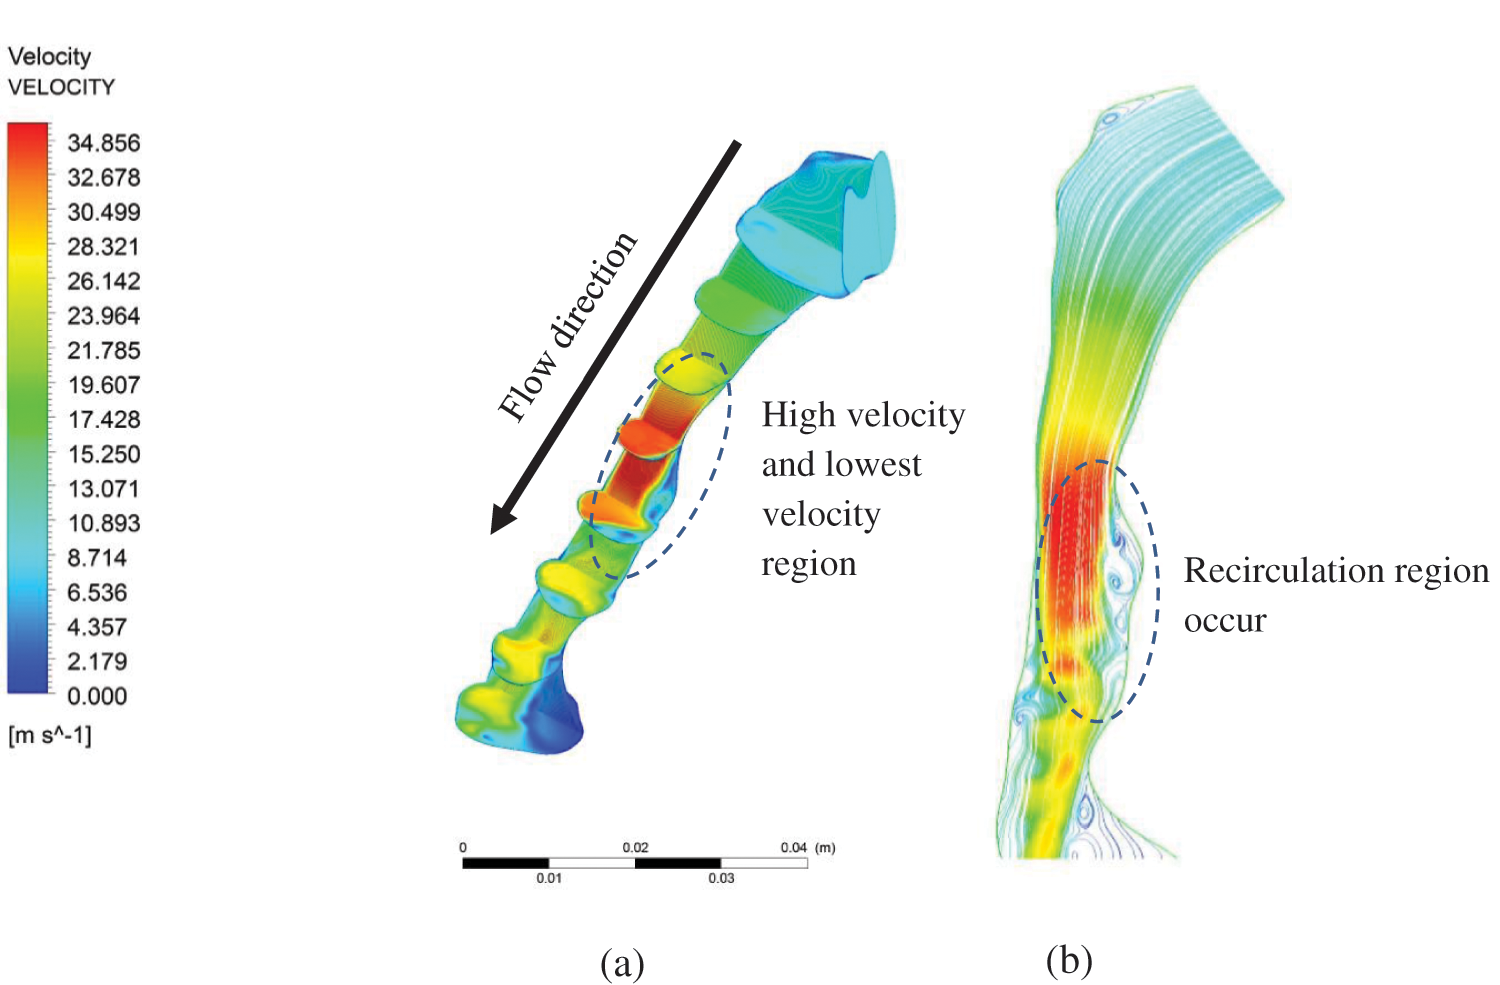
Figure 4: Velocity magnitude in the pharyngeal airway: (a) velocity contour at centre plane; and (b) streamline velocity along the centre plane
Fig. 4b exhibits the recirculation region phenomenon caused by a narrow breathing area. Narrowed breathing area gives the exact definition of hypopnea in calculating the degree of blockage of breathing airway during sleep. By understanding the recirculation region, a new tool may be introduced in calculating the degree of blockage from the simulation of the upper airway without requiring the patient to sleep all night. Fig. 5 shows the maximum velocity and area distribution around the upper airway’s maximum narrowing. The maximum velocity in maximum narrowing is also known as “pharyngeal jet”, whereby it creates a compact region and induces recirculation flow. The average velocity also indicates the maximum velocity around the narrow region. In this situation, the high-velocity airflow had induced a high fluctuation that contributes to the vortices in a turbulent flow. Thus, the TKE, as explained in Eq. (4), is used to describe the mean kinetic energy per unit mass of vortices after the maximum narrowing in the upper airway is reached.
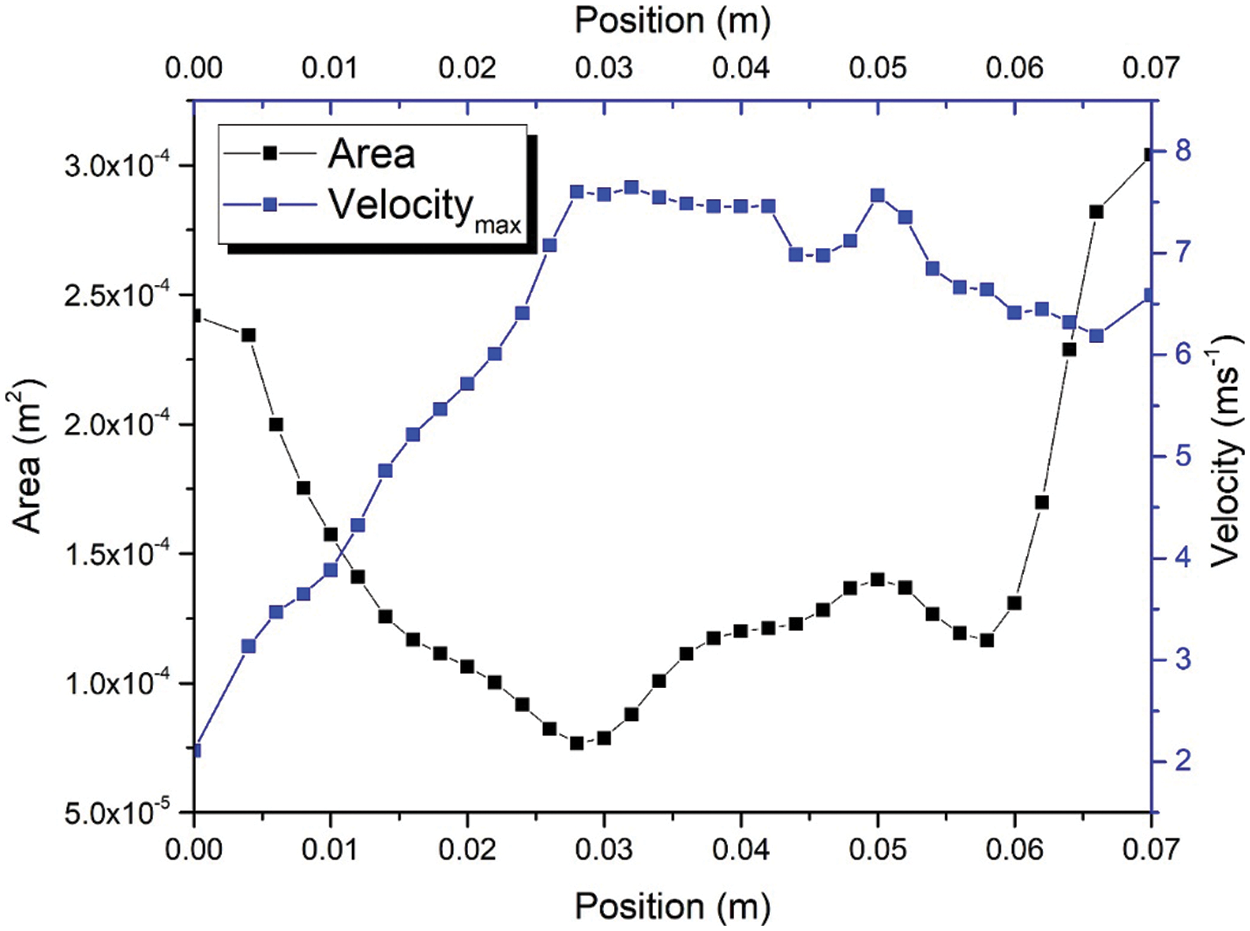
Figure 5: Maximum velocity and area distribution in pharyngeal airway
The correlation between velocity and the area of the upper airway was investigated in this study. The region of interest (ROI) was focused on positions ranging from 0.01 to 0.028 m and 0.03 to 0.04 m. The airflow velocity passing from 0.01 to 0.028 experienced the convergence of the cross-sectional area of the upper airway. In contrast, after position 0.028 m, the cross-sectional area of the upper airway is increased; this can be observed in Fig. 5. Fig. 6 shows the correlation between airflow velocity and area. The simulation results revealed that the airflow velocity decreased with the increasing area under the fitting of the power function at positions from 0.01 to 0.028 m. The coefficient of determination (R2) is 0.9981 and indicates the excellent data fit in the regression model. However, the correlation between velocity and area is in the polynomial behavior after the airflow passes through the narrow area. The R2 is 0.9854, demonstrating the excellent data fitting of the polynomial function to describe the relationship between velocity and area (positions 0.03 to 0.04 m). The change in the correlation between velocity and airflow was attributed to the airflow characteristic after passing through the narrow area, as aforementioned in Figs. 4 and 5.
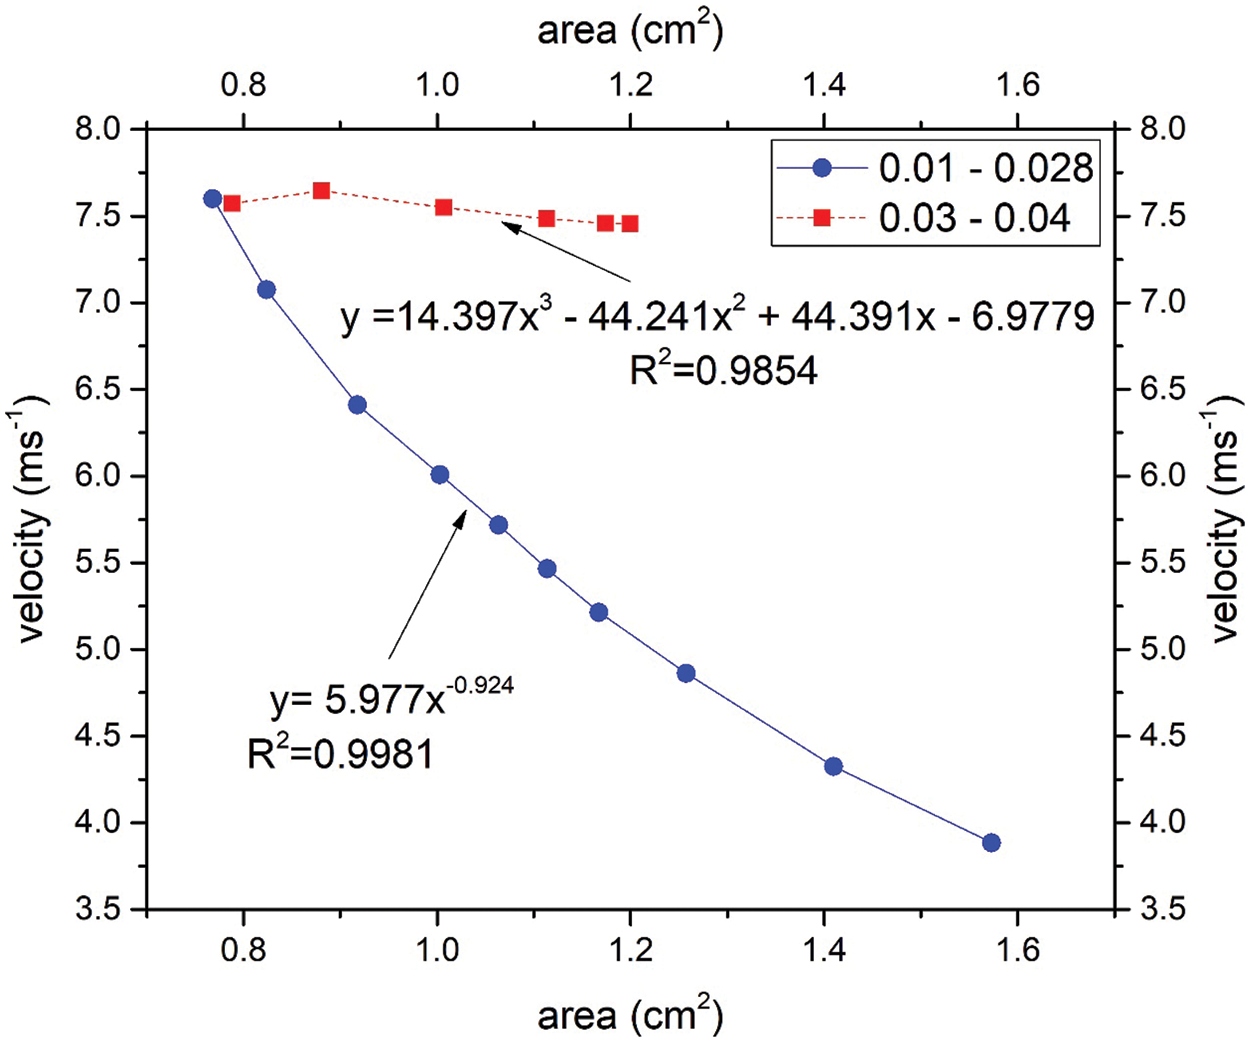
Figure 6: Statistical analysis between velocity and area for the range of position 0.01 to 0.028 and 0.03 to 0.04
3.3 Pressure Distribution Profile
The airway wall or tissue experiences the variation of pressure when airflow passes through the airway. Pressure variation may lead to the vibration of airway tissue. Figs. 7a and 7b illustrate the pressure on the airway wall (unit: Pa) during the inspiration and expiration breathing phase, respectively. It is observed that the inhale and exhale breathing have the low-pressure region around the narrow area. This observation corresponded to the large velocity around the narrow area. Higher velocity gives the higher pressure drop.
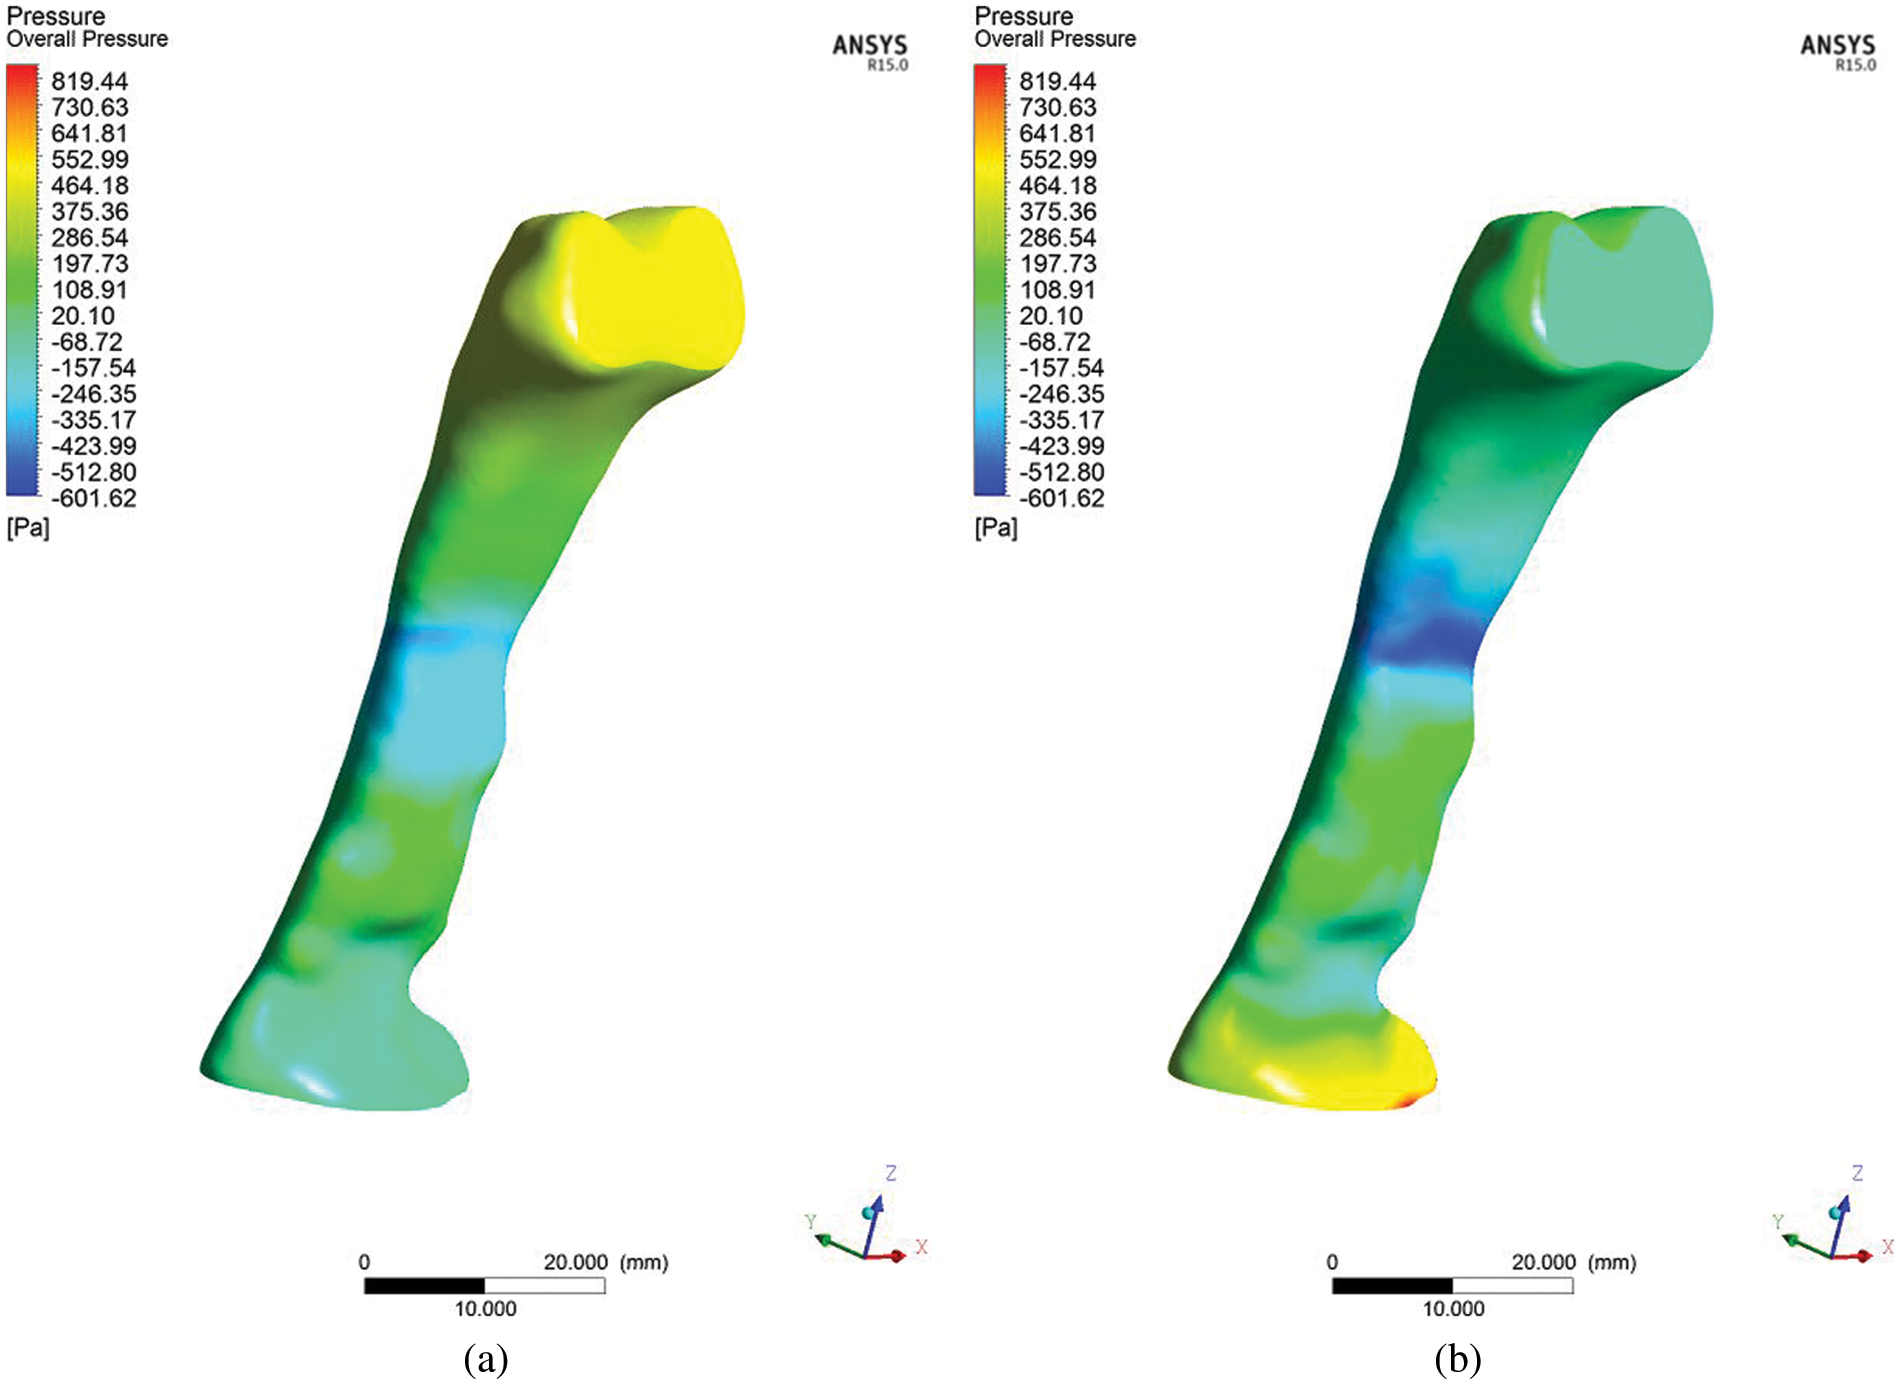
Figure 7: Contour of upper airway total pressure on the airway wall during (a) inhale and (b) exhale
The TKE value will be high if the velocity fluctuation is in a randomized direction, with high magnitude impacting the blockage in the breathing area, as visualized in Fig. 4; there is low pressure at the narrow cross-sectional breathing area the exhale. The high wall shear stress is mainly observed in the obstructed regions, contributing to high turbulent energy near the wall [24]. In a recent study, Gupta et al. [32] found that shear stress generates fluctuating velocity and produces TKE in this region. The fluctuating velocity and turbulent flow near the wall will induce vibration and simultaneously generate snoring. As such, the severity of snoring directly corresponds to the TKE. The occurrence of snoring in the long term would cause reduced tissue strength for the pharyngeal, which will lead to the laxity or collapse of tissue due to gravitational effects when the patient sleeps in a lying down position. Consequently, this makes it a contributing factor to sleep apnea. Besides, the velocity gradient affects the wall shear stress. The changes in velocity around the obstructed regions indicated the higher wall shear stress in those regions. The upper airway walls’ exposure to high wall shear stress may play a significant role in the respiratory disease's inflammatory process [33,34].
The turbulent Reynolds number and Reynolds number were considered in this work to describe the airflow characteristics of the airway of an OSA patient. The severe vibration of airway tissue leads to snoring, where long-term snoring weakens the airway tissue, thus leading to the blockage of airflow (i.e., sleep hypopnea and apnea). Previous researchers often employ the Reynolds number to express the flow condition in the study of the airway. The subject mainly breathed in a turbulent region expressed in the Reynolds number shown in Fig. 8. The flow develops a turbulent region at 0.014 m from the inlet with the Reynolds number 4096. The flow reaches a peak at 0.04 m from the inlet with the value of the Reynolds Number 7534, but for the healthy person in normal breathing, the Reynolds number is estimated around 2084. High turbulent Reynolds number was identified around a region after the narrow area. Both Reynolds (Re) and turbulent Reynolds (Rey) were concentrated in a similar region. The results indicate that Re corresponded to the Rey. This situation can be observed at the first peak of the plot (at the position ~0.04 m) for Re and Rey in Fig. 8, respectively. The Rey is helpful for the identification of the turbulence level of airflow in an airway.
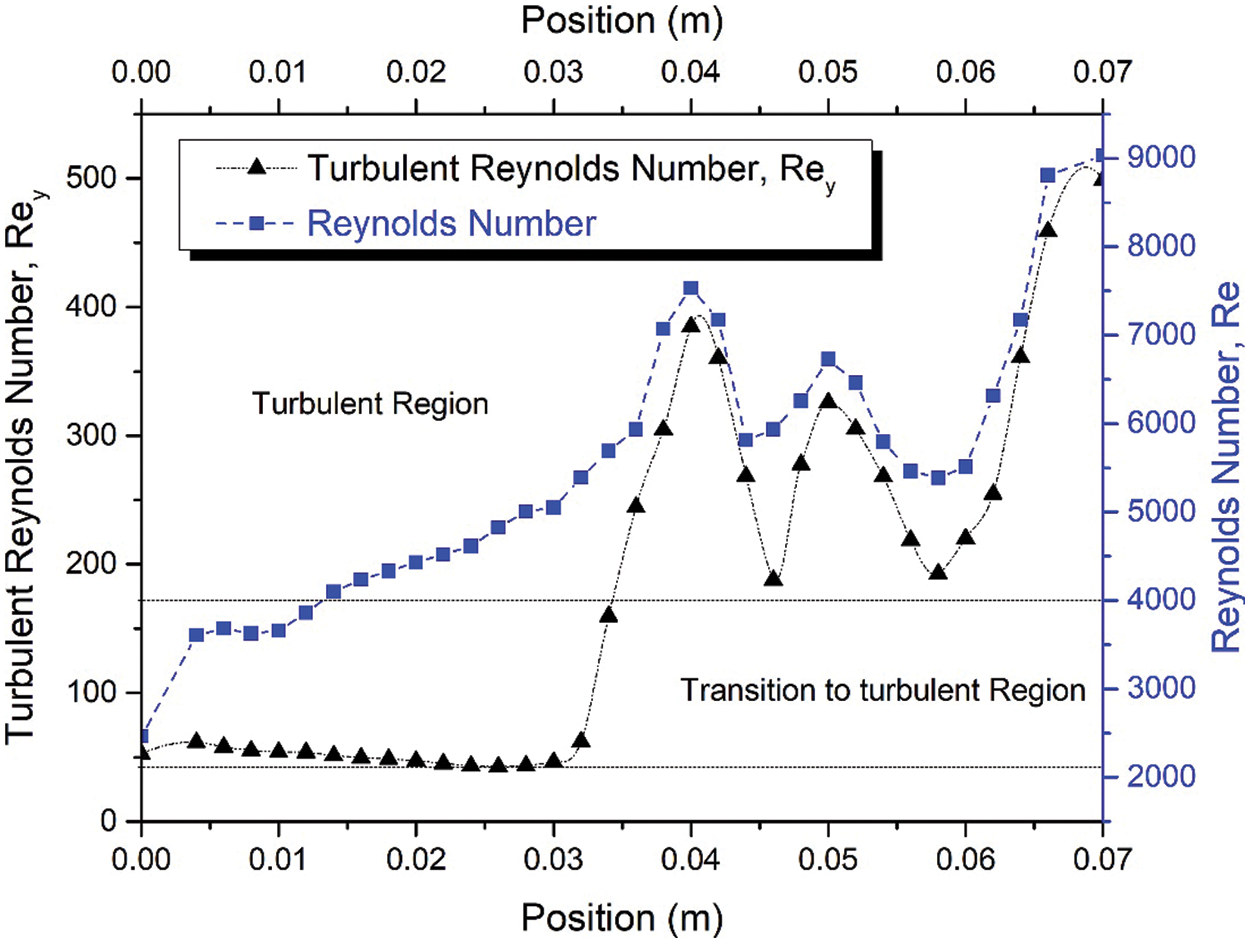
Figure 8: Turbulent Reynolds number, Rey, and Reynolds number along the upper airway during inhaling under light breathing conditions
Turbulent Reynolds number was considered to explain the intensity of turbulence or energy of the Reynolds number, as expressed in Eq. (6). The turbulent Reynolds number reflects the level of turbulence in each area (cross-sectional area of the airway). The high-velocity intensity in the upper airway indicates high turbulence generated from friction work, as expressed in Eq. (6). High-velocity intensity is generated from the critical cross-sectional area, while the recirculation region (Fig. 4) is attributable to the mechanism of hypopnea in clinical areas. High turbulent Reynold number contour is observed around inhale and exhale breathing outlets after the narrow-area (Fig. 9). The high turbulent Reynolds number is higher during exhale breathing (Fig. 9) than inhale breathing around that narrow area. This situation may lead to the high tendency of sound-producing in exhaling breathing. The explanation of the turbulent Reynolds number will provide a new tool in establishing the severity of the OSA through the consideration of AHI as the evaluation method.
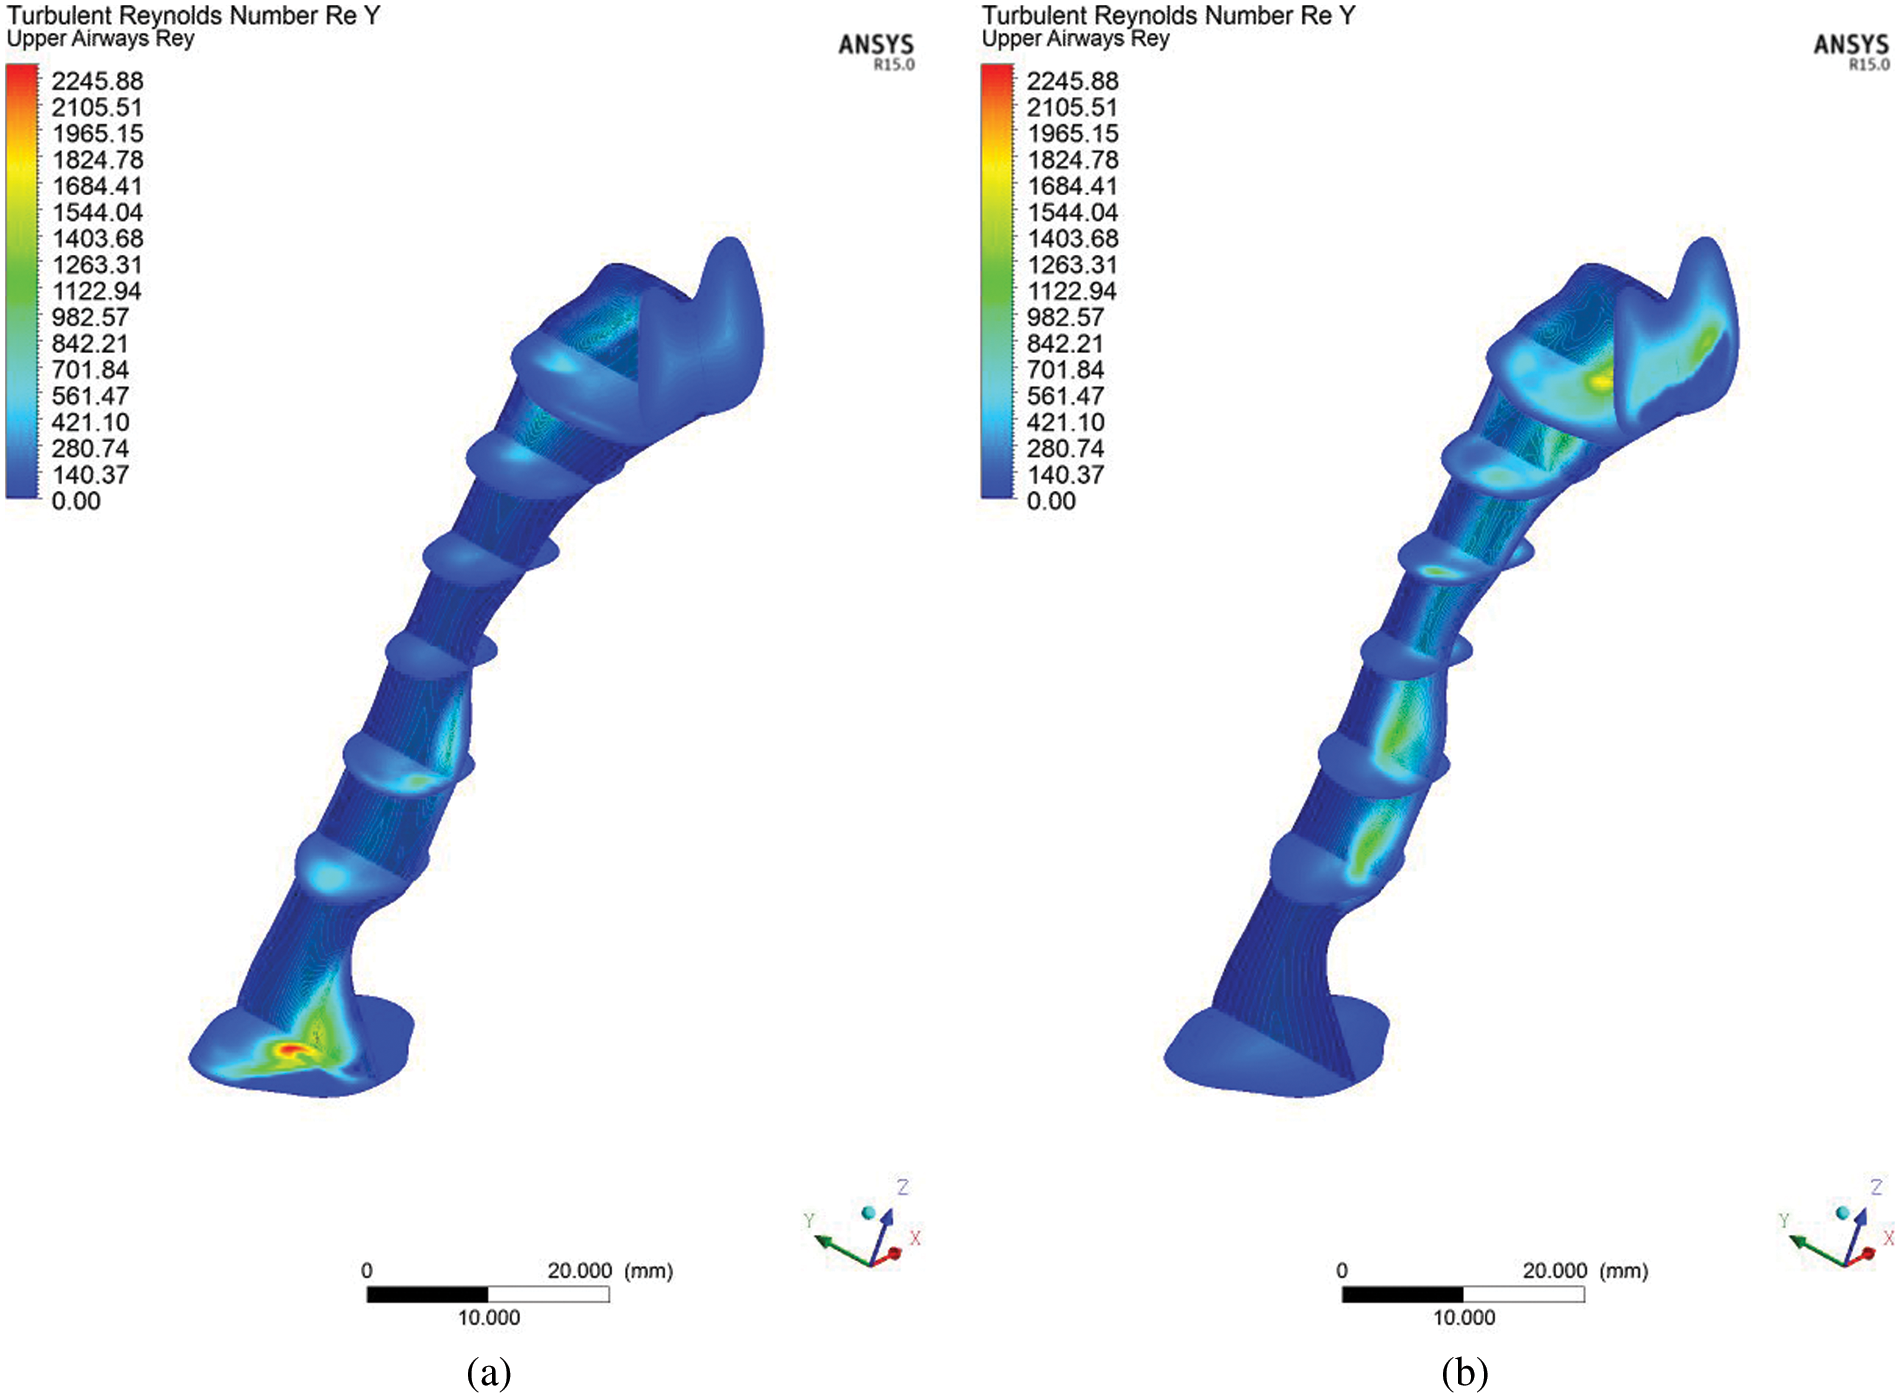
Figure 9: Contour of turbulent Reynolds number, Rey, in the upper airway at the center plane for (a) inhale and (b) exhale breathing
3.5 Turbulent Kinetic Energy (TKE) Distribution along the Pharyngeal Airway
The turbulent kinetic energy is associated with the kinetic energy of vortices (velocity fluctuation) generated in the turbulent flow, which quantifies the turbulence level in the airway. In the clinical study, the index to measure the severity of OSA is the apnea-hypopnea index called AHI, a diagnosis of the periodic breathing of a patient during sleep. Hypopnea is when the patient undergoes shallow breathing due to a constricted airway. The constricted airway will induce the intensity of the flow, causing high turbulent flow that creates velocity fluctuation, as shown in Fig. 10. The fluctuation of velocity (Eq. (3)) and TKE (Eq. (4)) are related to hypopnea, which causes shallow breathing during sleep in measure of the AHI and TKE in CFD simulation.
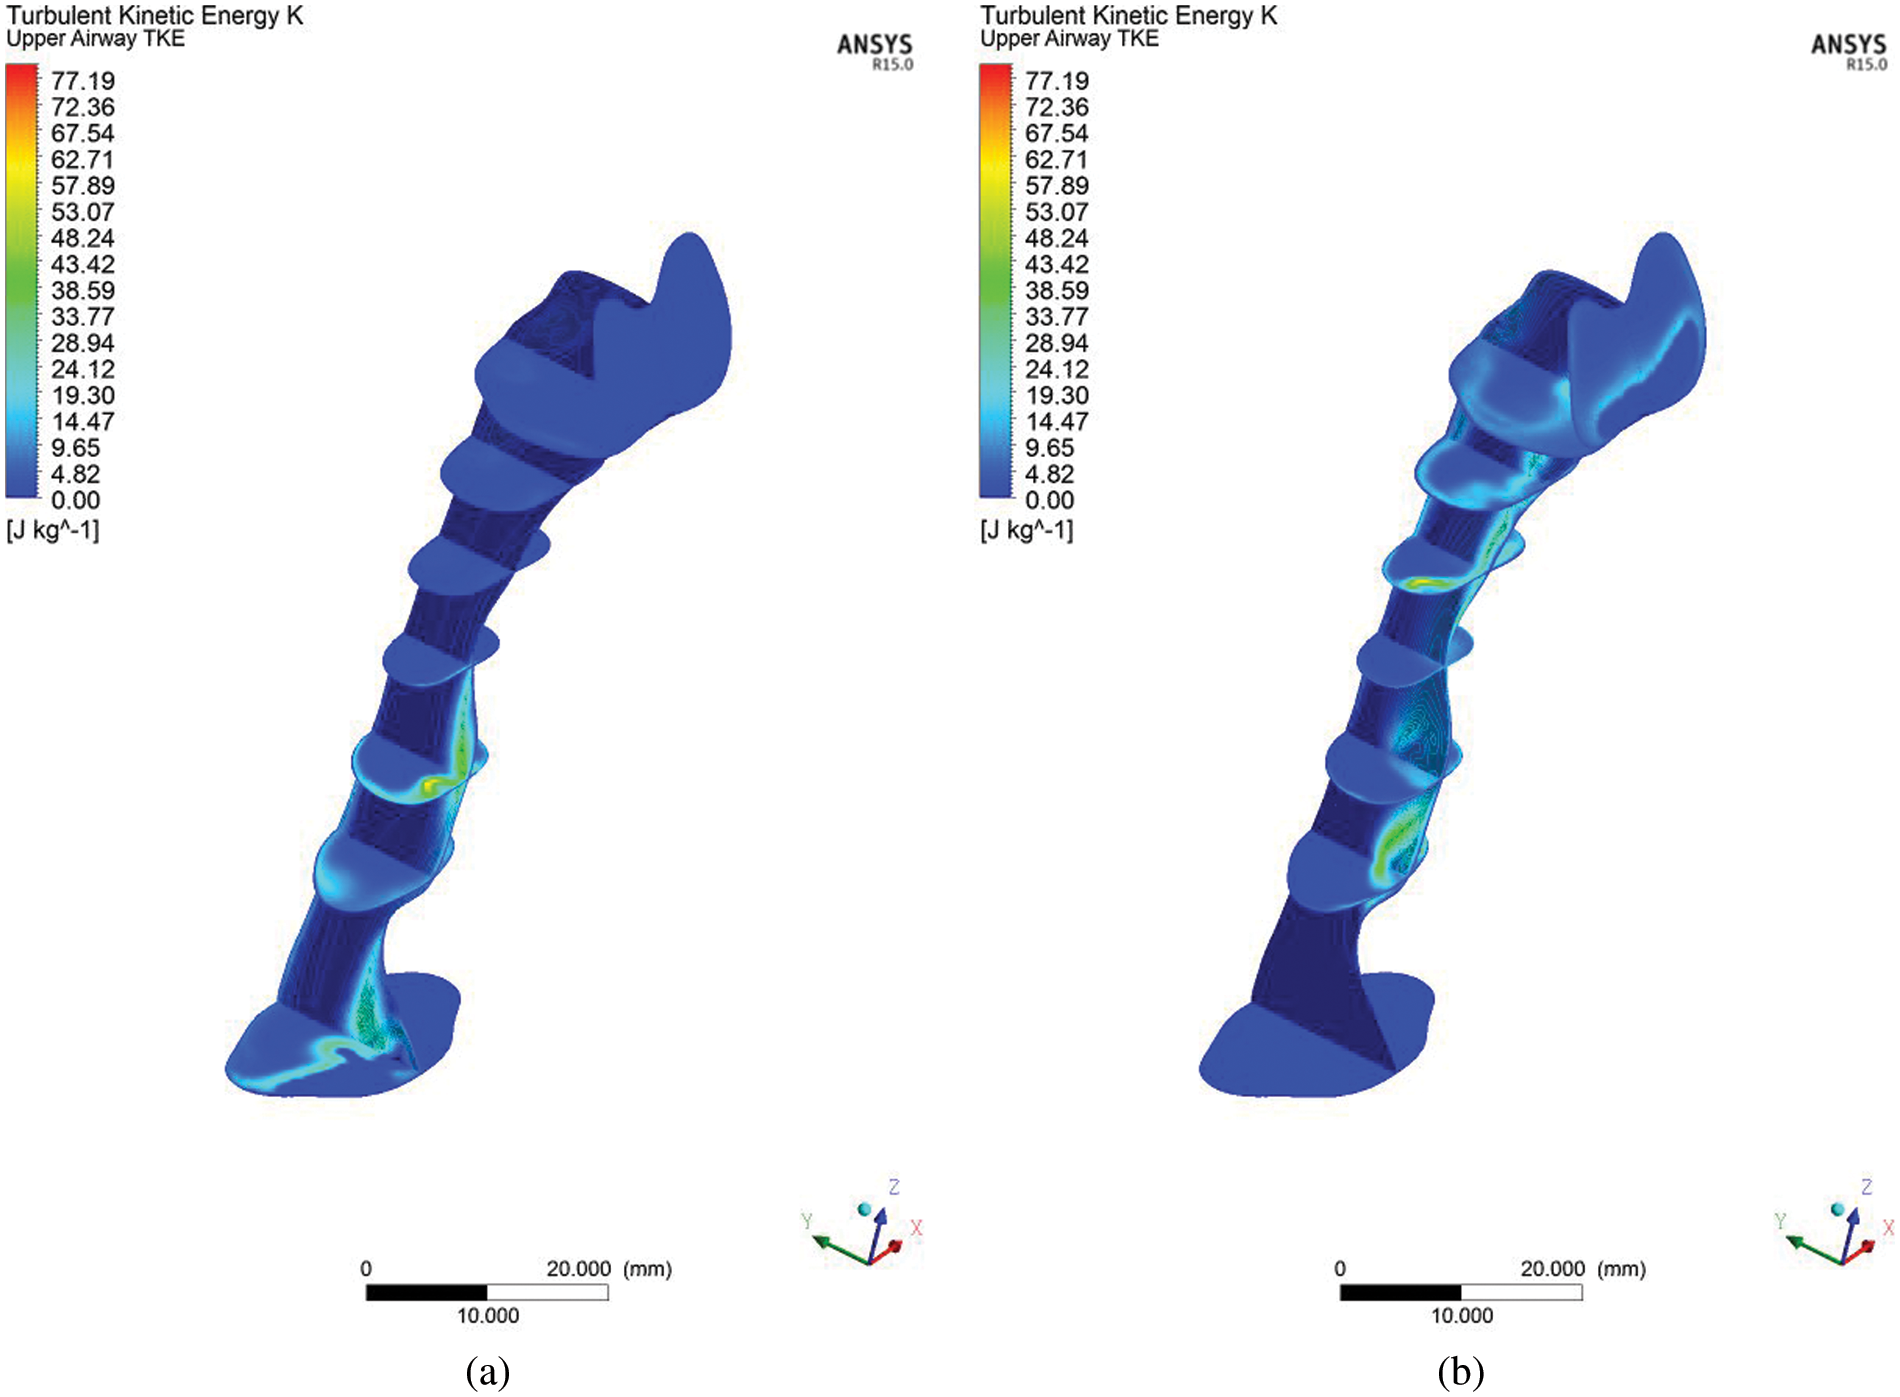
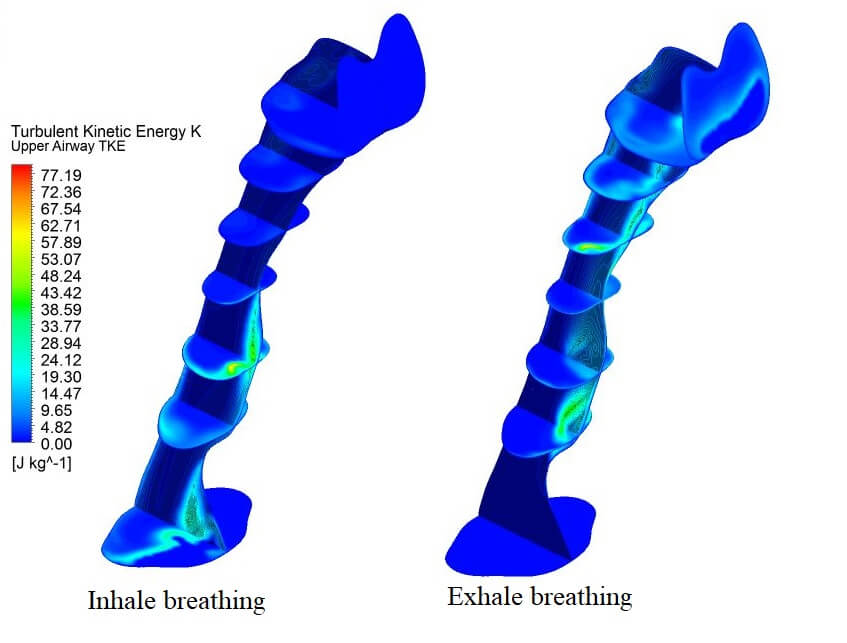
Figure 10: Contour of turbulent kinetic energy (TKE) in the upper airway at the centre plane (a) inhale and (b) exhale breathing condition
The CFD analysis computes TKE, and turbulent Reynolds number Rey. Figs. 8 and 10 show the distribution of TKE obtained from the velocity fluctuation, as shown in Eq. (4); whereas the turbulent Reynolds number was computed from Eq. (6), following the works by Calmet et al. [7]. The airflow motion in the airway is predominantly by the energy in turbulent flow; therefore, the application of TKE is deemed suitable to describe the vortex and quantify the turbulence level. The results show high turbulent kinetic energy concentrated after the narrow region. In addition, the formation of a jet stream was observed in the pharynx of the airway. The jet stream formed had hit the wall in the inhalation area, which may have caused velocity remodeling near the airway wall. Fig. 10 portrays the occurrence of TKE at high-velocity fluctuation induced by the recirculation phenomenon. TKE value helps provide new information on airflow characteristics. TKE can be used as a new parameter to characterize, as well as in the detection of the patient with OSA. Turbulent flow is generated when the airflow passes through the critical sectional area (Fig. 3) in the patient's upper airway. The severity of the turbulence can be explained more impressively and accurately by visualizing the TKE parameter (maximum TKE 77.19, in Fig. 10), which is similar to the clinical parameter, AHI of the patient (99.5). The TKE and AHI parameters are related to the OSA phenomenon, which will be helpful in the measurement of the severity of OSA.
The advent of high-resolution three-dimensional TKE able to be constructed from a synthesis of standard two-dimensional cross-sectional images, and of “Volume Render Mode,” a technique to analyze information inside a three-dimensional volume by digitally enhancing individual flow, promises to revolutionize the diagnosis of obstructive sleep apnea in patients, and the level severity of AHI. Using the different post-processing display parameters, the volume-rendered image provides better visualization performance when there are no significant differences in the signal levels of the conventional approach, as shown in Fig. 11. In Fig. 11, the TKE occurs after the critical area for both breathing conditions, either inspiration or expiration.
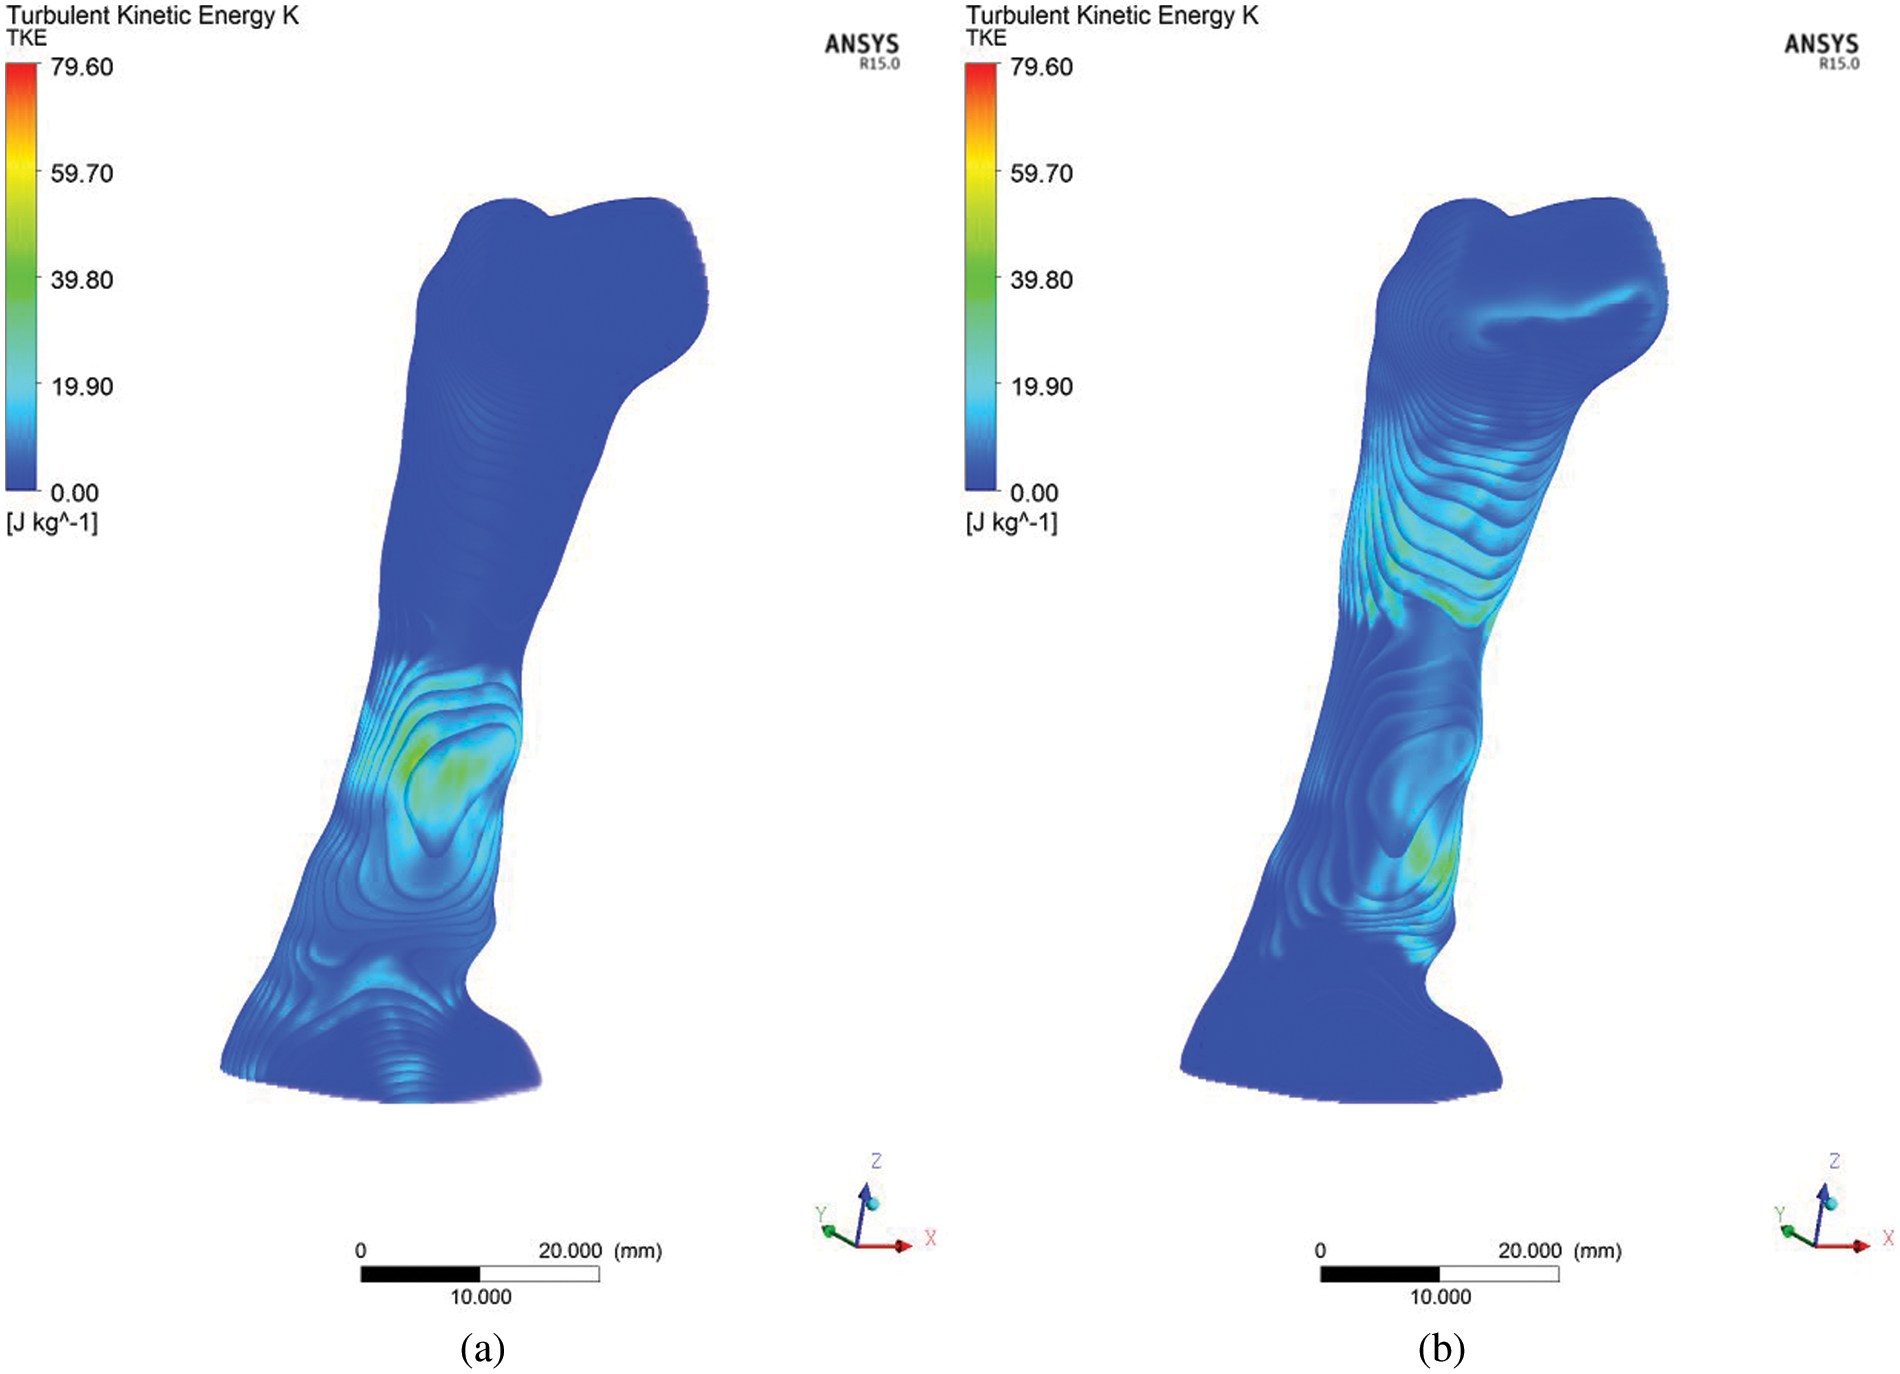
Figure 11: Volume Rendering of turbulent kinetic energy (TKE) for (a) inhale and (b) exhale breathing conditions
3.6 Body Force Acting on the Upper Airways
The biomechanical aspect during the inhale and exhale breathing is focused on the body forces exerted on the upper airway. During breathing, the deterioration of the airflow pattern creates pressure variation, velocity, and TKE in the upper airway. as shown in Figs. 4, 7, 9, and 11. The pressure variation leads to the variation of body forces acting on the upper airway. The forces acting on the upper airways during inhale and exhale breathing are depicted in Fig. 12. The simulation results (Fig. 12) demonstrated that the forces exerted on the upper airway during inhaling are greater than exhaling. The forces are concentrated on the upper airway after the narrow region. This phenomenon also corresponded to the high turbulent kinetic energy (TKE) found in Fig. 10 (in Section 3.5), indicating that the high TKE could increase body forces. The pressure variation, velocity, and TKE corresponded with the biomechanical aspect of the upper airway. The phenomenon is synchronous with the findings in the previous work [35]. The width of the pharyngeal airway [35] crucially influenced the vortex formation, aerodynamic pressure, and pharyngeal wall force.
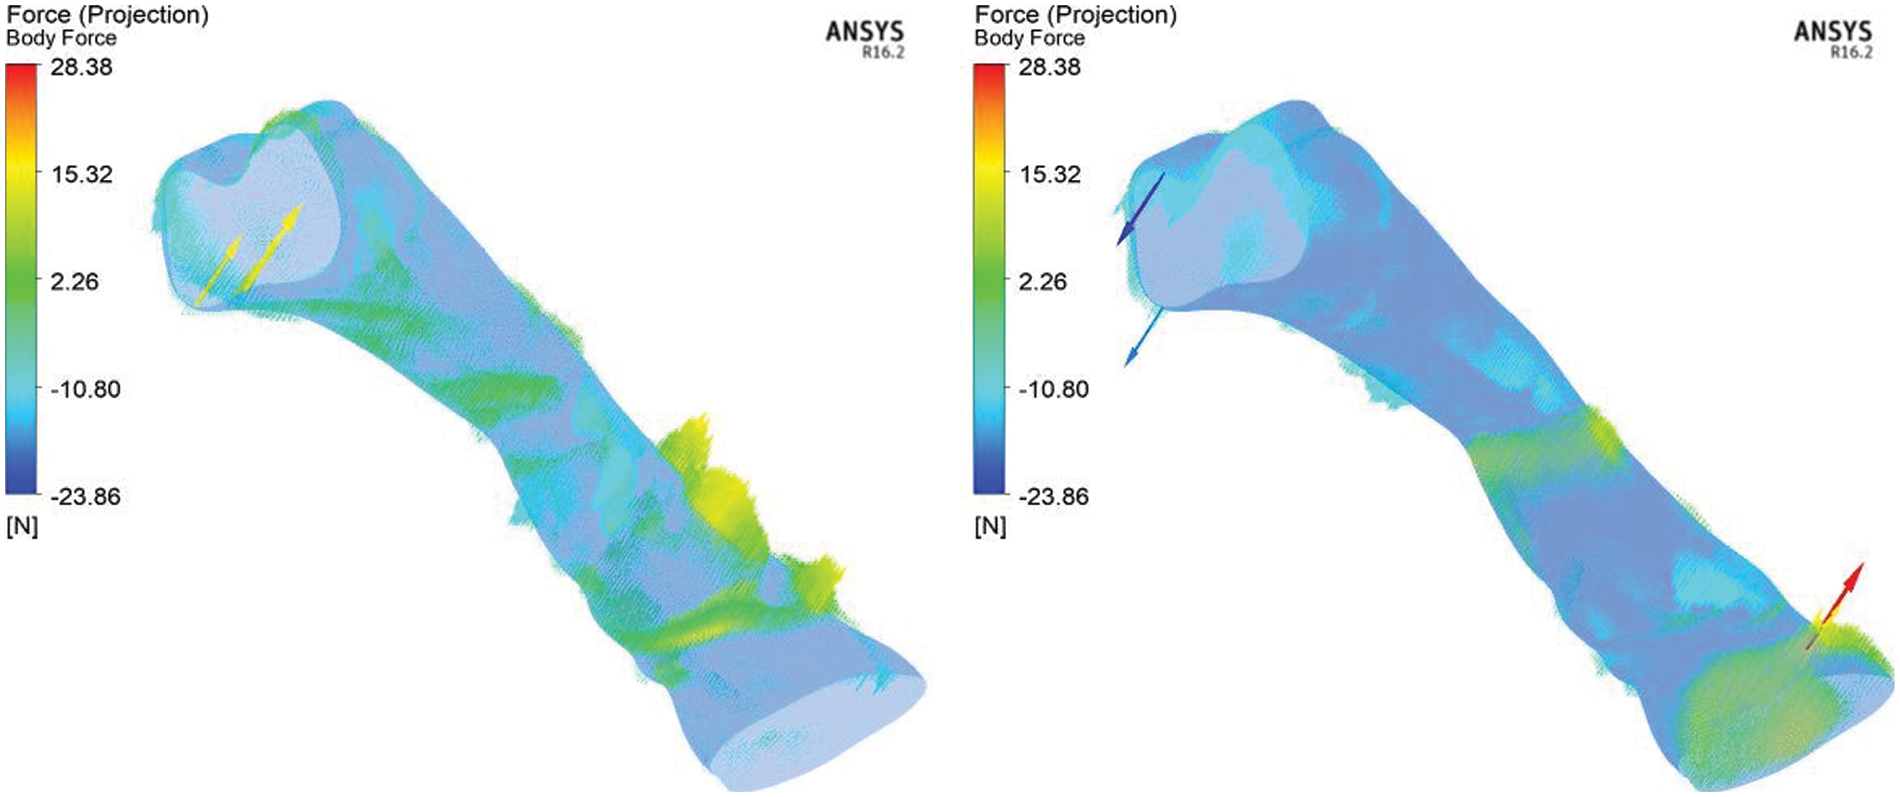
Figure 12: Body forces acting on the upper airways during inhale (left) and exhale (right) breathing condition
In this study, the computational analysis in analyzing the airflow characteristics in the upper airway has been investigated. Based on the results of this investigation, the following conclusions can be made:
• By comprehending the recirculation region and turbulent kinetic energy (TKE), a new tool could be developed to calculate the severity of obstruction in the simulation of the upper airway without requiring the patient to sleep all night in order to measure the obstruction in their breathing airway.
• The presence of turbulent flow may result in the vibration of the airway tissue, thereby reducing the tissue's strength over time; this causes laxity or collapse of tissue, which obstructs airflow.
• The current simulation results are expected to visualize the airflow characteristics during inhale and exhale breathing, thereby improving the understanding for medical practitioners in the OSA research field.
This work can be expanded for future recommendations by considering other aspects of the research scope, such as the growing number of case studies, fluid-structure interaction, expiratory breathing, and airway tissue vibration.
Funding Statement: This work is supported by the Fundamental Research Grant Scheme provided by the Ministry of Higher Education (Ref. No. FRGS/1/2020/TK0/UNIMAP/03/26).
Conflicts of Interest: The authors declare that they have no conflicts of interest to report regarding the present study.
References
1. Faizal, W., Ghazali, N., Khor, C. Y., Zainon, M. Z., Badruddin, I. A. et al. (2021). Computational analysis of airflow in upper airway under light and heavy breathing conditions for a realistic patient having obstructive sleep apnea. Computer Modeling in Engineering & Sciences, 128(2), 583–604. DOI 10.32604/cmes.2021.015549. [Google Scholar] [CrossRef]
2. Mentek, M., Aptel, F., Godin-Ribuot, D., Tamisier, R., Pepin, J. L. et al. (2018). Diseases of the retina and the optic nerve associated with obstructive sleep apnea. Sleep Medicine Reviews, 38(120), 113–130. DOI 10.1016/j.smrv.2017.05.003. [Google Scholar] [CrossRef]
3. Pauw, B., Weijtjens, W., Vanlanduit, S., Tichelen, K., Berghmans, F. (2015). Operational modal analysis of flow-induced vibration of nuclear fuel rods in a turbulent axial flow. Nuclear Engineering and Design, 284(9), 19–26. DOI 10.1016/j.nucengdes.2014.11.040. [Google Scholar] [CrossRef]
4. Rocha, J. (2016). Impact of the chosen turbulent flow empirical model on the prediction of sound radiation and vibration by aircraft panels. Journal of Sound and Vibration, 373(2), 285–301. DOI 10.1016/j.jsv.2016.03.026. [Google Scholar] [CrossRef]
5. Bertram, C. D. (2008). Flow-induced oscillation of collapsed tubes and airway structures. Respiratory Physiology & Neurobiology, 163(1–3), 256–265. DOI 10.1016/j.resp.2008.04.011. [Google Scholar] [CrossRef]
6. Faizal, W. M., Ghazali, N. N. N., Khor, C. Y., Badruddin, I. A., Zainon, M. Z. et al. (2020). Computational fluid dynamics modelling of human upper airway: A review. Computer Methods and Programs in Biomedicine, 196(12), 105627. DOI 10.1016/j.cmpb.2020.105627. [Google Scholar] [CrossRef]
7. Calmet, H., Gambaruto, A. M., Bates, A. J., Vazquez, M., Houzeaux, G. et al. (2016). Large-scale CFD simulations of the transitional and turbulent regime for the large human airways during rapid inhalation. Computers in Biology and Medicine, 69, 166–180. DOI 10.1016/j.compbiomed.2015.12.003. [Google Scholar] [CrossRef]
8. Lu, M. Z., Liu, Y., Ye, J. Y., Luo, H. Y. (2014). Large eddy simulation of flow in realistic human upper airways with obstructive sleep. Procedia Computer Science, 29, 557–564. DOI 10.1016/j.procs.2014.05.050. [Google Scholar] [CrossRef]
9. Mihaescu, M., Mylavarapu, G., Gutmark, E. J., Powell, N. B. (2011). Large eddy simulation of the pharyngeal airflow associated with obstructive sleep apnea syndrome at pre and post-surgical treatment. Journal of Biomechanics, 44(12), 2221–2228. DOI 10.1016/j.jbiomech.2011.06.006. [Google Scholar] [CrossRef]
10. Sittitavornwong, S., Waite, P. D. (2009). Imaging the upper airway in patients with sleep disordered breathing. Oral and Maxillofacial Surgery Clinics of North America, 21(4), 389–402. DOI 10.1016/j.coms.2009.08.004. [Google Scholar] [CrossRef]
11. Faizal, W. M., Ghazali, N. N. N., Badruddin, I. A., Zainon, M. Z., Yazid, A. A. et al. (2019). A review of fluid-structure interaction simulation for patients with sleep related breathing disorders with obstructive sleep. Computer Methods and Programs in Biomedicine, 180(5), 105036. DOI 10.1016/j.cmpb.2019.105036. [Google Scholar] [CrossRef]
12. Powell, N. B., Mihaescu, M., Mylavarapu, G., Weaver, E. M., Guilleminault, C. et al. (2011). Patterns in pharyngeal airflow associated with sleep-disordered breathing. Sleep Medicine, 12(10), 966–974. DOI 10.1016/j.sleep.2011.08.004. [Google Scholar] [CrossRef]
13. Zhao, M., Barber, T., Cistulli, P., Sutherland, K., Rosengarten, G. (2013). Computational fluid dynamics for the assessment of upper airway response to oral appliance treatment in obstructive sleep apnea. Journal of Biomechanics, 46(1), 142–150. DOI 10.1016/j.jbiomech.2012.10.033. [Google Scholar] [CrossRef]
14. Cheng, G. C., Koomullil, R. P., Ito, Y., Shih, A. M., Sittitavornwong, S. et al. (2014). Assessment of surgical effects on patients with obstructive sleep apnea syndrome using computational fluid dynamics simulations. Mathematics and Computers in Simulation, 106(3), 44–59. DOI 10.1016/j.matcom.2012.11.008. [Google Scholar] [CrossRef]
15. Farre, R., Montserrat, J. M., Navajas, D. (2008). Assessment of upper airway mechanics during sleep. Respiratory Physiology & Neurobiology, 163(1–3), 74–81. DOI 10.1016/j.resp.2008.06.017. [Google Scholar] [CrossRef]
16. Mylavarapu, G., Mihaescu, M., Fuchs, L., Papatziamos, G., Gutmark, E. (2013). Planning human upper airway surgery using computational fluid dynamics. Journal of Biomechanics, 46(12), 1979–1986. DOI 10.1016/j.jbiomech.2013.06.016. [Google Scholar] [CrossRef]
17. Lai, X., Li, S., Yan, J., Liu, L., Zhang, A. M. (2022). Multiphase large-eddy simulations of human cough jet development and expiratory droplet dispersion. Journal of Fluid Mechanics, 942, 303. DOI 10.1017/jfm.2022.334. [Google Scholar] [CrossRef]
18. Xu, X., Wu, J., Weng, W., Fu, M. (2020). Investigation of inhalation and exhalation flow pattern in a realistic human upper airway model by PIV experiments and CFD simulations. Biomechanics and Modeling in Mechanobiology, 19(5), 1679–1695. DOI 10.1007/s10237-020-01299-3. [Google Scholar] [CrossRef]
19. Ganimedov, V. L., Muchnaya, M. I. (2020). Numerical simulation of particle deposition in the human nasal cavity. Thermophysics and Aeromechanics, 27(2), 303–312. DOI 10.1134/S0869864320020122. [Google Scholar] [CrossRef]
20. Kiasadegh, M., Emdad, H., Ahmadi, G., Abouali, O. (2020). Transient numerical simulation of airflow and fibrous particles in a human upper airway model. Journal of Aerosol Science, 140(3), 105480. DOI 10.1016/j.jaerosci.2019.105480. [Google Scholar] [CrossRef]
21. Norouzi, A., Rahim, M. S. M., Altameem, A., Saba, T., Rad, A. E. et al. (2014). Medical image segmentation methods, algorithms, and applications. Institution of Electronics and Telecommunication Engineers (IETE) Technical Review, 31(3), 199–213. DOI 10.1080/02564602.2014.906861. [Google Scholar] [CrossRef]
22. Chan, A. S., Sutherland, K., Schwab, R. J., Zeng, B., Petocz, P. et al. (2010). The effect of mandibular advancement on upper airway structure in obstructive sleep apnoea. Thorax, 65(8), 726–732. DOI 10.1136/thx.2009.131094. [Google Scholar] [CrossRef]
23. Menter, F. R. (1994). Two-equation eddy-viscosity turbulence models for engineering applications. American Institute of Aeronautics Journal, 32(8), 1598–1605. DOI 10.2514/3.12149. [Google Scholar] [CrossRef]
24. Wilcox, D. C. (1988). Reassessment of the scale-determining equation for advanced turbulence models. American Institute of Aeronautics Journal, 26(11), 1299–1310. DOI 10.2514/3.10041. [Google Scholar] [CrossRef]
25. Kriventsev, V., Ohshima, H., Yamaguchi, A., Ninokata, H. (2003). Numerical prediction of secondary flows in complex areas using concept of local turbulent reynolds number. Journal of Nuclear Science and Technology, 40(9), 655–663. DOI 10.1080/18811248.2003.9715403. [Google Scholar] [CrossRef]
26. Wakayama, T., Suzuki, M., Tanuma, T. (2016). Effect of nasal obstruction on continuous positive airway pressure treatment: Computational fluid dynamics analyses. PLoS One, 11(3), e0150951. DOI 10.1371/journal.pone.0150951. [Google Scholar] [CrossRef]
27. Mylavarapu, G., Murugappan, S., Mihaescu, M., Kalra, M., Khosla, S. et al. (2009). Validation of computational fluid dynamics methodology used for human upper airway flow simulations. Journal of Biomechanics, 42(10), 1553–1559. DOI 10.1016/j.jbiomech.2009.03.035. [Google Scholar] [CrossRef]
28. Lantz, J., Ebbers, T., Engvall, J., Karlsson, M. (2013). Numerical and experimental assessment of turbulent kinetic energy in an aortic coarctation. Journal of Biomechanics, 46(11), 1851–1858. DOI 10.1016/j.jbiomech.2013.04.028. [Google Scholar] [CrossRef]
29. Chouly, F., van Hirtum, A., Lagrée, P. Y., Pelorson, X., Payan, Y. (2008). Numerical and experimental study of expiratory flow in the case of major upper airway obstructions with fluid-structure interaction. Journal of Fluids and Structures, 24(2), 250–269. DOI 10.1016/j.jfluidstructs.2007.08.004. [Google Scholar] [CrossRef]
30. Djukic, T., Saveljic, I., Pelosi, G., ParodiN, O., Filipovic, N. (2019). Numerical simulation of stent deployment within patient-specific artery and its validation against clinical data. Computer Methods and Programs in Biomedicine, 175, 121–127. DOI 10.1016/j.cmpb.2019.04.005. [Google Scholar] [CrossRef]
31. Zhu, L., Liu, H., Fu, Z., Yin, J. (2019). Computational fluid dynamics analysis of H-uvulopalatopharyngoplasty in obstructive sleep apnea syndrome. American Journal of Otolaryngology, 40(2), 197–204. DOI 10.1016/j.amjoto.2018.12.001. [Google Scholar] [CrossRef]
32. Gupta, R. J., Silva, R. G., Connelly, S. T. (2017). Understanding the effects of mandibular repositioning devices on the airway of patients with obstructive sleep apnea: A computational fluid dynamics study. Journal of Oral and Maxillofacial Surgery, 75(10), e381–e382. DOI 10.1016/j.joms.2017.07.097. [Google Scholar] [CrossRef]
33. Green, A. S. (2004). Modelling of peak-flow wall shear stress in major airways of the lung. Journal of Biomechanics, 37(5), 661–667. DOI 10.1016/j.jbiomech.2003.09.024. [Google Scholar] [CrossRef]
34. Chowdhary, R., Singh, V., Tattersfield, A. E., Sharma, S. D., Kar, S. et al. (1999). Relationship of flow and cross-sectional area to frictional stress in airway models of asthma. Journal of Asthma, 36(5), 419–426. DOI 10.3109/02770909909087284. [Google Scholar] [CrossRef]
35. Wang, J., Xi, J., Han, P., Wongwiset, N., Pontius, J. et al. (2019). Computational analysis of a flapping uvula on aerodynamics and pharyngeal wall collapsibility in sleep apnea. Journal of Biomechanics, 94, 88–98. DOI 10.1016/j.jbiomech.2019.07.014. [Google Scholar] [CrossRef]
Cite This Article
 Copyright © 2023 The Author(s). Published by Tech Science Press.
This work is licensed under a Creative Commons Attribution 4.0 International License , which permits unrestricted use, distribution, and reproduction in any medium, provided the original work is properly cited.
 Downloads
 Citation Tools