
 Submit a Paper
 Propose a Special lssue
 Open Access
ARTICLE

Behavioral Decision-Making of Key Stakeholders in Public-Private Partnerships: A Hybrid Method and Benefit Distribution Study
1 School of Economics and Management, Liaoning University of Technology, Jinzhou, 121001, China
2 School of Information Management, Jiangxi University of Finance and Economics, Nanchang, 330032, China
3 Post-Doctoral Research Center, Zhongda Construction Co., Ltd., Guangzhou, 510280, China
4 School of Science, Shanghai Institute of Technology, Shanghai, 201418, China
5 School of Maritime Economics and Management, Dalian Maritime University, Dalian, 116026, China
* Corresponding Author: Jiuying Dong. Email:
(This article belongs to the Special Issue: Decision making Modeling, Methods and Applications of Advanced Fuzzy Theory in Engineering and Science)
Computer Modeling in Engineering & Sciences 2023, 136(3), 2895-2934. https://doi.org/10.32604/cmes.2023.025652
Received 24 July 2022; Accepted 08 December 2022; Issue published 09 March 2023
 View Full Text
 Download PDF
Abstract
Public-private partnerships (PPPs) have been used by governments around the world to procure and construct infrastructural amenities. It relies on private sector expertise and funding to achieve this lofty objective. However, given the uncertainties of project management, transparency, accountability, and expropriation, this phenomenon has gained tremendous attention in recent years due to the important role it plays in curbing infrastructural deficits globally. Interestingly, the reasonable benefit distribution scheme in a PPP project is related to the behavior decision-making of the government and social capital, as well as the performance of the project. In this paper, the government and social capital which are the key stakeholders of PPP projects were selected as the research objects. Based on the fuzzy expected value model and game theory, a hybrid method was adopted in this research taking into account the different risk preferences of both public entities and private parties under the fuzzy demand environment. To alleviate the problem of insufficient utilization of social capital in a PPP project, this paper seeks to grasp the relationship that exists between the benefit distribution of stakeholders, their behavioral decision-making, and project performance, given that they impact the performance of both public entities and private parties, as well as assist in maximizing the overall utility of the project. Furthermore, four game models were constructed in this study, while the expected value and opportunity-constrained programming model for optimal decision-making were derived using alternate perspectives of both centralized decision-making and decentralized decision-making. Afterward, the optimal behavioral decision-making of public entities and private parties in four scenarios was discussed and thereafter compared, which led to an ensuing discussion on the benefit distribution system under centralized decision-making. Lastly, based on an example case, the influence of different confidence levels, price, and fuzzy uncertainties of PPP projects on the equilibrium strategy results of both parties were discussed, giving credence to the effectiveness of the hybrid method. The results indicate that adjusting different confidence levels yields different equilibrium points, and therefore signposts that social capital has a fair perception of opportunities, as well as identifies reciprocal preferences. Nevertheless, we find that an increase in the cost coefficient of the government and social capital does not inhibit the effort of both parties. Our results also indicate that a reasonable benefit distribution of PPP projects can assist them in realizing optimum Pareto improvements over time. The results provide us with very useful strategies and recommendations to improve the overall performance of PPP projects in China.Keywords
Although concessions have been used by governments to develop public works since the 18th century, the Public Finance Initiative (PFI), which was introduced in the United Kingdom in 1992, is the modern form of public-private partnership (PPP) model that has gained global recognition [1]. Since then, PPP has been regarded as a way to innovatively produce and manage public services worldwide. Besides, PPP is widely viewed as a means to improve the overall quality and efficiency of public services [2]. That said, many countries around the world regard PPPs as a successful mechanism for solving infrastructural bottlenecks which alleviates the government from the financial pressures of a project and public debt [3,4]. However, even though the PPP model has developed rapidly and achieved remarkable results in China, project delivery costs, such as higher transaction and borrowing costs for private parties, as well as inflated operating costs of PPP projects hinder the attainment of mission-critical goals. Consequently, despite tremendous support being given by the government to facilitate social capital development, PPP has not yielded desired results—especially when value-for-money assessment requirements are incorporated [5]. Moreover, the practical application of PPP models entails that the utilization of social capital is still insufficient, which drives the factors influencing the decision-making of social capital investment in PPP projects to be reconsidered. Likewise, as the initiator of most projects, the government tries to cooperate with social capital by broadening financing channels, resolving local debt risks, improving their efficiency levels and quality of public services, and then attempts to protect public rights simultaneously. Expectedly, the government’s goal in a PPP project is to maximize public welfare. However, the motive of social capital is the potential profitability of the project, which may harm public welfare [6]. Notably, to attract substantial social capital investment, the government should endeavor to satisfy its precondition of providing both social and economic benefits to its citizens and private parties using taxes, subsidies, and incentives as instruments of optimum allocation.
As China is in the rapid development period of infrastructure upgrading, the infrastructure has become more abundant in various facets of the economy, and the PPP model is being encouraged to enter more fields. However, when compared with traditional PPP projects, the market risk faced by social capital participation in new PPP project models is higher than before, as a result of the uncertainty of the future market in the new field in recent years. For instance, the old residential reconstruction project has emerged recently in China and the government encourages social capital participation [7], notwithstanding that the implementation mode is still being explored. Thus, there exist uncertainties in the future market which portends significant risks that might affect the long-term operation of PPP projects. Although the Chinese government fully supports innovation in the traditional PPP model, uncertainties about whether social capital can get the corresponding return when implementing innovation in PPP projects imply that the attitude of social capital towards innovation might be quite different [8]. Therefore, social capital responds not only to the uncertainties arising from policy changes by local governments but also to the unpredictability of market demand, technological construction, and management changes. Furthermore, current realities indicate that there exists great ambiguity about the degree to which the infrastructure and public services provided by social capital can be accepted by the market. In addition, the prospect of most PPP projects is tentative for both the government and social capital, and both parties will jointly face the uncertainty of the project benefit. The traditional stochastic models cannot well explain the complex behavior of PPP projects. In some practical cases, due to the limitation of the system and time, it is difficult to collect data [9]. To effectively manage PPP projects, the fuzzy theory is an important theoretical tool to solve fuzzy phenomena in management decision-making and game problems when compared with probability theory. Besides, a thick description of these uncertainties plays an important role in solving fuzzy uncertainties.
In the same vein, since profit and loss are an important basis for stakeholders to make informed decisions as to whether to participate in PPP projects or not, a reasonable benefit distribution mechanism is the basic qualification for the success of an excellent PPP project. For instance, the fairness of benefit distribution systems provides incentives for social capital to participate in decision-making processes that promote its efforts and positively influence the performance of PPP projects [10,11]. There are some stakeholders involved in PPP projects, who have different and overlapping interests, and each stakeholder has its characteristics in the attitude towards project risks. Therefore, an in-depth analysis of the relationship between the behavioral decision-making of various stakeholders and project performance is of great significance for the successful implementation of PPP projects. However, the behavioral decision-making of stakeholders in PPP projects has not been paid enough attention to, and the existing research on the relationship between decision-making and performance in PPP projects is also very few. In this respect, this study attempts to explore the reasonable distribution of benefits in public-private partnerships and find the influence mechanism of benefit distribution of PPP projects in different circumstances, thus affecting the behavioral decision-making of stakeholders and then improving the performance of PPP projects. Stakeholders of a PPP project include government departments, project companies, social capital, clients, and so on [12,13]. But the government and social capital are selected as research objects in this paper, which have an interest in the project and have the ability to influence the project.
Apart from the above motivation, another decisive task is to adopt a best-fitted methodology to supply the gaps. As there are many uncertain conditions in PPP projects, these uncertain conditions cannot be ignored in this study, so we should consider how stakeholders of a PPP project make their own behavioral decisions in the fuzzy decision-making environment. Unlike the traditional approach, where the possible uncertainties in a PPP project have been solved based on probability theory. But probability distributions are usually predicted based on historical data. When statistical data are unreliable, the models based on determining these probability distributions may not be the best choice [14]. The application of fuzzy theory has been considered in many fields and achieved satisfactory results. Thus, we apply fuzzy theory and game theory to explore the best performance of a PPP project and the behavioral decision-making of stakeholders with different risk preferences. To the best of our knowledge, no significant study has been found that explores the issue using fuzzy theory, particularly since the research idea is entirely missing in PPP literature. The main contributions and innovations of this paper are as follows. Firstly, the expectation model and the opportunity-constrained programming model are introduced into the game model of public-private behavioral decisions in a PPP project, enriching the theoretical study in this field. Secondly, it is taken into account that the government and social capital are decision-making subjects with different risk preferences and the utility differences are caused by the cognition of actors, then four game models are put forward. Thirdly, the coordination mechanism of benefit distribution of stakeholders under decentralized decision-making and centralized decision-making is studied, and sensitivity analysis is made on the influencing factors. Through the research, the government is provided with a theoretical basis and reference path to improve the performance of a PPP project more scientifically and effectively.
The rest of this paper is structured as follows. Section 2 introduces the existing research results. Section 3 lists some preliminaries, including the definition of the expected value of fuzzy variables, and the concept of triangular fuzzy numbers. Section 4 describes the problem and proposes assumptions. Section 5 is the process of model optimization and solution. Section 6 designs the benefit distribution between public entities and private parties under centralized decision-making. Section 7 demonstrates the four models under decentralized decision-making and centralized decision-making through a specific example, and analyzes the sensitivity of the factors that affect the behavioral decision-making of public entities and private parties. Then, by comparing with other similar studies, the outstanding advantages of the four models proposed in this paper are shown. Section 8 puts forward conclusions and suggestions, and finally summarizes the limitations and future study of this paper in Section 9.
The present study examines the link between the performance of a project and behavioral decision-making of stakeholders in PPP models by considering the role of benefit distribution, risk preference, and effort level of public entities and private parties in the case of China.
Economic benefits are the main driving force for the private party involved in the PPPs, hence, there should be a reasonable and efficient distribution of benefit system. In the existing studies, Love et al. [15,16] pointed out that fair distribution between public entities and their private partners was crucial for the delivery performance of infrastructure projects. Similarly, Dyer [17,18] were of the view that it was only when the benefit was fairly distributed in PPP projects, that efforts could be rewarded, which motivated various parties to develop enthusiasm to participate in PPP projects. Interestingly, Wang et al. [19] put forward that a fairer and more reasonable benefit distribution system should include capital investments, asset monetization, and private contributions, as well as participation in PPP projects. That is why Fainstein [20] introduced the benefit distribution of PPPs in Singapore. However, since the public sector controls the benefit distribution of PPPs in Singapore, which is dominated by the state, there is a tendency that private parties might not be satisfied with the benefit distribution system. From the above-mentioned literature review, it is obvious that the distribution of the benefit of PPP projects is a contentious matter, notwithstanding its importance. Although there exist some limitations in parameter selection and application environment in previous studies, they still provide development ideas for further research exploring the relationship between benefit distribution and the project performance of PPPs. Besides, it had been proven beyond reasonable doubt that reciprocal preference in the exchange of potential information among team members, and the development of a good cooperative relationship had positive effects on project performance [21]. This is the reason why the Chinese government could make use of reciprocal preferences to encourage social capital to make concerted efforts in the process of cooperation, as well as avoid any moral hazard and opportunistic [22]. In this paper, social capital is one of the stakeholders, which can be regarded as a private party. Therefore, in PPP projects, how to encourage social capital to invest more resources and efforts in the project, and how to rationally distribute the total output and income of the project play an important role in studying the behavior of participants’ decision-making and the PPP project performance.
Consistent with prior studies, the researcher observes that the impact of benefit distribution has been investigated using empirical techniques such as the Shapley value method, Nash negotiation model-based distribution method, the game quadratic programming (GQP) method, as well as the simplified minimum cost-remaining savings (MCRS) method. In addition, some researchers have also used game theory to study the distribution of benefits between public entities and private parties in PPP projects. According to Ding et al. [23], a quantitative method based on simulating an unfair aversion of alliance members to analyze the risk-sharing arrangement in PPP projects was found to be effective when studying the impact of benefit distribution in PPPs. Cao et al. [24] established a tripartite rent-seeking game model to explore the game dilemma among government regulators, private enterprises and government agents involved in the bidding operation of PPP projects. Feng et al. [25] regarded the decision-making activities of the concession period as a negotiation game process between public entities and private parties, thereafter, solved the optimization problem using a backward induction technique. Besides, under the current Chinese PPP model, the status of the government and social capital is different, since it depicts a principal-agency relationship. Given that the decision-making process of both parties involves the government deciding on an appropriate investment plan, while social capital follows the same strategy, it is completely suitable to be analyzed by the Stackelberg game model [26]. In the studies of PPP projects using the Stackelberg model to analyze the behavior decisions of both public and private parties, Wang et al. [27] constructed a Stackelberg game model to find the best subsidy plan given different levels of the government financial capacity (GFC). Liu et al. [28] established a bi-level programming model with the Stackelberg game to solve the multi-objective programming problem of public-private asymmetry, and verified the effectiveness of the model and algorithm through an example. Shang et al. [29] proposed a model based on the Stackelberg game to help public institutions design the payment mechanism for PPP transportation projects. Based on the transaction cost theory, Zhang et al. [30] constructed the incentive mechanism and value-added Stackelberg game model of PPP projects under the early intervention scenario of financial institutions.
Fascinatingly, in contemporary PPP literature, the fuzzy theory is widely applied to risk analysis, scheme selection, influencing factor analysis, and so on. For instance, Ameyaw et al. [19,31] studied the allocation of risks in PPP water-infrastructure and waste recycling projects based on a fuzzy approach. Correspondingly, Mazher et al. [32] proposed a non-additive fuzzy integral based multiple attribute risk allocation decision approach to effectively aggregate each stakeholder’s risk management capability assessment on the accepted risk allocation principles in PPPs. And Liu et al. [33] proposed an entropy-based gained and lost dominance score (GLDS) method for the social capital selection of PPP projects using their fuzzy information. Okudan et al. [34] established an alternative dispute resolution selection framework to settle disputes involving PPP projects. Given the anomalies that might result from PPP evaluation, Wang et al. [35] assessed the impact of the critical success factors of PPP projects using fuzzy theory. Due to the large investment scale of PPP projects and their complicated financing structure [36–38], managing PPP projects is a difficult task [39,40]. Moreover, the environmental emergencies related to the complexity and environmental uncertainty of PPP projects pose serious challenges [41]. Studies on the existing PPP projects emphasized the importance of risk assessment [42–48], rational design of concession period [49–53], and the government subsidy incentive mechanism to avoid contract renegotiation and ensure the successful operation of the project [54–56]. For the uncertain factors in a PPP project, Monte Carlo simulation of random variables was mostly used [57–62]. The results of the Monte Carlo simulation were represented by the probability distribution function (PDF) and cumulative distribution function (CDF) [63]. Traditional Stackelberg game models also deal with uncertain variables based on probability theory.
From the literature review, it can be concluded that the fair and reasonable distribution of benefits in a PPP project can attract the investment of social capital and put more effort into it. However, there is little research on the influence of benefit distribution combined with other factors on the behavioral decision-making of stakeholders, which is still a research gap. For instance, these studies rarely involve the comparison of public-private benefit distribution schemes under decentralized decision-making and centralized decision-making. Some studies only consider the risk preference of social capital, ignoring the risk preference of the government in practice. Some studies have studied how to improve the participation enthusiasm of social capital, but these references focus on the research of the government subsidy mechanism, ignoring the objective effort and endogenous motivation of social capital. In addition, some studies have not considered the uncertainty in a PPP project, and given certain values to some uncertain variables such as demand and market size, which to some extent makes the research results unreasonable. Besides, although the fuzzy theory has been applied in the field of PPP, most existing PPP studies use the probability distribution of known parameters to reflect the uncertainty in a PPP project, which makes the characterization of uncertain variables influenced by the subjectivity of researchers, and the parameter data used to input probability distributions into the simulation model is easy to change and difficult to predict.
Therefore, in this study, we examine the link between the performance of the project and the behavioral decision-making of key stakeholders in a PPP project based on fuzzy expected value and game theory. Moreover, the benefit distribution, risk preference and effort level are considered.
Let
Definition 1. [65] Assume that
Definition 2. [65] Assume that
Definition 3. [66] A triangular fuzzy number
where
Example 1: Assume that
Lemma 1 [67]: Assume that fuzzy variables
1)
2) If
3)
4)
Lemma 2 [67]: If
Lemma 3 [67]: Assume that fuzzy variables
Example 2: Assume that
Example 3: Assume that
Definition 4 [67]: Assume that fuzzy variables
4 Description and Hypothesis of Problem
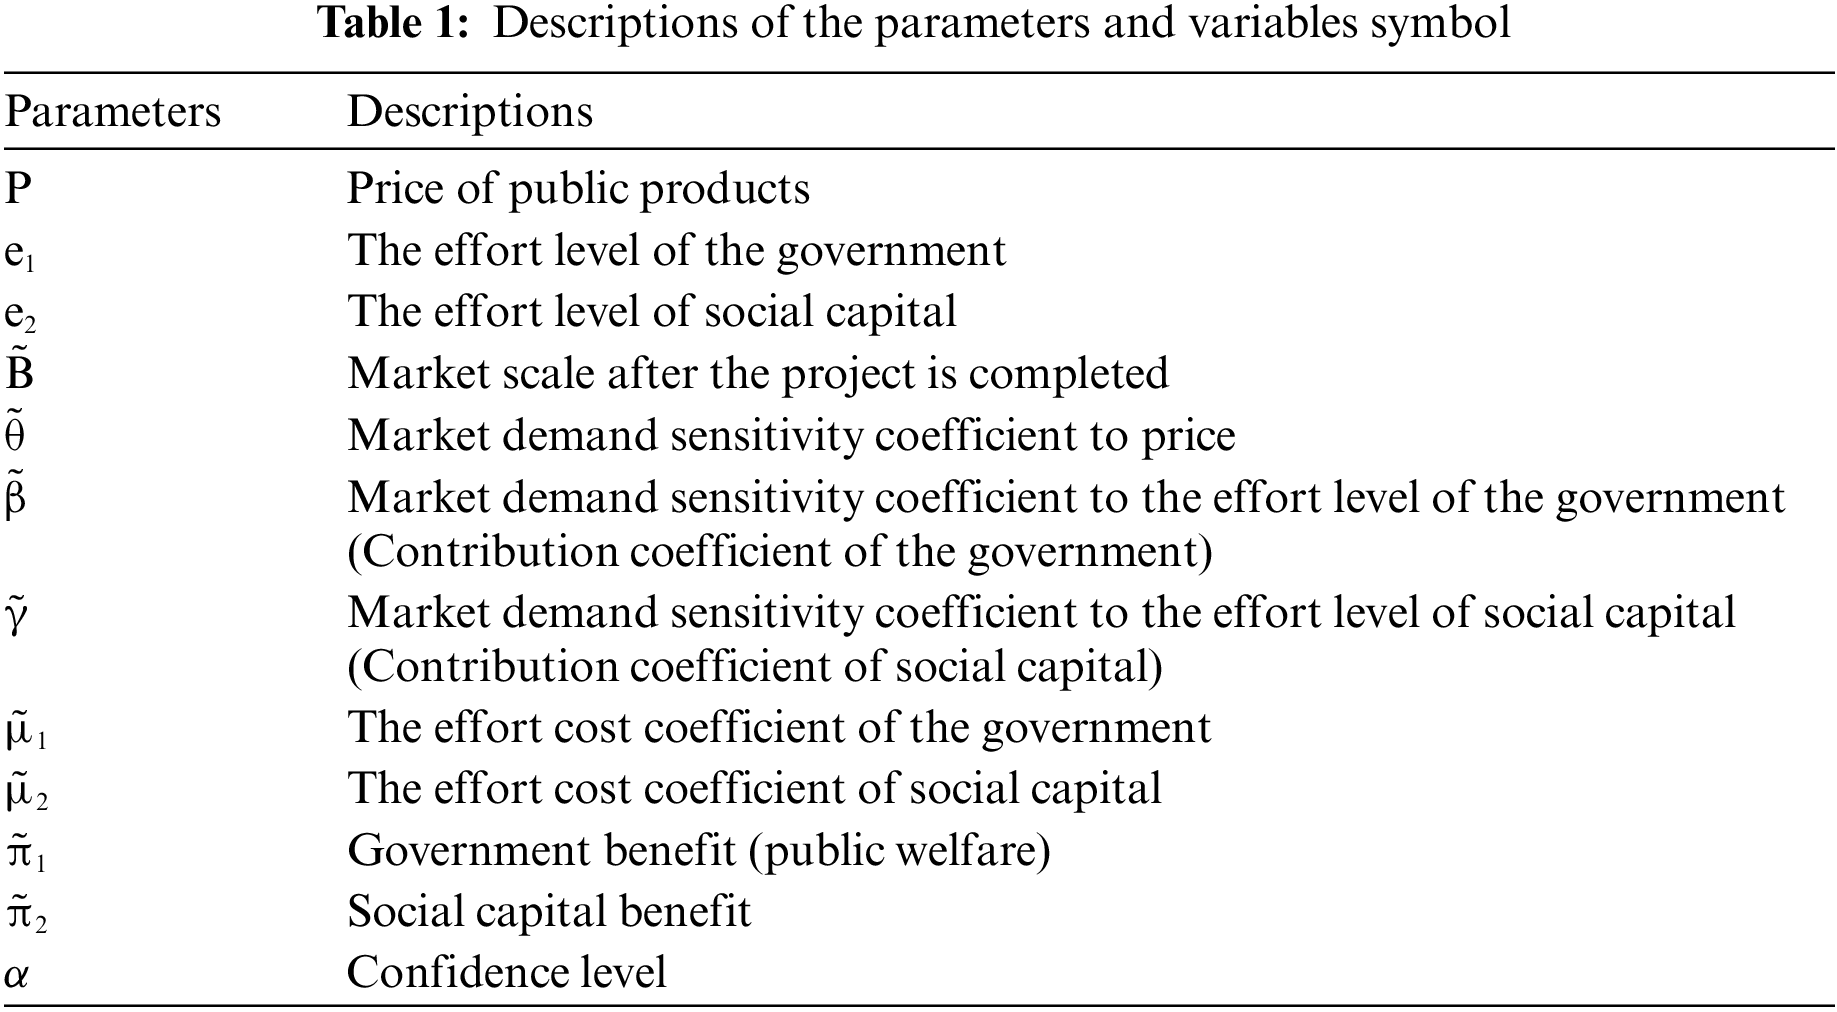
The motivation for this study is that the rational distribution of benefits between the government and social capital is analyzed, which affects the behavioral decision-making of both parties, and then improves the performance of a PPP project. The existing studies used the probability distribution of given parameters to reflect the uncertainty of benefits and market demand in a PPP project. However, the risk of infrastructure construction at the present stage is obviously higher than in the past, and there is great uncertainty about the extent to which the infrastructure projects and public services provided by social capital can be accepted by the market. Moreover, the complicated internal and external environment of a PPP project adds more technical and management uncertainties. If the unknown parameters are described by some random variables, it will cause a big deviation, so it is more difficult to estimate the distribution of random variables accurately. Therefore, the corresponding parameters in the demand function predicted by the experience of industry experts are more valuable for reference. Market scale, the effort cost coefficient of the government and social capital are fuzzy and uncertain. Market demand sensitivity coefficient to price and effort level of both public entities and private parties are related to the performance of both parties during the process of project operation. Fuzzy theory is an effective tool to solve fuzzy phenomena in management decision-making and game problems, and it plays an important role in solving such fuzzy and uncertain problems. The parameters and variables symbol used in this paper are shown in Table 1.
To simplify the research environment, this paper puts forward the following hypotheses.
Hypotheses 1: The key stakeholders of this project are the government and social capital. The government is the initiator of the project, and also provides various policy support for the project. The overall investment in the PPP construction period is
Hypotheses 2: After the completion of a PPP project, the demand function is related to the price of public products, as well as the effort level of both public entities and private parties. With reference to the functional expression of logistics service demand [68], the fuzzy demand function of the market can be expressed as:
Hypotheses 3: The government’s effort is manifested in the subsidies and taxation of the project, supervision responsibility of the quality and the price of public goods, as well as the management of project construction risks. Therefore, the government’s effort cost can be expressed as:
Hypotheses 4: The government always takes the maximization of public welfare as its goal, while social capital pursues economic benefit. During the concession period of the project, it is agreed that the proportion of the government in the overall benefit of a PPP project (the benefit obtained by the government from the project is public welfare) is
Hypotheses 5: Traditionally, the government’s motivation for adopting PPP projects is the technical experience and the financial advantage provided by social capital [70]. Generally, the government mainly bears the macro-political risk that has little impact on the construction of PPP projects, while the social capital mainly bears the risk at the meso level [71]. In addition, given that the government performs the function of supervising and subsidizing social capital, the government might be risk-averse. Therefore, the risk preference of the government is set to pessimistic in this paper. At the same time, because of the long operation cycle of PPP projects, and many uncertain factors, the decision-making of social capital in the process of project implementation is not always rational, so the risk preference of social capital is set to neutral, pessimistic and optimistic. Neutral decision makers are more rational, and the benefit is the expected value of the decision-makers’ benefit. Pessimistic decision makers are cautious about risks, and will not take radical actions, however, the benefit is the pessimistic value of decision makers(α). Optimistic decision-makers are willing to accept the idea of high risk and high benefit and make project decisions with a high-risk attitude, so the benefit is the optimistic value of decision makers(α).
Based on the assumptions above, the following models were developed as follows:
1. The utility function of government is:
2. The utility function of social capital is:
3. The overall utility function of the project is:
5 Optimization and Solution of Model
In this section, four game models are presented in a fuzzy environment and the effort and performance of both parties are studied. It is that social capital with neutral, pessimistic and optimistic risk preference is the follower when the pessimistic government with risk aversion is the leading role, and the fourth model is the centralized decision-making with complete coordination of benefits and complete symmetry of information between both parties.
5.1 Decentralized Decision-Making
Under the decentralized decision-making model, both the government and social capital aim at maximizing their own benefits. According to the benefit distribution scheme provided by the government and the effort level of the government, the social capital will make investment decisions on the premise of maximizing expected utility, but the government does not have private information for social capital’s decision-making. The problem faced by the government in the decision-making of benefit distribution of a PPP project is how to design a suitable distribution scheme to induce social capital to invest in construction at the optimal effort level. The specific game process can be divided into two stages: the first stage is to determine the proportion of benefit distribution and the effort level of the government. The second stage is to determine the effort level of social capital. While
5.1.1 Decision-Making Model of Government Pessimism and Social Capital Neutrality
A pessimistic government with risk aversion plays a leading role in the Stackelberg game model. Firstly, we determine the proportion of benefit distribution (
where α is the confidence level given in advance, min
Thus, in a fuzzy environment, which is dominated by a pessimistic government with risk aversion and followed by social capital with a neutral risk preference, the following conclusions can be drawn from the decision-making model of PPP projects.
Theorem 1:
Proof: The benefit of social capital with neutral risk preference is expressed as follows:
then
The first derivative and second derivatives of
Since
The optimal effort level of social capital obtained from Eq. (15) is as follows:
Theorem 1 is proved.
Theorem 2:
Proof: The second stage of the game is considered, and backward induction is used to analyze the strategic choices of both parties, which is the maximization of the utility of the government and social capital.
Consequently, the benefit of a pessimistic government with risk aversion is as follows:
If
The first derivative of
We derive the first partial derivative of
The following equation can be obtained by combining Eqs. (19) and (20).
If Eq. (21) is combined with Eq. (16), it is rewritten as follows:
Therefore, the Stackelberg-Nash equilibrium solution of Eq. (10) is
The overall benefit of the project is
Theorem 2 is proved.
5.1.2 Decision-Making Model of Government Pessimism and Social Capital Pessimism
As mentioned above, the proportion of benefit distribution (
The fuzzy opportunity-programming model can solve the problem of maximizing the pessimistic benefit of the participants’ expectation objective function, based on the premise that constraint conditions are established at a certain confidence level, where α is the confidence level given in advance. Besides, min
In the fuzzy environment, the following conclusions can be drawn from the decision-making model of a PPP project, which is dominated by the pessimistic government with risk aversion and followed by the pessimistic social capital with risk aversion.
Theorem 3:
Proof: The benefit of a pessimistic government with risk aversion is expressed as follows:
Then
The first derivative and second derivatives of
Since
Consequently, the optimal effort level of social capital obtained from Eq. (32) is as follows:
Theorem 3 is proved.
Theorem 4:
Proof: Firstly, the second stage of the game is considered, and backward induction is used to analyze the strategic choices of both parties, which is the maximization of the utility of the government and social capital.
Consequently, the benefit of a pessimistic government with risk aversion is as follows:
Then,
The first derivative of
We derive the first partial derivative of
The following equation can be obtained by combining Eqs. (36) and (37).
Put Eq. (38) into Eq. (33), Eq. (33) is rewritten as follows:
Therefore, the Stackelberg-Nash equilibrium solution of Eq. (27) is
The overall benefit of the project is
Theorem 4 is proved.
5.1.3 Decision-Making Model of Government Pessimism and Social Capital Optimism
As mentioned above, the proportion of benefit distribution (
The fuzzy opportunity-programming model can solve the problem of maximizing the pessimistic benefit of the participants’ expectation objective function, based on the premise that constraint conditions are established at a certain confidence level, where α is the confidence level given in advance. Besides, min
Thus, in a fuzzy environment, which is dominated by a pessimistic government with risk aversion and followed by a social capital with an optimistic risk preference, the following conclusions can be drawn from the decision-making model of a PPP project.
Theorem 5:
Proof: The benefit of social capital with a optimistic risk preference is expressed as follows:
It is the same as proof of Theorem 3, so the optimal effort level
Theorem 5 is proved.
Theorem 6:
The above is the Stackelberg-Nash equilibrium solution of Eq. (44).
Proof: If Eq. (46) is combined with Eq. (17), we derive get the following equation:
Since it is the same as the proving process of Theorem 4, then we set the first partial derivative of
The following equation can be obtained by combining Eqs. (48) and (49).
If Eq. (50) is substituted with Eq. (46), it can be rewritten as follows:
Therefore, the Stackelberg-Nash equilibrium solution of Eq. (44) is
The overall benefit of the project is
Theorem 6 is proved.
Remark 1: When the fuzzy variables in the model degenerate into clear numbers, Eqs. (10), (27) and (44) degenerate into a public-private cooperative game model in the succeeding precise demand environment.
Remark 2: When fuzzy variables
If
5.2 Centralized Decision-Making
Under centralized decision-making, the government and social capital make decisions as a benefits center, and the benefits of both parties are fully coordinated and the information is completely symmetrical. The risk preferences of both parties are neutral and rational individuals, and the expected value of benefits indicates the overall benefit of a PPP project.
In this study, centralized decision-making is represented by superscript C, resulting in the derivation of the ensuing decision-making model below:
Theorem 7: Under centralized decision-making, the equilibrium strategy of the optimal level of effort of the government and social capital in a PPP project is
Proof: According to Eq. (42), the first partial derivative of the overall expected benefit
From the above-mentioned equations, the optimal effort levels of both the government and social capital can be obtained as follows:
Hence, when Eq. (59) is combined with Eq. (56), the overall project benefit is as follows:
Theorem 7 is proved.
Theorem 7 shows that the optimal effort level of both the government and social capital is positively correlated with the price of public products and the expected value of the market demand sensitivity coefficient to effort level, and negatively correlated with the expected value of the effort cost coefficient of both parties. The higher the price of public products is, the better the benefit of the project achieves, and thus the more effort the government and social capital should make. The government can actively supervise and manage the operation of a PPP project, and social capital will give back to society with high-quality service, and the public will have a good experience. When the market demand sensitivity coefficient to effort level is higher, it means that the public response to the PPP project is better and the demand is greater. Naturally, considerable social and economic benefit will be obtained, and the government and social capital can be promoted to give full play to their utility, and the supply of public products can be brought into full play.
Theorem 8: The overall benefit of a PPP project under centralized decision-making and the efforts of both public entities and private parties are superior to those under decentralized decision-making.
Proof: Theorems 2, 4 and 6 are compared with Theorem 7 when the confidence level is 1. Because of
By comparing the effort level of centralized decision-making with the overall benefit of a PPP project, it can be found that the effort level of the government and social capital under centralized decision-making is higher than that under decentralized decision-making, and the overall benefit of the project is improved. It shows that the rationality of a single rational decision-maker is not the best choice, which reflects the limitations of a non-cooperative game. In the PPP project cooperation, collective rational behavior can maximize the overall project benefit, and this centralized decision-making behavior can further realize Pareto optimality.
6 Design of Benefit Distribution between Public Entities and Private Parties under Centralized Decision-Making
Based on the above-mentioned analysis, if the benefits of the government and social capital can be reasonably distributed under centralized decision-making, then the benefits derived from both public entities and private parties would be higher than those under decentralized decision-making. Therefore, Pareto optimality improvement can be used to realize the desired goals. Moreover, it can urge both parties to make greater efforts, which is beneficial to the high-quality development of PPP projects. Thus, how to determine the proportion of benefit distribution is crucial. ω is used to represent the proportion of the government’s benefit distribution, so that the benefits of both the government and social capital under centralized decision-making can reach the desired Pareto optimality. This needs to meet the condition expressed as:
It can be concluded that
Theorem 9: When
It can be seen from Theorem 9 that the optimal benefit distribution design under centralized decision-making is a redistribution process based on benefit. By redistributing the benefit increased by the participants’ efforts, the benefits of both the government and social capital under centralized decision-making are higher than those of both parties under decentralized decision-making, and the divided benefit is positively related to their respective discount factors.
In order to more intuitively explore the effort level and performance of public entities and private parties in PPP projects under a fuzzy environment, and to verify the effectiveness of the proposed model, the proposed hybrid method is applied to deal with the following example case. And the influence of different risk preference behaviors of the government and social capital on the PPP project performance and related decision-making under the uncertain market environment is further analyzed, which is also compared with the project performance and the benefits of both public entities and private parties under centralized decision-making.
In this study, a rural waste management project employing the beautiful rural PPP model is used as an example case study. Moreover, the basic data for this project come from the project information portal of China Public Private Partnerships Center. Since the government has a high-power advantage in PPP projects, the waste disposal fee is set as 45, while the proportion of the government investment is 0.6, and the proportion of social capital investment is 0.4. Therefore, it is assumed that I = 1000, p = 45,
With a confidence level of α = 0.5, and step length of 0.05, and an assignment range that is as wide as possible, the accuracy of the simulation results is ensured in this study [73]. Although, PPP projects are generally public welfare infrastructure construction with positive externalities, aiming to improve the public happiness index and public welfare, they could also bring with it negative externalities. Hence, fuzzy variables are often estimated by management decision-makers and experts. In this project, six experts from universities, the government and PPP companies estimate that the market scale is relatively large (i.e., about 600), while the market demand is sensitive to price changes (which is about 20). Likewise, the market demand sensitivity coefficient to the government and social capital efforts is relatively large (i.e., about 10), and the effort cost coefficient of the government and social capital is relatively small (i.e., about 5). Besides, the relationship between expert fuzzy language and triangular fuzzy numbers is determined by fuzzy theory, while the approximate value is determined by experienced experts. Since relevant data concerning this research are difficult to obtain and scarce, this paper also makes reasonable assumptions by referring to relevant literature [74,75].
According to the description of the problem, we obtain the following specific assumptions of fuzzy variables below:
And the α-optimistic values and α-pessimistic values of
While, the expected values of each parameter are derived below:
7.1 The Influence of Different Risk Preferences on the Equilibrium Decision Results of Government and Social Capital
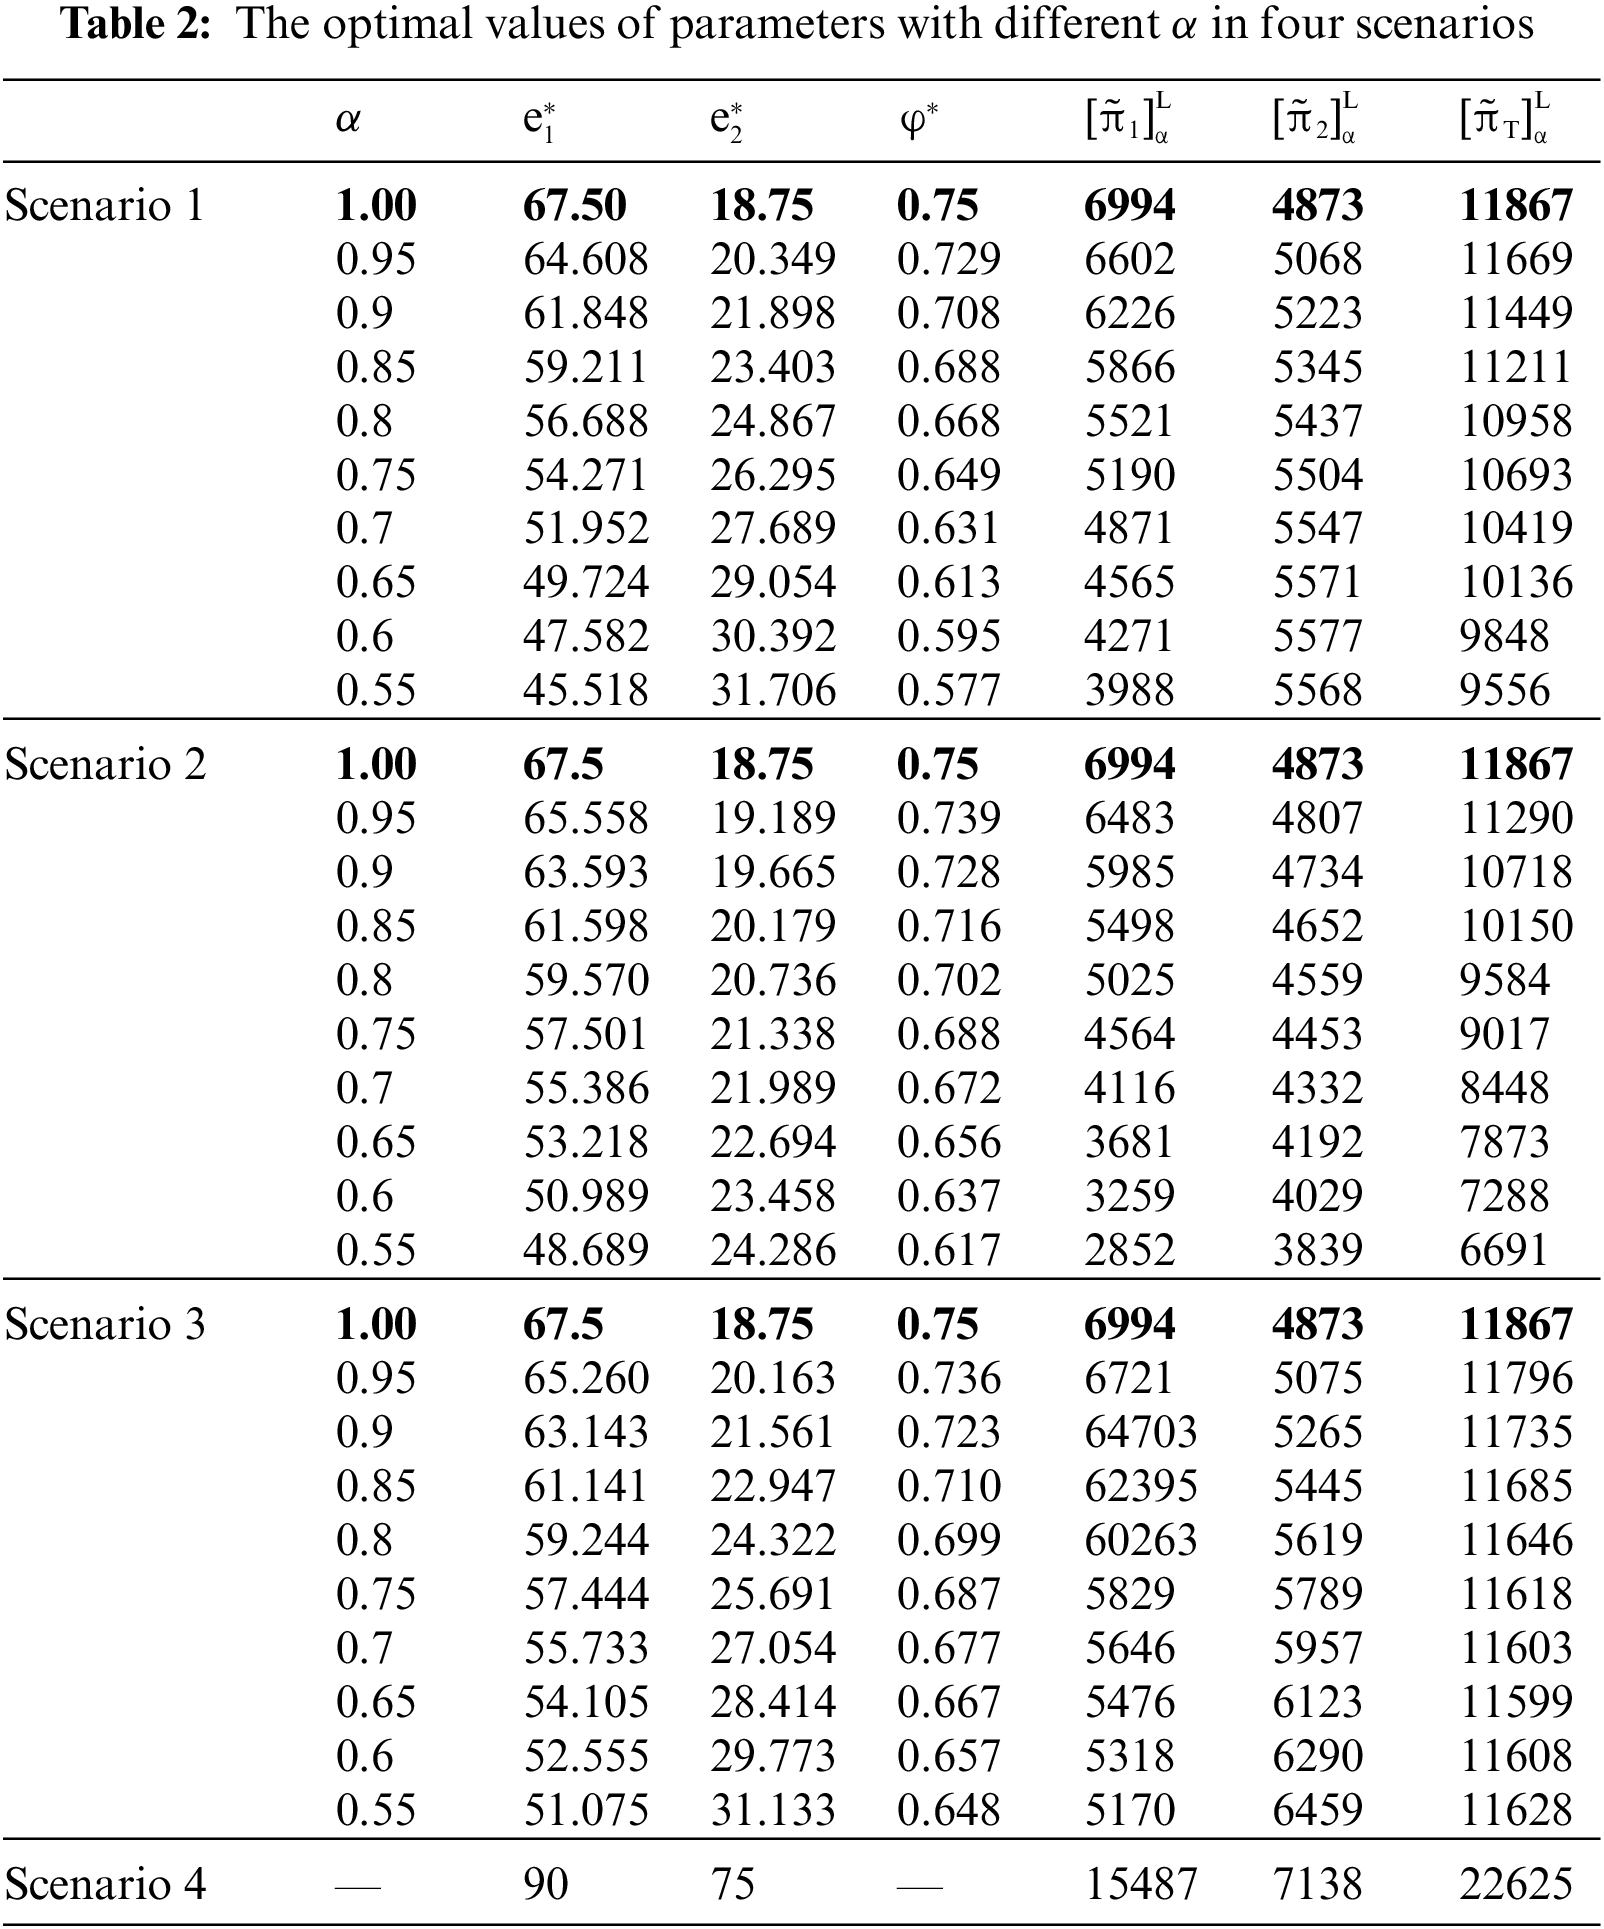
To intuitively reflect the optimal values of parameters with different α in four scenarios of PPP projects, we list the changes in the values as shown in Table 2.
Furthermore, in Figs. 1 to 4 below, the influence of confidence level on the efforts level, as well as both public and private parties’ benefit, and the overall benefit of the PPP project, together with the proportion of benefit distribution are graphically illustrated for easy comprehension. Consequently, in this research, the following conclusions can be arrived at:
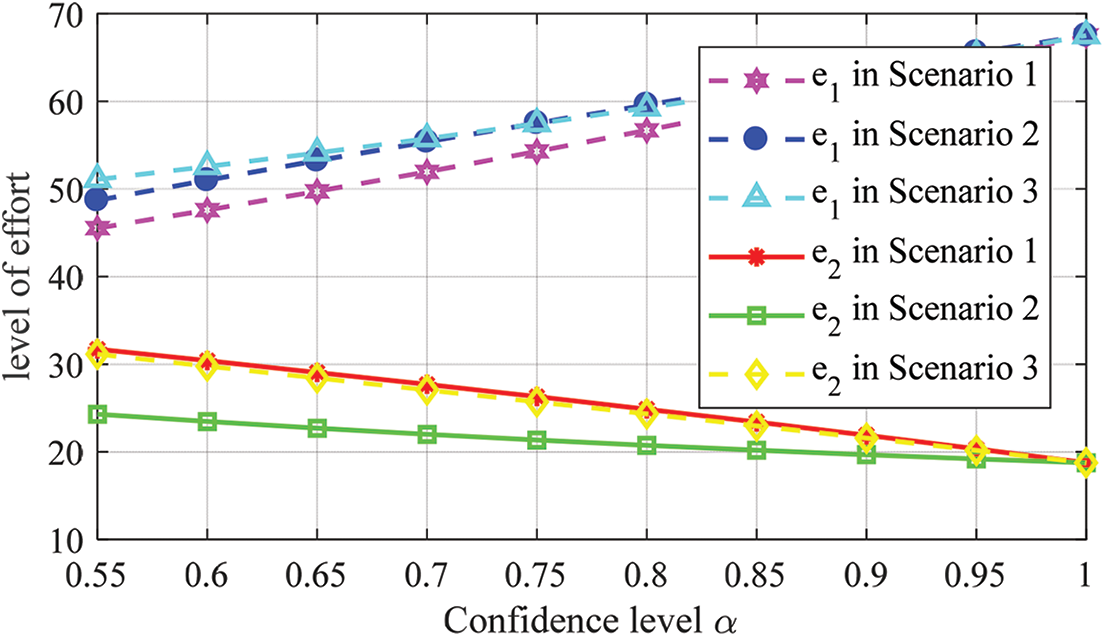
Figure 1: Confidence level’s influence on the efforts level
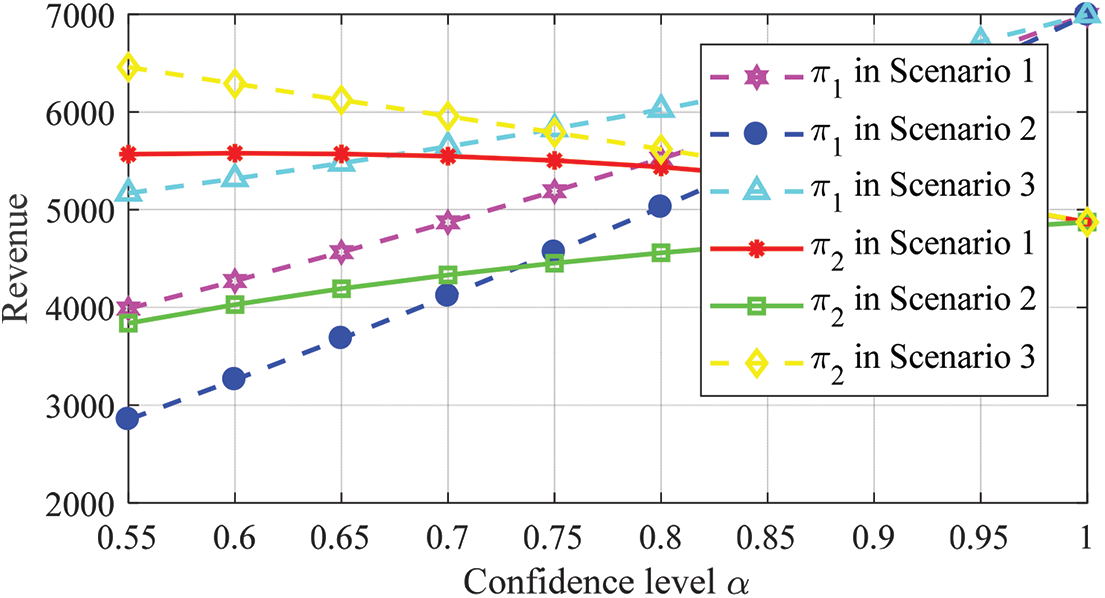
Figure 2: Confidence level’s influence on both public and private parties’ benefits
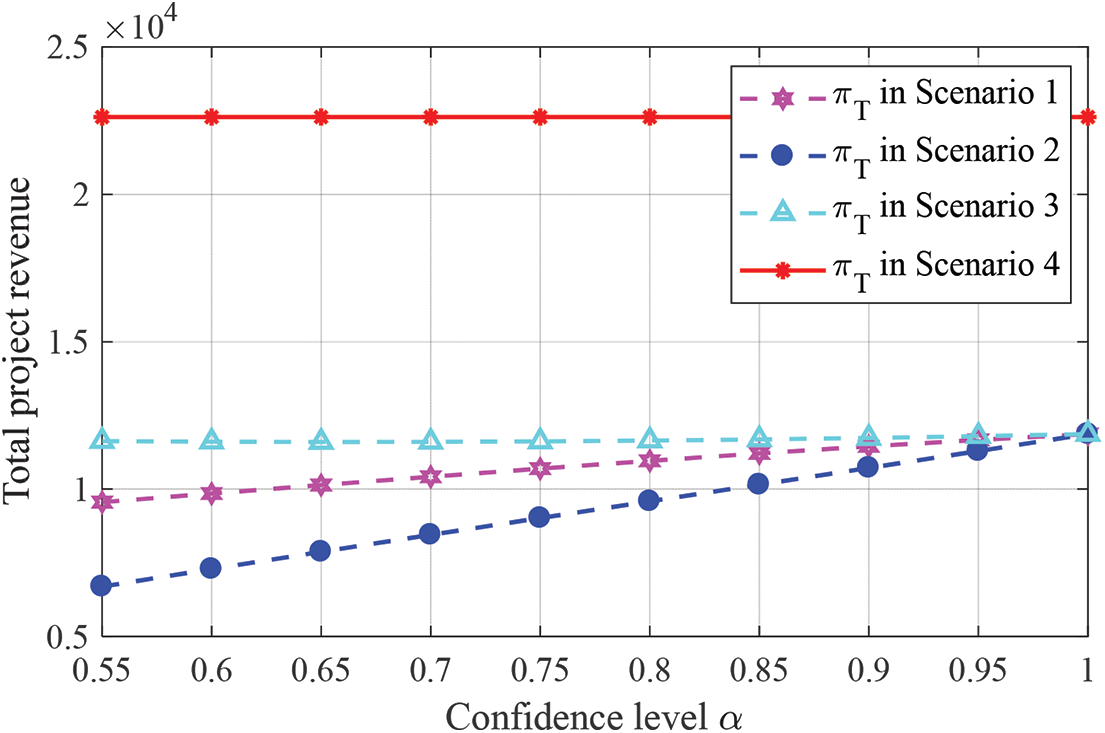
Figure 3: Confidence level’s influence on the overall benefit of the PPP project
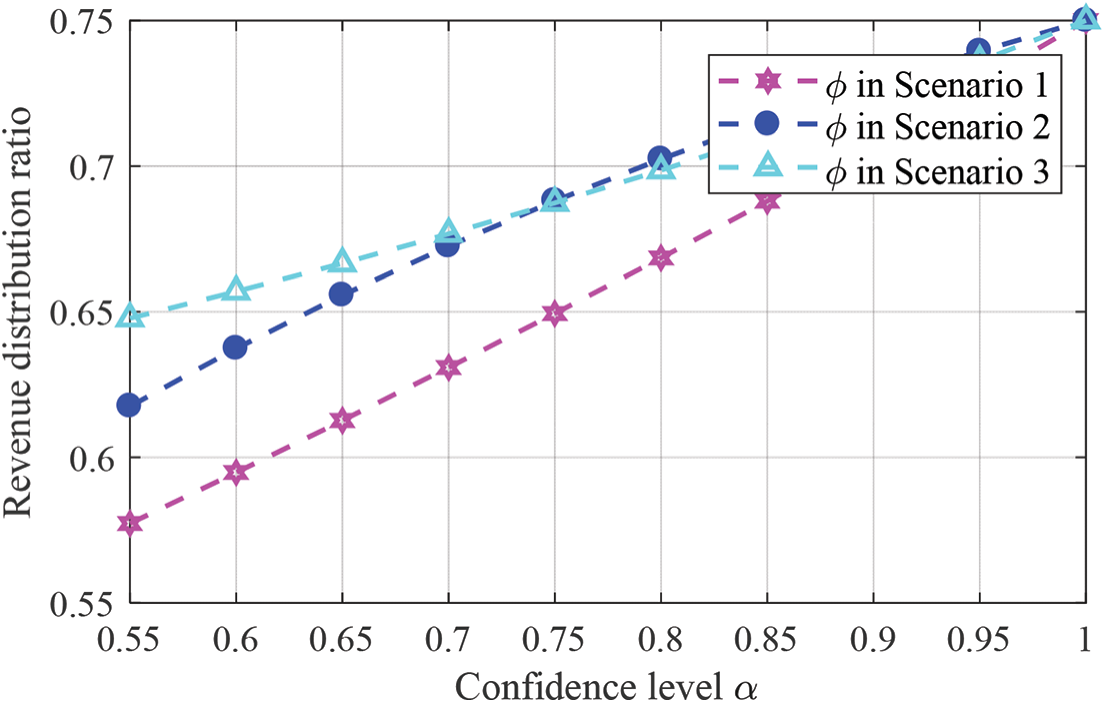
Figure 4: Confidence level’s influence on the proportion of benefit distribution
(1) As shown by the data in rows 2, 12, and 22 of Table 2, when α is 1, the optimal solutions of effort level and the proportion benefit distribution of both parties in Scenarios 1, 2, and 3 are the same, which is equivalent to the solutions of the public-private game model under a precise environment. At the same time, we were able to reliably verify the conclusion of Remark 2, which indicates that the conclusions arrived at under a fuzzy environment are an extension of the precise environment.
(2) As can be seen from Figs. 1 and 2, when there is continuous improvement in confidence level, the effort level of the government, as well as the net benefits in three scenarios are on the rise. However, the effort level of social capital shows a downward trend, with the net benefit in scenario 2 increasing, while the net benefits in Scenarios 1 and 3 decreases. That said, we find that when social capital analyzes the information that the proportion of benefit distribution decided by the government increases with the improvement of confidence level, it then begins to make use of its latecomer advantage to determine its level of effort. Therefore, the equilibrium results reflect both the government and social capital’s risk attitude towards the uncertainty of PPP projects, as well as the prediction of different possible levels.
(3) According to Table 2, Figs. 2 and 3, under decentralized decision-making, the order of benefits of the government and social capital as well as the overall project is as follows: Scenario 3 > Scenario1 > Scenario 2. It shows that when dealing with the uncertainty in a PPP project, the government with risk aversion and social capital with an optimistic risk preference can play the best individual and overall utility. In Scenario 3, for social capital with strong profit-seeking, with the confidence of decision-makers, the government’s ability to manage a PPP project is gradually improved, and the social recognition of the PPP project and the public welfare have been continuously enhanced. Social capital has gained considerable economic benefit in a PPP project. Because of the high preference for risks, social capital thinks that its high risks can be transformed into actual benefit, which will bring higher benefit, and it is in line with the law of high risks and high benefit in practice. In Scenario 2, when social capital with a pessimistic risk preference, even though the net benefit of social capital is lower than the other two scenarios, with the confidence of decision makers increasing, instead of blindly avoiding its own business risks through equipment investment and technological innovation, social capital gradually reduces its own effort to a reasonable level. At this time, even if social capital takes a conservative risk attitude, it can still get a gradually rising economic benefit. The changing trend of the image also means that the government and social capital have a first-mover advantage when adopting the attitude of pessimistic risk preference and optimistic risk preference respectively. However, when the government and social capital adopt the combination of pessimistic risk preference and neutral risk preference attitude respectively or adopt the pessimistic risk preference attitude at the same time, they may have a second-mover advantage.
(4) Fig. 4 shows the changing trend of the proportion of benefit distribution with confidence level α under three scenarios, which is consistent with the increasing changes of the government’s effort level and its benefit. As can be seen from Table 2, under centralized decision-making (Scenario 4), the effort level of the government and social capital, as well as the benefits gained by both parties, are higher than those under decentralized decision-making scenario. At the same time, Fig. 3 can also intuitively show the obvious advantages of the overall benefit of a PPP project under centralized decision-making over other three scenarios. It shows that the cooperation between public entities and private parties can promote the overall benefit of a PPP project, thus proving the conclusion of Theorem 9, and the rational benefit distribution under centralized decision-making can realize the Pareto optimality of project performance.
7.2.1 The Influence of Price on the Equilibrium Decision Results of Government and Social Capital
Under the PPP model, social capital is worried that the government pricing will focus on maintaining public welfare and neglect the economic benefit of social capital. Moreover, overpricing may result in insufficient users and small market demand, thus making it difficult to recover capital and obtain economic benefit. For the purpose of pursuing public welfare, the government should set the price of public products that will satisfy the public. It is also necessary to ensure that social capital is invested in the construction of a PPP project, so as to ease financial pressure and get considerable benefit. That is, the government should shoulder the responsibility of benefit coordination. Therefore, it will play an important role in promoting the efforts of both parties and sustainable development of the project. The influence of price on the effort level, and the proportion of benefit distribution are shown in Figs. 5 and 6. Besides, Figs. 7 and 8 represent the influence of price on the overall benefit of the project, and both public and private parties’ benefits. After carrying out an analysis of the example PPP project, the following conclusions can be drawn about the influence of price on the equilibrium decision results of government and social capital:
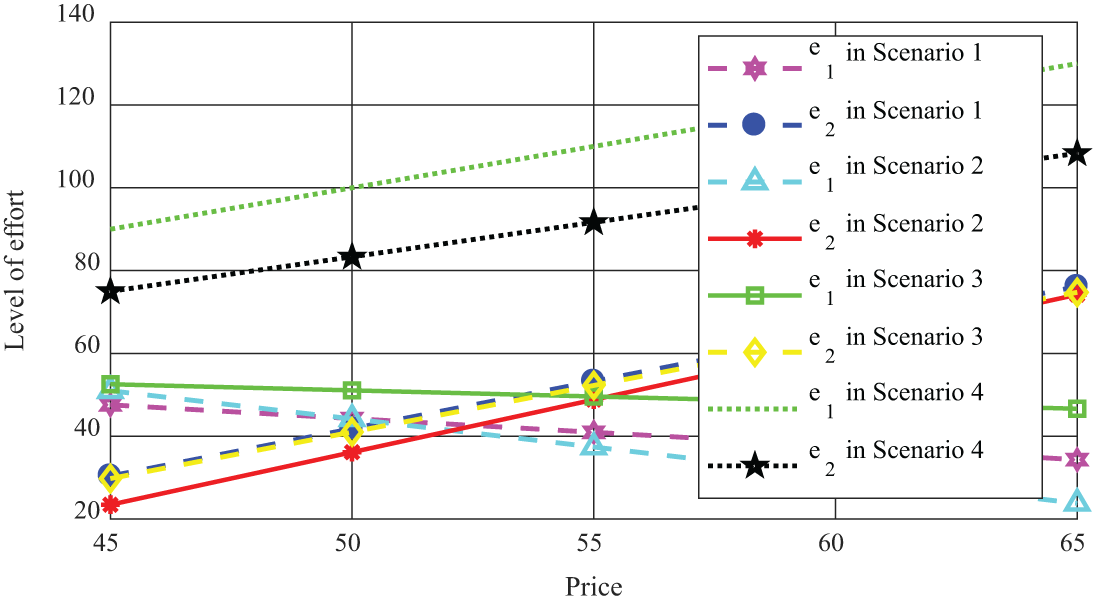
Figure 5: The influence of price on the effort level
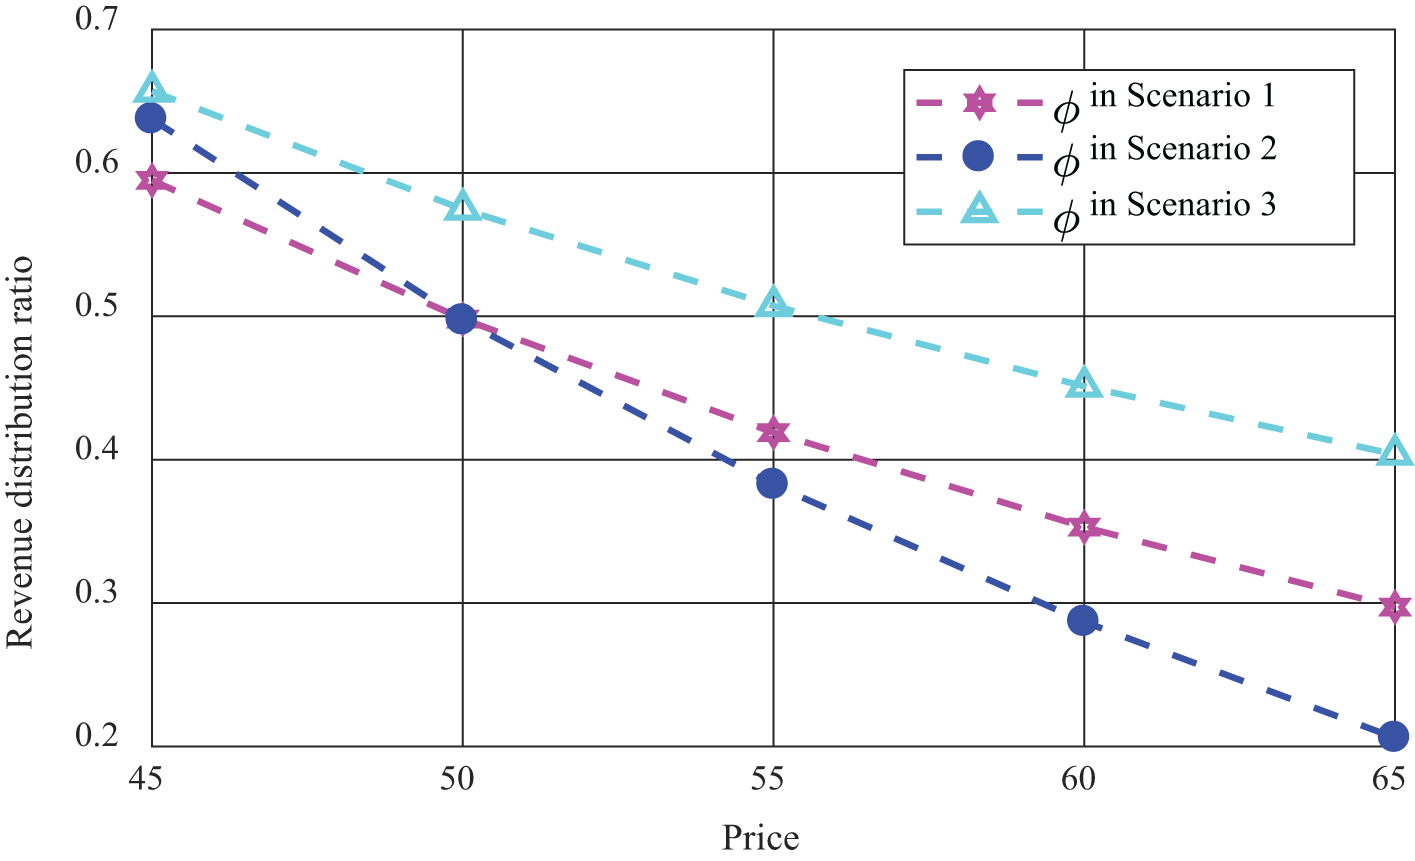
Figure 6: The influence of price on the proportion of benefit distribution
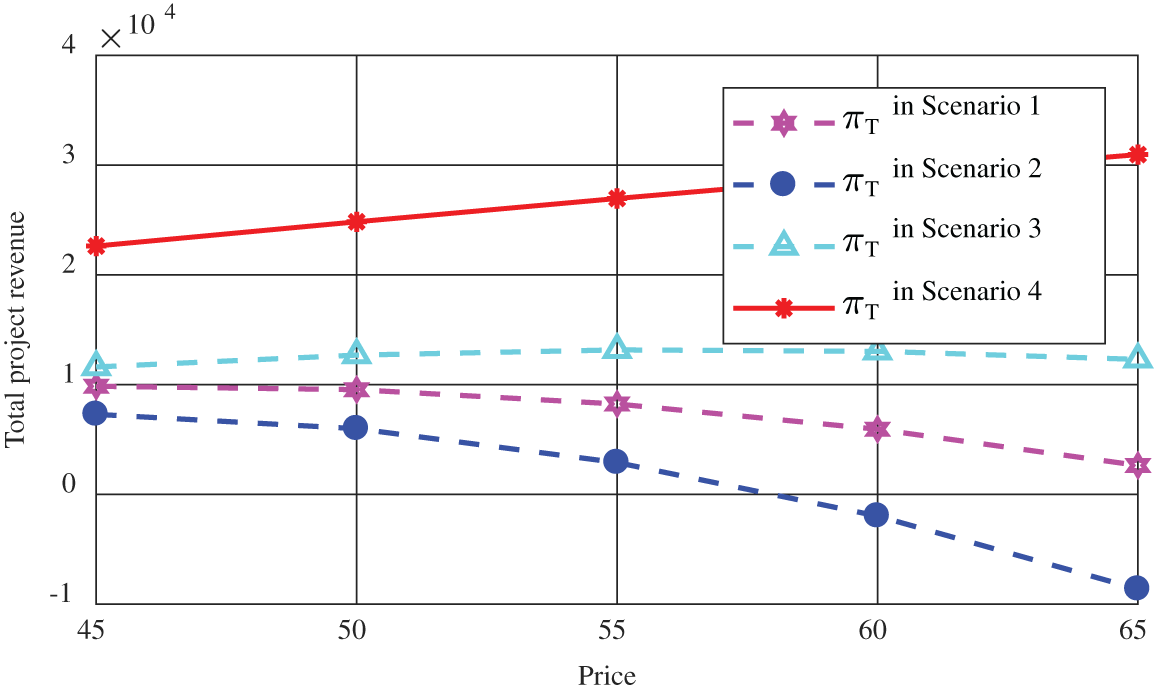
Figure 7: The influence of price on the overall benefit of the project
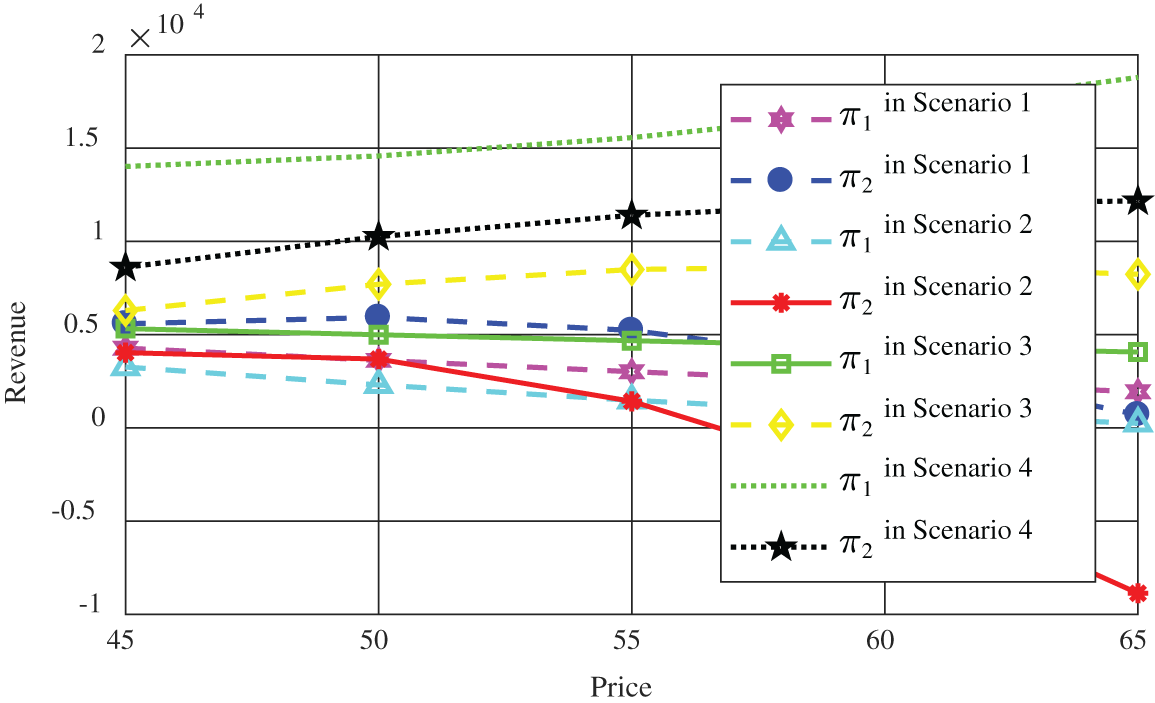
Figure 8: The influence of price on both public and private parties’ benefits
(1) As indicated in Fig. 5, the effort level of both public entities and private parties under centralized decision-making is generally higher than that under decentralized decision-making. Moreover, when the price rises, the effort level of both public entities and private parties under centralized decision-making gradually rises. Yet, under decentralized decision-making, the effort level of government gradually decreases, while the effort level of social capital gradually increases. This is mainly due to the resultant change in the proportion of benefit distribution in Fig. 6. At the same time, the effort level of social capital under decentralized decision-making is generally higher than that of the government. Besides, when there is an increase in the price of public products, social capital can have more benefit margins to recover the investment cost. Thus, social capital would be actively invested in advanced equipment to make higher efforts. While, under centralized decision-making, both public entities and private parties can invest in a project with a high level of effort. In the process of cooperation between the two parties, with the increasing enthusiasm for social capital investment and construction, the government has strengthened supervision to prevent the excess benefit of social capital from “damaging” the public welfare.
(2) It can be seen from Figs. 5, 7, and 8 that the centralized decision-making, as long as both the government and social capital can maintain a high effort level and exert their best effects, the overall benefit of the PPP project would reach desired satisfactory levels for both parties. While, under the centralized decision-making, the PPP project forms a stable cooperative relationship whereby high-level cooperation between both parties not only ensures the maximization of public welfare, but also makes social capital profitable. Hence, under this condition both public entities and private parties have formed a stable relationship that yields mutual benefits and trust in each other. However, under decentralized decision-making, the overall benefit of the project is on the decline. Moreover, in Scenario 2, both parties avoid risks, and the overall benefit of the project is at its worst position. This shows that the behavior of both public entities and private parties when they only pursue their benefits and avoid risks is not conducive to both of them, since they would not be able to arrive at an optimum utility level for any given project.
(3) As can be seen from Fig. 8, with the price rising, social capital with an optimistic risk preference in Scenario 3 will get rich benefit. In Scenario 2, the benefit of social capital with a pessimistic risk preference decreases obviously and drops to the lowest point. Therefore, social capital with an optimistic risk preference dominates the change of benefits. In addition, it shows that the price increase is not conducive to the public entities and private parties with risk preferences to pursue their own benefit targets. When the proportion of benefit distribution of social capital increases, it will be willing to make more efforts, but will not get higher project benefit. It shows that social capital has a mutually beneficial public preference while pursuing maximum benefit, and its behavior is not only a decision to maximize its own utility, but also concerns for the stability and sustainability of cooperative relationships.
7.2.2 The Influence of Fuzzy Uncertainties on Equilibrium Decision Results of Government and Social Capital
In the case of centralized decision-making, both parties will cooperate from the perspective of overall rationality, so that the overall benefit can be optimized. The cooperative behavior under centralized decision-making can achieve Pareto optimality, and encourage both parties to achieve the goal of rational cooperation, which is the direction of public-private cooperation. Correspondingly, the limitation of individual rationality under decentralized decision-making is an aspect that needs to be improved in reality. Through the comparative analysis of the three scenarios under decentralized decision-making, it is found that in Scenario 3, the government and social capital have the optimal overall benefit with the PPP project, and the attitude of social capital towards risk is consistent with the actual situation in infrastructure construction. Therefore, in this section, the influence of fuzzy uncertain variables in Scenario 3 on the balanced decision-making results of the government and social capital and the overall benefit of the PPP project is discussed as follows.
Table 3 reflects the changes in the optimal values of each parameter under different effort cost coefficients of the government (
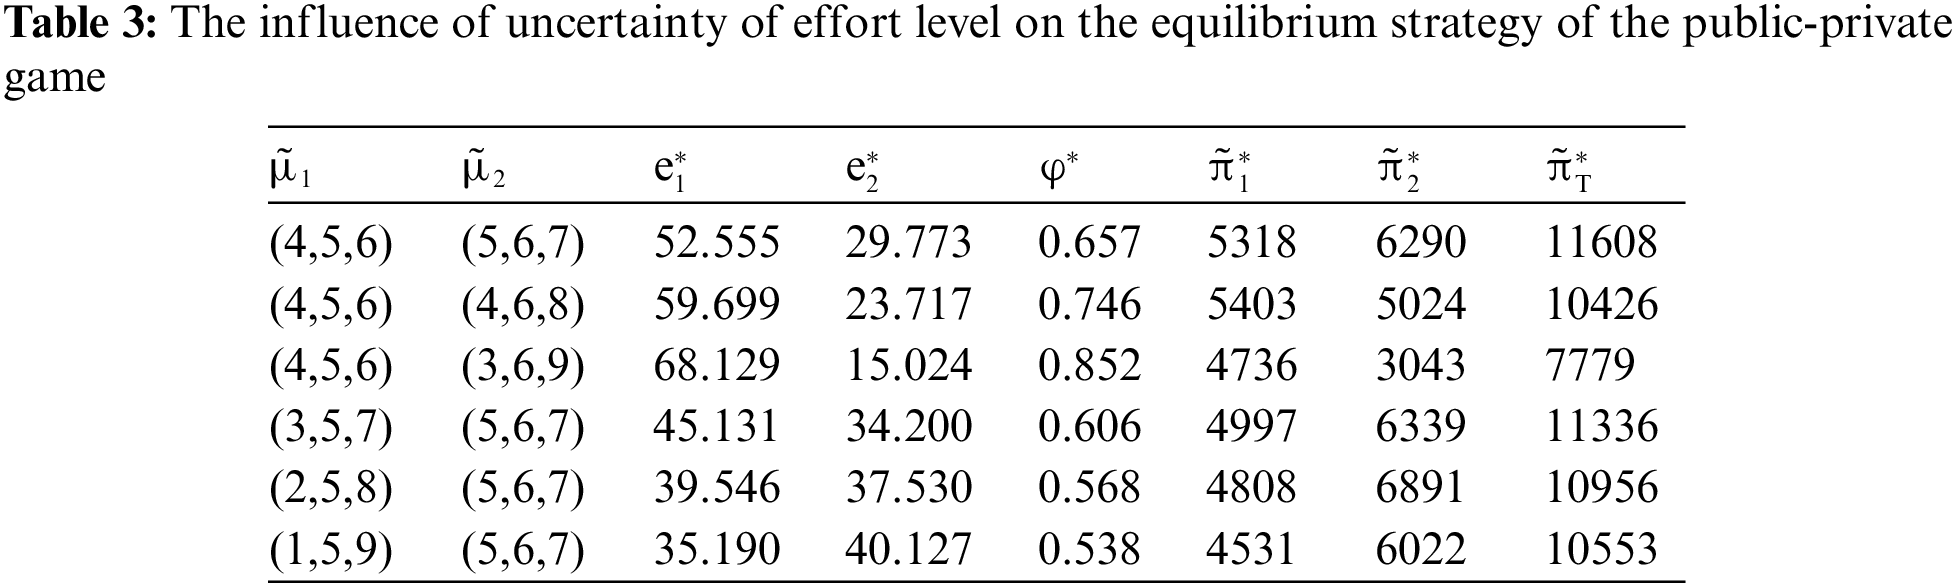
Table 4 reflects the changes in the optimal values of each parameter under different market demand sensitivity coefficients to price (
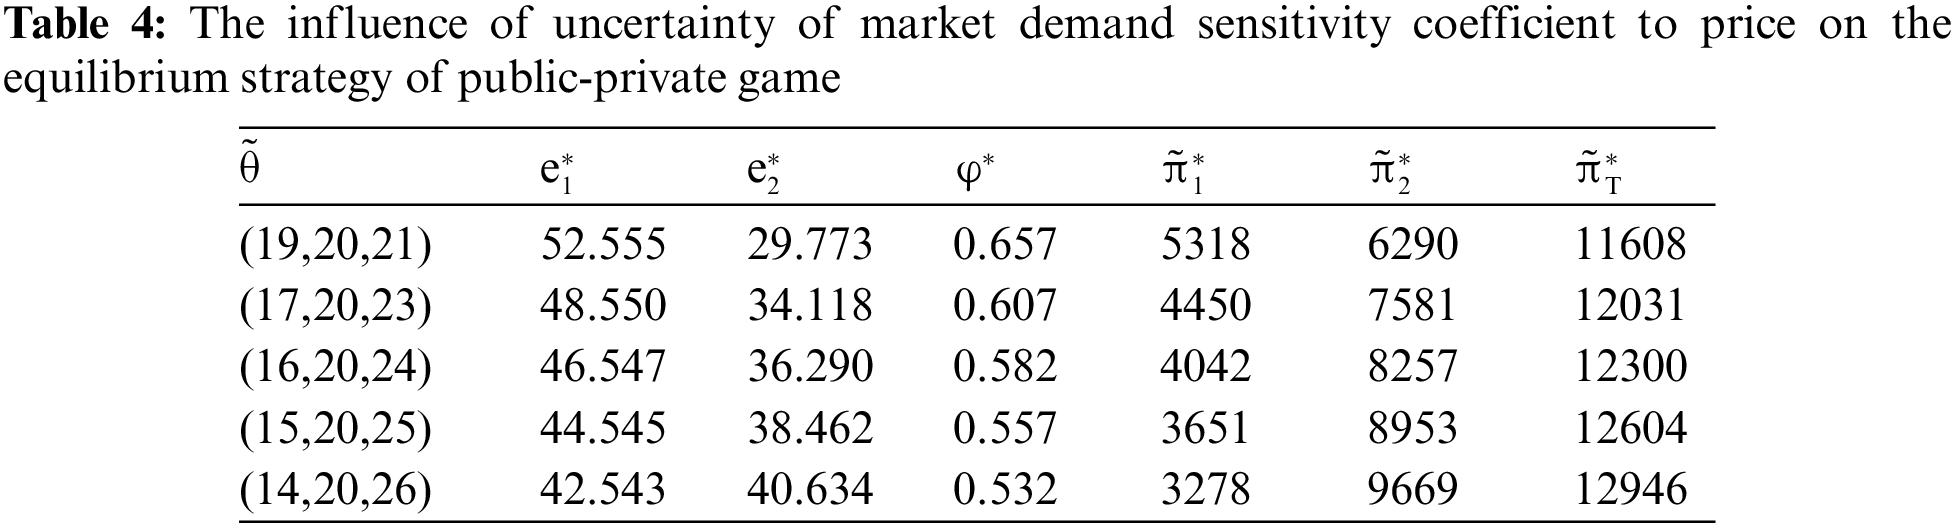
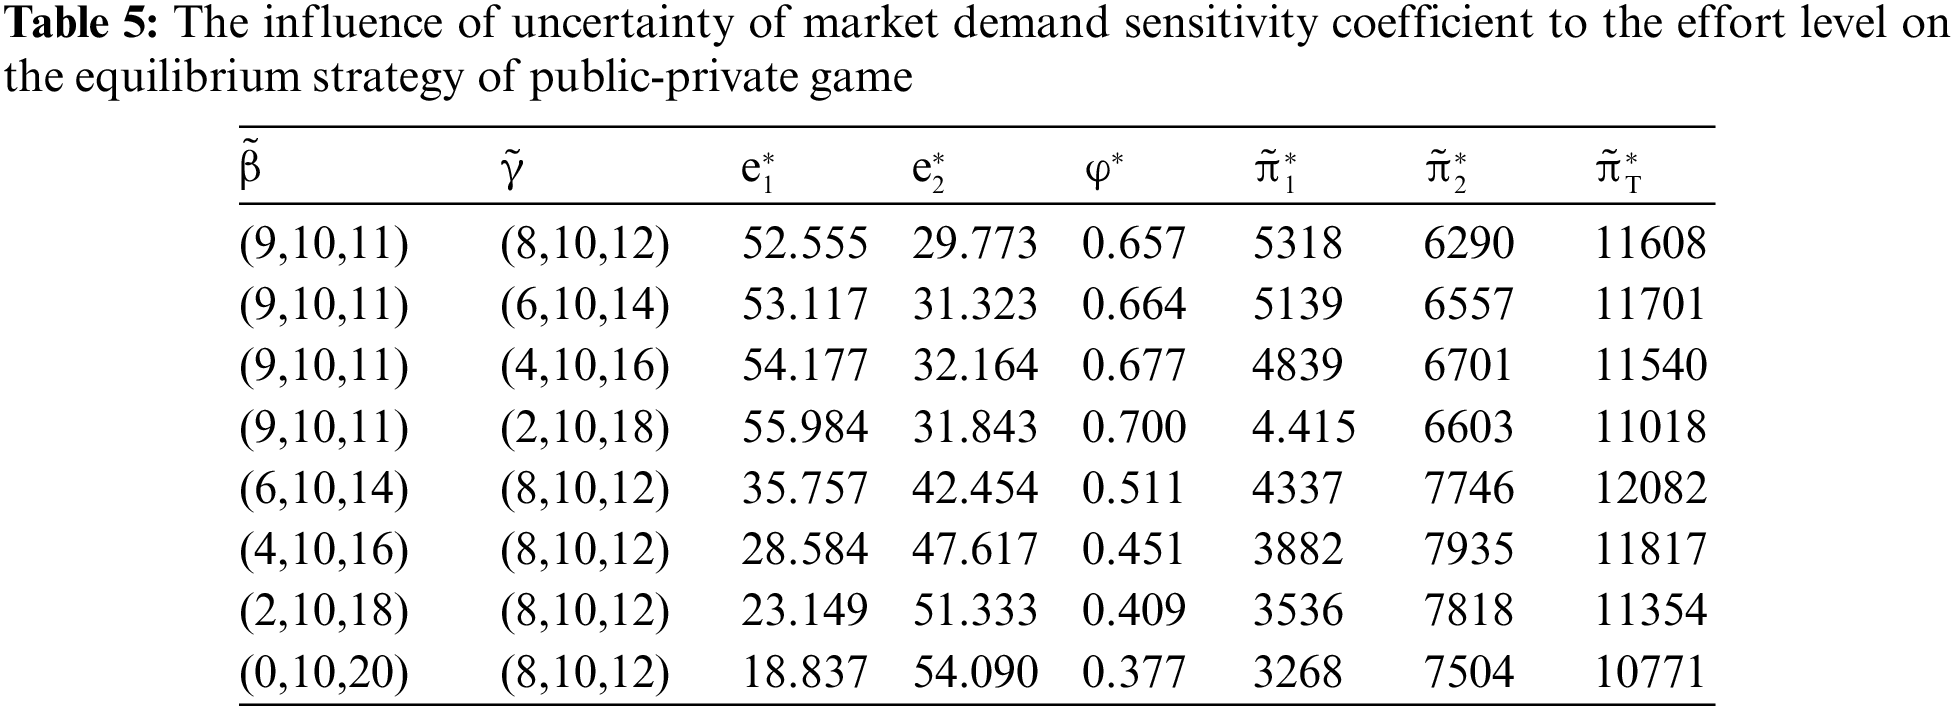
Table 5 shows the changes in the optimal values of each parameter under different market demand sensitivity coefficient to the effort level of the government (
7.3 Further Discussion and Comparison
Compared with the existing Stackelberg game models used for PPP models and other studies that consider the uncertain factors of a PPP project, this paper has the following advantages.
(1) In studies that relate to the Stackelberg game model ascertaining the impact of PPP projects does not adequately evaluate the uncertainties that are being confronted by PPP projects [20,24,28]. Besides, since uncertainties are expressed by the probability distribution of known parameters in [23,27,29,76], it makes the uncertain variables be affected by subjective factors of researchers. Therefore, in this paper, the uncertain variables that influence PPP projects are expressed as fuzzy variables. In addition, by combining both game theory and fuzzy set theory, the performance of public entities and private parties with different risk preferences in PPP projects was adequately analyzed. The use of this research technique in this study made the analysis to be closer to the uncertain environment of real-life PPP project monitoring and evaluation. Thus, the investment decision-making behavior of both public entities and private parties is deeply explored in this research.
(2) Based on the various benefits of the government and private investors’ cooperation in PPP projects, Tang et al. [77] calculated the optimal effort level using random variables to express the influence of external uncertainties on these projects. Similarly, Wang et al. [27] only considered the effort of private parties involved in PPP projects, while Shang et al. [29] only considered the hard work of contractors (i.e., the followers) involved in PPP projects. In studies [27,29], the relationship between project followers and project performance was emphasized, but the influence of leaders involved in project performance was inadvertently neglected. Moreover, given that some studies [27,29] only focused on the impact of the subsidy mechanism on the performance of PPPs, while ignoring the objective effort and endogenous motivation of social capital, this study contributes to new knowledge by enhancing our understanding of this phenomenon by integrating novel and relevant variables. Based on the efforts of both public entities and private parties, this paper was able to adequately probe into the reasonable coordination mechanism of benefit distribution, in addition to studying and measuring the influence of benefit distribution schemes on their project efforts.
(3) In the existing Stackelberg game models, the studies [20,23,24,27,29,76,77] were based on PPP projects’ cooperation mechanism optimization. However, there were no comparative analysis between decentralized decision-making and centralized decision-making. In this paper, considering the different risk preferences of the government and social capital, four game models under centralized decision-making and decentralized decision-making are established, and the optimal effort level of both parties are obtained and compared. Besides, by using the Rubinstein game model, the optimal proportion of benefit distribution of both parties under centralized decision-making is obtained, and the Pareto optimality of benefit distribution between both parties is achieved.
(4) Other methods [57–62] studied the possible uncertainties in PPP projects and used the traditional Monte Carlo simulation for analysis and decision-making. In traditional Monte Carlo simulation (MCS), all the input risks and uncertainties are modeled based on probability theory, which is represented by the probability distribution function (PDF) and cumulative distribution function (CDF) [63]. In reality, some variables are estimated according to experts’ judgments, while others are derived from historical data. In addition, the parameter data of probability distribution used for the input of the simulation model is easy to change and difficult to predict.
(5) These studies [20,23,24,27–29,58–63,69,77] were based on the risk-neutral hypothesis, and ignored the utility difference caused by the cognition of the subject. The established models have limited practical guidance for decision-makers who take actions based on subjective cognition, and can’t connect with the study results in the fields of economics and enterprise management. This paper considers the risk preference of both public entities and private parties, studies the factors that influence the effort level of both parties, designs a fair and reasonable benefit distribution scheme, maximizes the expected utility of social capital investment based on ensuring the optimal public welfare, and thus breaks the barriers to entry of social capital.
At present, PPP model is favored by more economic construction markets. However, some PPP projects lack historical data for reference, and decision-makers have a fuzzy understanding of the market environment of such a project. Moreover, social capital faces high market risks, which makes the uncertainty of management problems in a PPP project more prominent. The traditional Stochastic model cannot solve the uncertainty problems that may arise in a PPP project at the present stage. In order to overcome the above shortcomings, the uncertain variables are expressed as fuzzy variables by fuzzy theory. Compared with probability theory, it can more effectively solve the fuzzy phenomena in management decision-making and game problems, and better depict these uncertainties. At the same time, considering the different risk preferences of the government and social capital and the degree of information disclosure of the government, it provides more flexibility for decision-makers in order to obtain considerable benefits in the uncertain PPP market with higher risks.
In this paper, a hybrid method with different risk preferences between public entities and private parties in the fuzzy demand environment is proposed. It is considered that the market scale, the sensitivity coefficient of market demand to price, the sensitivity coefficient of market demand to the effort level of both public entities and private parties, and the effort cost coefficient of both public entities and private parties are all fuzzy variables. In this paper, the optimal effort level and optimal benefit distribution scheme of a pessimistic government and social capital with different risk preferences are given under the expected value and opportunity-constrained programming model, so as to achieve the optimal performance of individual and whole. From the above-mentioned analysis and discussions, the following conclusions can be drawn from this study:
(1) When α = 1, each optimal solution of the fuzzy model is equal to the optimal solution of the PPP project model in a precise environment. This indicates that the optimal conclusions of a PPP project under a fuzzy demand environment are the generalization of the precise environment. Moreover, with an increase in the confidence level, the level of the government effort and net benefits are increased under a decentralized decision-making condition. Besides, the level of effort of social capital shows a downward trend, with net benefit increasing in Scenario 2 and net benefit decreasing in Scenarios 1 and 3. This implies that under different risk preferences, combining the government with social capital has an impact on the level of effort made by both public entities and private parties, affecting their respective benefits and the overall benefit of PPP projects.
(2) Under decentralized decision-making, the optimal equilibrium strategies made by both public entities and private parties are negatively related to the price or cost of PPP projects, just as the optimal effort level is mainly influenced by the proportion of benefit distribution. Furthermore, the proportion of benefit distribution is positively related to the market demand sensitivity coefficient to price, and the market demand sensitivity coefficient to the effort level of itself (i.e., contribution coefficient of itself). On top of that, in Scenario 2, both parties avoid risks, and the overall benefit of the project is at its worst position, which shows that the behavior of public entities and private parties only pursuing the maximization of their benefit and avoiding risks is not conducive to the overall utility of a PPP project. In addition, we find that the effort level of both parties only produces a positive stimulation to benefit within a reasonable range of evaluation. Taken together the risk preference and the fair preference of the benefit distribution proportion of PPP projects have an important influence on the behavior and decisions of both public entities and private parties. Similarly, we observed that the combination of various preferences can assist PPP projects in China to achieve the best individual and overall utility in Scenario 3.
(3) Under decentralized decision-making, the increase of the effort cost coefficient of the government and social capital does not inhibit the level of effort of both parties, which is a counter-intuitive finding. And the proportion of benefit distribution is positively related to the sensitivity coefficient of market demand to price and the sensitivity coefficient of market demand to the effort level (contribution coefficient of itself). The social capital has a fair perception of benefit distribution, thus the increase of the benefit distribution ratio of social capital helps to prevent the emergence of opportunistic behaviors of social capital, and only a reasonable proportion of benefit distribution can motivate social capital. When the contribution coefficient changes, the benefit of social capital is mainly affected by the government’s benefit, and the changing trend of the overall benefit of the project is consistent with the change in the benefit of the party whose contribution coefficient changes.
(4) Under centralized decision-making, the optimal effort level of both public entities and private parties and the overall benefit of the project are positively related to the price, and both parties’ performance and overall project net income are superior to decentralized decision-making, which can further realize Pareto optimality, reflecting the advantages of cooperation in PPP projects, and encouraging both parties to improve their effort. Besides, social capital is not only self-interested and rational, but also has a mutually beneficial social preference. The benefit distribution of a PPP project should consider the objective effort of social capital.
After synthesizing the above conclusions, we draw the following effective policy suggestions:
(1) The opportunistic tendency of social capital should be accurately analyzed and prevented based on the performance of PPP projects in China. When there is an existence of social capital with a low effort level, contrary to the general intuition, the government should increase the benefit distribution ratio of social capital to encourage both parties to attain the best effort level. That said, when evaluating social capital, the government should examine the potential opportunism tendency and rationally design the contract to reduce the opportunistic behavior of social capital.
(2) During the implementation of a PPP project, incentives and safeguards should be taken to ensure proper implementation of these long-term infrastructure development arrangements. Moreover, by sharing information and technology, as well as providing a smooth platform for communication, and strengthening legal sanctions, the cost of opportunism is increased. In summary, a fair contractual agreement should be signed, so that the relationship between public entities and private parties can be mutually beneficial. Lastly, the effort of all parties should be monitored and controlled to avoid the negative impact of unilateral decisions on effort levels and the project performance of PPP projects in China and across the globe, which informs calls for further studies in this area in the future.
(3) Considering the uncertainties of PPP projects, flexible and innovative management should be implemented. According to the mutually beneficial behavior of both parties, input cost and collaborative output, the government should consider the uncertainties, implement effective supervision measures, comprehensively balance the benefit distribution, ensure the best effort level while maintaining their respective input cost, and finally realize the maximum project performance. At the same time, when formulating subsidy and tax policies, the government should fully understand the situation of a PPP project, adjust project operation evaluation in time and give social capital appropriate management rights.
(4) Public services should be priced by a professional institution. Public service pricing cannot be unfair. It is suggested that the public service pricing should be conducted by a third-party professional institution as the basis for decision-making, taking into account the interests of social capital and public demands, so as to reduce social capital’s worries about public service pricing and promote their confidence in entering the project, thus ensure the credibility and professionalism of the public service pricing.
There are some limitations to this study. From the research methods and content, the following will be discussed. This paper proposes a hybrid method based on fuzzy expected value and game theory, which can be helpful for the benefit distribution in public-private partnerships. But the methods assume that the fuzzy demand function is linearly related to the price of public products, the effort level of the government, and social capital. In reality, the demand function is more complicated and not necessarily linear, and other variables such as indirect benefit and other potential values may also be involved in the model. In addition, this paper mainly studies the benefit distribution between the government and social capital in a PPP project, so as to maximize public welfare and economic benefit respectively. In this paper, the game model only considers two decision-makers and two decision-making stages. However, in the actual project operation process, many stakeholders, such as the public, project companies, financial institutions, and other multi-subjects, participate in cooperation, and the decision-making stage is more complicated. Because of this, the consideration of various behavioral factors influencing the investment decisions made by the government and social capital may be inadequate. Another limitation is that the study is in the case of China, which may affect the application of research conclusions. The government is the protagonist in China, and social capital is the follower, especially the social capital including state-owned enterprises, which is different from some other countries.
In spite of these limitations, we believe we have developed an interesting subject in the literature of benefit distribution in public-private partnerships, which has never been fully explored. Future research can improve and develop the results of this study from the perspectives of research methods and research content. Studies in the future will be significant if other forms of fuzzy demand function (i.e., non-linearity) can be considered, which can include indirect benefits and losses such as potential value or loss, and can pay more attention to the internal and external factors affecting the performance of both public entities and private parties and introduce more behavioral assumptions and variables of decision makers. Additionally, multi-stakeholder and multi-level decision-making scenarios can be set up to make existing research results more practical.
Acknowledgement: Thanks to the editors of this journal and the anonymous reviewer.
Funding Statement: This paper is supported by the National Natural Science Foundation of China (No. 62141302), the Humanities Social Science Programming Project of the Ministry of Education of China (No. 20YJA630059), the Natural Science Foundation of Jiangxi Province of China (No. 20212BAB201011), the China Postdoctoral Science Foundation (No. 2019M662265) and the Research Project of Economic and Social Development in Liaoning Province of China (No. 2022lslybkt-053).
Conflicts of Interest: The authors declare that they have no conflicts of interest to report regarding the present study.
References
1. Brogaard, L. (2017). The impact of innovation training on successful outcomes in public–private partnerships. Public Management Review, 19(8), 1184–1205. https://doi.org/10.1080/14719037.2016.1272710 [Google Scholar] [CrossRef]
2. Steijn, B., Klijn, E. H., Edelenbos, J. (2011). Public private partnerships: Added value by organizational form or management? Public Administration, 89(4), 1235–1252. https://doi.org/10.1111/j.1467-9299.2010.01877.x [Google Scholar] [CrossRef]
3. Deng, B. C., Zhou, D. J., Zhao, J. C., Yin, Y. L., Li, X. Y. (2021). Fuzzy synthetic evaluation of the critical success factors for the sustainability of public private partnership projects in China. Sustainability, 13(5), 2551. https://doi.org/10.3390/su13052551 [Google Scholar] [CrossRef]
4. Wang, H. M., Xiong, W., Wu, G. D., Zhu, D. J. (2018). Public–private partnership in Public Administration discipline: A literature review. Public Management Review, 20(2), 293–316. https://doi.org/10.1080/14719037.2017.1313445 [Google Scholar] [CrossRef]
5. Liu, B. S., Li, J. K., Wang, D., Liu, H., Wu, G. D. et al. (2022). Public-private partnerships: A collaborative framework for ensuring project sustainable operations. Engineering Construction and Architectural Management, 26(1), 173. https://doi.org/10.1108/ECAM-12-2021-1124 [Google Scholar] [CrossRef]
6. Soomro, M. A., Zhang, X. (2015). Roles of private-sector partners in transportation public-private partnership failures. Journal of Management in Engineering, 31(4), 04014056. https://doi.org/10.1061/(ASCE)ME.1943-5479.0000263 [Google Scholar] [CrossRef]
7. Sun, G. S., Tang, X. R., Wan, S. P., Feng, J. (2023). An extended fuzzy-DEMATEL system for factor analyses on social capital selection in the renovation of old residential communities. Computer Modeling in Engineering & Sciences, 134(2), 1041–1067. https://doi.org/10.32604/cmes.2022.021981 [Google Scholar] [CrossRef]
8. Feng, J., Wang, N. N., Sun, G. S. (2022). Measurement of innovation-driven development performance of large-scale environmental protection enterprises investing in public-private partnership projects based on the hybrid method. Sustainability, 14(9), 5096. https://doi.org/10.3390/su14095096 [Google Scholar] [CrossRef]
9. Kadiyali, V., Chintagunta, P., Vilcassim, N. (2000). Manufacturer-retailer channel interactions and implications for channel power: An empirical investigation of pricing in a local market. Marketing Science, 19(2), 127–148. https://doi.org/10.1287/mksc.19.2.127.11805 [Google Scholar] [CrossRef]
10. Wang, Y. L., Gao, R. L. (2020). Risk distribution and benefit analysis of PPP projects based on public participation. International Journal of Strategic Property Management, 24(4), 215–225. https://doi.org/10.3846/ijspm.2020.12329 [Google Scholar] [CrossRef]
11. Chen, C. J., Lv, L. L., Wang, Z. F., Qiao, R. (2022). Bargaining optimization model for risk renegotiation with fairness concerns in infrastructure PPP projects. Engineering Construction and Architectural Management, 26(8), 1696. https://doi.org/10.1108/ECAM-11-2021-1006 [Google Scholar] [CrossRef]
12. Xiong, W., Yuan, J. F., Li, Q. M., Skibniewski, M. J. (2015). Performance objective-based dynamic adjustment model to balance the stakeholders’ satisfaction in PPP projects. Journal of Civil Engineering and Management, 21(5), 539–547. https://doi.org/10.3846/13923730.2014.895409 [Google Scholar] [CrossRef]
13. Wojewnik-Filipkowska, A., Wegrzyn, J. (2019). Understanding of public-private partnership stakeholders as a condition of sustainable development. Sustainability, 11(4), 1194. https://doi.org/10.3390/su11041194 [Google Scholar] [CrossRef]
14. Wang, J., Shu, Y. F. (2005). Fuzzy decision modeling for supply chain management. Fuzzy Sets and Systems, 150(1), 107–127. https://doi.org/10.1016/j.fss.2004.07.005 [Google Scholar] [CrossRef]
15. Lomoro, A., Mossa, G., Pellegrino, R., Ranieri, L. (2020). Optimizing risk allocation in public-private partnership projects by project finance contracts. The case of put-or-pay contract for stranded posidonia disposal in the municipality of Bari. Sustainability, 12(3), 806–824. https://doi.org/10.3390/su12030806 [Google Scholar] [CrossRef]
16. Love, P. E., Sing, C. P., Wang, X., Irani, Z., Thwala, D. W. (2014). Overruns in transportation infrastructure projects. Structure and Infrastructure Engineering, 10(2), 141–159. https://doi.org/10.1080/15732479.2012.715173 [Google Scholar] [CrossRef]
17. Dyer, J. H. (1996). Specialized supplier networks as a source of competitive advantage: Evidence from the auto industry. Strategic Management Journal, 17(4), 271–291. https://doi.org/10.1002/(ISSN)1097-0266 [Google Scholar] [CrossRef]
18. Lui, S. S., Wong, Y. Y., Liu, W. (2009). Asset specificity roles in interfirm cooperation: Reducing opportunistic behavior or increasing cooperative behavior? Journal of Business Research, 62(11), 1214–1219. https://doi.org/10.1016/j.jbusres.2008.08.003 [Google Scholar] [CrossRef]
19. Wang, Z. S., Zhou, Y. X., Jin, X. H., Zhao, N., Sun, J. S. (2022). Risk allocation and benefit distribution of PPP projects for construction waste recycling: A case study of China. Engineering Construction and Architectural Management, 26(8), 1696. https://doi.org/10.1108/ECAM-10-2021-0855 [Google Scholar] [CrossRef]
20. Fainstein, S. S. (2021). State domination in Singapore’s public-private partnerships. Journal of Urban Affairs, 43(2), 270–287. https://doi.org/10.1080/07352166.2017.1406787 [Google Scholar] [CrossRef]
21. Cropanzano, R., Mitchell, M. S. (2005). Social exchange theory: An interdisciplinary review. Journal of Management, 31(6), 874–900. https://doi.org/10.1177/0149206305279602 [Google Scholar] [CrossRef]
22. Wang, Y. L., Liu, J. C., Gao, R. L., Hwang, B. G. (2020). Government subsidies in public-private partnership projects based on altruistic theory. International Journal of Strategic Property Management, 24(3), 153–164. https://doi.org/10.3846/ijspm.2020.11545 [Google Scholar] [CrossRef]
23. Ding, X., Li, Q. (2022). Optimal risk allocation in alliance infrastructure projects: A social preference perspective. Frontiers of Engineering Management, 9(2), 326–336. https://doi.org/10.1007/s42524-020-0145-x [Google Scholar] [CrossRef]
24. Cao, G. X., Zhou, L. (2021). The optimal PPP model of emergency rescue service. Discrete Dynamics in Nature and Society, 2021(1), 1–12. https://doi.org/10.1155/2021/8413786 [Google Scholar] [CrossRef]
25. Feng, K., Wang, S. Q., Wu, C. L., Xia, G. T., Hu, W. (2019). Optimization of concession period for public private partnership toll roads. Inzinerine Ekonomika-Engineering Economics, 30(1), 24–31. https://doi.org/10.5755/j01.ee.30.1.19215 [Google Scholar] [CrossRef]
26. Gao, G. X., Fan, Z. P., Fang, X., Lim, Y. F. (2018). Optimal Stackelberg strategies for financing a supply chain through online peer-to-peer lending. European Journal of Operational Research, 267(2), 585–597. https://doi.org/10.1016/j.ejor.2017.12.006 [Google Scholar] [CrossRef]
27. Wang, D., Wang, X. Q., Wang, L., Liu, H., Sing, M. et al. (2021). Optimization of government subsidies in infrastructure public-private partnerships. Journal of Engineering, Design and Technology, 138(4), 545. https://doi.org/10.1108/JEDT-05-2021-0247 [Google Scholar] [CrossRef]
28. Liu, F. R., Liu, J., Yan, X. D. (2020). Solving the asymmetry multi-objective optimization problem in PPPs under LPVR mechanism by Bi-level programing. Symmetry, 12(10), 1667. https://doi.org/10.3390/sym12101667 [Google Scholar] [CrossRef]
29. Shang, L. M., Abdel Aziz, A. M. A. (2020). Stackelberg game theory-based optimization model for design of payment mechanism in performance-based PPPs. Journal of Construction Engineering and Management, 146(4), 04020029. https://doi.org/10.1061/(ASCE)CO.1943-7862.0001806 [Google Scholar] [CrossRef]
30. Zhang, X. X., Liu, J. C. (2022). Incentive mechanism and value-added in PPP projects considering financial institutions’ early intervention. Journal of Construction Engineering and Management, 148(4), 04022001. https://doi.org/10.1061/(ASCE)CO.1943-7862.0002248 [Google Scholar] [CrossRef]
31. Ameyaw, E. E., Chan, A. P. C. (2016). Risk evaluation of water conservancy in a public-private partnership project based on grey fuzzy theory. Journal of Infrastructure Systems, 22(3), 04016016. https://doi.org/10.1061/(ASCE)IS.1943-555X.0000297 [Google Scholar] [CrossRef]
32. Mazher, K. M., Chan, A. P. C., Zahoor, H., Ameyaw, E. E., Edwards, D. J. et al. (2019). Modelling capability-based risk allocation in PPPs using fuzzy integral approach. Canadian Journal of Civil Engineering, 46(9), 777–788. https://doi.org/10.1139/cjce-2018-0373 [Google Scholar] [CrossRef]
33. Liu, L., Wu, J., Wei, G. W., Wei, C., Wang, J. et al. (2020). Entropy-based GLDS method for social capital selection of a PPP project with q-rung orthopair fuzzy information. Entropy, 22(4), 414. https://doi.org/10.3390/e22040414 [Google Scholar] [PubMed] [CrossRef]
34. Okudan, O., Cevikba, M. (2022). Alternative dispute resolution selection framework to settle disputes in public-private partnership projects. Journal of Construction Engineering and Management, 148(9), 04022086. https://doi.org/10.1061/(ASCE)CO.1943-7862.0002351 [Google Scholar] [CrossRef]
35. Wang, L. P., Zhang, P., Zhang, P., Li, R. B., Zhang, Y. K. et al. (2018). A systematic approach for public-private partnership projects CSFs evaluation. Engineering Construction and Architectural Management, 22(9), 1127–1145. https://doi.org/10.1108/ECAM-05-2017-0083 [Google Scholar] [CrossRef]
36. Chen, H. Y., Zhang, L. M., Wu, X. G. (2020). Performance risk assessment in public–private partnership projects based on adaptive fuzzy cognitive map. Applied Soft Computing, 93(1), 106413. https://doi.org/10.1016/j.asoc.2020.106413 [Google Scholar] [CrossRef]
37. Grimsey, D., Lewis, M. K. (2002). Evaluating the risks of public private partnerships for infrastructure projects. International Journal of Project Management, 20(2), 107–118. https://doi.org/10.1016/S0263-7863(00)00040-5 [Google Scholar] [CrossRef]
38. Zhang, S., Chan, A. P. C., Feng, Y. B., Duan, H. X., Ke, Y. J. (2016). Critical review on PPP Research–A search from the Chinese and international journals. International Journal of Project Management, 34(4), 597–612. https://doi.org/10.1016/j.ijproman.2016.02.008 [Google Scholar] [CrossRef]
39. Shrestha, A., Chan, T. K., Aibinu, A. A., Chen, C. (2017). Efficient risk transfer in PPP wastewater treatment projects. Utilities Policy, 48(12), 132–140. https://doi.org/10.1016/j.jup.2017.03.003 [Google Scholar] [CrossRef]
40. Yuan, J. F., Chan, A. P. C., Xia, B., Skibniewski, M. J., Xiong, W. et al. (2016). Cumulative effects on the change of residual value in PPP projects: A comparative case study. Journal of Infrastructure Systems, 22(2), 1–19. https://doi.org/10.1061/(ASCE)IS.1943-555X.0000272 [Google Scholar] [CrossRef]
41. Song, J. B., Liu, H. Y., Sun, Y., Song, L. C. (2022). Contextual recipes for adopting private control and trust in public-private partnership (PPP) governance. Public Administration, 36(4), 794. https://doi.org/10.1111/padm.12825 [Google Scholar] [CrossRef]
42. Ameyaw, E. E., Chan, A. P. (2015). Evaluation and ranking of risk factors in public–private partnership water supply projects in developing countries using fuzzy synthetic evaluation approach. Expert Systems with Applications, 42(12), 5102–5116. https://doi.org/10.1016/j.eswa.2015.02.041 [Google Scholar] [CrossRef]
43. Li, Y., Wang, X. Y., Wang, Y. H. (2017). Using bargaining game theory for risk allocation of public-private partnership projects: Insights from different alternating offer sequences of participants. Journal of Construction Engineering and Management, 143(3), 04016102. https://doi.org/10.1061/(ASCE)CO.1943-7862.0001249 [Google Scholar] [CrossRef]
44. Luo, C., Ju, Y. B., Dong, P. W., Gonzalez, E. D. R. S., Wang, A. H. (2021). Risk assessment for PPP waste-to-energy incineration plant projects in China based on hybrid weight methods and weighted multigranulation fuzzy rough sets. Sustainable Cities and Society, 74(1), 103120. https://doi.org/10.1016/j.scs.2021.103120 [Google Scholar] [CrossRef]
45. Mazher, K. M., Chan, A. P. C., Zahoor, H., Khan, M. I., Ameyaw, E. E. (2018). Fuzzy integral–based risk-assessment approach for public–private partnership infrastructure projects. Journal of Construction Engineering and Management, 144(12), 04018111. https://doi.org/10.1061/(ASCE)CO.1943-7862.0001573 [Google Scholar] [CrossRef]
46. Meng, F. Y., Tang, J., Zhang, S. L., Xu, Y. W. (2020). Public-private partnership decision making based on correlation coefficients of single-valued neutrosophic hesitant fuzzy sets. Informatica, 31(2), 359–397. https://doi.org/10.15388/20-INFOR401 [Google Scholar] [CrossRef]
47. Wu, Y. N., Zhang, T., Chen, K. F., Yi, L. Q. (2020). A risk assessment framework of seawater pumped hydro storage project in China under three typical public-private partnership management modes. Journal of Energy Storage, 32(3), 101753. https://doi.org/10.1016/j.est.2020.101753 [Google Scholar] [CrossRef]
48. Xu, Y. L., Yeung, J. F. Y., Chan, A. P. C., Chan, D. W. M., Wang, S. Q. et al. (2010). Developing a risk assessment model for PPP projects in China—A fuzzy synthetic evaluation approach. Automation in Construction, 19(7), 929–943. https://doi.org/10.1016/j.autcon.2010.06.006 [Google Scholar] [CrossRef]
49. Carbonara, N., Costantino, N., Pellegrino, R. (2014). Concession period for PPPs: A win–win model for a fair risk sharing. International Journal of Project Management, 32(7), 1223–1232. https://doi.org/10.1016/j.ijproman.2014.01.007 [Google Scholar] [CrossRef]
50. Jin, H. Y., Liu, S. J., Liu, C. L., Udawatta, N. (2019). Optimizing the concession period of PPP projects for fair allocation of financial risk. Engineering, Construction and Architectural Management, 26(10), 2347–2363. https://doi.org/10.1108/ECAM-05-2018-0201 [Google Scholar] [CrossRef]
51. Jin, H. Y., Liu, S. J., Sun, J. D., Liu, C. L. (2021). Determining concession periods and minimum revenue guarantees in public-private-partnership agreements. European Journal of Operational Research, 291(2), 512–524. https://doi.org/10.1016/j.ejor.2019.12.013 [Google Scholar] [CrossRef]
52. Ma, G. F., Du, Q. J., Wang, K. D. (2018). A concession period and price determination model for PPP projects: Based on real options and risk allocation. Sustainability, 10(3), 706–726. https://doi.org/10.3390/su10030706 [Google Scholar] [CrossRef]
53. Zhang, X. (2011). Web-based concession period analysis system. Expert Systems with Applications, 38(11), 13532–13542. https://doi.org/10.1016/j.eswa.2011.04.030 [Google Scholar] [CrossRef]
54. Bian, F., Chong, H. Y., Zhang, W., Ding, C. (2021). Government subsidy strategy for public-private-partnership retrofit buildings in China. Energy and Buildings, 252(8), 111455. https://doi.org/10.1016/j.enbuild.2021.111455 [Google Scholar] [CrossRef]
55. He, H. Y., Zheng, L. N., Zhou, G. H. (2022). Linking users as private partners of utility tunnel public–private partnership projects. Tunnelling and Underground Space Technology, 119(4), 104249. https://doi.org/10.1016/j.tust.2021.104249 [Google Scholar] [CrossRef]
56. Rocha Armada, M. J., Pereira, P. J., Rodrigues, A. (2012). Optimal subsidies and guarantees in public–private partnerships. The European Journal of Finance, 18(5), 469–495. https://doi.org/10.1080/1351847X.2011.639789 [Google Scholar] [CrossRef]
57. Li, J. H., Li, Y., Zhang, S. H. (2020). Optimal expansion timing decisions in multi-stage PPP projects involving dedicated asset and government subsidies. Journal of Industrial & Management Optimization, 16(5), 2065–2086. https://doi.org/10.3934/jimo.2019043 [Google Scholar] [CrossRef]
58. Liu, H. M., Song, S., Hu, Y., Yan, X. (2020). Monte-Carlo optimization model for dynamic capital structure adjustment in Chinese public-private partnerships under revenue uncertainty. Transportation Research Part A: Policy and Practice, 142(1), 115–128. https://doi.org/10.1016/j.tra.2020.10.010 [Google Scholar] [CrossRef]
59. Liu, Q., Liao, Z. Y., Guo, Q., Degefu, D. M., Wang, S. et al. (2019). Effects of short-term uncertainties on the revenue estimation of PPP sewage treatment projects. Water, 11(6), 1203–1216. https://doi.org/10.3390/w11061203 [Google Scholar] [CrossRef]
60. Lv, J. N., Lin, M. Q., Zhou, W. (2021). Fluctuation in construction costs and its effect on contract renegotiation behavior in PPP wastewater treatment projects: An evolutionary game analysis. Journal of Cleaner Production, 314(11), 128025. https://doi.org/10.1016/j.jclepro.2021.128025 [Google Scholar] [CrossRef]
61. Xu, Y. L., Peng, Y., Qian, Q. K., Chan, A. P. C. (2015). An alternative model to determine the financing structure of PPP-based young graduate apartments in China: A case study of Hangzhou. Sustainability, 7(5), 5720–5734. https://doi.org/10.3390/su7055720 [Google Scholar] [CrossRef]
62. Zhang, Q. M., Guo, X. M., Li, H. C. (2021). The impact of financial risks on financial investment in infrastructure: Based on a two-factor stochastic differential equation. Discrete Dynamics in Nature and Society. https://doi.org/10.1155/2021/9112739 [Google Scholar] [CrossRef]
63. Attarzadeh, M., Chua, D. K. H., Beer, M., Abbott, E. L. S. (2017). Fuzzy randomness simulation of long-term infrastructure projects. ASCE-ASME Journal of Risk and Uncertainty in Engineering Systems, Part A: Civil Engineering, 3(3), 04017002. https://doi.org/10.1061/AJRUA6.0000902 [Google Scholar] [CrossRef]
64. Nahmias, S. (1978). Fuzzy variables. Fuzzy Sets and Systems, 1(2), 97–110. https://doi.org/10.1016/0165-0114(78)90011-8 [Google Scholar] [CrossRef]
65. Liu, B. D. (2009). Theory and practice of uncertain programming. Berlin: Springer. [Google Scholar]
66. Dubois, D., Prade, H. (1980). Fuzzy sets and systems: Theory and applications. Mathematics in Science and Engineering, 147(17), 393. [Google Scholar]
67. Liu, B., Liu, Y. K. (2002). Expected value of fuzzy variable and fuzzy expected value models. IEEE Transactions on Fuzzy Systems, 10(4), 445–450. https://doi.org/10.1109/TFUZZ.2002.800692 [Google Scholar] [CrossRef]
68. Jamali, M. B., Rasti-Barzoki, M. (2019). A game theoretic approach to investigate the effects of third-party logistics in a sustainable supply chain by reducing delivery time and carbon emissions. Journal of Cleaner Production, 235, 636–652. https://doi.org/10.1016/j.jclepro.2019.06.348 [Google Scholar] [CrossRef]
69. Liu, J. C., Gao, R. L., Cheah, C. Y. J., Luo, J. (2016). Incentive mechanism for inhibiting investors’ opportunistic behavior in PPP projects. International Journal of Project Management, 34(7), 1102–1111. https://doi.org/10.1016/j.ijproman.2016.05.013 [Google Scholar] [CrossRef]
70. Ke, Y. J., Wang, S. Q., Chan, A. P. C. (2010). Risk allocation in public-private partnership infrastructure projects: Comparative study. Journal of Infrastructure Systems, 16(4), 343–351. https://doi.org/10.1061/(ASCE)IS.1943-555X.0000030 [Google Scholar] [CrossRef]
71. Bing, L., Akintoye, A., Edwards, P. J., Hardcastle, C. (2005). The allocation of risk in PPP/PFI construction projects in the UK. International Journal of Project Management, 23(1), 25–35. https://doi.org/10.1016/j.ijproman.2004.04.006 [Google Scholar] [CrossRef]
72. Rubinstein, A. (1982). Perfect equilibrium in a bargaining model. Econometrica, 50(1), 97–109. https://doi.org/10.2307/1912531 [Google Scholar] [CrossRef]
73. Wang, S. N., Hu, Z. H. (2021). Green logistics service supply chain games considering risk preference in fuzzy environments. Sustainability, 13(14), 8024. https://doi.org/10.3390/su13148024 [Google Scholar] [CrossRef]
74. Yang, D. Y., Xiao, T. J. (2017). Pricing and green level decisions of a green supply chain with governmental interventions under fuzzy uncertainties. Journal of Cleaner Production, 149(1), 1174–1187. https://doi.org/10.1016/j.jclepro.2017.02.138 [Google Scholar] [CrossRef]
75. Jamali, M. B., Gorji, M. A., Iranpoor, M. (2021). Pricing policy on a dual competitive channel for a green product under fuzzy conditions. Neural Computing and Applications, 33(17), 11189–11201. https://doi.org/10.1007/s00521-020-05567-2 [Google Scholar] [CrossRef]
76. Li, J. Y., Song, F. F., Zhao, C. H. (2018). Financial compensation strategy of PPP project based on game theory and intelligent optimization. Journal of Intelligent & Fuzzy Systems, 35(3), 2697–2702. https://doi.org/10.3233/JIFS-169621 [Google Scholar] [CrossRef]
77. Tang, B. W., Xu, J., Sun, Y. Z., Zhou, N., Shen, B. et al. (2019). Policy solution and game analysis for addressing the challenge of developing public–private partnership energy project. Environmental Research Letters, 14(4), 044019. https://doi.org/10.1088/1748-9326/ab0217 [Google Scholar] [CrossRef]
Cite This Article
 Copyright © 2023 The Author(s). Published by Tech Science Press.
This work is licensed under a Creative Commons Attribution 4.0 International License , which permits unrestricted use, distribution, and reproduction in any medium, provided the original work is properly cited.
 Downloads
 Citation Tools