
 Submit a Paper
 Propose a Special lssue
 Open Access
ARTICLE
Multi-Features Disease Analysis Based Smart Diagnosis for COVID-19
1 Department of CSE, Vignan’s Institute of Management and Technology for Women Ghatkesar, Telangana, India
2 Department of CSE, PVPSIT, Vijayawada, Andhra Pradesh, 520007, India
3 Department of Computer Science, College of Computer Sciences and Information Technology, King Faisal University, Al-Ahsa, 31982, Saudi Arabia
4 Department of Computer Science and Engineering-AIML, VNR Vignana Jyothi Institute of Engineering and Technology, Hyderabad, Telangana, 500090, India
* Corresponding Author: Shakeel Ahmed. Email:
Computer Systems Science and Engineering 2023, 45(1), 869-886. https://doi.org/10.32604/csse.2023.029822
Received 12 March 2022; Accepted 19 May 2022; Issue published 16 August 2022
 View Full Text
 Download PDF
Abstract
Coronavirus 2019 (COVID -19) is the current global buzzword, putting the world at risk. The pandemic’s exponential expansion of infected COVID-19 patients has challenged the medical field’s resources, which are already few. Even established nations would not be in a perfect position to manage this epidemic correctly, leaving emerging countries and countries that have not yet begun to grow to address the problem. These problems can be solved by using machine learning models in a realistic way, such as by using computer-aided images during medical examinations. These models help predict the effects of the disease outbreak and help detect the effects in the coming days. In this paper, Multi-Features Decease Analysis (MFDA) is used with different ensemble classifiers to diagnose the disease’s impact with the help of Computed Tomography (CT) scan images. There are various features associated with chest CT images, which help know the possibility of an individual being affected and how COVID-19 will affect the persons suffering from pneumonia. The current study attempts to increase the precision of the diagnosis model by evaluating various feature sets and choosing the best combination for better results. The model’s performance is assessed using Receiver Operating Characteristic (ROC) curve, the Root Mean Square Error (RMSE), and the Confusion Matrix. It is observed from the resultant outcome that the performance of the proposed model has exhibited better efficient.Keywords
In December 2019, many cases related to pneumonia occurred in Wuhan city of China, and spread throughout the world [1,2]. It was found that severe acute respiratory syndrome coronavirus 2 (SARSCoV2) is the leading cause of the outbreak. This virus comes from the family of SARS and Middle East Respiratory Syndrome Coronavirus (MERS-CoV) [3]. These viruses are merely controlled with considered measures taken. In the fight against COVID-19, they created an environment where patients seek emergency treatment and care. As the epidemic spreads rapidly, patients are sent to the health center in batches. Now, a significant problem is the need for rapid diagnostic methods. Visualization by employing radiographic images, such as a chest X-Ray or Computed Tomography (CT), is another method for monitoring SARS-CoV-2 infection for diagnosis. Recent investigations have shown COVID-19 anomalies in chest X-Ray and CT pictures, which become opaque to geo-glass when exposed to the radiation source [4,5]. Diagnostic imaging utilizing radiological images may be the initial step in monitoring COVID-19 [6] if the patient receives sound guidance.
On the other hand, radiography is the most suitable technique for image-based diagnostics. It represents a watershed moment in the history of Polymerase Chain Reaction (PCR) testing in terms of detection rates during the early phases of COVID-19 [7]. To comprehend the backbone pictures of the system, experts are required [8]. The use of Artificial Intelligence (AI) in diagnostic choices may need professionals to rapidly and correctly examine X-ray pictures to identify COVID-19 [9,10]. These persons are considered the carriers of the virus. They are spreading and infecting other persons whose immunity power is less due to these main reasons the effect of such kind of virus is increasing exponentially. Smallpox may be considered an endemic, which has affected Europe to Asia [11]. The current results and the reports, which were obtained at the initial stages, show that they are with low intense values.
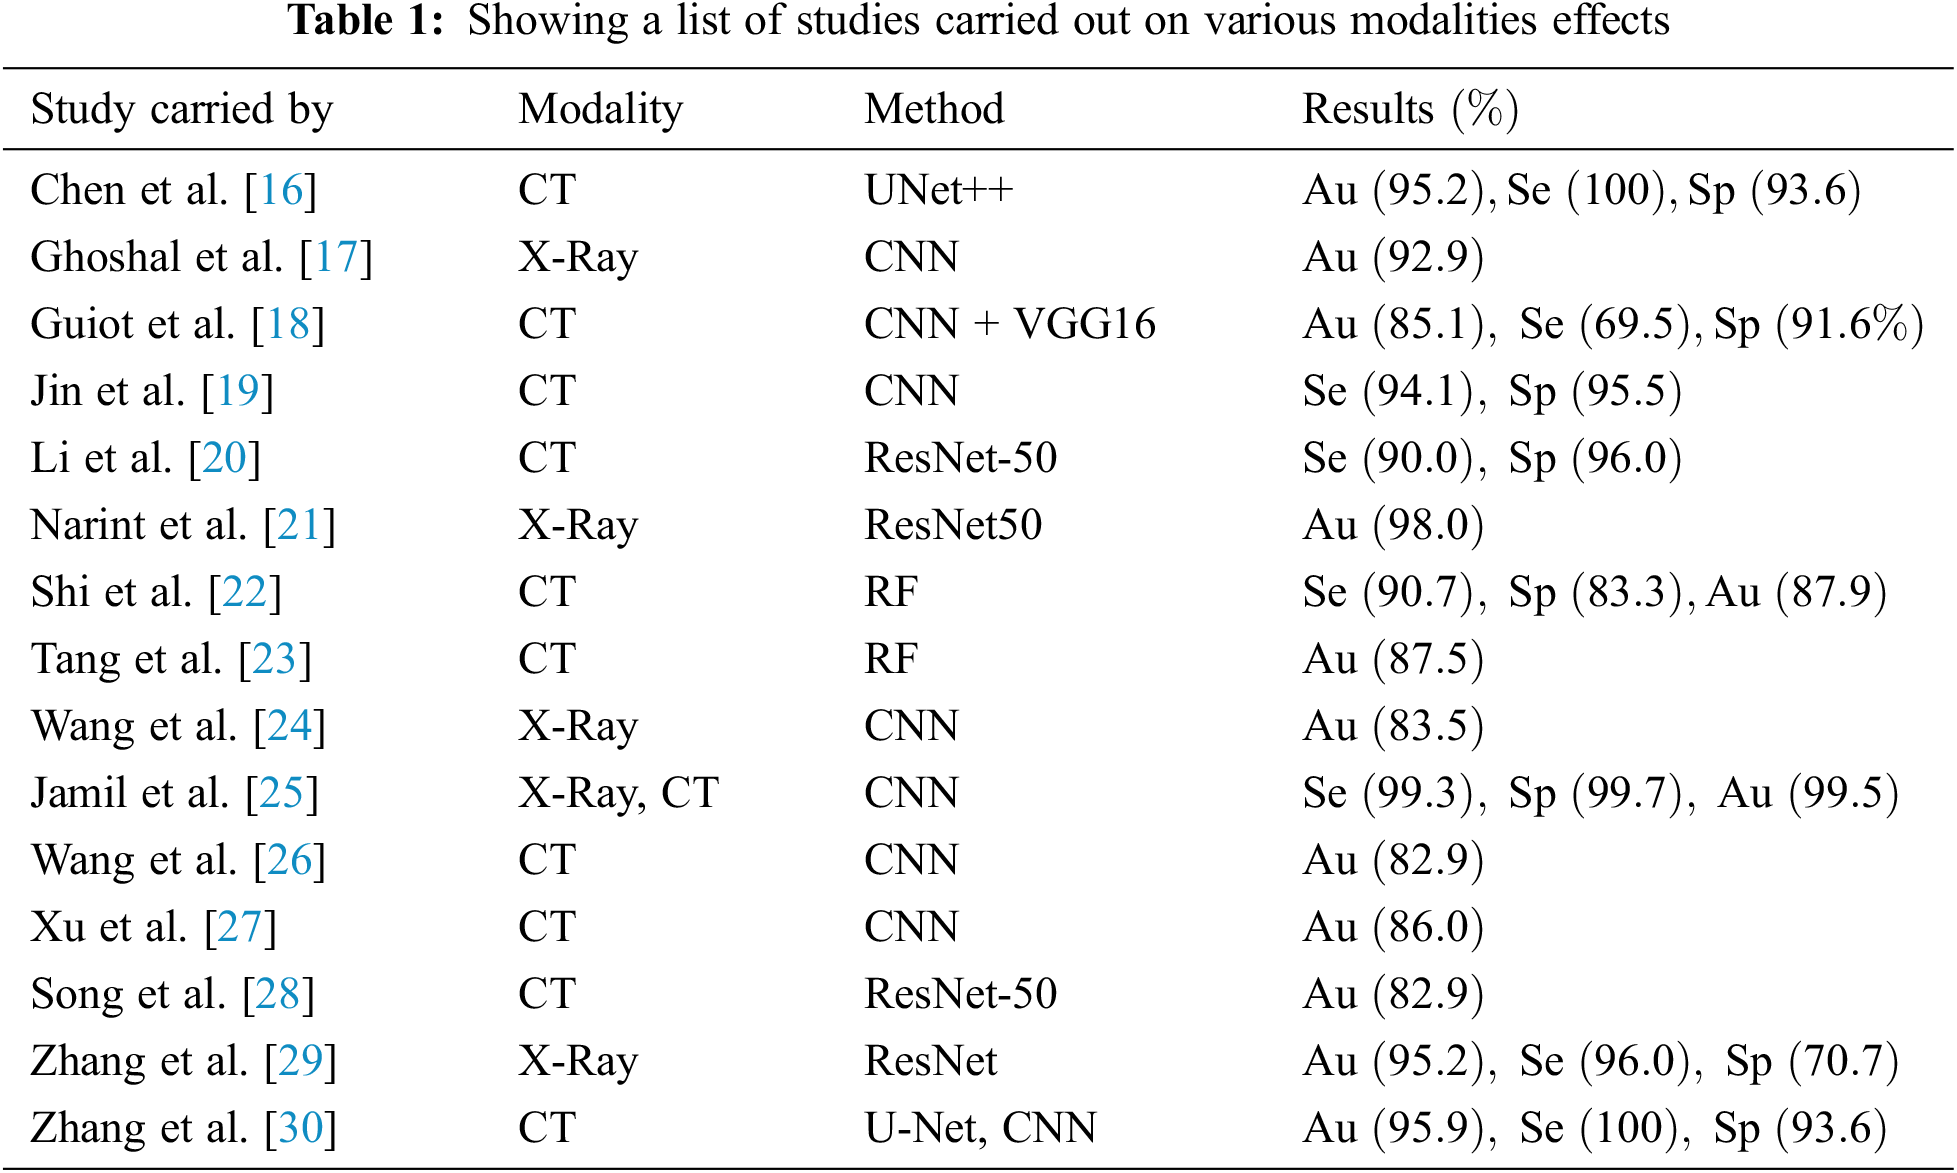
Artificial intelligence tools aid in tracking infectious illnesses, forecasting early warning indications of an epidemic, and predicting the peak level of viral dissemination. BlueDot, an AI-driven platform, that monitors diseases in China by forecasting viral infection based on people’s movement patterns from one place to another. Deep Mind and other companies are developing AI-based solutions, and deep learning algorithms are being deployed to identify and analyze COVID-19-related chest illnesses and body temperatures [12]. Expert Systems (ES) are artificial intelligence technologies that can provide timely expert advice relying upon their knowledge base. Data mining methods are critical in machine learning for categorizing and grouping data. Decision Trees (DT), Regression, Support Vector Machine (SVM), K-Nearest Neighbors (KNN), Random Forest (RF), Logistic Regression (LR), Association Rule Mining, and other Data Mining methods are used for data categorization [13]. On the other hand, data clustering is done using K-Means and neural networks like Convolutional Neural Networks (CNN) [14]. Machine Intelligence approaches, on the other hand, do predictive analytics about respiratory illness. In the early phases, machine intelligence approaches are being utilized to create deep learning-based architectures for tailored healthcare for patients [15]. The supervised model’s aid clinicians in the development of successful virus medicines as well as the identification of prevalent symptom clusters. The performances of various state-of-art models over the metrics Accuracy (Au), Sensitivity (Se) and Specificity (Sp) are presented in Tab. 1.
It gives triumphs while managing them and finding the solutions to such typical pandemics. If they are not appropriately handled, massive deaths are faced. This COVID-19 pandemic has created massive changes in the lifestyle of human beings either in terms of various activities in daily life, which may arise from food, education, traveling, business, and many more. There is no untouched area that has observed the drastic effect of this pandemic. This pandemic drastically hit most areas of society. It created an unconcerned alarm. However, precautionary measures were taken, which do not sustain for a long time until their solution is permanent [19]. Therefore, a primary alarming method has been developed to warn and prepare to face any situation until the condition worsens [20,21].
In this paper, we have discussed a unique model termed as Multi-Feature Disease Analysis Model. When particular input is given at a time using all methods available to solve the problem, the best traced out to achieve this in our paper, a CT scan dataset has two classifications, one with affected with COVID-19 and another section without COVID-19 [22]. Achieving the solution with high accuracy with a comparative approach is helpful to take and choosing the correct solution. One can expect desirable results with less or negligible failure content [23]. The above study conducted by various authors shows that they have used multiple methodologies and modalities to classify COVID-19 and similar diseases. There contributed results considered in terms of accuracy of the model, specificity, and sensitivity. From the obtained results, it is clear that though the contributed results were good, they lag in times of high values [24]. Getting accurate values with high precession and percentages matters more and varies the results. In our proposed model, we have tried to overcome these drawbacks where we utilized multi-feature analysis, due to which we tried to achieve results with high accuracy values [25].
Fig. 1 shows the flow diagram of initial symptoms observed in COVID-19 patients and the various measures to be carried out concerning a particular system expressed clearly. Depending on the classification of pneumonia, whether it belongs to viral or community-based pneumonia, its corresponding measures are being carried out. Because it is very safe to find the cause of the infection and then start treating the patient, which saves a lot of critical time to save the patients if not followed, then crucial time is wasted [27].
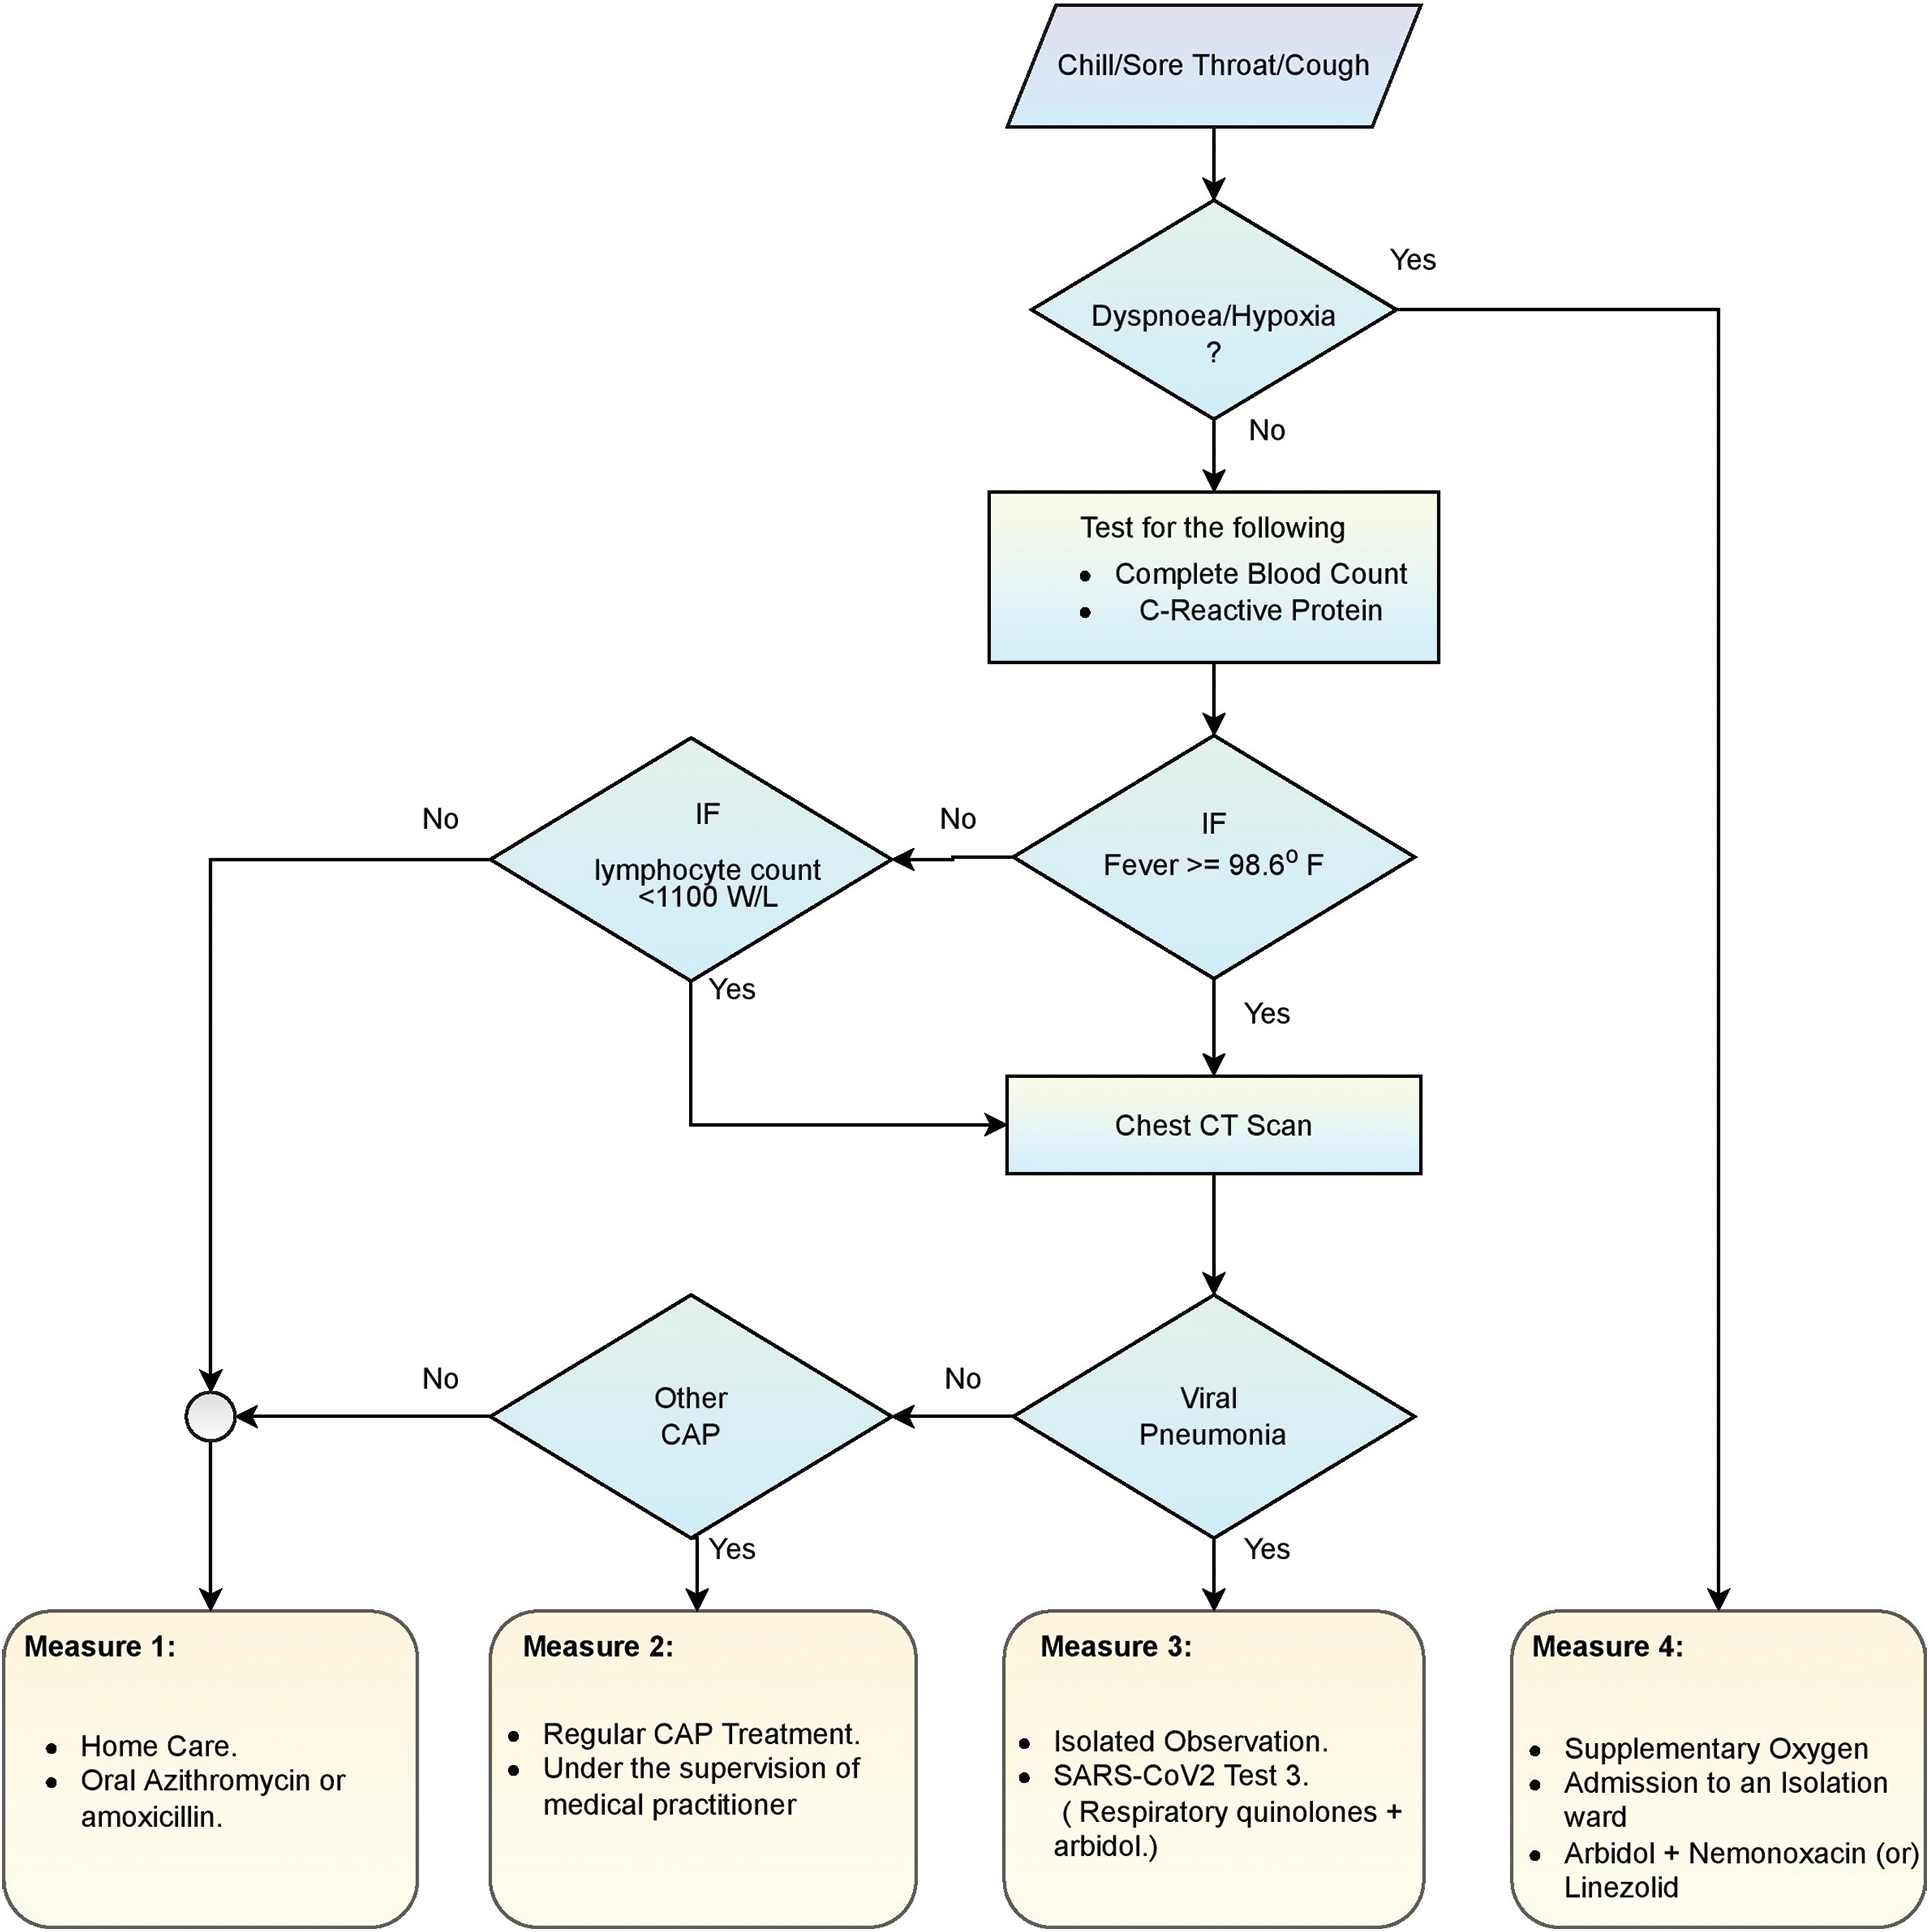
Figure 1: Flow diagram regarding treatment for COVID-19
In this paper, we have discussed a unique model termed as Multi-Feature Analysis Model. When particular input is given at a time using all methods available to solve the problem, the best traced out, to achieve this in our paper, a CT scan dataset is opted to have two classifications, one with affected with covid-19 and another section without COVID-19 [28]. Achieving the solution with high accuracy with a comparative approach is helpful to take and choosing the correct solution.
From the reports of CT scan images, COVID-19 is reported to be classified into four stages. 0–4 days when the patient’s initial symptoms are observed is considered the first stage. Ground Glass opacities are observed at the lower lobes either bilaterally or bilaterally, carried out during the second stage between –8 days. The next 9–13 days are considered the peak state here. High prevent dense consolidation is observed [29–31]. If the infection is going to be controlled, then within 14 days, a crazy-paving pattern and consolidation are observed. These can be observed clearly during different CT Scan images taken during these four stages here. The maximum symptom of COVID-19 is similar to that of pneumonia, so these CT scan images help us get a clear-cut idea of this. So if the disease is detected early with proper care and medication, it can be cured and prevented from further spread [32].
Each CT Scan’s construction component, which is defined by kernel size and filter, is shown in Fig. 2. For instance, a kernel size of 7 indicates that both the height and breadth of the two-dimensional convolution window are 7. In contrast, the filter refers to the output space’s size or the number of output filters in each CT scan. For instance, in the layer designated “conv5”, each construction block consists of three convolution layers linked in succession. The primary objectives of the current study are as follows
• To mechanize a diagnostic model that can precisely recognize the disease, that would assist in providing the timely medication and appropriate treatment.
• The feature engineering is performed through the Multi-Features Decease Analysis approach for identifying the abnormality by using the best-fitted feature set.
• To analyze the robustness of various classification models like Random Forest, Decision Tree, Support Vector Machine, K Nearest Neighbour, Gradient Boosting, and Gaussian Naive Bayes concerning MFDA.
• The study summarizes the tradeoff between the predicted and confirmed recovery and the number of deaths caused due to COVID-19.
• The model’s performances are evaluated against various influencing factors like dropout ratio, number of epochs, and ROC curves.
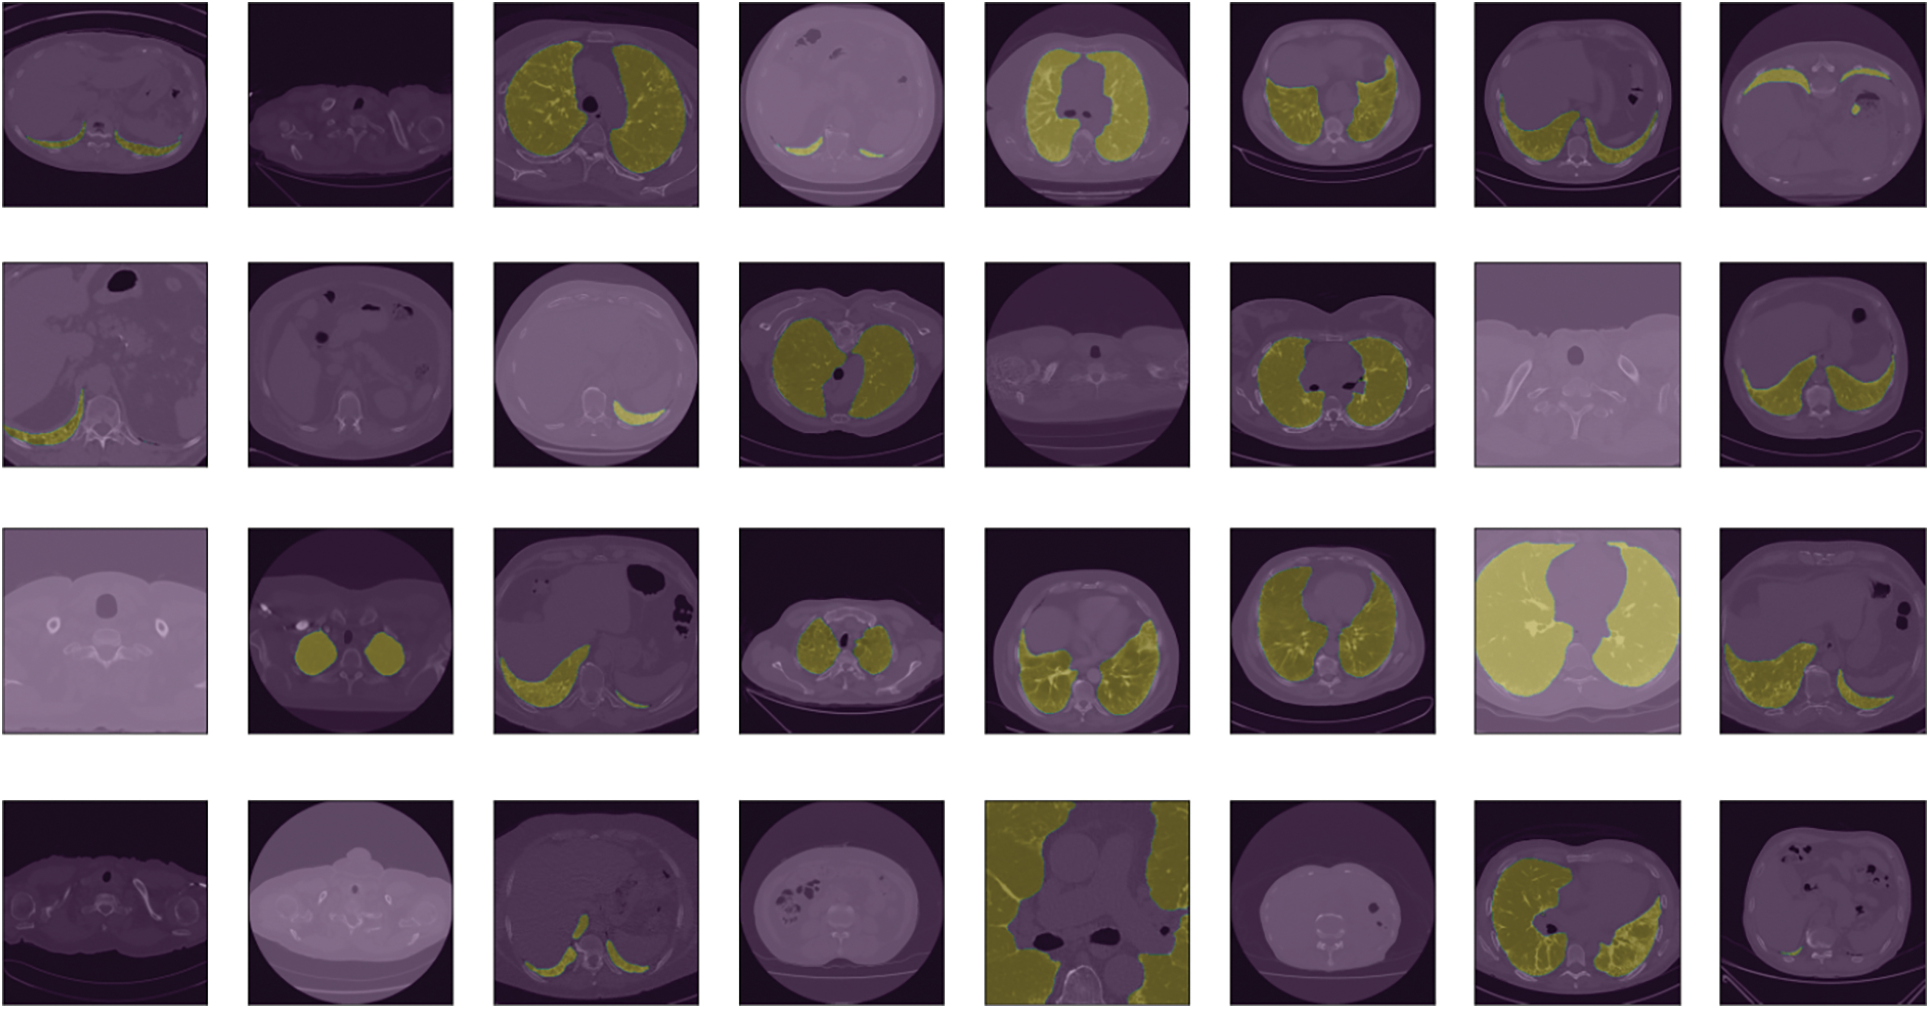
Figure 2: Showing a view of CT scan images of the considered dataset of COVID-19 affected persons
3 Experimental Setup with MFDA Model
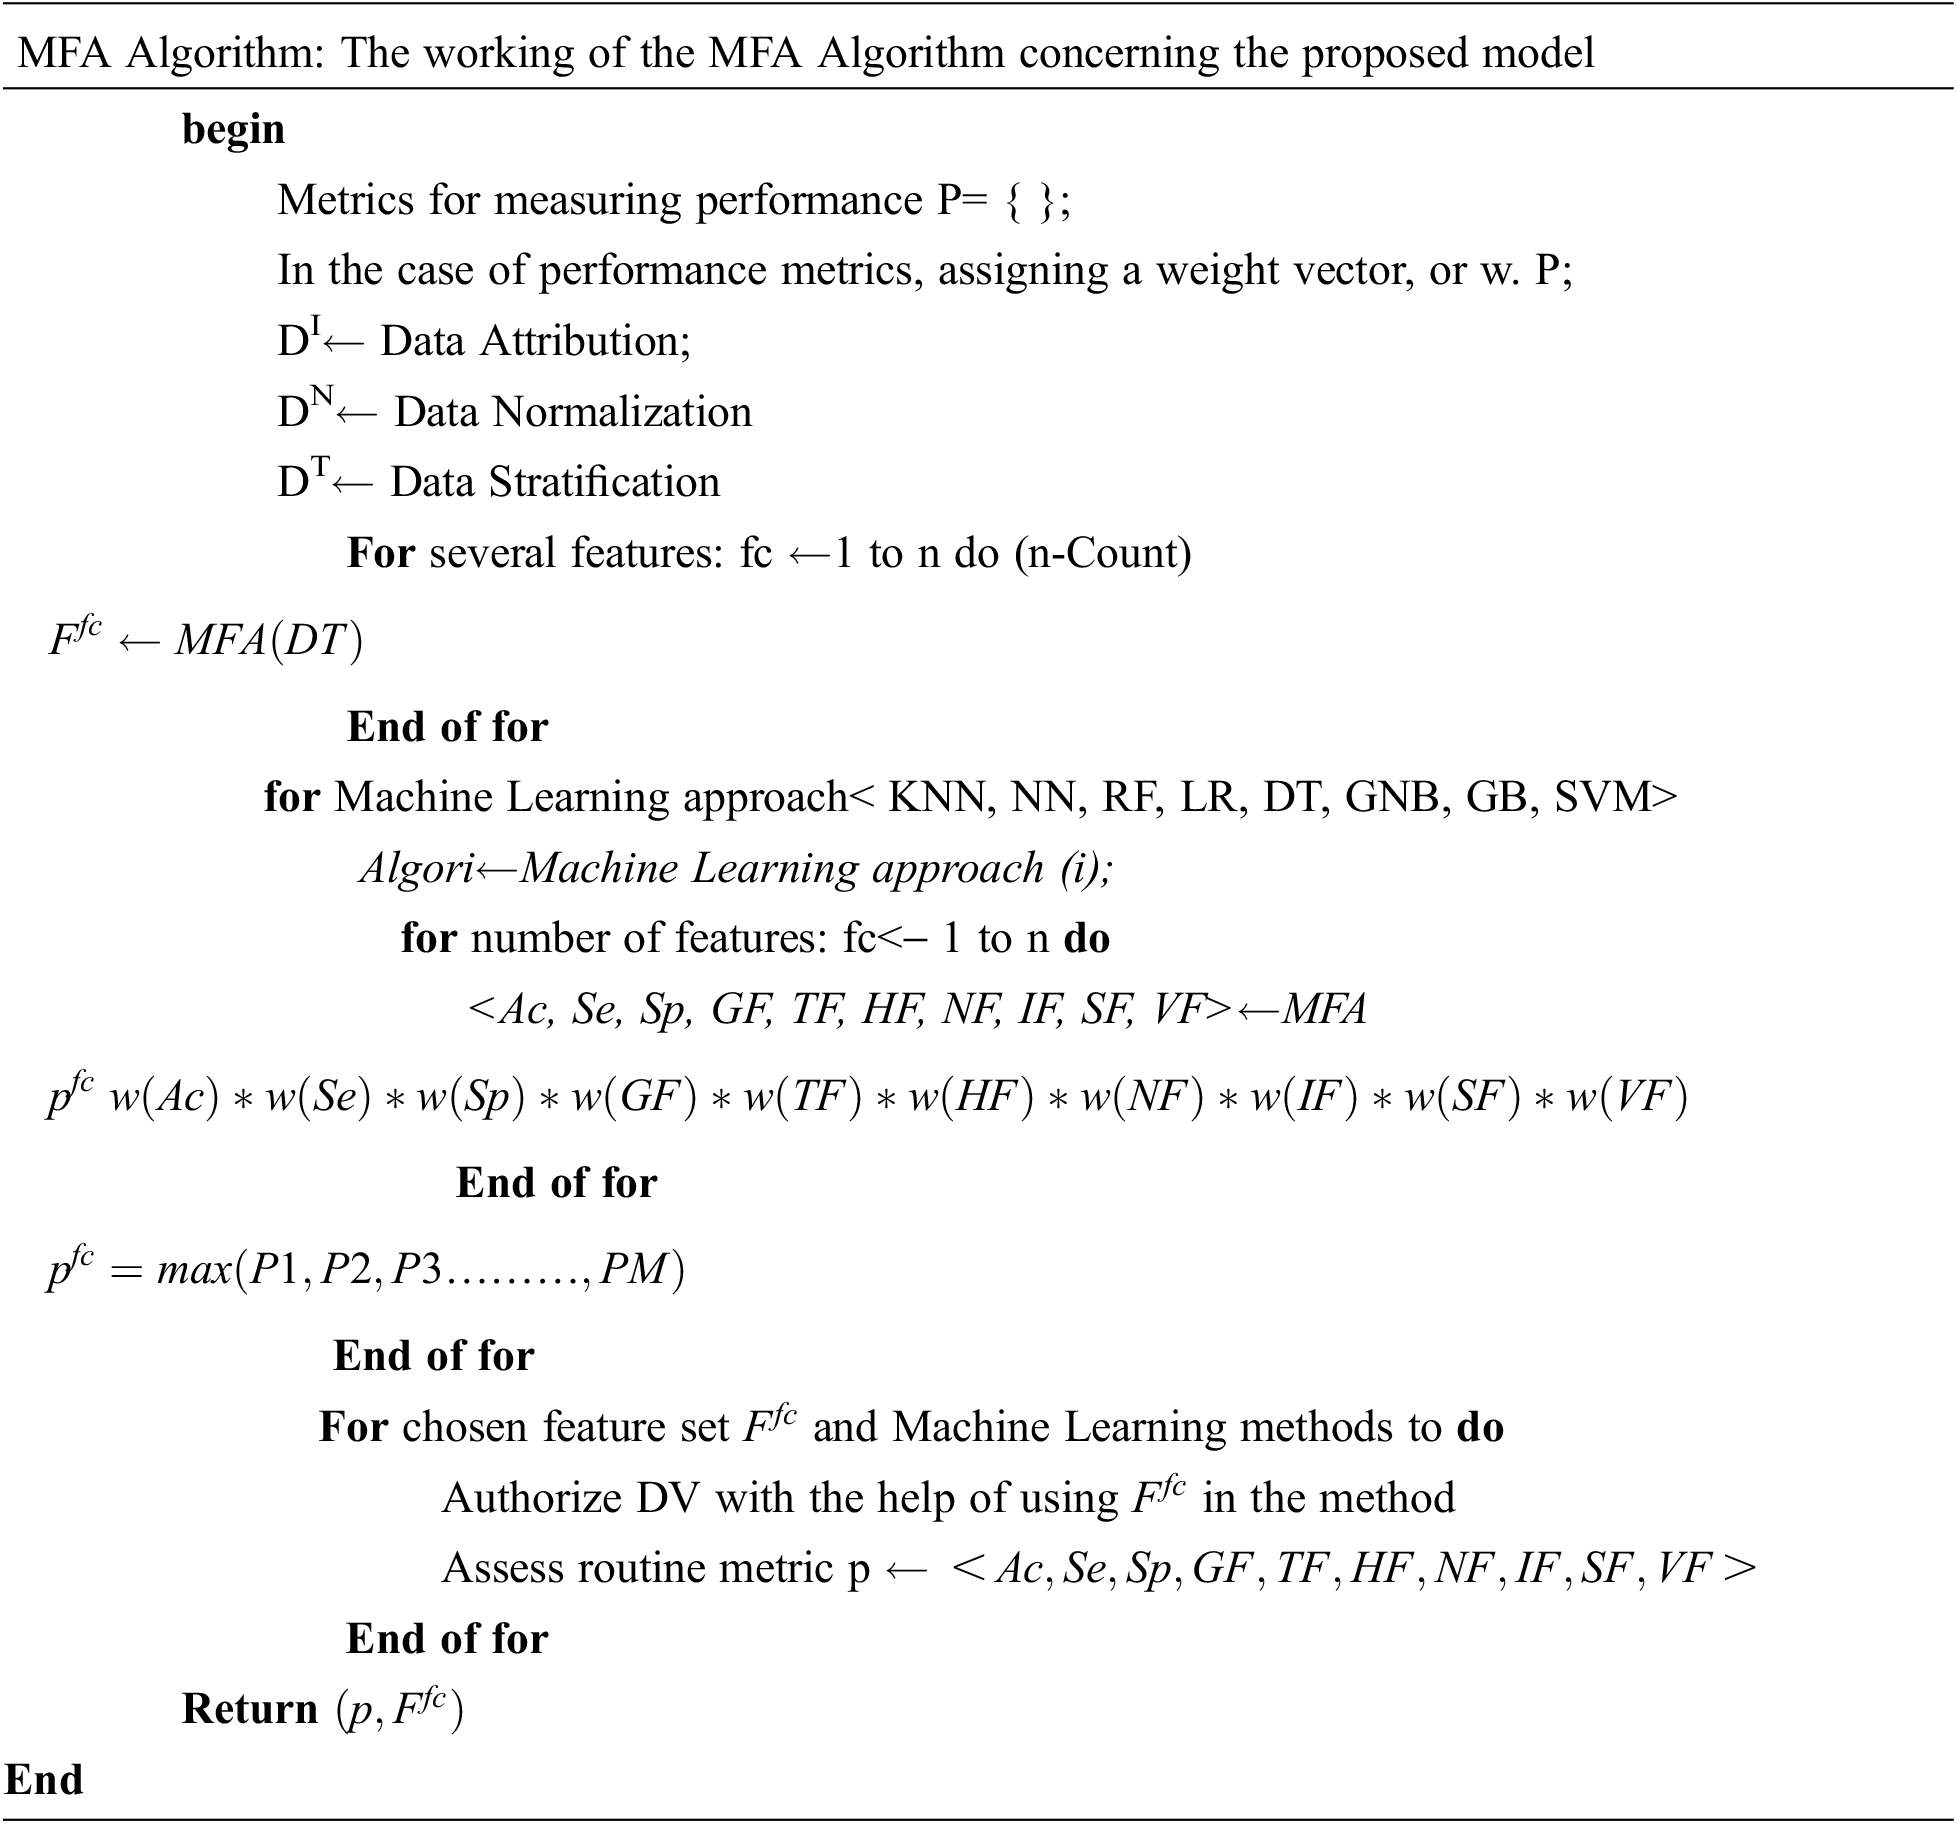
It is clear from the proposed MFDA model that from the considered dataset, one can easily classify and detect the effect of COVID-19 in any patient with the assistance of CT scan images. The CT Scan dataset on which the job will be performed is sourced from Kaggle. The obtained dataset information is medically relevant concerning the patient. Still, it is occasionally incomplete, necessitating verification to overcome any sort of vacuum information, which is known as data imputation. A complete DATASET, collected from the data imputation, is then divided into a small complete dataset, referring to the task as stratification. These are divided into small complete sets used for training and testing. Feature extraction from the collected data is carried out from the Multi-Feature Analysis method. The required features were extracted from the collected dataset to get complete information. This featured data collected is then normalized. The hyperparameters from the normalized data are then extracted from various Machine Learning (ML) approaches (RF, DT, LR, SVM). Out of all existing ML techniques, the required techniques, which are helpful to gather the required features of the dataset, are considered. A part of the data which has to be tested is used here, and the same process that is carried out concerning the training dataset is carried out with the testing data. Their validation and performance are being carried out with the help of a confusion matrix. When the results are satisfied, they clearly show that the collected and remaining information is related to the patients affected by COVID-19. Fig. 3 presents the framework of the Multiple factor analysis model.
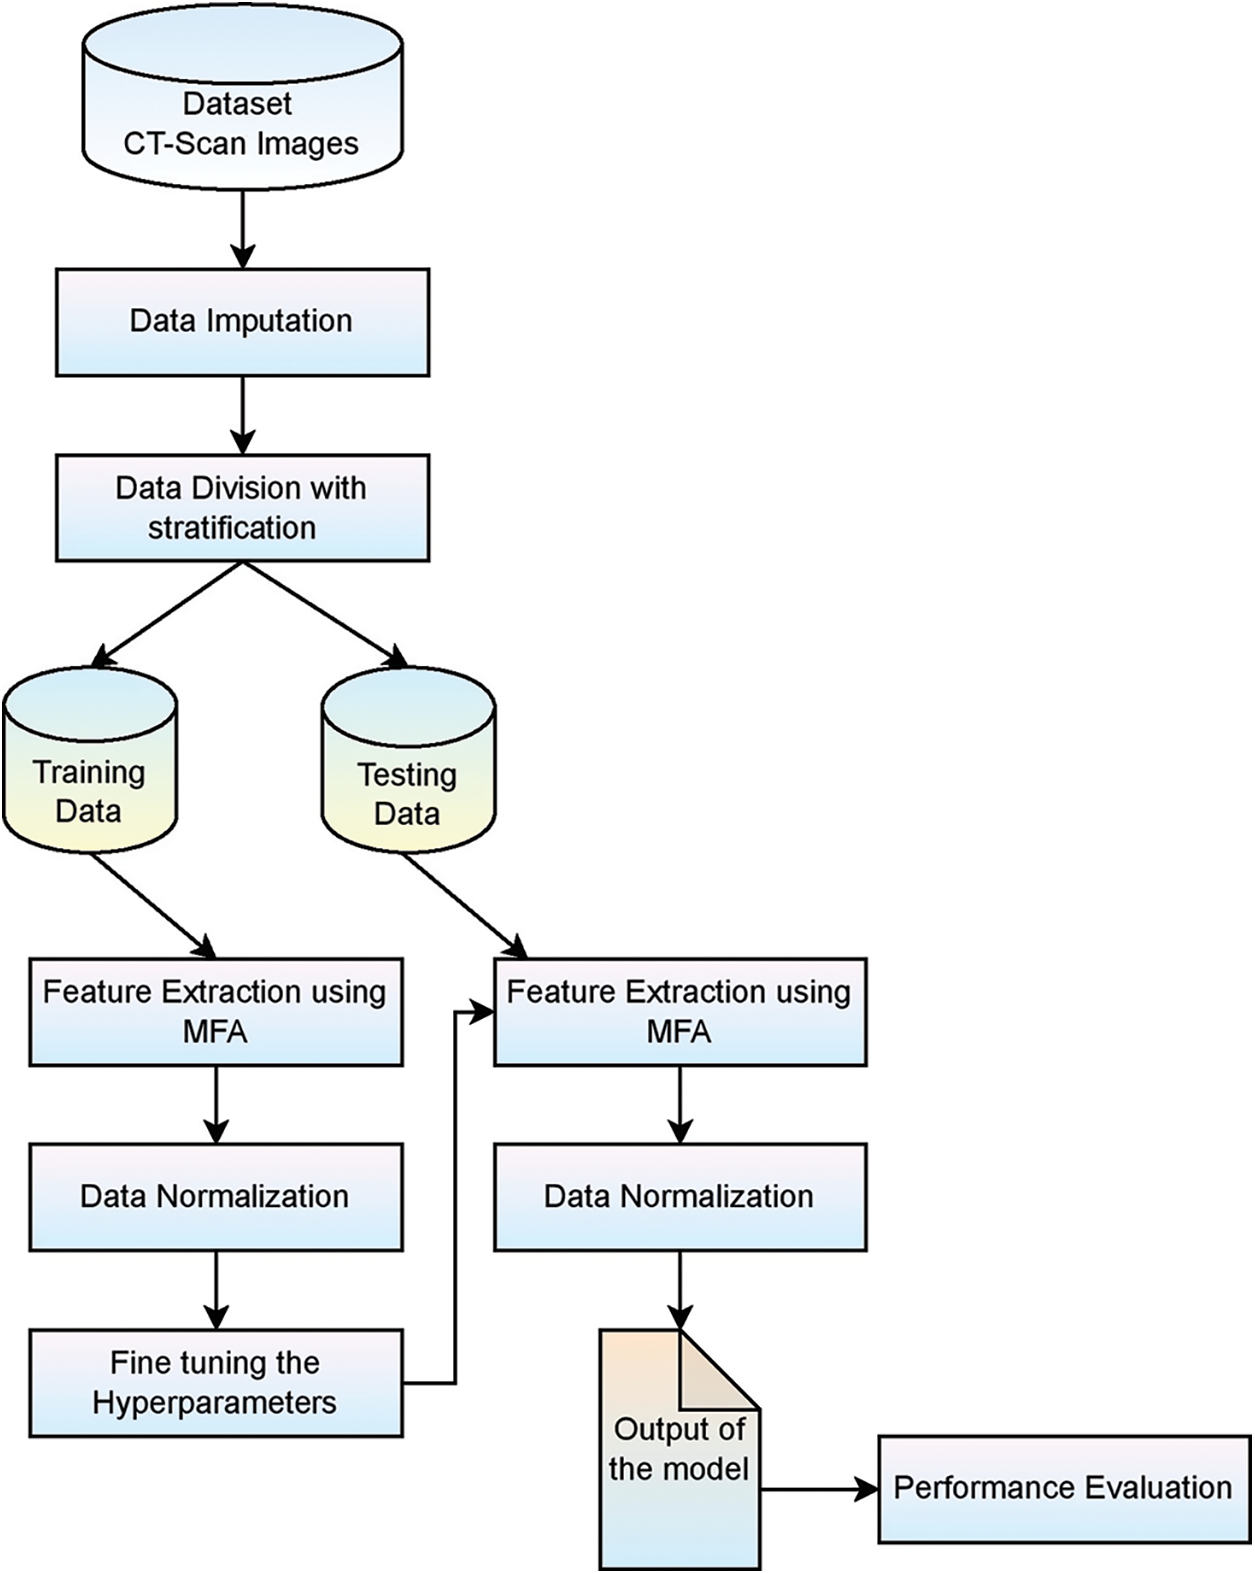
Figure 3: Framework of MFDA based prediction model for COVID-19
A considered dataset D, with F as features set having
The block diagram associated with the proposed Multi features of disease analysis for smart diagnosis is present in Fig. 4. The MDFA model works on choosing the appropriate feature-set based on the likelihood of the feature for making the precise prediction of the given disease. Generally, the feature set may vary for disease, and the MDFA assists in choosing the optimal feature set. The process includes various phases like Data Selection, Data Pre-processing, Feature Extraction, Feature subset population, Feature selection, and applying the classifier for assessing the outcome.
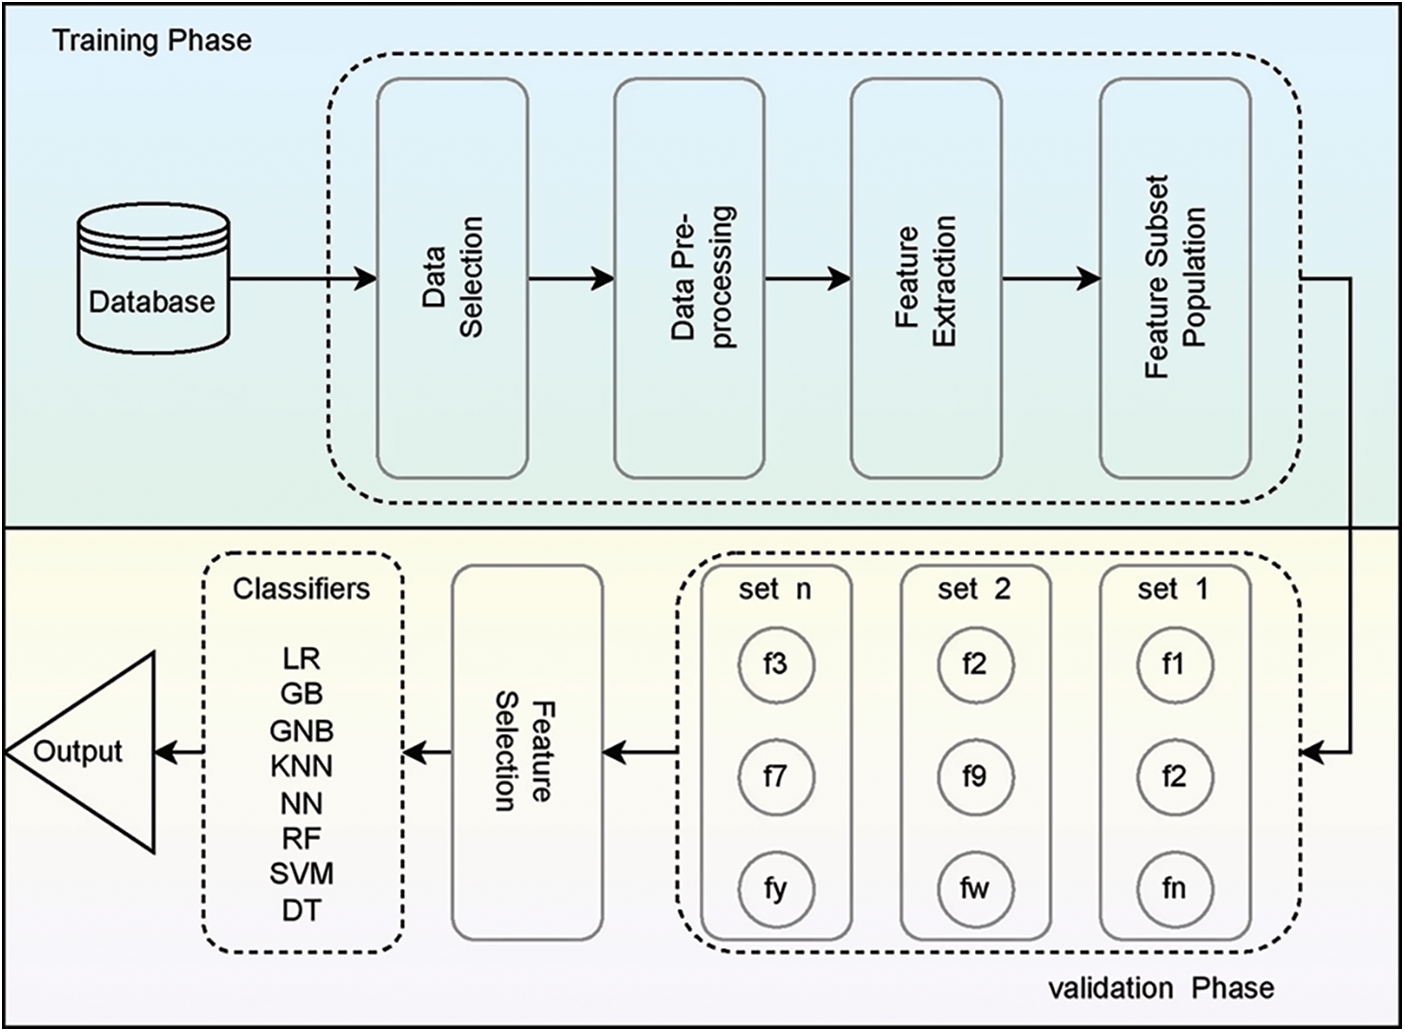
Figure 4: Block diagram of proposed MFDA-based DNN model
From January 22, 2020, to June 30, 2021, the day-to-day prevalence statistics for COVID-19 were obtained from the standard dataset hub of Johns Hopkins University. Daily case reports and daily time series summary information in the dataset are available for viewing. Specifically, in the present study, we were using time-series analytical results in Comma-Separated Values (CSV) format, with three tables for retrieved cases, fatality cases, and cases reported of COVID-19, each one with six attributes such as confirmed (country/region), death (last update), province/state. They update the information about recovered cases, once a day. The dataset is updated once a day. Since the data was collected, the COVID-19 has retrieved death cases and verified their spread throughout the globe. A simple observation may be made of the spread’s exponential development, which indicates that it must be contained. One has to organize the collected data, which shows an impactful effect on the results. So to achieve these things, the following operations are carried out on the collected data.
Data imputation: The considered data for a particular task must be complete, especially when work is carried out on medical datasets where most of the data relevant to patients are not revealed due to privacy. If the task has to be carried out on a medical dataset, then along with the collected data, the missed contents should also be collected, referred to as data imputation. Various methods such as the hot deck, cold deck, and substitution are various methods that can be implemented successfully to recall data if any is missing.
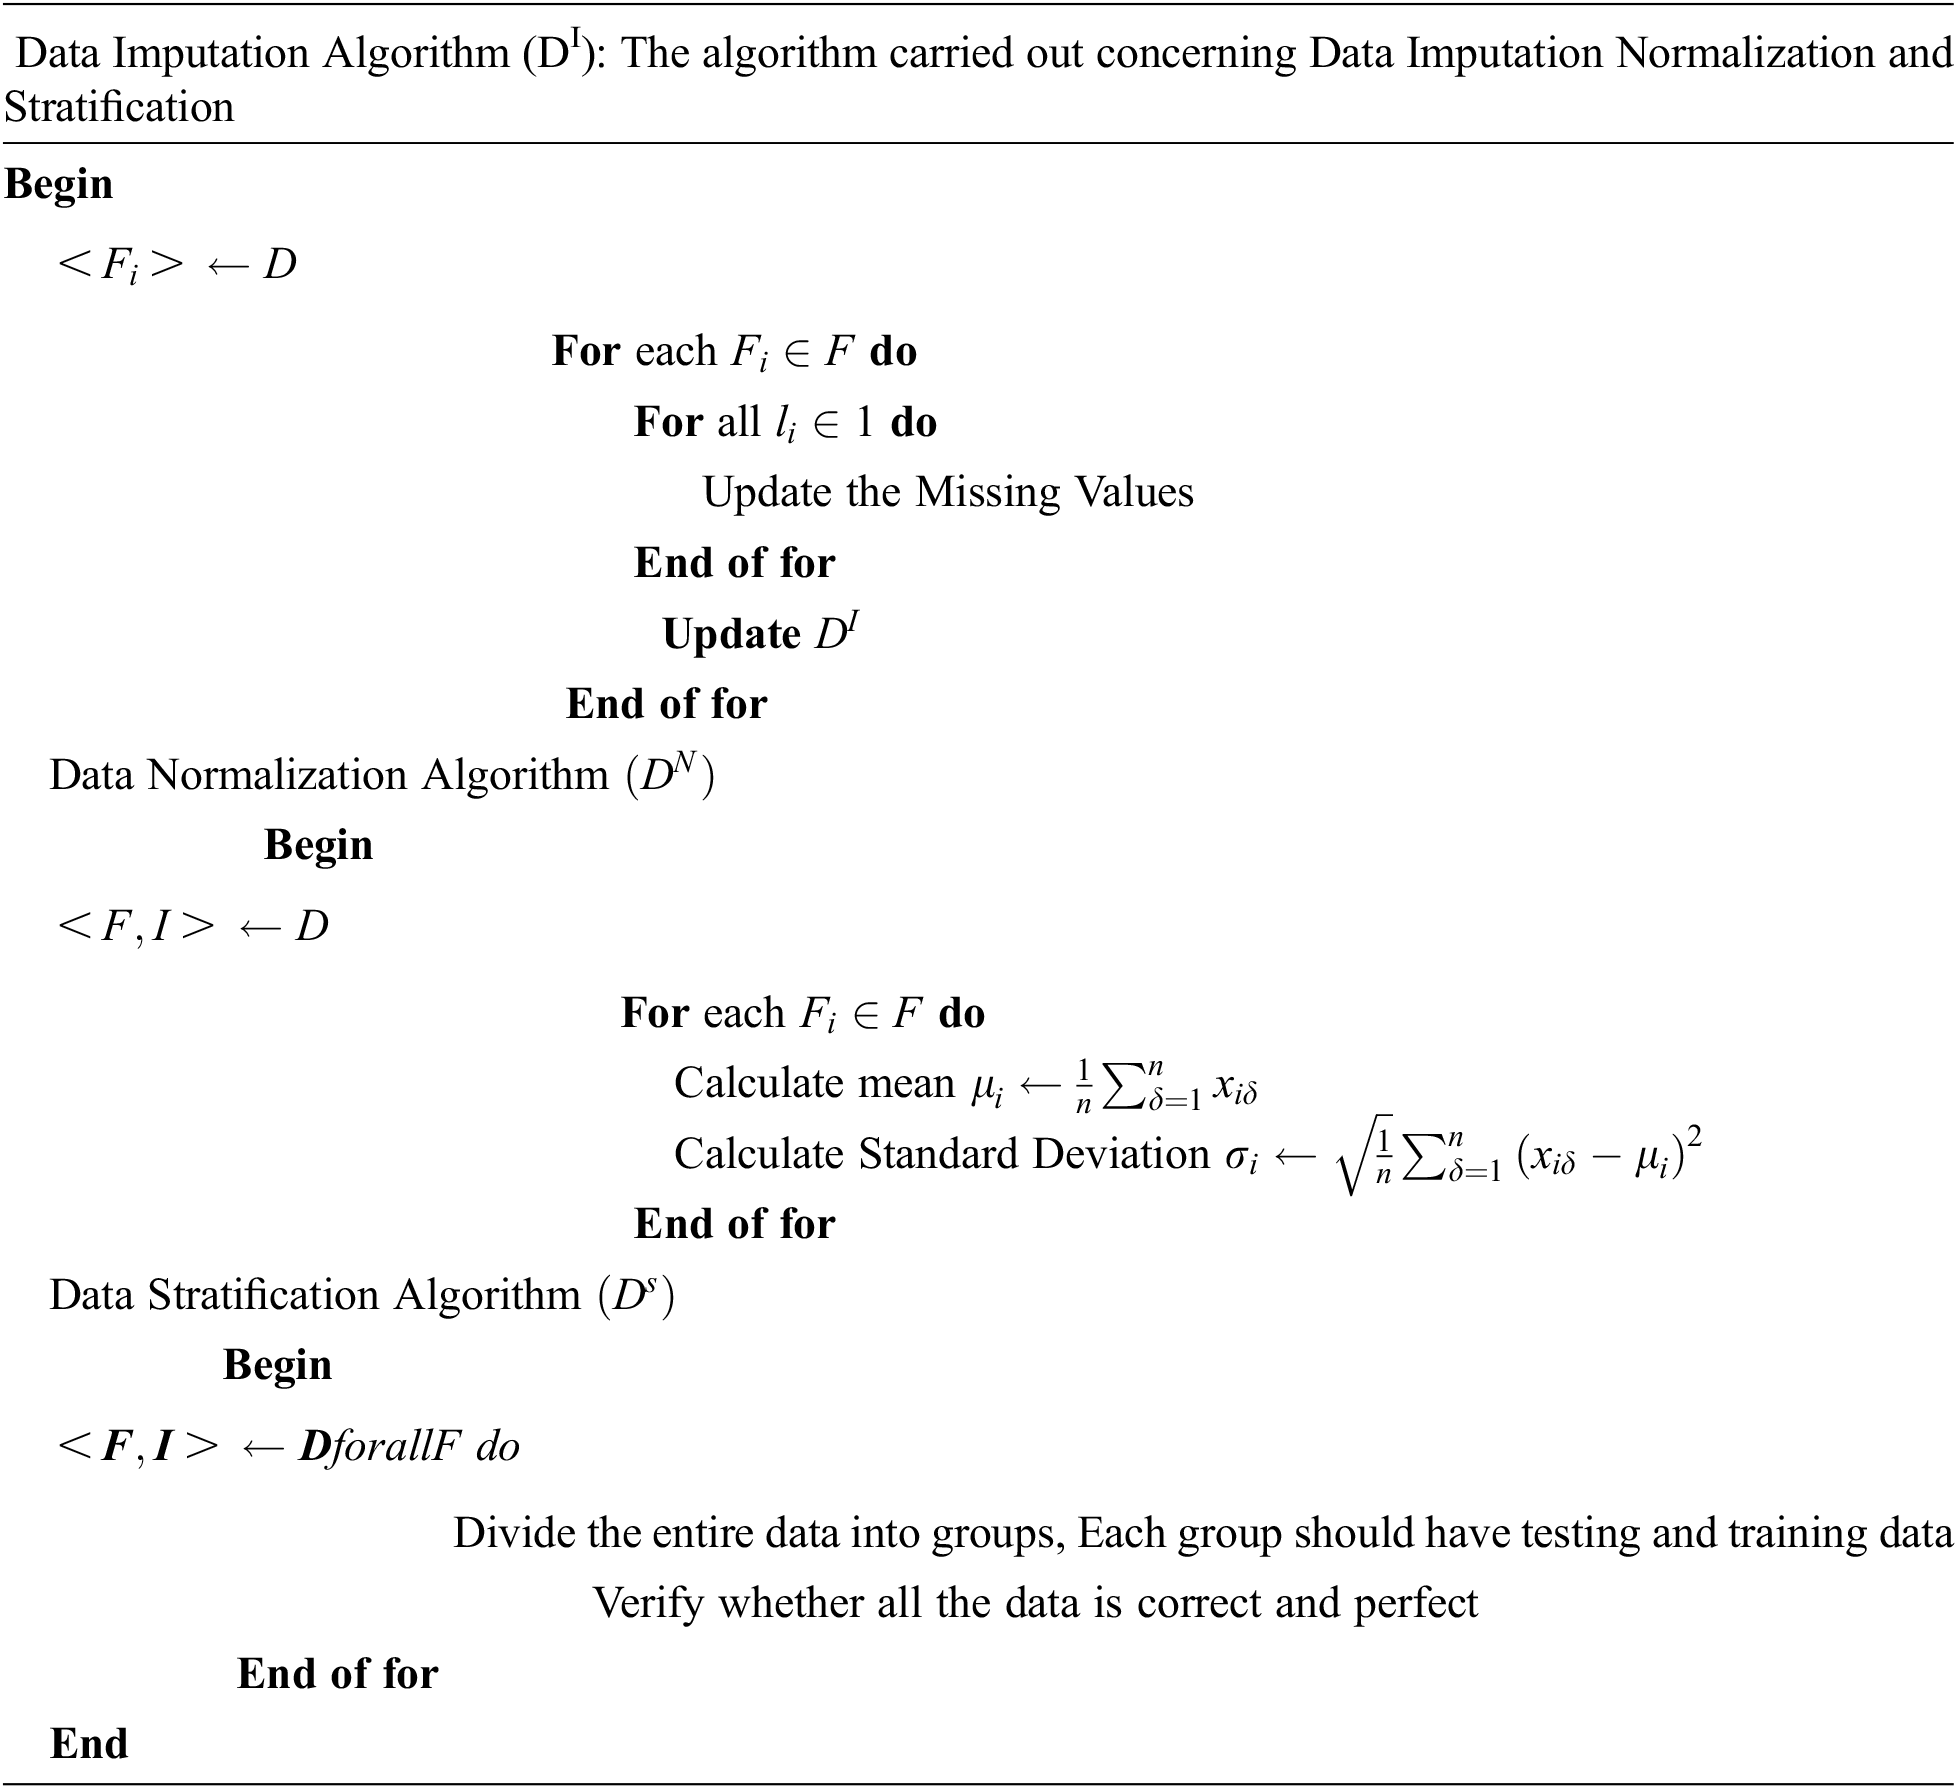
Data standardization: First, the input from the dataset is normalized, and then the data is normalized by the relevant criteria. Normalization of the data is accomplished via the use of the following Eq. (2).
Normalization is used to scale characteristics to get a better solution for the coefficients in the equation. After the data has been normalized, it is next standardized using an Eq. (3).
where z denotes the data that has been rescaled to be harmonized with σ = 1 and μ = 0.
Data stratification: The huge, collected data is divided into smaller parts, and the smaller parts should be perfect.
5 Description of Classification Algorithms Used
The following algorithms are used in the proposed methods
Linear Regression (LR): It is a statistical concept; it is helpful to model a relationship between a dependent and independent variable, as shown in Eq. (4). The concept was one of the most popular research and application concepts during the middle of the 20th century. Matrix illustration is presented in Eqs. (5) and (6)
where
Neural Networks (NN): They are referred to as the model of neurons present in the brain. To break up extremely complex relationships among the existing environment effectively with the help of artificial intelligence, which can effectively run using activation functions, and weight functions with the required number of layers [31], as shown in Fig. 5 with various layers associated with classification model.
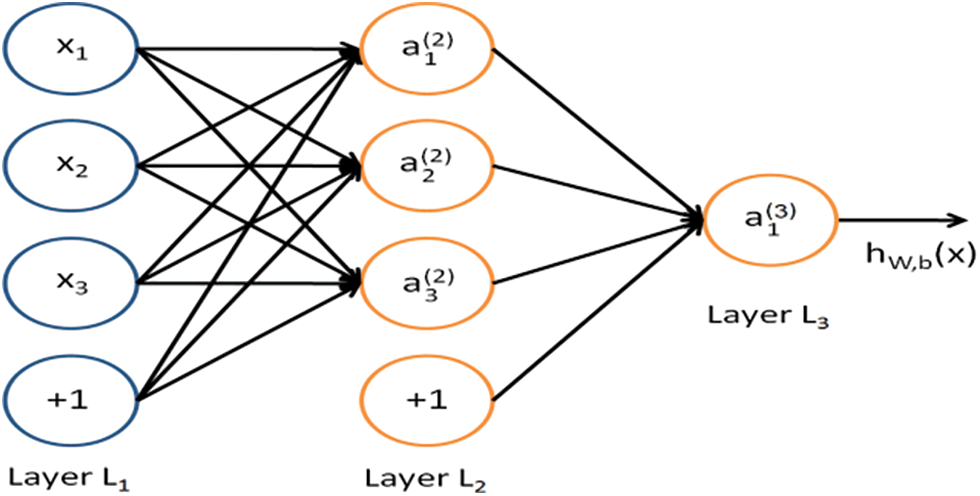
Figure 5: Showing a model representation of a neural network
Random Forest (RF): They are also called random decision forests. They act as learning technique ensembles, which are helpful in regression, classification, and different assignments to develop many decision trees during the training time. They are exact solutions to decision trees. Here the inclusion of an additional layer helps get increased values in predictions [32]. Standard deviations and regression are shown in Eqs. (7) and (8).
Decision Tree (DT): The special case of supervised learning algorithms is considered. Along with supervised learning algorithms, it is also helpful for solving problems, including classification and regression issues. Training models also be framed to predict class and estimate the objective factors, which are being derived from the previous data. The process for computing the mean square error is shown in Eq. (9), where the number of examples inputs y, the forecast value of
Support Vector Machine: SVM trains problems linked to described issues. It is utilized for classification (categorizing) issues. Functions associated with SVM are used to solve service problems involving people, and as a result, they can understand both linear and non-linear challenges. A linear separable hyperplane is used in the SVM classifier to provide adequate separation to distinguish between two classes. The SVM classifier is defined as shown in Eq. (10).
where
K-Nearest Neighbour: KNN is a simple occasional-based fundamental classification algorithm. Its usage was started in the 1970s for statistically estimating and recognizing patterns. Here K is considered the limitation for adjusting the classification algorithms [19]. We use a Euclidian metrics system as seen in the following Eq. (12).
Gradient Boosting (GB): Gradient Boosting is used for the development of prediction of models which are not strong by utilizing both classification and regression. Here use the gradient function for the reduction of risk. The objective function GB is shown in Eqs. (13) and (14)
Gaussian Naive Bayes (GNB): Gaussian Nave Bayes is a development of the original nave Bayes model. It is required only to go with standard deviation and mean in our training data, so this classifier is easy to compare with the other state-of-art models. The objective function of GNB is presented in Eqs. (15) and (16)
Concerning the target class,
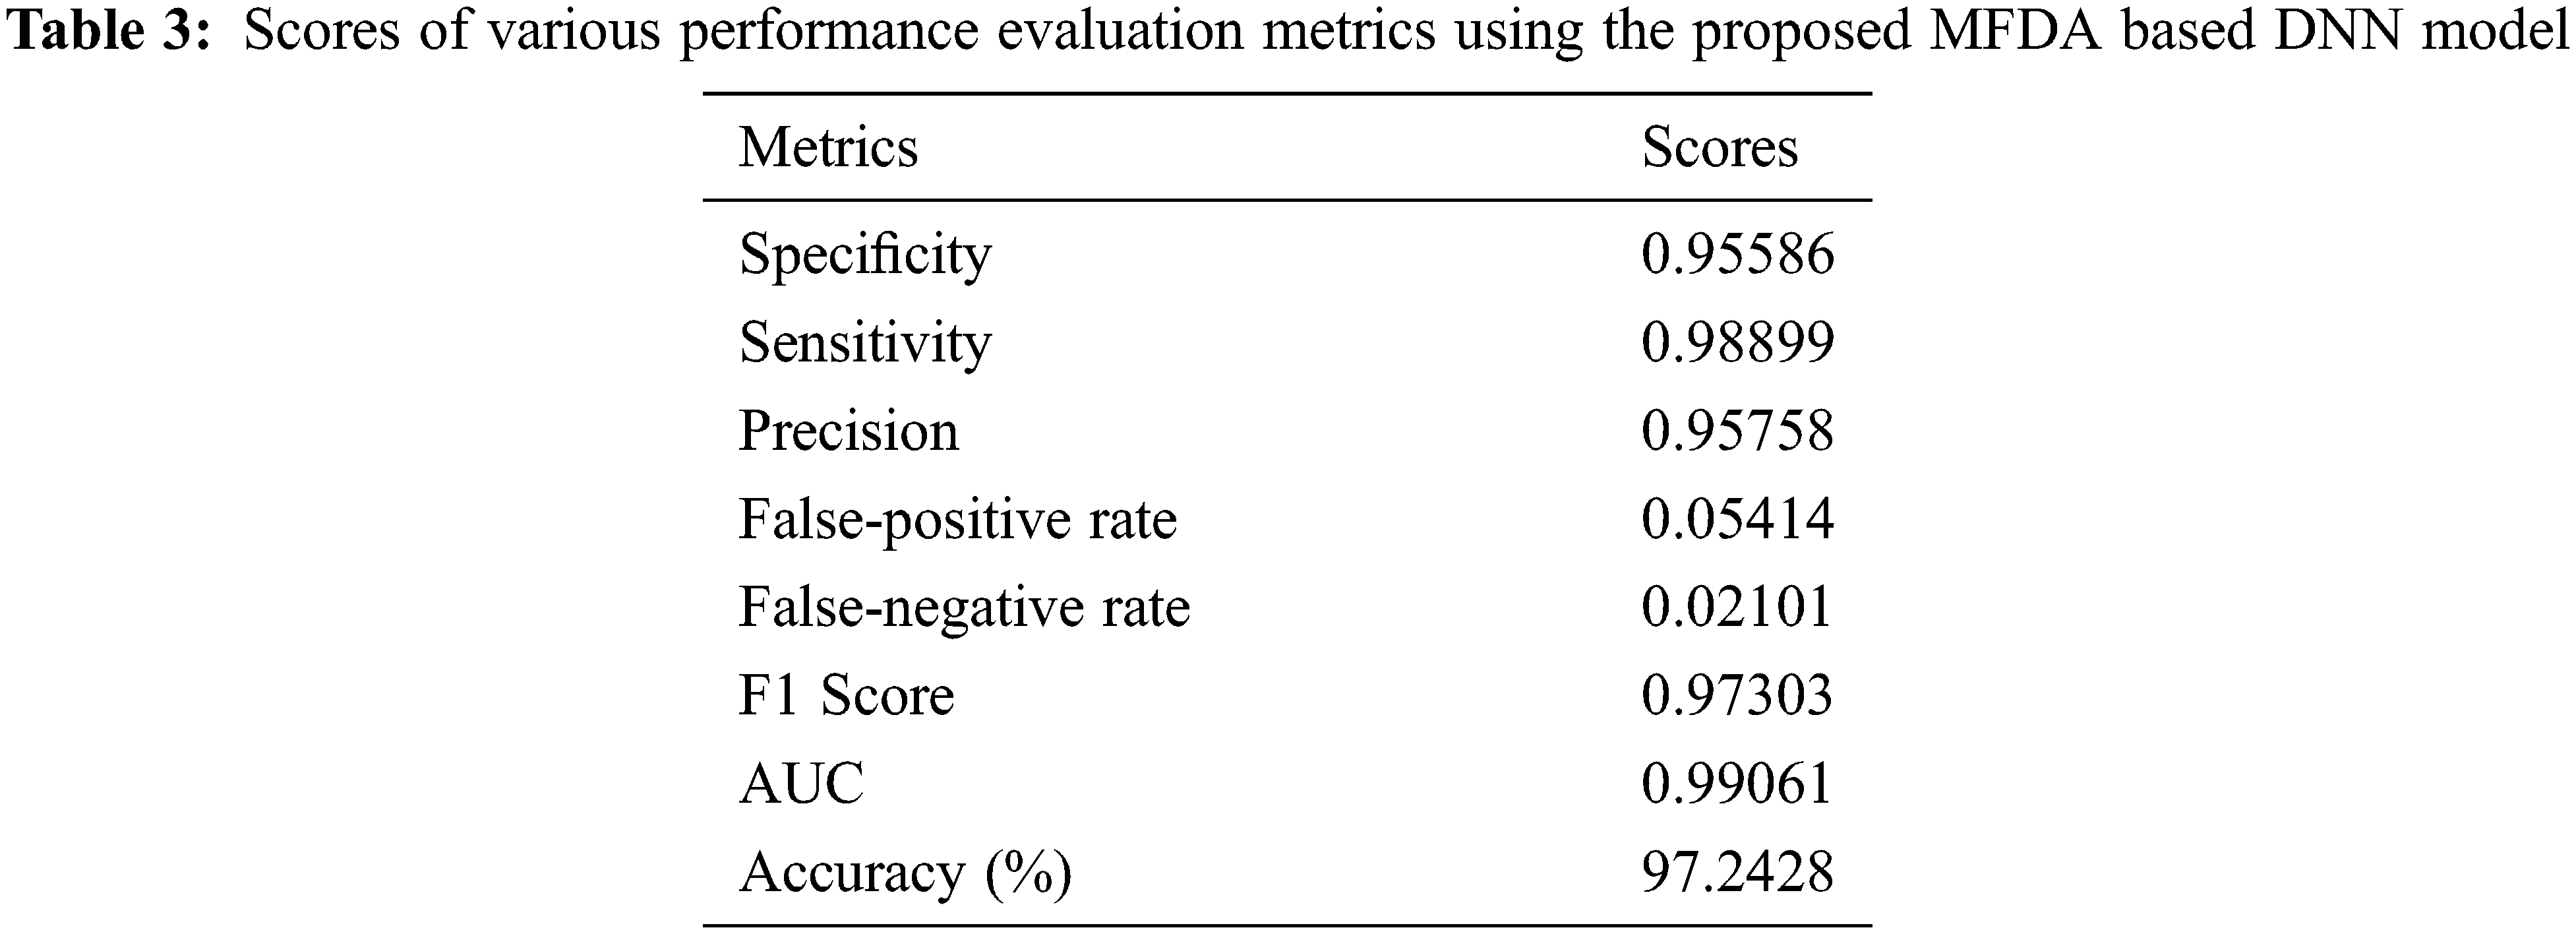
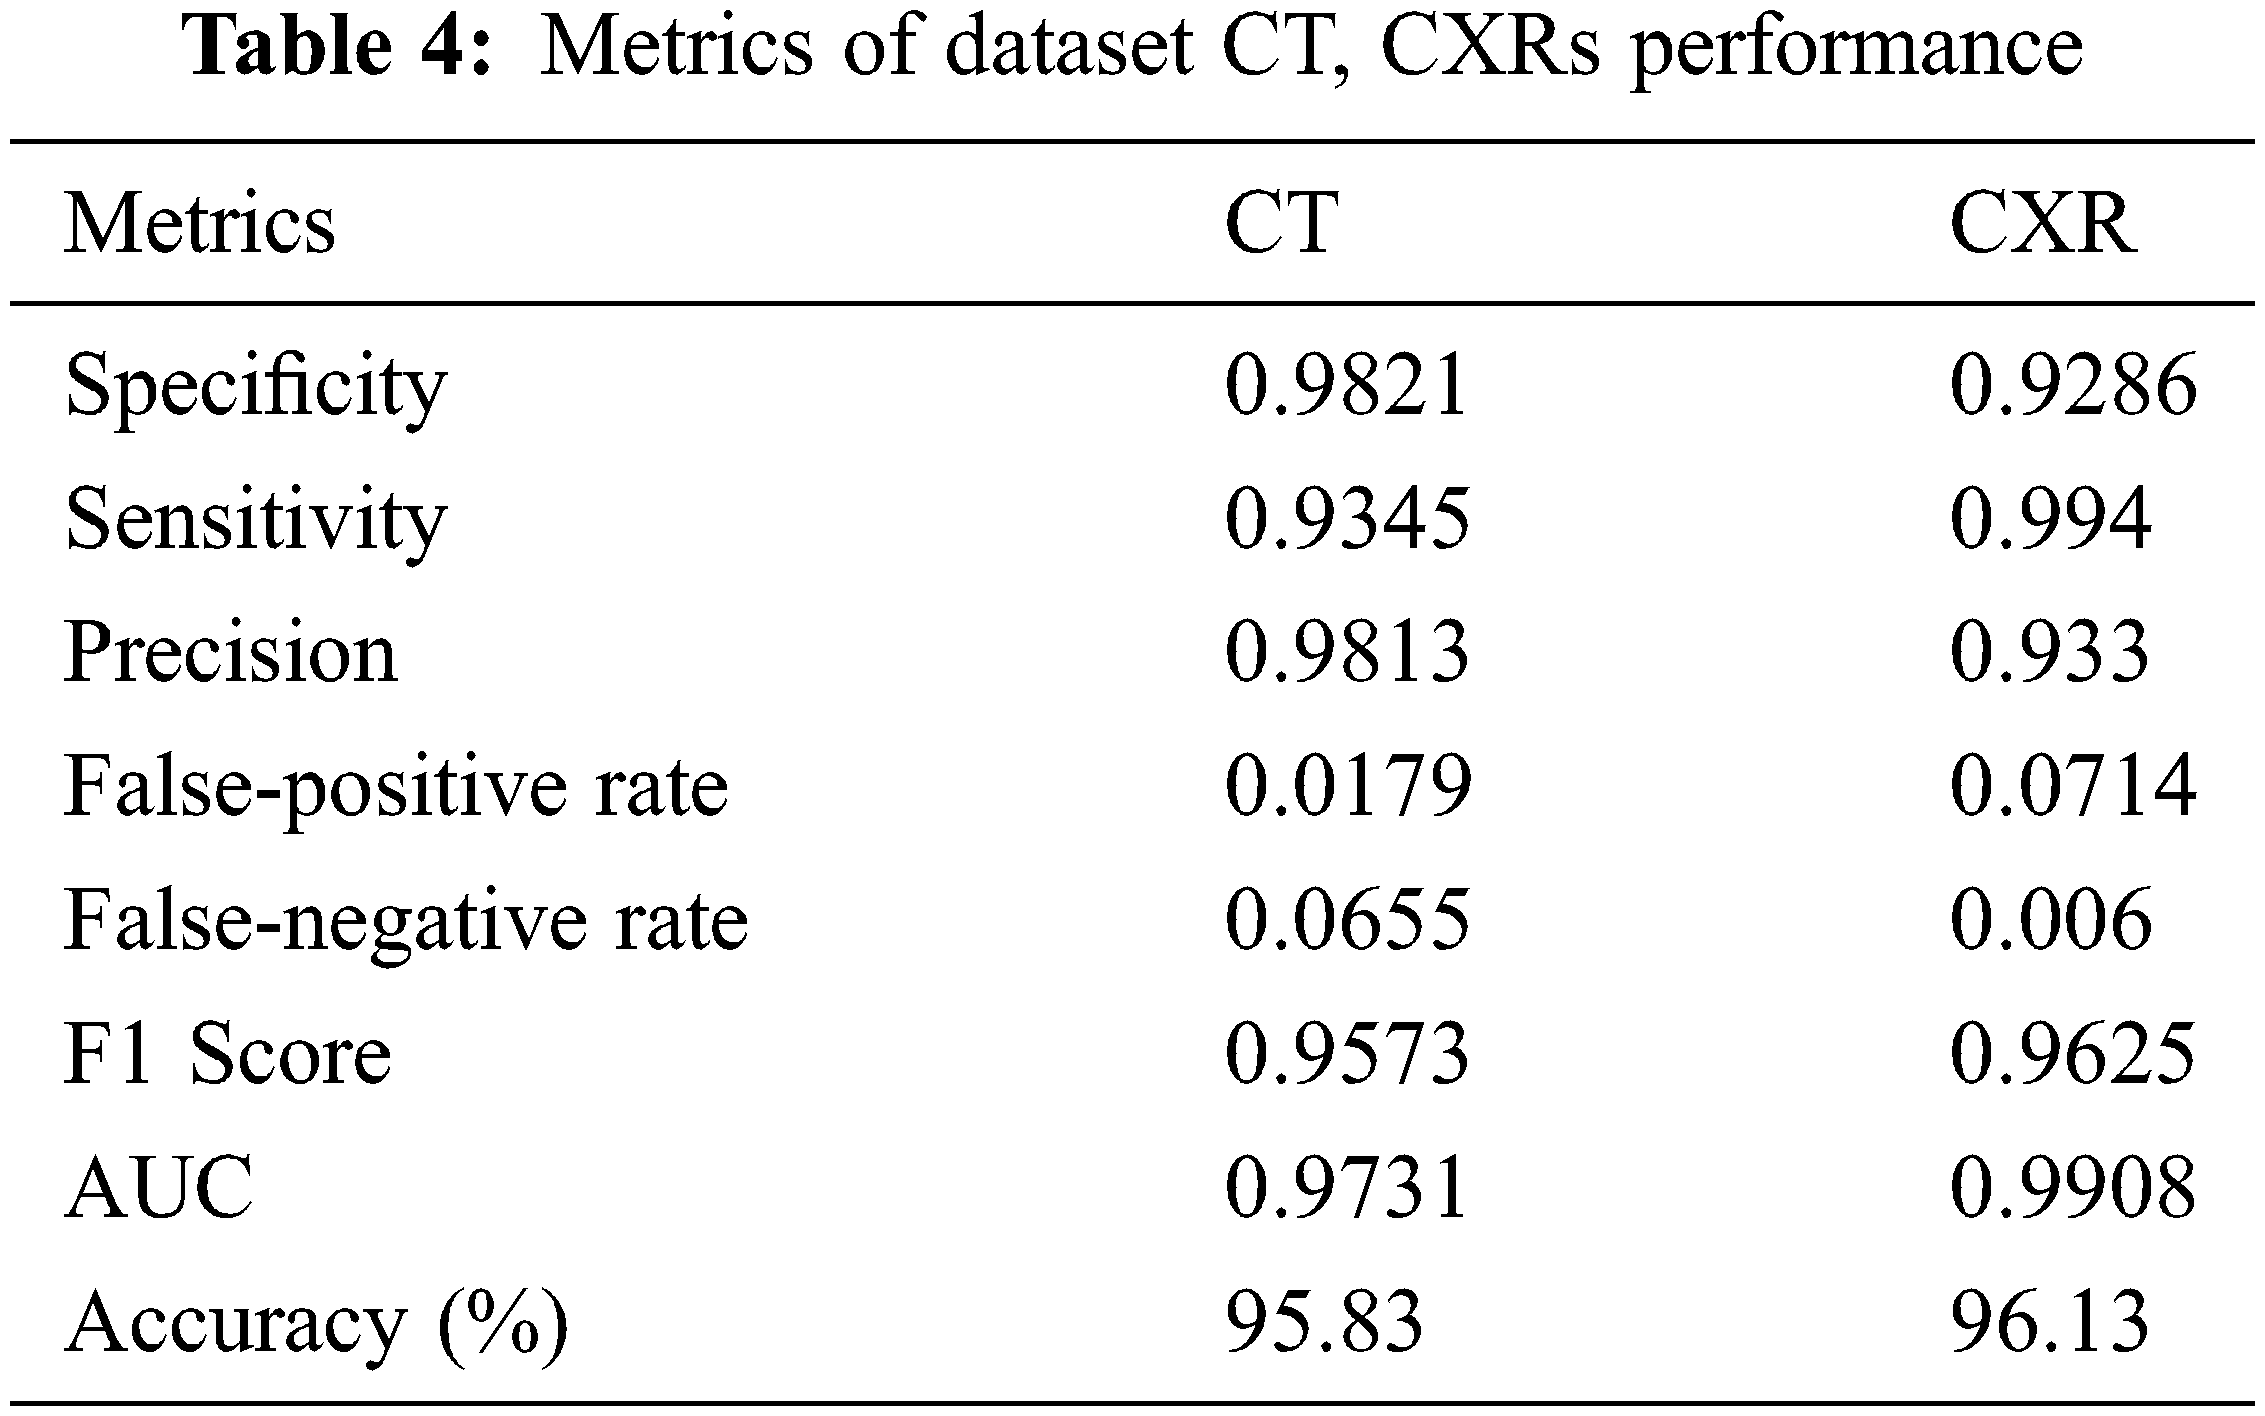
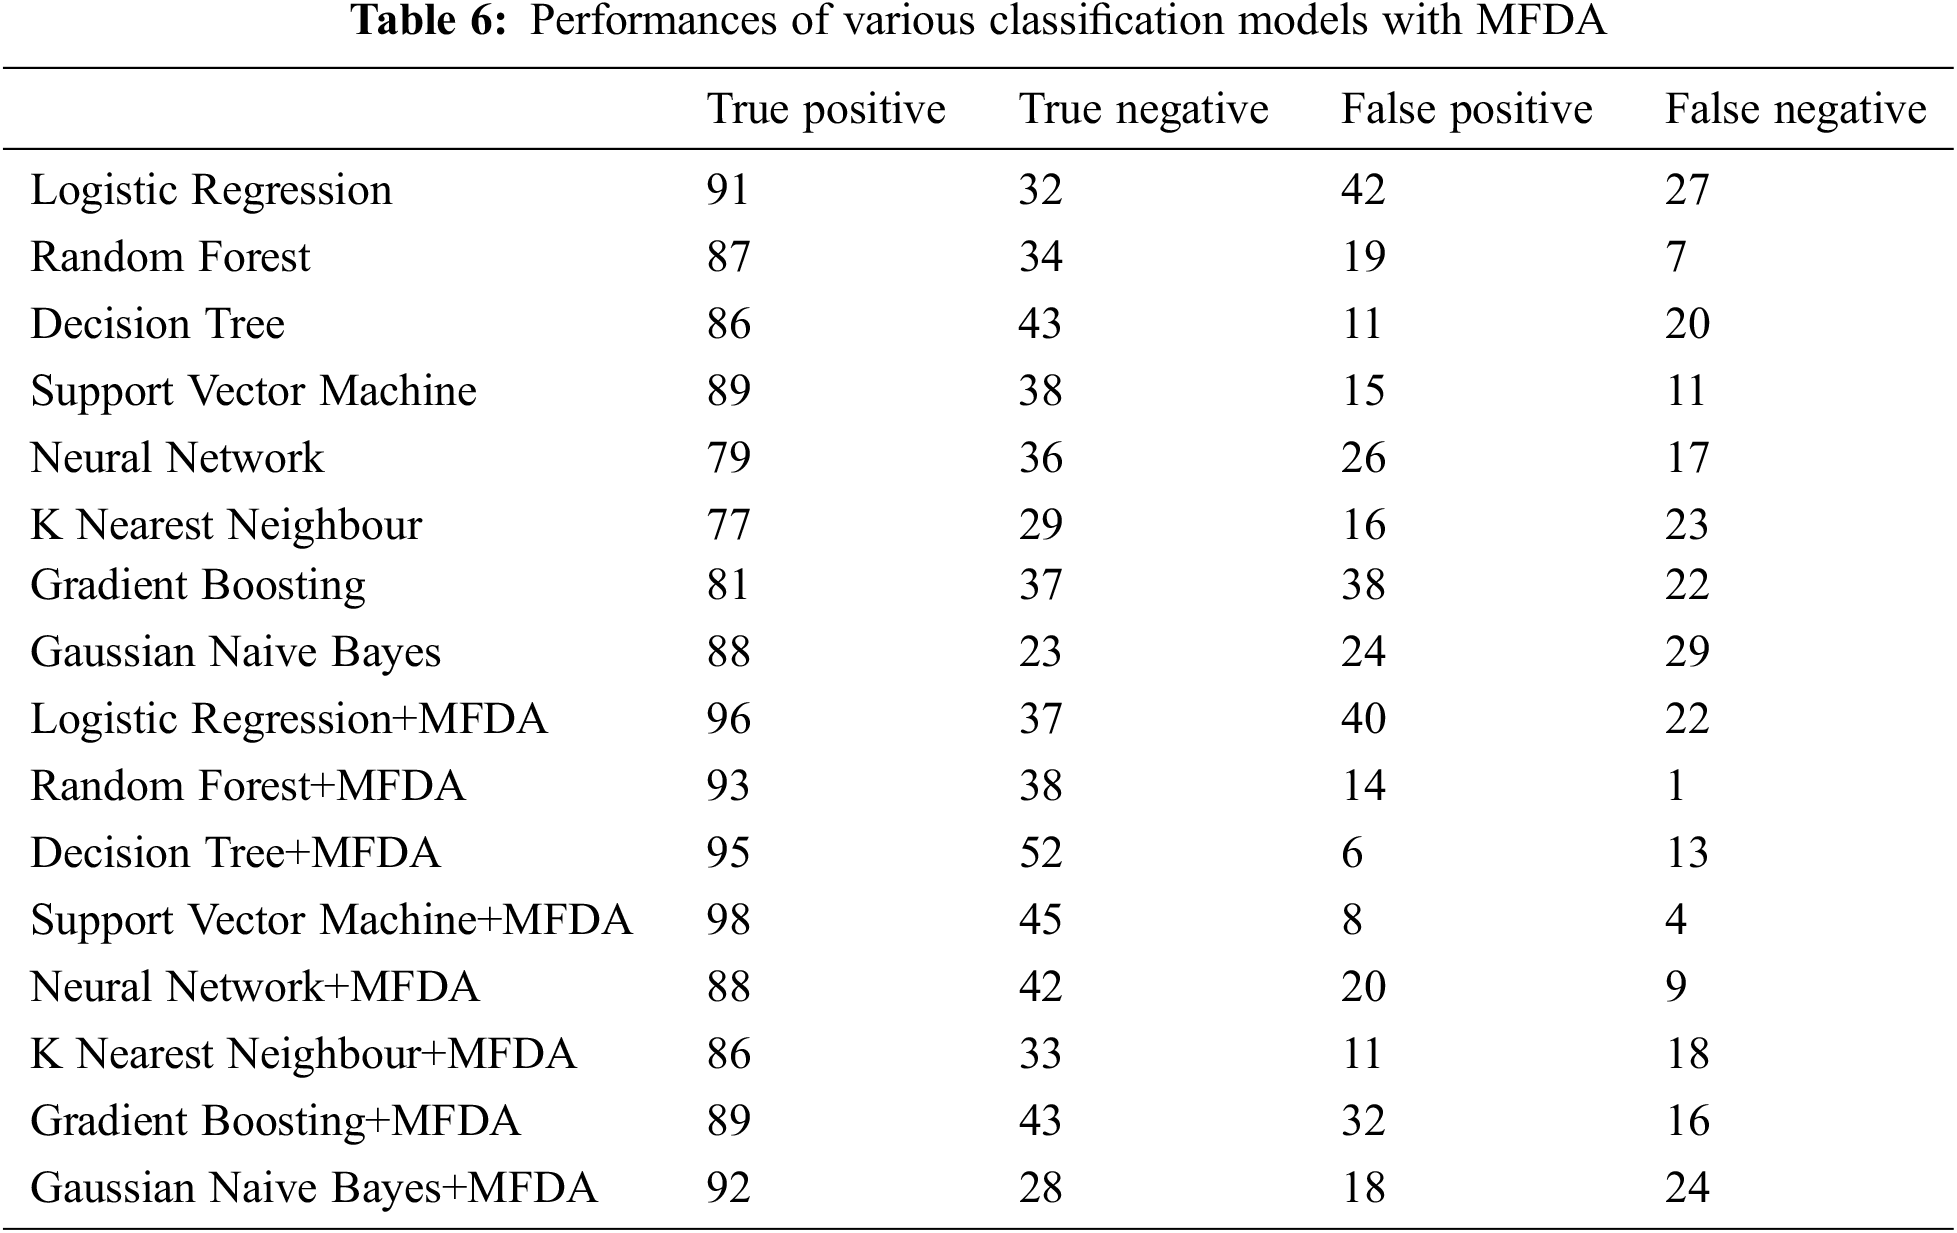
A total of 100 training epochs were used in the process of training the suggested DNN model, with images being scaled to 50 * 50 pixels. Fifty instances were utilized in each batch, with 50 instances used. Because they differ from one dataset to another, it is necessary to adjust these values. Alternatively, to put it another way, they rely on the software program. Training with the proper settings is essential for achieving peak performance. We calculated accuracy on various picture sizes, batch sizes, and training epochs to make the study evidence, and the values are presented in Tab. 2. The prediction performance of the proposed MFDA-based DNN model over the CT scan images and the Chest X-ray (CXR) is presented in Tab. 3. The confusion matrix helps determine the extent of the ML method and its capacity to do accurate classification, among other things. True Positive, True Negative, False Positive, and False are the fundamental components supplied by the confusion matrix. The confusion matrix is used to calculate the accuracy, sensitivity, specificity, Precision, F1 Score, False-positive rate, False-negative rate and AUC. Tab. 6 presents the obtained values of various classification models on experimentation.
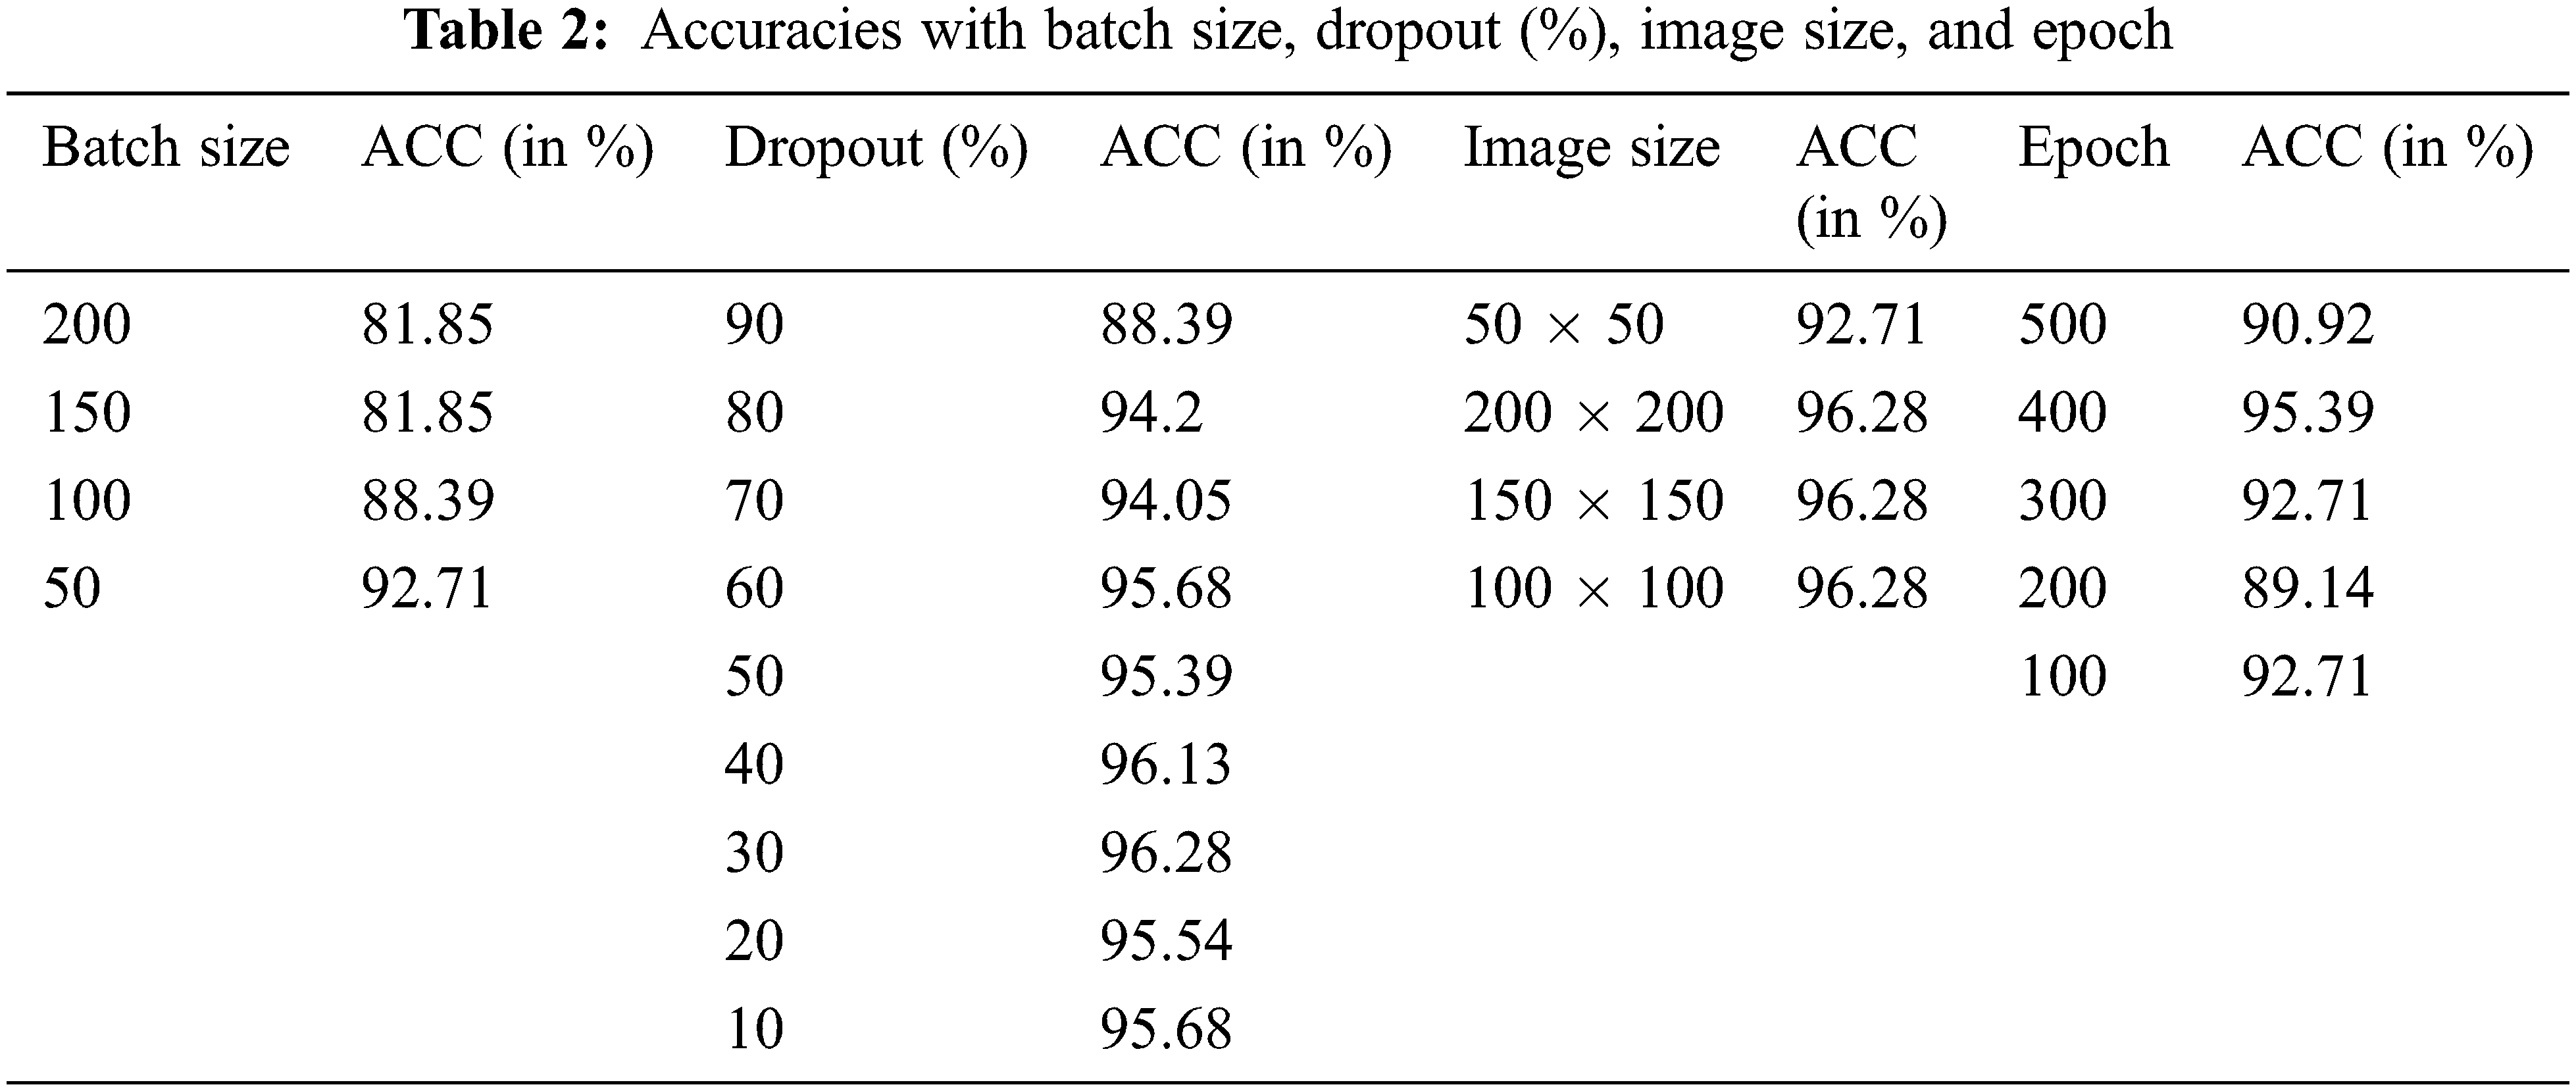
Since raw picture sizes fluctuated throughout our data collection, we scaled them into fixed dimensions after they were collected. The study varied the resized sizes from 50 * 50 to 200 * 200, with each size variation being separated by a 50-pixel step between them. The primary goal of testing with different picture sizes is to determine whether or not we can approximate the dimension of the image for the rest of the experiment by experimenting with different picture sizes. Using a mixed dataset, we may show the results we have gathered thus far. Our findings showed that the best outcomes were obtained when the dimensions were 100 * 100 and that the results remained constant when the dimensions were raised further because a more minor image size results in a higher processing cost. The 100 * 100-pixel picture size was selected.
The number of batches: Batch sizes during training were similarly changed. Each step of 50 increased the number of occurrences from 50 to 200, with the resultant findings shown in the previous Tab. 2. When the batch size was raised, even more, we found that the performance gains were no longer statistically significant. The opposite was found, with a gradual but steady deterioration in performance. Fig. 6 presents the training loss of the model over the iterations.
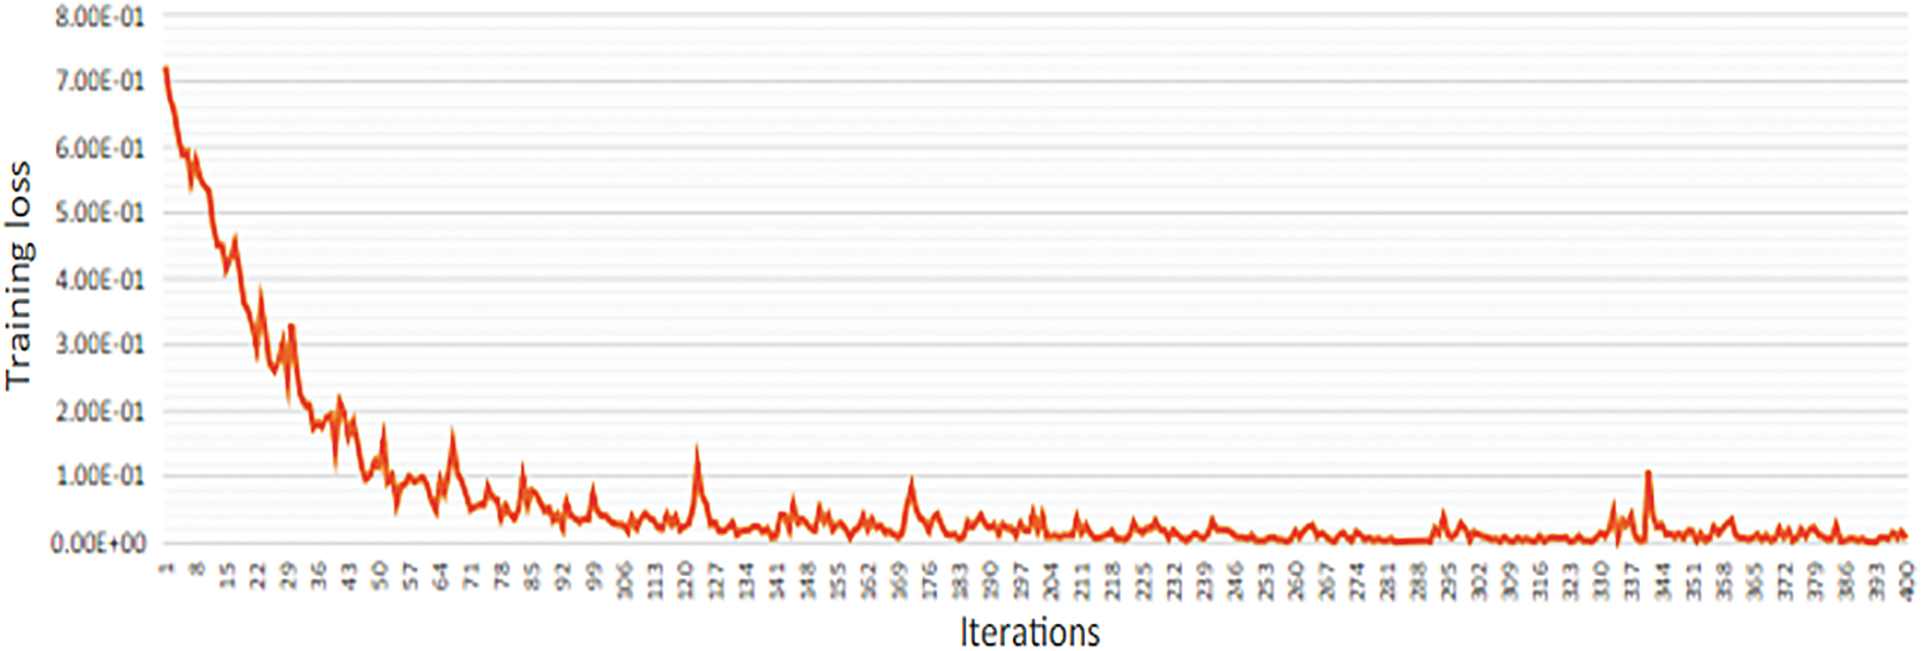
Figure 6: Training loss for the proposed architecture
The training iterations were changed from 100 to 500 trials, with each Epoch being multiplied by 100 to get the desired result. The accuracy values that were achieved are shown in the tables above. The best result was obtained when 400 training epochs were completed.
In the end, the proportion of Dropouts changed from 10 to 90 percent. The corresponding results are shown in the preceding result. We identified that the most superior results are obtained from participants who dropped out at 30 percent in this test. When the Dropout percentage was raised to 60%, it was discovered that the performance decreased. When the accuracy is 90 percent, the accuracy drops by about 8.19 percent, which is significant. The inter-class confusion for the configuration with a 30 percent dropout rate is shown in the preceding Tabular. The ROC curves associated with the model are presented in Figs. (7) and (8).
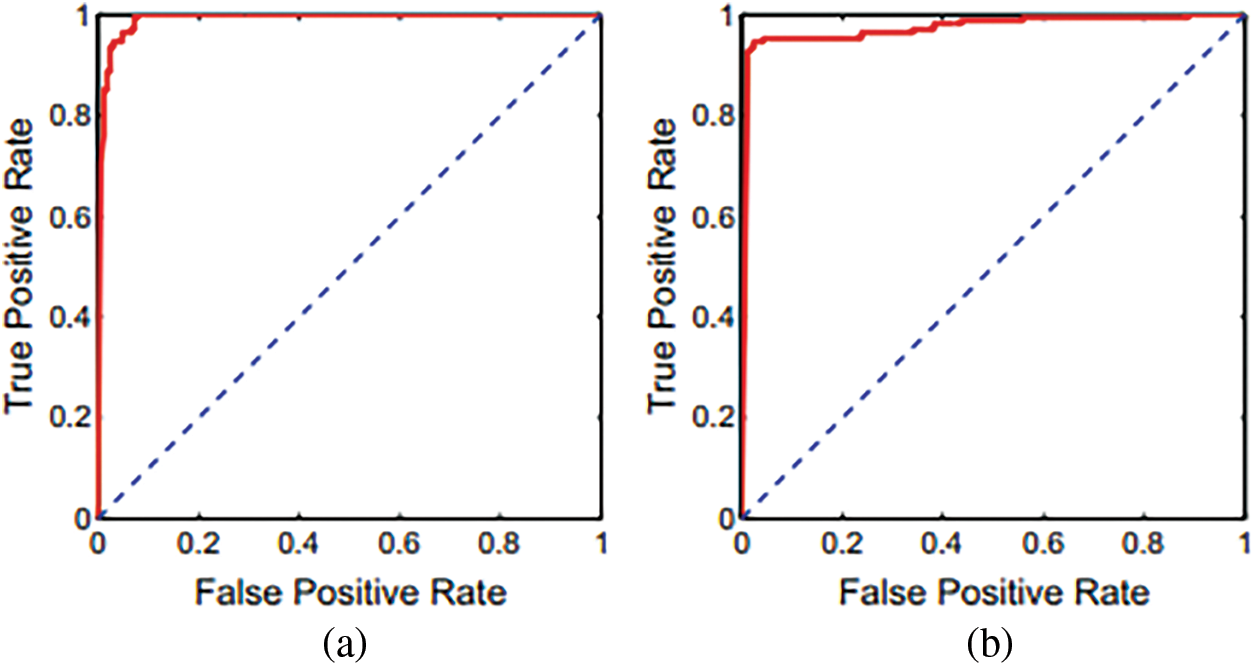
Figure 7: Using the proposed methodology, ROC curves CXRs and CT scans
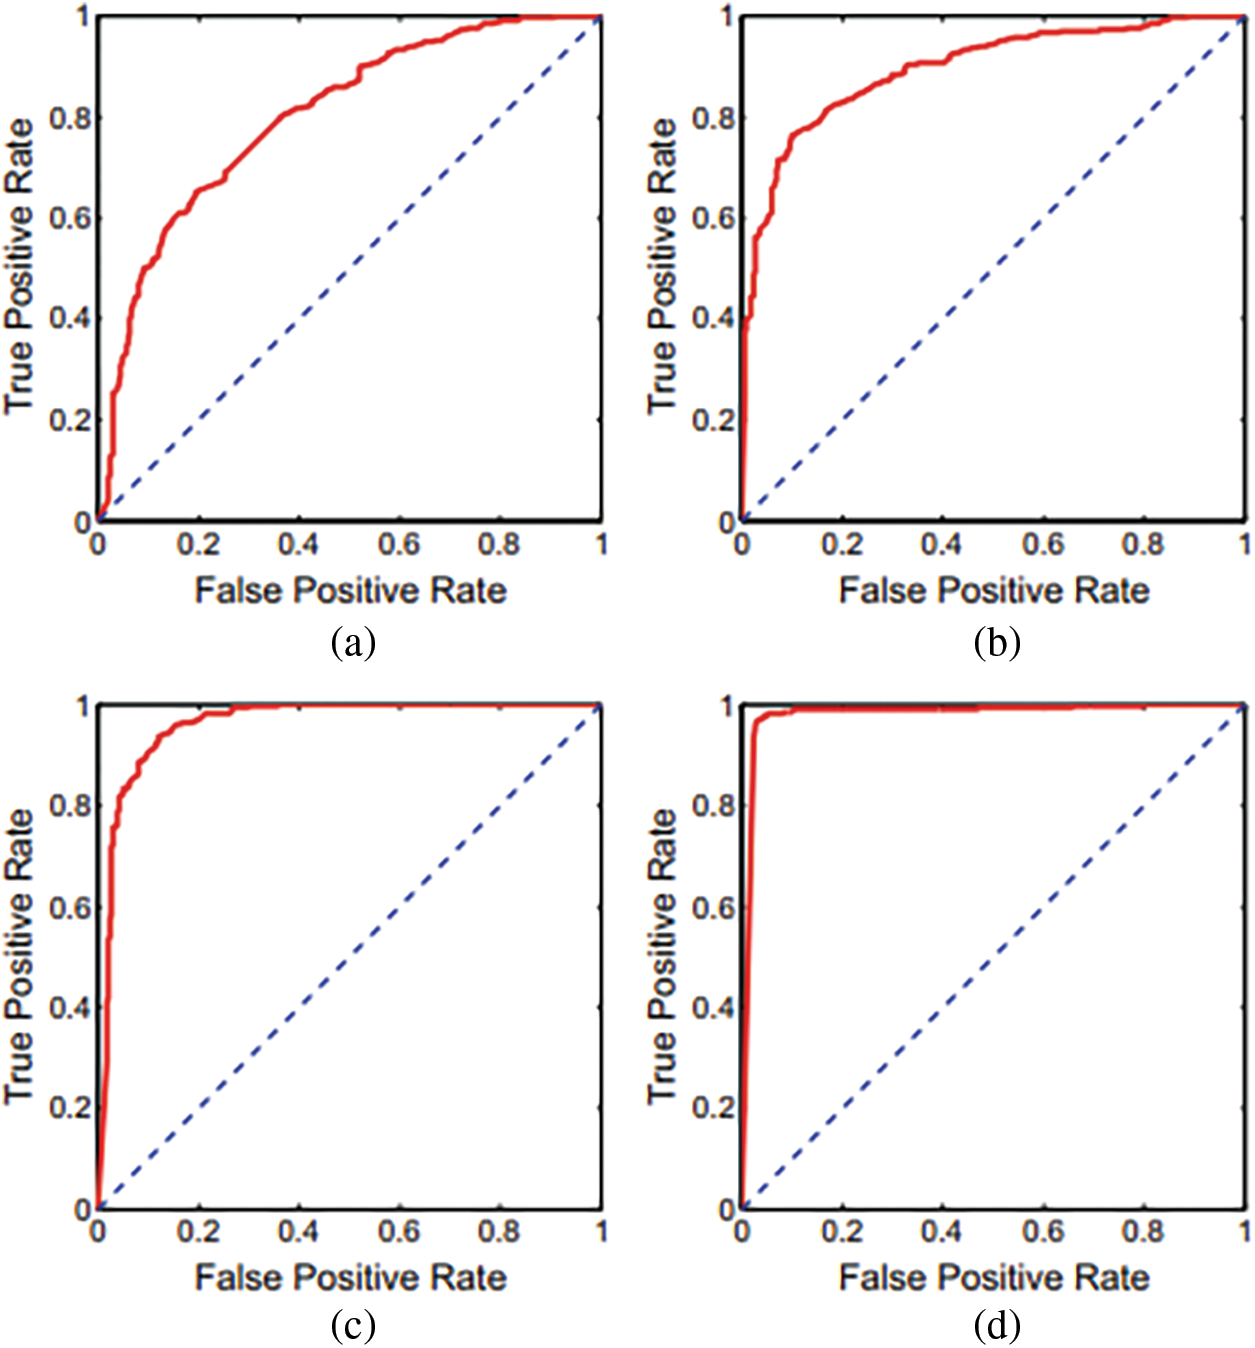
Figure 8: ROC curves inceptionV3, MobileNet, ResNet, proposed DNN
Based on a ten-fold cross-validation procedure and independently utilizing CT and CXR scans, calculated presentation ratings for all assessment measures, as shown in Tab. 4. The table has distinct findings and confusion matrices for each kind of data presented. Fig. 1 depicts different ROC curves for easier comprehension. It is observed that a single DNN could be used to train and test with these extra tests, even though we did not detect any notable interventions from anyone’s data category. It is possible to verify the assertion by examining two distinct experimental findings shown in the preceding Tab. 5 over the models like Support Vector Regression (SVR), DNN, Long Short Term Memory LSTM) and Precision-Recall Curves (PRC).
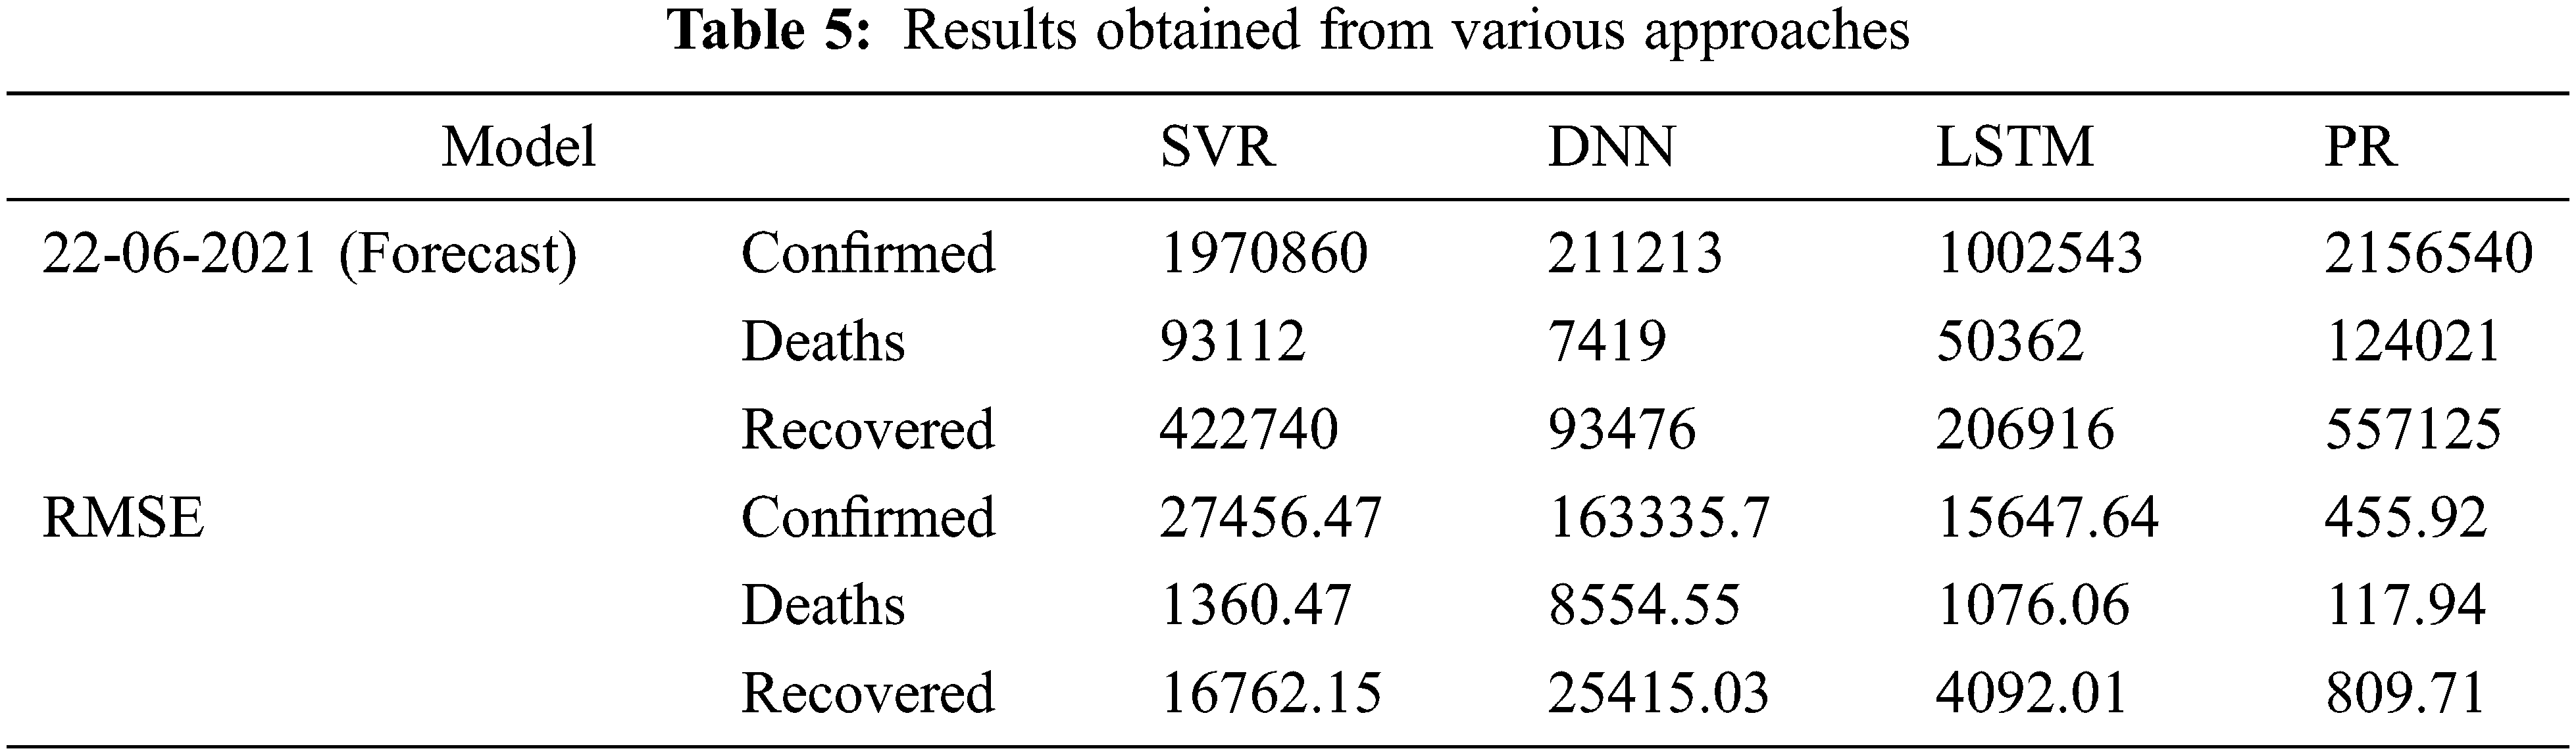
The described deep learning and machine learning methods generate a potential number of instances over the following ten days all over the globe, based on the data they have collected. Utilizing data from all around the world, as demonstrated in Fig. 7, shows the predicted trend of the COVID-19 using DNN, LSTM, PRC, and SVR using data from all over the world. The Root Mean Square Error (RMSE) scores of the techniques were computed concerning the number of COVID-19 instances that were accessible, as shown in Tab. 1. Also found is that the time needed to train the LSTM model is strongly dependent on the variation in values, with the more significant the departure from zero requiring more time to train than the minor variance requiring less time. For example, a min-max scaler is used to construct an LSTM model. Then the predicted cases were decreased by using an invert min-max transform from the Sk-learn python library to recover the original range of possibilities. When comparing the two approaches, the PR strategy is the only one that can be relied on to follow the rising trend, as shown by the visual representation of the forecast in the Figure and the RMSE score, which are highlighted in the table above.
It can be observed from Tab. 6, that the performance of the classification models has been tremendously improved with the MFDA technique. The proposed DNN model has outperformed all the conventional classification models.
While various methods are available for identifying and forecasting collateral damage and the impacts of these pandemics, there is still a need to achieve high accuracy in these applications. Obtaining high precision for the required values will aid in implementing preventative actions. However, at the same time, they are beneficial in lowering people’s mortality rates. It is observed from the experimental outcomes the performances of various classification models have tremendously improved with MFDA. However, the incorporation of MFDA needs little additional computational effort but has exhibited better performance. But the proposed models are just limited to disease detection. There is demand for a model that would assist in predicting the future illness, and guiding the individual towards better standards of life is highly desired. The proposed models work effectively with the structured, and it is desired to have a model that can equally perform with unstructured data. MFDA with self-learning models [33] would assist in dealing with the new disease more effectively.
Acknowledgement: The authors acknowledges the Deanship of Scientific Research, Vice Presidency for Graduate Studies and Scientific Research, King Faisal University, Saudi Arabia under Grant No. 324.
Funding Statement: This work was supported by the Deanship of Scientific Research, Vice Presidency for Graduate Studies and Scientific Research, King Faisal University, Saudi Arabia (Project no. GRANT 324).
Conflicts of Interest: The authors declare that they have no conflicts of interest to report regarding the present study.
References
1. F. Song, N. Shi, F. Shan, Z. Zhang, J. Shen et al., “Emerging 2019 novel coronavirus (2019-ncov) pneumonia,” Radiology, vol. 295, no. 1, pp. 210–217, 2020. [Google Scholar]
2. S. Ahmed and A. Alhumam, “Analyzing the implications of COVID-19 pandemic: Saudi Arabian perspective,” Intelligent Automation & Soft Computing, vol. 27, no. 3, pp. 835–851, 2021. [Google Scholar]
3. J. T. Wu, K. Leung and G. M. Leung, “Nowcasting and forecasting the potential domestic and international spread of the 2019-ncov outbreak originating in Wuhan, China: A modeling study,” Lancet, vol. 395, no. 10225, pp. 689–697, 2020. [Google Scholar]
4. H. Shi, X. Han, N. Jiang, Y. Cao, O. Alwalid et al., “Radiological findings from 81 patients with covid-19 pneumonia in Wuhan, China: A descriptive study,” Lancet Infectious Diseases, vol. 20, no. 4, pp. 425–434, 2020. [Google Scholar]
5. X. R. Zhang, J. Zhou, W. Sun and S. K. Jha, “A lightweight CNN based on transfer learning for COVID-19 diagnosis,” Computers, Materials & Continua, vol. 72, no. 1, pp. 1123–1137, 2022. [Google Scholar]
6. Z. Xu, L. Shi, Y. Wang, J. Zhang, L. Huang et al., “Pathological findings of covid-19 associated with acute respiratory distress syndrome,” Lancet Respiratory Medicine, vol. 8, no. 4, pp. 420–422, 2020. [Google Scholar]
7. X. R. Zhang, X. Sun, W. Sun, T. Xu and P. P. Wang, “Deformation expression of soft tissue based on BP neural network,” Intelligent Automation and Soft Computing, vol. 32, no. 2, pp. 1041–1053, 2022. [Google Scholar]
8. J. P. Kanne, “Chest CT findings in 2019 novel coronavirus (2019-ncov) infections from Wuhan, China: Key points for the radiologist,” Radiology, vol. 295, no. 200241, pp. 16–17, 2020. [Google Scholar]
9. L. Gaur, U. Bhatia, N. Z. Jhanjhi, G. Muhammad and M. Masud, “Medical image- based detection of COVID-19 using deep convolution neural networks,” Multimedia Systems, vol. 113, no. 11, pp. 1–10, 2021. [Google Scholar]
10. S. Saeed, N. Z. Jhanjhi, M. Naqvi, M. Humayun and V. Ponnusamy, “Quantitative analysis of COVID-19 patients: A preliminary statistical result of deep learning artificial intelligence framework,” In ICT Solutions for Improving Smart Communities in Asia, IGI Global, pp. 218–242, 2021. [Google Scholar]
11. Y. Li and L. Xia, “Coronavirus disease 2019 (covid-19Role of chest CT in diagnosis and management,” American Journal of Roentgenology, vol. 214, no. 6, pp. 1–7, 2020. [Google Scholar]
12. S. P. Naga, T. Rao, A. M. Dicu, C. Mnerie and I. Olariu, “A comparative review of optimisation techniques in segmentation of brain MR images,” Journal of Intelligent and Fuzzy Systems, vol. 38, no. 5, pp. 1–12, 2020. [Google Scholar]
13. P. Guleria, S. Ahmed, A. Alhumam and P. N. Srinivasu, “Empirical study on classifiers for earlier prediction of COVID-19 infection cure and death rate in the Indian States,” Healthcare, vol. 10, no. 1, pp. 1–32, 2022. [Google Scholar]
14. Y. Fang, H. Zhang, J. Xie, M. Lin, L. Ying et al., “Sensitivity of chest CT for covid-19: Comparison to RT-PCR,” Radiology, vol. 296, no. 2, pp. 1–3, 2020. [Google Scholar]
15. P. S. Naga, T. S. Rao, G. Srinivas and P. V. G. D. P. Reddy, “A computationally efficient skull scraping approach for brain MR image,” Recent Advances in Computer Science and Communications, vol. 13, no. 5, pp. 833–844, 2020. [Google Scholar]
16. J. Chen, L. Wu, J. Zhang, L. Zhang, D. Gong et al., “Deep learning-based model for detecting 2019 novel coronavirus pneumonia on high-resolution computed tomography: A prospective study,” Scientific Reports, vol. 10, no. 19196, pp. 1–11, 2020. [Google Scholar]
17. B. Ghoshal and A. Tucker, “Estimating uncertainty and interpretability in deep learning for coronavirus (COVID-19) detection,” arXiv, pp. 1–14, 2020. [Google Scholar]
18. J. Guiot, A. Vaidyanathan, L. Deprez, F. Zerka, D. Danthine et al., “Development and validation of an automated radiomic CT signature for detecting COVID-19,” Diagnostics, vol. 11, no. 1:41, pp. 1–15, 2021. [Google Scholar]
19. C. Jin, W. Cheny, Y. Cao, Z. Xu, X. Zhang et al., “Development and evaluation of an AI system for COVID-19 diagnosis,” Nature Communications, vol. 11, no. 5088, pp. 1–14, 2020. [Google Scholar]
20. L. Li, L. Qin, Z. Xu, Y. Yin, X. Wang et al., “Artificial intelligence distinguishes COVID-19 from community acquired pneumonia on chest CT,” Radiology, vol. 296, no. 2, pp. 1–16, 2020. [Google Scholar]
21. A. Narin, C. Kaya and Z. Pamuk, “Automatic detection of coronavirus disease (COVID-19) using X-ray images and deep convolutional neural networks,” Pattern Analysis and Applications, vol. 24, no. 3, pp. 1207–1220, 2021. [Google Scholar]
22. F. Shi, L. Xia, F. Shan, D. Wu, Y. Wei et al., “Large-scale screening of COVID-19 from community acquired pneumonia using infection size-aware classification,” Physics in Medicine and Biology, vol. 66, no. 6, pp. 1–10, 2020. [Google Scholar]
23. Z. Tang, W. Zhao, X. Xie, Z. Zhong, F. Shi et al., “Severity assessment of COVID-2019 using quantitative features from chest CT images,” Physics in Medicine and Biology, vol. 66, no. 3, pp. 1–10, 2021. [Google Scholar]
24. S. Wang, B. Kang, J. Ma, X. Zeng, M. Xiao et al., “A deep learning algorithm using CT images to screen for Corona Virus Disease (COVID-19),” European Radiology, vol. 31, no. 8, pp. 6096–6104, 2021. [Google Scholar]
25. S. Jamil and M. Rahman, “A dual-stage vocabulary of features (VoF)-based technique for COVID-19 variant’s classification,” Applied Sciences, vol. 11, no. 24:11902, pp. 1–15, 2021. [Google Scholar]
26. L. Wang, Z. Q. Lin and A. Wong, “COVID-Net: A tailored deep convolutional neural network design for detection of COVID-19 cases from chest radiography images,” arXiv, pp. 1–12, 2020. [Google Scholar]
27. X. Xu, X. Jiang, C. Ma, P. Du, X. Li et al., “Deep learning system to screen Coronavirus disease 2019 pneumonia,” Engineering, vol. 6, no. 10, pp. 1122–1129, 2020. [Google Scholar]
28. Y. Song, S. Zheng, L. Li, X. Zhang, X. Zhang et al., “Deep learning enables accurate diagnosis of novel Coronavirus (COVID-19) with CT images,” IEEE/ACM Transactions on Computational Biology and Bioinformatics, vol. 18, no. 6, pp. 2775–2780, 2021. [Google Scholar]
29. J. Zhang, Y. Xie, Y. Li, C. Shen and Y. Xia, “COVID-19 screening on Chest X-ray images using deep learning based anomaly detection,” arXiv, pp. 1–12, 2020. [Google Scholar]
30. J. Zhang, L. Zhou, Y. Yang, W. Peng, W. Wang et al., “Therapeutic and triage strategies for 2019 novel coronavirus disease in fever clinics,” Lancet Respiratory Medicine, vol. 8, no. 3, pp. 1–2, 2020. [Google Scholar]
31. C. Zheng, X. Deng, Q. Fu, Q. Zhou, J. Feng et al., “Deep learning-based detection for COVID-19 from chest CT using weak label,” MedRxiv, vol. 395, no. 10223, pp. 497, 2020. [Google Scholar]
32. F. M. Allehiany, F. Dayan, F. F. Al-Harbi, N. Althobaiti, N. Ahmed et al., “Bio-inspired numerical analysis of covid-19 with fuzzy parameters,” Computers, Materials & Continua, vol. 72, no. 2, pp. 3213–3229, 2022. [Google Scholar]
33. P. N. Srinivasu and V. E. Balas, “Self-Learning Network-based segmentation for real-time brain M.R. images through HARIS,” PeerJ Computer Science, vol. 7, no. e654, pp. 1–24, 2021. [Google Scholar]
Cite This Article
 Copyright © 2023 The Author(s). Published by Tech Science Press.
This work is licensed under a Creative Commons Attribution 4.0 International License , which permits unrestricted use, distribution, and reproduction in any medium, provided the original work is properly cited.
 Downloads
 Citation Tools