
 Submit a Paper
 Propose a Special lssue
 Open Access
ARTICLE
Early Detection of Heartbeat from Multimodal Data Using RPA Learning with KDNN-SAE
1 Department of Electronics and Communication Engineering, Ponjesly College of Engineering, Nagercoil, India
2 Department of Electronics and Communication Engineering, CSI Institute of Technology, Nagercoil, India
* Corresponding Author: A. K. S. Saranya. Email:
Computer Systems Science and Engineering 2023, 45(1), 545-562. https://doi.org/10.32604/csse.2023.029975
Received 16 March 2022; Accepted 20 April 2022; Issue published 16 August 2022
 View Full Text
 Download PDF
Abstract
Heartbeat detection stays central to cardiovascular an electrocardiogram (ECG) is used to help with disease diagnosis and management. Existing Convolutional Neural Network (CNN)-based methods suffer from the less generalization problem thus; the effectiveness and robustness of the traditional heartbeat detector methods cannot be guaranteed. In contrast, this work proposes a heartbeat detector Krill based Deep Neural Network Stacked Auto Encoders (KDNN-SAE) that computes the disease before the exact heart rate by combining features from multiple ECG Signals. Heartbeats are classified independently and multiple signals are fused to estimate life threatening conditions earlier without any error in classification of heart beat. This work contained Training and testing stages, in the preparation part at first the Adaptive Filter Enthalpy-based Empirical Mode Decomposition (EMD) is utilized to eliminate the motion artifact in the signal. At that point, the robotic process automation (RPA) learning part extracts the effective features are extracted, and normalized the value of the feature then estimated utilizing the RPA loss function. At last KDNN-SAE prepared training for the data stored in the dataset. In the subsequent stage, input signal compute motion artifact and RPA Learning the evaluation part determines the detection of Heartbeat. So early diagnosis of heart failures is an essential factor. The results of the experiments show that our proposed method has a high score outcome of 0.9997. Comparable to the CIF, which reaches 0.9990. The CNN and Artificial Neural Network (ANN) had less score 0.95115 and 0.90147.Keywords
Cardiovascular disease is still one of the major diseases in the world wide even though the recent treatments in medical technology have been developed [1–3]. Heart Failure is the most common cardiovascular disease causing significant economic burden and mortality. About 60% of mortality rate in world is due to cardiovascular disease. Prevalence of HF continuous to rise due to survival from acute coronary diseases and carelessness in early diagnosis. As a result of recent development in various sensors and telemonitoring system makes the measurement of heart rate easier without direct contact with the skin [4]. Automatic heartbeat detection is becoming increasingly important and effective, since it is main aspect for automatic classification of heart beat and evaluate heart rate correctly [5,6].
An electrocardiogram (ECG) signal is a device that graphically represents the cardiac activity; a normal heartbeat in the ECG lies in P-wave, QRS complex, and T-wave that can be determined by attaching electrodes on the surface of the body. The obscure information in the physiological signal is used to recognize the heart failure [7]. Electroencephalogram (EEG), Electrooculogram (EOG), and Electromyogram (EMG) R-peak antiques in NC signals (EMG) are caused by the heart’s activities, which generate a strong electrical field (EMG). These physiological responses then contain heart rate data that is repeated. Noises produced by various sources of measurement errors have different effects on multimodal signals. As a result, these signals can be considered autonomous to some extent. Because the occurrence of one signal may be weak, multiple signal detection is often more precise than detection based on individual signals [8]. Multimodal signal is obtained by combining various physiological signals and it makes classification of heartbeat trivial compared with single modal signal.
The use of neural systems for ECG analysis has a long history. Since ECG signals are not fixed they will adapt according to change in the condition. The potential of neural networks is enormous. Advances in neural networks open up new possibilities for design. The convolutional neural network (CNN)-based algorithm is used to classify the heart beat from multimodal data [9–13]. When the signals are noisy, CNN is less sensitive to noise and, in any case, capable of extracting important information [14]. When more significant levels of fusion (feature or decision) are used, some of this data is typically lost, while the level of consideration is typically increased. Fusion of few signals leads to false classification of heart beat. Furthermore, the loss of even a few beats has a significant impact on a portion of the investigations based on heartbeats (such as heart-rate variability analysis) [15]. As a result, there is a growing interest in obtaining the most precise heartbeat detection methods possible.
The rest of the paper is organized as follows; In Section 2 contains the work related to the proposed system In Section 3 briefly describes the details of the proposed system i.e., Exact classification of heart beat is summarized. In Section 4, shows simulation and experimental results in Section 5, the conclusion is presented.
In [16] proposed a technique to estimate heartbeat in multimodal signal to improve the QRS detection large number of dataset is taken for training. A data fusion system for reliable QRS detection is developed by combining heartbeats from different sources and heartbeat is classified. Authors in [17] proposed a technique for detecting heartbeat. In multimodal data, there are heartbeats. Multimodal signal from a single source is recorded. Heartbeats usually lies in R Peaks of ECG signal, if the signal is affected by motion artifact, another signal that generate cardiac movement is used to classify the heartbeat.
In [18] proposed a multilabel classification in CNN with adaptive network. The adaptive network will adapt according to the input signal. In this method multilabel classification the output signal is labelled with more than one class and the process is iterated until the input ECG signal is classified. The advantage is training of database is processed with combination of multiple class makes the classification of signal correctly. Authors in [19] to identify heartbeats, researchers proposed a CNN method to classify the heartbeat in multimodal signal using the learned features from the training signal. This method eliminates the need for special training for patient since the data from sensor is transferred using wireless sensor it does not cause inconvenience to patient. Moreover, because the method is information-driven, it can learn relevant features from any set of signals. In [20] proposed deep neural network is used to classify the heartbeat. Deep Neural Network (DNN) classify the heartbeat based on the training signal and the advancement is addition of 6 various multimodal signal is include for dataset. Inclusion of additional physiological signal makes the classification of heartbeat precise.
Heart failure is a typical clinical syndrome that causes grimness and mortality around the world. In proposing a heartbeat detector KDNN-SAE that determines the disease before accurate heart rate and learn fused features from different physiological signs. Generally, the performance is dependent on classification by combining features from multimodal signal to enhance the performance of proposed system, for example, arterial blood pressure. This work included training and testing parts, in the Learning part at first the Adaptive Filter Enthalpy Based Empirical Mode Decomposition (EEMD) is utilized to eliminate the motion artifact in the signal. At that point Robotic Process Automation (RPA) Learning part separates the viable features, for example, LBP (Local Binary Pattern), LGP (Local slope Pattern), and Histogram are extricated and normalized the features value esteem then computation utilizing RPA misfortune work. The proposed architecture is shown in Fig. 1. These training just as the testing stages are described detailed as the following sections;

Figure 1: System architecture of proposed methodology
In this stage, the inputs are taken as physiological signs dependent on the electrocardiogram. Let us assume
Adaptive Filter Using Enthalpy Based Empirical Mode Decomposition (EEMD)
To remove high-frequency noise and baseline wander in EMD [21] modes. However, mode merging is a common issue with the EMD method, resulting in incorrect extraction of IMFs (Intrinsic Mode Functions). The problems are solved by the proposed Adaptive Filter Using Enthalpy Based EMD. The next steps must be completed to generate the reference noise signal.
Step 1: Find all the maximum and the minimum value of the Motion Artifact (MA)
Step 2: Find the highest point on the curve to determine upper maximum umax (t), and then replicate the process to produce lower minimum value, u min (t).
Step 3: Calculate the mean,
Step 4: The value of the mean is then subtracted from the sample h (t) = x (t) − m (t)
Step 5: The next stage is to compare the quasi-residue function r (t) = x (t) − c.
Step 6: This process is continued till r(t) has one peak
Step 7: Recognize the perfect signal part extend and removing IMF relating to the ideal spectral analysis of the source noise signal is the final step in producing the source noise signal S.
Fig. 2 shows block diagram of Adaptive filter using EEMD technique. Here adaptive step size enthalphy is used to minimize the error and process is continued by increasing the step size. The enthalphy based empirical mode deterioration determination consist of following steps

Figure 2: Adaptive filter using EEMD technique
where u(n) is the reference ECG signal, y(n) the output signal, w(n) the filter coefficients, e(n) the error signal,
3.2 Feature Extraction using Robotic Process Automation (RPA)
Feature extraction is a significant stage for early heartbeat detection and classification. The useful features of the specific heart rate and takes infused features are removed from the ECG signals for sorting reasons. The valuable features are extracted from the ECG Signal. RPA learning parts remove the valuable features, for example, LBP, LGP features, and histograms from the ECG signals. These features are described briefly as follows;
3.2.1 Feature Extraction Based on Local Binary Pattern Features (LBP)
Neighbourhood Binary Pattern is utilized to discover the heartbeat rate and its features. These dissected features are utilized as input for classification, after which evaluates the disease before a definite heart rate and learns fused features from multiple physiological signals dependent on electrocardiogram (ECG). An LBP [22,23] code is estimated by looking at numerous physiological signals dependent on ECG which is mathematically spoken to as follows;
where;
where; k → maximal LBP pattern value.

3.2.2 Feature Extraction Based on Local gradient Pattern (LGP)
LGP method is based on comparison of signal region which is represented in Tab. 1.

As shown in Tab. 2, the signal is represented using two separate patterns. If u1 u3 then Bit-1 for Pattern-1 is 0, otherwise it is 1. The formula shown in Fig. 4 is also used to determine comparable way different bits. Pattern 1 can be made up of various combinations, such as 00, 01, 10, and 11. Design 1 is expected to be classified into four bins in this way. Pattern 2 (shown in Fig. 5) necessitates the addition of four bins. LGP [24] is the name of this new portrayal. For each signal in the ECG, an LGP is calculated. Tab. 3 depicts an example of obtaining LGP.


3.2.3 Feature Extraction Based on Histogram
After removing the noise of the signals [25], HE process is carried to enhance the performance since it maintains idleness in the separated region. The HE is cultivated using altering the histogram of the signal gray conditions in the spatial domain by persistently redistributing them. The HE is numerically characterized as follows;
3.3 Feature Normalization and RPA Loss Function Calculation
Given the extracted features, normalize the feature values here, the computation utilizing RPA loss function. Data normalization is carried at the time of initialization to remove the motion artifact in the signal. The feature is normalized using min max normalization. After normalizing the feature values, RPA loss functions were used to approximate them.
where; N → no of features, F1 → feature1, F2 → feature2, F3 → feature3. After completing the process of the training phase, all the data are transmitted to the next phase.
In this testing stage, the input signal determines motion artifact and RPA Learning the assessment part to determine the detection of Heartbeat. The step by step techniques are described briefly as follows;
3.4.1 Krill Deep Neural Network Stacked Auto Encoders (KDNN-SAE)
KDNN-SAE is utilized to calculate approximately the disease earlier through exact heart rate by fusing features from multimodal signal. The reliability can be improved by utilization of extra physiological signals, for example, arterial blood pressure (BP). Krill-based DNN stack encoder is generalizable, powerful, and productive in distinguishing heart rate just as heartbeat area from different signals in Algorithm 2.

Stacked Deep Neural Network shown in Fig. 3, Given the unlabelled signal as input,

Figure 3: Structure of KDNN-SAE
where f denotes the function of encoder,
where g is the function of decoder,
Initially the non trained ECG signal is gives as input to hidden layer which is trained as labeled ECG signal using supervised method. The three steps in KDNN–SAE is as follows,
1. Test the input ECG signal using features from learned vector
2. The previous layer’s learned feature vector is used as the input signal for the next signal, and this process is continued till all the ECG signals are tested.
3. After all of the ECG signals have been tested, the back propagation algorithm (BP) is used to classify the signal.
After allocating weights krill herd optimization algorithm is utilized to select the ideal weight which is described briefly in the following section;
3.4.3 Krill Herd Optimization Algorithm (AKH)
KHA is one of the description meta-heuristic multitude reformation procedures for dealing with an overhaul that is upgrade issues, which depends upon the movement of the herding of the krill swarms because of specific common along with ecological structures. A blend of minimal detachments of the circumstance of food and the most raised thickness of the group is the target capacity of this streamlining algorithm. The depiction and logical enunciation of these operational strategies are given in the following section,
Step 1: Initialization
The foremost parameters of KHA are the whole improvement quantity as well as the populace size,
Step 2: Fitness calculation
Consider the fitness value rely upon the condition (4) and besides select the best result.
To improve the objective function value, KHA follows the interest headings and repeats the execution of three improvements. By three essential methods, the improvement of each krill is settled as (i) Development started by other krill folks, (ii) Foraging activity, (iii) Random scattering.
Step 3: Updating the position
Here, the individual krill changes its current positions and besides moves towards upgraded circumstances considering acceptance development, rummaging development just as unbalanced scattering development. As exhibited by the three above investigated advancements, the upgraded area of the mth krill folks through the period of t just as
Anywhere,
An n-dimensional decision space in the Lagrangian model is used to express the basic KHA technique as shown below,
Taking into account the above system optimal weights are selected. After the assurance of optimal weights, DNN starts its characterization. The idea incorporates DNN acknowledgment described briefly in the following section;
Restricted Boltzmann Machine: A RBM is the best type of Markov random field used for the classification of heart beat exactly. Fig. 4 depicts the KDNN structure, consist of n input layer which categorize the signal based on features and the heart beat is classified by output layer.

Figure 4: KDNN structure
Step 1: Initially set the selected features that is number of training signal based on their weight
Step 2: Update the weight in the hidden layer. The updated weight of signal is set as input to RBM. The updated weight of signal is
Thus finely trained ECG signal is set as input to RBM which makes the classification of input ECG signal more precise.
The added advantage of KDNN classifier is if any signal is missed for classification it naturally takes that signal for further process of classification.
The proposed Krill-based DNN Stack autoencoders to assess the disease before a definite heart rate is assessed and investigated in this section. The accuracy and efficiency of proposed method are determined from the ECG dataset.
The evaluation of the proposed KDNN-SAE algorithm based on the MIT-BIH arrhythmia database, that accommodate two-channel ECG records, to exhibit the quality. On training records 200–234, used 5-fold randomized cross-validation to enhance the DNN design and weights. The improved DNN was used in our KDNN-SAE heartbeat detector, which consisted of one filter with a length of 30 and no hidden layers.
The efficiency of the proposed method is calculated by determining specific performance measures.
• Sensitivity:
• Specificity:
• Accuracy:
• Positive Predictive Value (PPV):
• False Positive Rate (FPR):
• False Negative Rate (FNR):
• Kappa Statistics Value (KSV):
where; PR (e) → kappa coefficient
Comparative and performance evaluation of the proposed based Krill based DNN-Stack auto encoder algorithm graphically characterized as the following sections;
Heartbeat detection performance
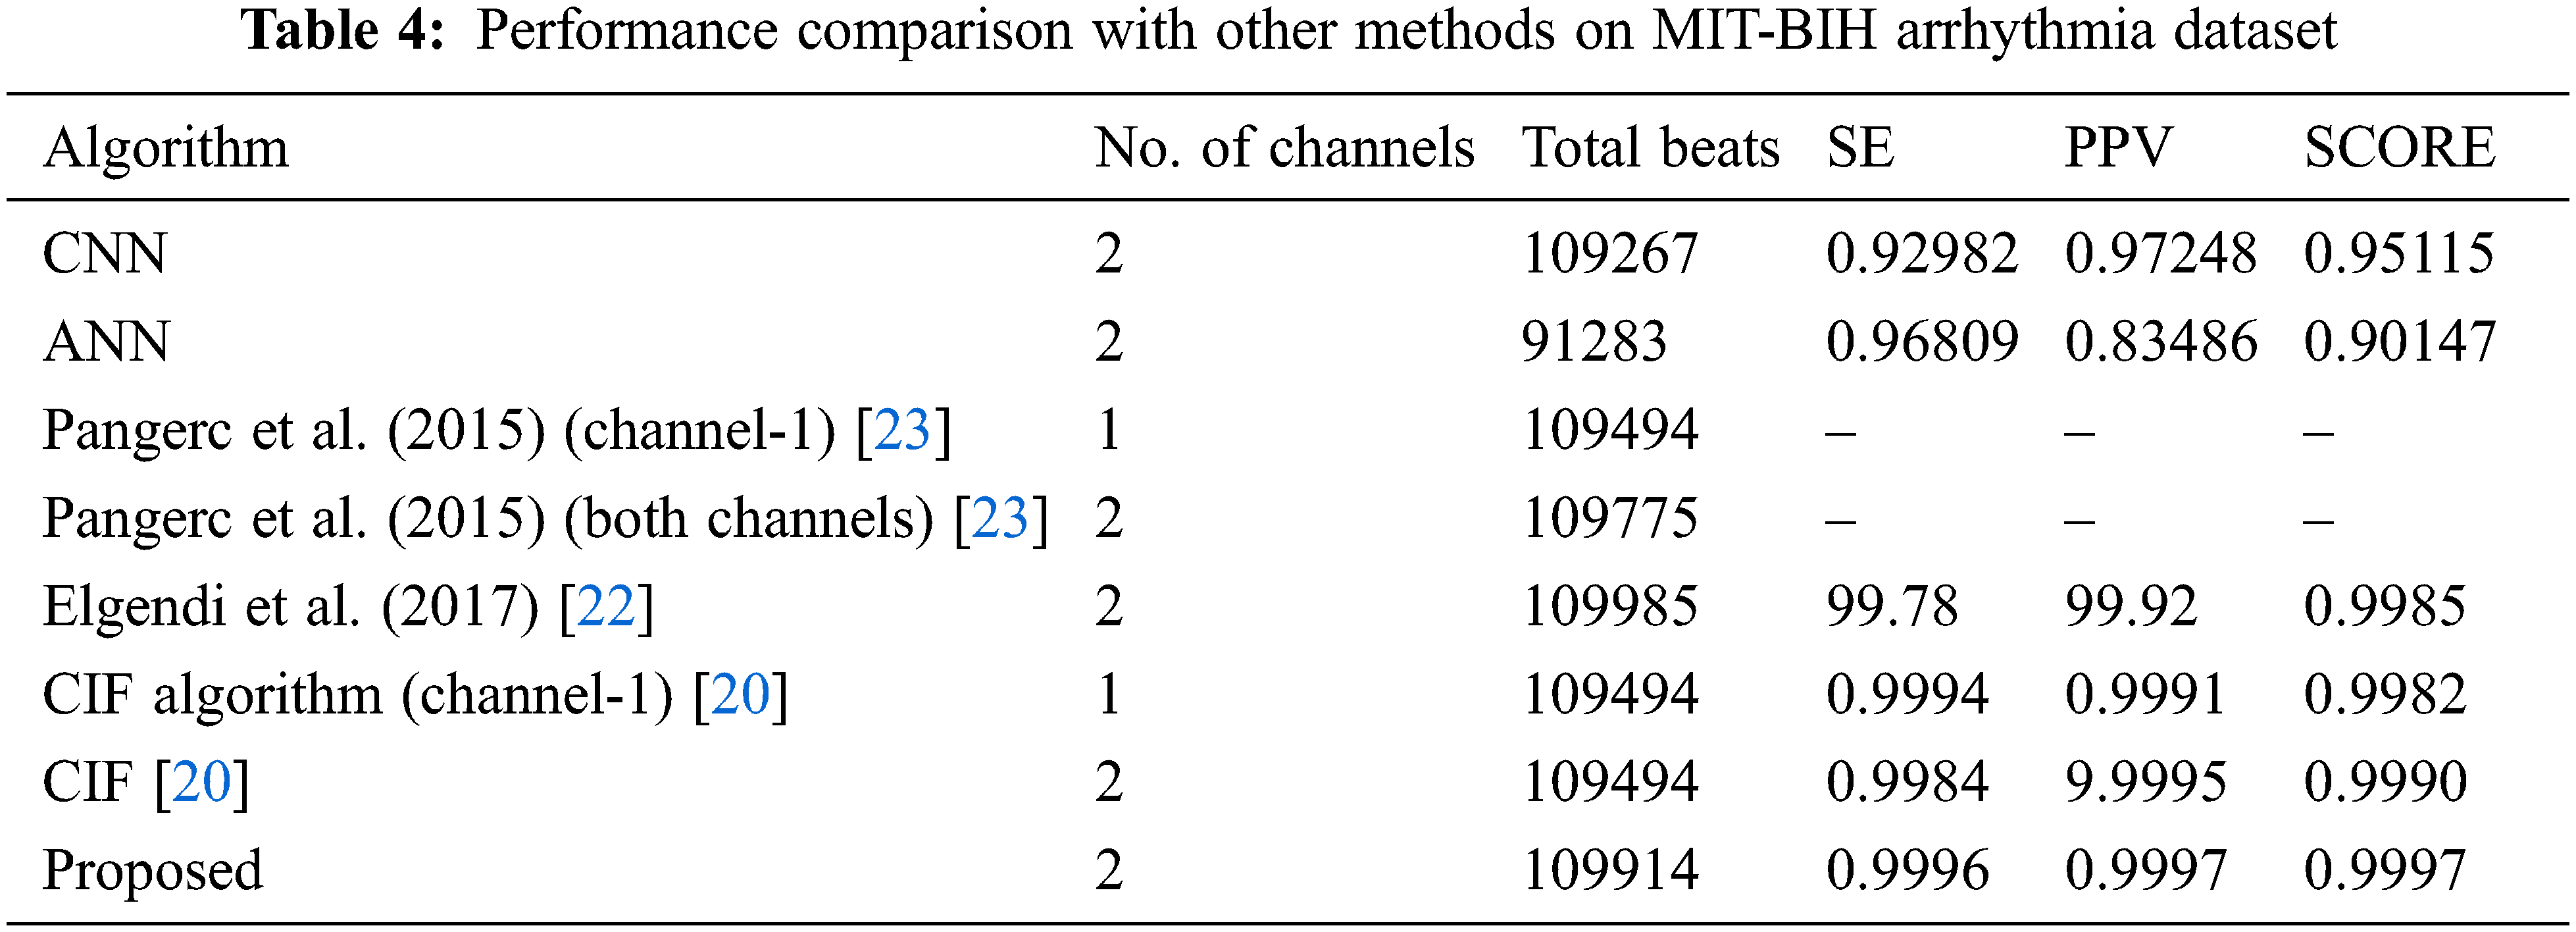
Here present a near-performance analysis of the proposed KDNN-SAE algorithm distributed outcomes in Tab. 4. The total number of beats is classified into true positives (TP), false positives (FP), and false negatives (FN), as well as the sensitivity and PPV values, both gross and average (if available), and the overall score. We likewise show what number of channels each contending algorithm utilized. Likewise, the presentation predominance of channel 2 techniques more than channel 1 strategies stays indistinct. Those realities potentially show that most recorded signals are respectful. The generally favorable position delighted in by the proposed 2-channel KDNN-SAE more than 1-channel KDNN-SAE and other contending algorithms was slender, also. Simultaneously, when compared to channel 1 CIF, the channel 2 KDNN-SAE reduced false negative from 172 to 72 and increased false positive from 64 to 103, which is shown in Tab. 1
This can be used to confirm the adequacy of the entire set of compared algorithms, as well as to analyze the Krill-based Deep neural network stack autoencoder. The subsequent Figs. 5–15 shows the sensitivity, specificity, accuracy, precision, recall, F-measure as well as kappa statistics value, score value, signal, and filters of the proposed approaches. The output represents the comparison analysis of the signals of the input channel and its R waves of a proposed technique. When examining figures Figs. 5–9 proposed acquires the most maximum result to evaluate the accurate heart rate. In contrast with the other existing procedures, our proposed accomplishes higher results.

Figure 5: (a): Signal-1 Inp_filter (b): Inp_R

Figure 6: (a): Signal-2 input filter (b): Inp_R

Figure 7: (a): Signal-3 Inp_filter (b): Inp_R

Figure 8: (a): Signal-4 Inp_filter (b): Inp_R

Figure 9: (a): Signal-5 Inp_filter (b): Inp_R

Figure 10: Performance evaluation of proposed, CNN, ANN method

Figure 11: Performance evaluation in terms of precision, recall, f-measure of proposed with existing method

Figure 12: Performance evaluation of FPR

Figure 13: Performance evaluation of FNR

Figure 14: Performance evaluation of kappa statistics value

Figure 15: Performance analysis of sensitivity
Fig. 10 graph represents the performance analysis of the accuracy, sensitivity, and specificity of a proposed strategy with the current strategies. When dissecting Fig. 10 proposed gets the maximum result of the accuracy of 0.9917, the sensitivity of 0.996, and the specificity of 0.9861. In contrast with the other existing procedures, proposed accomplishes higher results. Fig. 11 graph represents the performance evaluation in terms of precision, recall, and F-measure of a proposed technique with the existing techniques. When examining Fig. 11 proposed acquires the maximum result of precision 0.981651, recall of 0.990741, and F-measure of 0.986175. In contrast with the other existing methodologies, our proposed accomplishes higher results.
When examining Figs. 15–17 proposed acquires the maximum result of FPR 0.038462, FNR of 0.009259, and kappa statistics value of 0.942405. In contrast with the other existing techniques, our proposed accomplishes higher results. The output represents the performance analysis of the sensitivity of a proposed technique with the existing techniques for CIF, CNN, and ANN. When examining Fig. 15 proposed acquires the most elevated result of sensitivity 0.996. In contrast with the other existing techniques, our proposed accomplishes higher results.
The output represents the performance analysis of the positive predictive value as well as the score value of a proposed technique with the existing techniques for CIF, CNN, and ANN. When examining Figs. 16 and 17 proposed acquires the maximum result of PPV is 0.997 and a score value of 0.997. In contrast with the other existing systems, our proposed accomplishes higher results.

Figure 16: Performance evaluation of PPV

Figure 17: Performance evaluation of score value
Krill-based DNN Stack autoencoders for measuring the disease before accurate heartbeat recognition and learning features from multiple physiological signals dependent on the electrocardiogram are proposed in this paper. Here, an adaptive filter using enthalpy-based empirical mode decomposition is used to eliminate the motion artifact in the signal. After the expulsion of noise from the signal, the spotless ECG signals applies RAP loss function. At last KDNN-SAE training the data accumulated into the dataset. In the testing part, input signal figure motion artifact and RPA Learning the assessment part assesses the detection of Heartbeat. Thus detection of heart failure earlier avoids cognitive impairment. Contrasted with the other existing methodologies, our proposed beat other methodologies.
Funding Statement: The authors received no specific funding for this work.
Conflicts of Interest: The authors declare that they have no conflicts of interest to report regarding the present work.
References
1. D. Lista, P. Javier, P. Perez-Martinez, J. Lopez-Miranda and F. Perez-Jimenez, “Long chain omega-3 fatty acids and cardiovascular disease: A systematic review,” British Journal of Nutrition, vol. 107, no. S2, pp. S201–S213, 2012. [Google Scholar]
2. A. Pagidipati, N. Jadeja and T. A. Gaziano, “Estimating deaths from cardiovascular disease: A review of global methodologies of mortality measurement,” Circulation, vol. 127, no. 6, pp. 749–756, 2013. [Google Scholar]
3. M. Mollakazemi, S. Javad, A. Atyabi and A. Ghaffari, “Heartbeat detection using a multimodal data coupling method,” Physiological Measurement, vol. 36, no. 8, pp. 1729, 2015. [Google Scholar]
4. P. Urška and F. Jager, “Robust detection of heart beats in multimodal records using slope-and peak-sensitive band-pass filters,” Physiological Measurement, vol. 36, no. 8, pp. 1645, 2015. [Google Scholar]
5. S. Omkar and R. Kumar Sunkaria, “Heartbeat detection in multimodal physiological signals using signal quality assessment based on sample entropy,” Australasian Physical & Engineering Sciences in Medicine, vol. 40, no. 4, pp. 917–923, 2017. [Google Scholar]
6. A. F. Pimentel, M. D. Santos, D. B. Springer and D. Gari Clifford, “Heart beat detection in multimodal physiological data using a hidden semi-markov model and signal quality indices,” Physiological Measurement, vol. 36, no. 8, pp. 1717, 2015. [Google Scholar]
7. A. Martis, R. Joy, U. Rajendra Acharya and L. Choo Min, “ECG beat classification using PCA, LDA, ICA and discrete wavelet transform,” Biomedical Signal Processing and Control, vol. 8, no. 5, pp. 437–448, 2013. [Google Scholar]
8. S. Rankawat, A. Shalini and R. Dubey, “Robust heart rate estimation from multimodal physiological signals using beat signal quality index based majority voting fusion method,” Biomedical Signal Processing and Control, vol. 33, no. 1, pp. 201–212, 2017. [Google Scholar]
9. L. Jia, Y. Si, T. Xu and S. Jiang, “Deep convolutional neural network based ECG classification system using information fusion and one-hot encoding techniques,” Mathematical Problems in Engineering, vol. 2018, pp. 1–10, 2018. [Google Scholar]
10. T. Rajpurkar, D. Pranav, Y. Awni, M. Haghpanahi, C. Bourn et al., “Cardiologist-level arrhythmia detection with convolutional neural networks,” Biomedical Signal Processing, vol. 7, no. 3, pp. 1–9, 2017. [Google Scholar]
11. J. Tae Joon, H. Minh Nguyen, D. Kang, D. Kim, D. Kim et al., “ECG arrhythmia classification using a 2-D convolutional neural network,” Biomedical Signal Processing, vol. 8, no. 6, pp. 1–22, 2018. [Google Scholar]
12. X. R. Zhang, X. Sun, W. Sun, T. Xu and P. P. Wang, “Deformation expression of soft tissue based on BP neural network,” Intelligent Automation & Soft Computing, vol. 32, no. 2, pp. 1041–1053, 2022. [Google Scholar]
13. W. Sun, G. Z. Dai, X. R. Zhang, X. Z. He and X. Chen, “TBE-Net: A three-branch embedding network with part-aware ability and feature complementary learning for vehicle re-identification,” IEEE Transactions on Intelligent Transportation Systems, pp. 1–13, 2021. [Google Scholar]
14. O. ShuLih, E. Y. K. Ng, R. San Tan and U. RajendraAcharya, “Automated diagnosis of arrhythmia using combination of CNN and LSTM techniques with variable length heart beats,” Computers in Biology and Medicine, vol. 102, no. 4, pp. 278–287, 2018. [Google Scholar]
15. T. Javier, C. A. García, D. G. Márquez, R. Raya and A. Otero, “Multiple physiological signals fusion techniques for improving heartbeat detection: A review,” Sensors, vol. 19, no. 21, pp. 4708, 2019. [Google Scholar]
16. A. Moody, I. George, B. Moody and I. Silva, “Robust detection of heart beats in multimodal data: The physionet/computing in cardiology challenge 2014,” in Computing in Cardiology 2014, pp. 549–552, 2014. [Google Scholar]
17. D. Quan, Y. Bai, Y. BugraErol, R. Salas-Boni, X. Zhang et al., “Robust QRS peak detection by multimodal information fusion of ECG and blood pressure signals,” Physiological Measurement, vol. 37, no. 11, pp. N84, 2016. [Google Scholar]
18. S. Omkar and R. Kumar Sunkaria, “A new approach for identification of heartbeats in multimodal physiological signals,” Journal of Medical Engineering & Technology, vol. 42, no. 3, pp. 182–186, 2018. [Google Scholar]
19. G. Nagarajan, R. Swaminathan and T. M. Deserno, “Adaptive learning and cross training improves R-wave detection in ECG,” Computer Methods and Programs in Biomedicine, vol. 200, pp. 105931, 2021. [Google Scholar]
20. C. S. Bollepalli, C. S. Sastry and S. Jana, “Robust heartbeat detection from multimodal data via CNN-based generalizable information fusion,” IEEE Transactions on Biomedical Engineering, vol. 66, no. 3, pp. 710–717, 2018. [Google Scholar]
21. B. Andrea, G. Gabrieli and G. Esposito, “Deep neural networks and transfer learning on a multivariate physiological signal dataset,” Bioengineering, vol. 8, no. 3, pp. 35, 2021. [Google Scholar]
22. M. Elgendi, A. Mohamed and R. Ward, “Efficient ECG compression andqrs detection for e-health applications,” Scientific Reports, vol. 7, no. 1, pp. 459, 2017. [Google Scholar]
23. V. X. Afonso, W. J. Tompkins, T. Q. Nguyen and S. Luo, “ECG beatdetection using filter banks,” IEEE Transactions on Biomedical Engineering, vol. 46, no. 2, pp. 192–202, 1999. [Google Scholar]
24. D. Pollreisz and N. TaheriNejad, “Detection and removal of motion artifacts in PPG signals,” Mobile Networks and Applications, vol. 19, no. 15, pp. 2787, 2019. [Google Scholar]
25. G. Suseendran and N. Zaman, “Heart disease prediction and analysis using PCO, LBP and neural networks,” Computational Intelligence and Knowledge Economy, vol. 11, no. 12, pp. 457–460, 2019. [Google Scholar]
Cite This Article
 Copyright © 2023 The Author(s). Published by Tech Science Press.
This work is licensed under a Creative Commons Attribution 4.0 International License , which permits unrestricted use, distribution, and reproduction in any medium, provided the original work is properly cited.
 Downloads
 Citation Tools