
 Submit a Paper
 Propose a Special lssue
 Open Access
ARTICLE
Sailfish Optimization with Deep Learning Based Oral Cancer Classification Model
1 Department of Computer Science, College of Sciences and Humanities-Aflaj, Prince Sattam bin Abdulaziz University, Al-Kharj, 16278, Saudi Arabia
2 Department of Industrial and Systems Engineering, College of Engineering, Princess Nourah bint Abdulrahman University, Riyadh, 11671, Saudi Arabia
3 Department of Computer Science, College of Science & Art at Mahayil, King Khalid University, Abha, 62529, Saudi Arabia
4 Department of Computer Science, College of Computing and Information System, Umm Al-Qura University, Mecca, 24382, Saudi Arabia
5 Department of Information Technology, College of Computer and Information Sciences, King Saud University, Riyadh, 4545, Saudi Arabia
6 Department of Biomedical Engineering, College of Engineering, Princess Nourah bint Abdulrahman University, Riyadh, 11671, Saudi Arabia
7 Research Centre, Future University in Egypt, New Cairo, 11845, Egypt
* Corresponding Author: Mesfer Al Duhayyim. Email:
Computer Systems Science and Engineering 2023, 45(1), 753-767. https://doi.org/10.32604/csse.2023.030556
Received 29 March 2022; Accepted 30 April 2022; Issue published 16 August 2022
 View Full Text
 Download PDF
Abstract
Recently, computer aided diagnosis (CAD) model becomes an effective tool for decision making in healthcare sector. The advances in computer vision and artificial intelligence (AI) techniques have resulted in the effective design of CAD models, which enables to detection of the existence of diseases using various imaging modalities. Oral cancer (OC) has commonly occurred in head and neck globally. Earlier identification of OC enables to improve survival rate and reduce mortality rate. Therefore, the design of CAD model for OC detection and classification becomes essential. Therefore, this study introduces a novel Computer Aided Diagnosis for OC using Sailfish Optimization with Fusion based Classification (CADOC-SFOFC) model. The proposed CADOC-SFOFC model determines the existence of OC on the medical images. To accomplish this, a fusion based feature extraction process is carried out by the use of VGGNet-16 and Residual Network (ResNet) model. Besides, feature vectors are fused and passed into the extreme learning machine (ELM) model for classification process. Moreover, SFO algorithm is utilized for effective parameter selection of the ELM model, consequently resulting in enhanced performance. The experimental analysis of the CADOC-SFOFC model was tested on Kaggle dataset and the results reported the betterment of the CADOC-SFOFC model over the compared methods with maximum accuracy of 98.11%. Therefore, the CADOC-SFOFC model has maximum potential as an inexpensive and non-invasive tool which supports screening process and enhances the detection efficiency.Keywords
Oral cancer (OC) is a lethal disease highly related to mortality and morbidity, and it comes under the neck and head sections [1]. Numerous image processing systems are widely utilized for the earlier diagnosis of OC that results in increased cancer survival rate and greater treatment efficiency. Medical imaging method, computer-aided detection, and diagnosis makes potential change in cancer treatment, now it can be diagnosed in the earlier stage by analyzing magnetic resonance imaging (MRI) scans, X-ray and computed tomography (CT) images. It helps to easily examine the anatomical structure of oral cavity and allows to precisely extract healthy regions from tumor areas. Defining the accurate class of OC at earlier stages is a considerably difficult task [2]. Thus, computer aided application would be extremely advantageous as it helps the medical doctor to offer a comprehensive treatment process and has a classification of diseases in healthcare diagnosis process.
Conventionally, cancer treatment mainly depends upon the grading of tumors. But the grading and discrepancy have added to imprecise prognosis in OC patients [3]. Despite the rising amount of predictive markers, the entire disease prediction remains same [4]. It is due to the challenge in the incorporation of this marker in the present staging scheme [5]. Better diagnostic and prognostic accuracy assists the clinician in making decisions based on the proper treatment for survival [6]. Eventually, machine learning (ML) technique (shallow learning) has been reported to provide better prognostication of OC. Note that, the usage of ML technique has been reported to offer a better prognostication when compared to the conventional statistical analysis [7]. The ML technique can exhibit promising outcomes since it can discern the complicated relations among the variables included in the dataset [8]. Considering the touted feasibility and advantage of the ML approaches in cancer prognostication, the application has gained considerable interest over the last few decades. Because of that, it is poised to help the clinician in taking decisions thus promoting and improving good management of patient health. Interestingly, the advanced technology has resulted in the alteration of shallow ML to deep ML. Deep learning (DL) technique has been touted to increases better management of cancer [9,10].
Song et al. [11] present for addressing this shortcoming by employing a Bayesian deep network able to evaluate uncertainty for assessing OC image classifier reliability. It can be estimated the method utilizes a huge intraoral cheek mucosa image data set captured utilizing our customized device in high-risk populations for demonstrating that meaningful uncertainty data is created. Tanriver et al. [12] discovered the potential application of computer vision and DL approaches from the OC field in the scope of photographic image and examined the prospect of automated model to identify oral potentially malignant disorder with 2-stage pipeline. Camalan et al. [13] established a DL approach for classifying images as “suspicious” and “normal” and for highlighting the region of image most probably that contained from decision-making with creating automated heat map. The author has established a model for classifying images as healthy and abnormal with executing transfer learning (TL) on Inception-ResNet-V2 and created automated heat map for highlighting the area of image most probable that contained from the decision making.
Lim et al. [14] established a new DL structure called as D’OraCa for classifying oral lesions utilizing photographic images. It can be primary for developing a mouth landmark recognition method to the oral image and integrating it as to the oral lesion classifier method as guidance for improving the classifier accuracy. It can be measured the efficacy of 5 distinct deep convolutional neural network (DCNN) and MobileNetV2 is selected as the feature extracting to presented mouth landmark recognition method. Lin et al. [15] projected an effectual smartphone based image analysis approach, influenced by a DL technique, for addressing the challenge of automatic recognition of oral disease. Primary, an easy yet effectual centered rule image capture method has been presented to gather oral cavity images. Afterward, dependent upon this approach, a medium-sized oral data set with 5 categories of diseases has been generated, and resampling approach has been projected to lessen the result of images variability in hand held smartphones camera. At last, an existing DL network (HRNet) has been established for evaluating the performance of our approach for OC recognition.
This study introduces a novel Computer Aided Diagnosis for OC using Sailfish Optimization with Fusion based Classification (CADOC-SFOFC) model. The proposed CADOC-SFOFC model performs fusion based feature extraction process using VGGNet-16 and Residual Network (ResNet) model. Besides, feature vectors are fused and passed into the extreme learning machine (ELM) model for classification process. Moreover, SFO algorithm is utilized for effective parameter selection of the ELM model, consequently resulting in enhanced performance. The experimental analysis of the CADOC-SFOFC model was tested on Kaggle dataset and the results reported the betterment of the CADOC-SFOFC model over the compared methods.
In this study, a novel CADOC-SFOFC model has been devised to determine the existence of OC on medical images. Initially, the CADOC-SFOFC model carried out the fusion based feature extraction procedure using VGGNet-16 and ResNet model. In addition, feature vectors are fused and passed into the ELM model for classification process. Finally, the SFO algorithm is utilized for effective parameter selection of the ELM model as illustrated in Fig. 1.
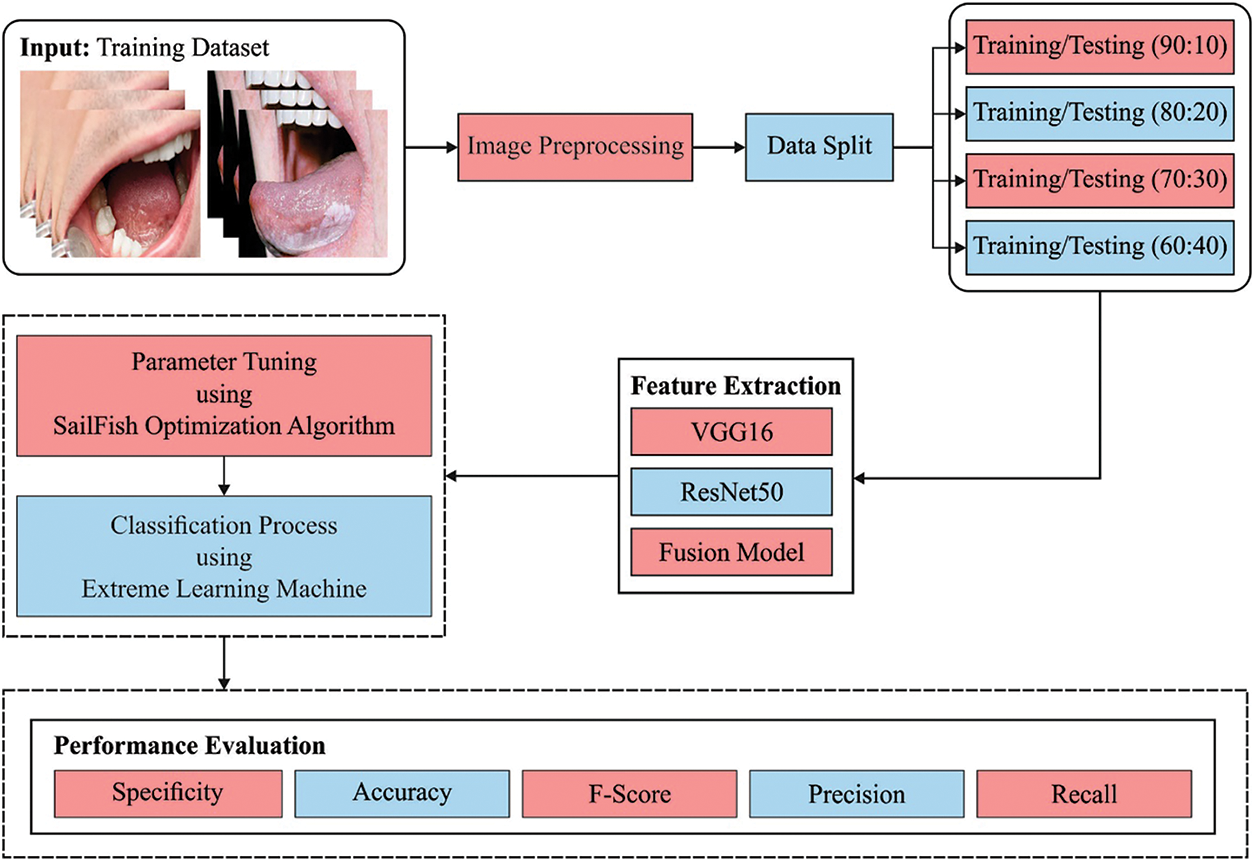
Figure 1: Block diagram of CADOC-SFOFC model
The performance validation of the CADOC-SFOFC model on OC classification is performed using a benchmark dataset from Kaggle repository (available at https://www.kaggle.com/shivam17299/oral-cancer-lips-and-tongue-images). The dataset includes lip and tongue images with two class labels. A total of 87 images come under cancer class and 44 images under non-cancer class. Fig. 2 depicts a sample set of tongue images.
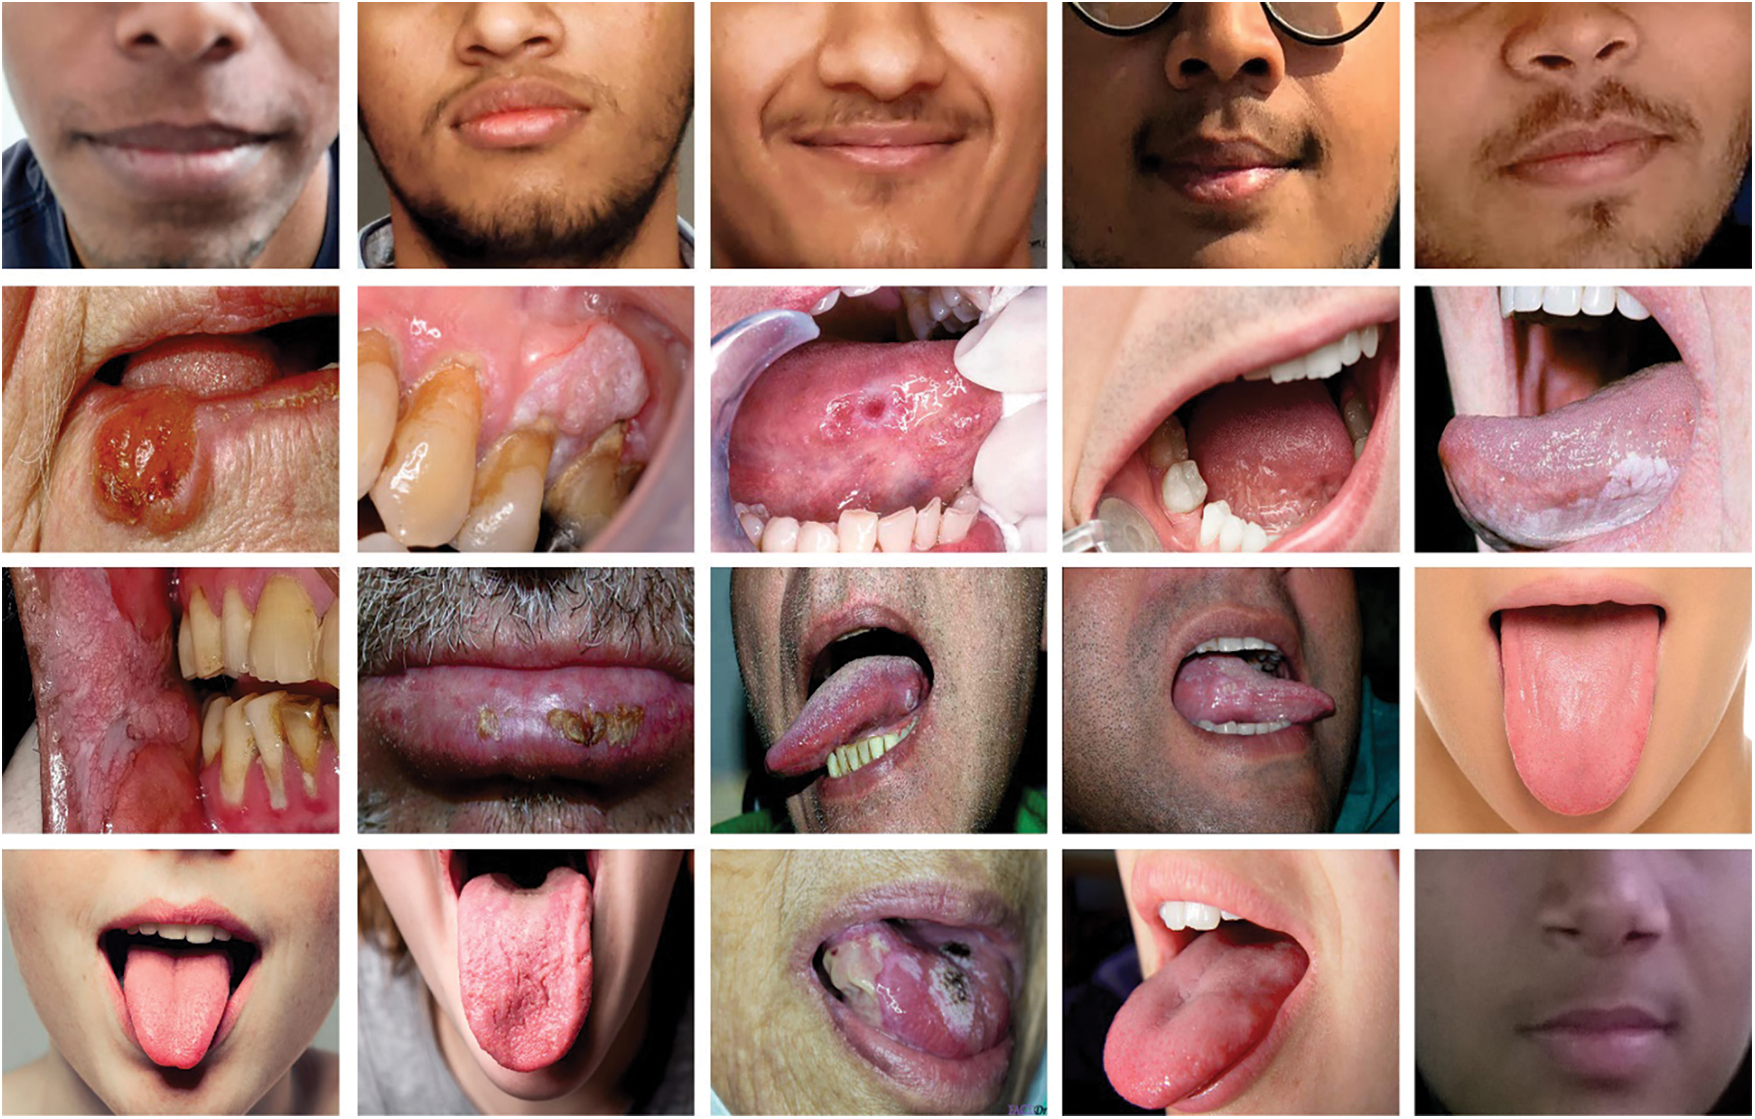
Figure 2: Sample images
Gabor filter (GF) is initially employed to preprocess the input images. It is an oriented complicated sinusoidal grating modified using 2-D Gaussian envelope. For a 2-D coordinate
where
where
In this study, two feature vectors namely Visual Geometry Group (VGG16) and ResNet models are applied [16,17].
2.4 Feature Fusion and Classification
At this stage, the fusion of features is carried out into a matrix by the use of partial least square (PLS) based fusion model [18]. Assume
In case of using PLS, two directions amongst
They are integrated into single matrix and resultant vector was gained with
where
For enhancing the stableness of the ELM model, the minimization function can be provided using Eq. (11):
where
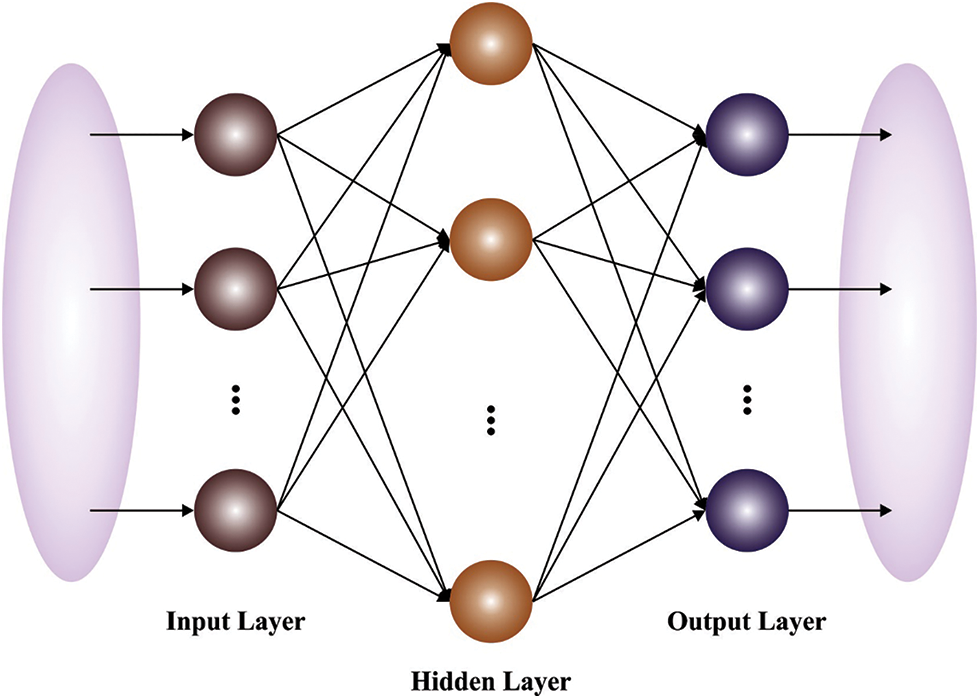
Figure 3: Structure of ELM model
At the final stage, the SFO algorithm is utilized for effective parameter selection of the ELM model, consequently resulting in enhanced performance. The SFO is a new nature-inspired metaheuristic approach which is demonstrated once a set of hunting sailfish (SF) [20]. It demonstrates optimal efficacy associated with common metaheuristic approach. In the SFO approach, it is considered as SF is candidate solution and the place of SF in the exploration region signifies the parameter of issue. The position of
whereas
The parameter
In which
Here
Now
whereas
Then,
In which
For adjusting the ELM parameters, the SFO algorithm computes a fitness function for accomplishing maximum classifier results. It derives a fitness function using the error rate and the fitness value should be as low as possible. It can be defined as follows.
In this section, the experimental validation of the CADOC-SFOFC model is performed using benchmark dataset from Kaggle repository. A set of four confusion matrices achieved by the CADOC-SFOFC model on distinct sizes of training/testing (TR/TS) data is illustrated in Fig. 4. With TR/TS data of 90:10, the CADOC-SFOFC model has recognized 4 instances under cancer and 9 instances under non-cancer classes.

Figure 4: Confusion matrices of CADOC-SFOFC model
At the same time, with TR/TS data of 80:20, the CADOC-SFOFC model has recognized 18 instances under cancer and 8 instances under non-cancer classes. Followed by, with TR/TS data of 70:30, the CADOC-SFOFC model has recognized 25 instances under cancer and 13 instances under non-cancer classes. Lastly, with TR/TS data of 60:40, the CADOC-SFOFC model has recognized 38 instances under cancer and 14 instances under non-cancer classes.
Tab. 1 and Fig. 5 exhibits detailed OC classification outcomes of the CADOC-SFOFC model on distinct sizes of TR/TS data. The experimental outcomes implied that the CADOC-SFOFC model has gained effectual outcomes on various TR/TS data.
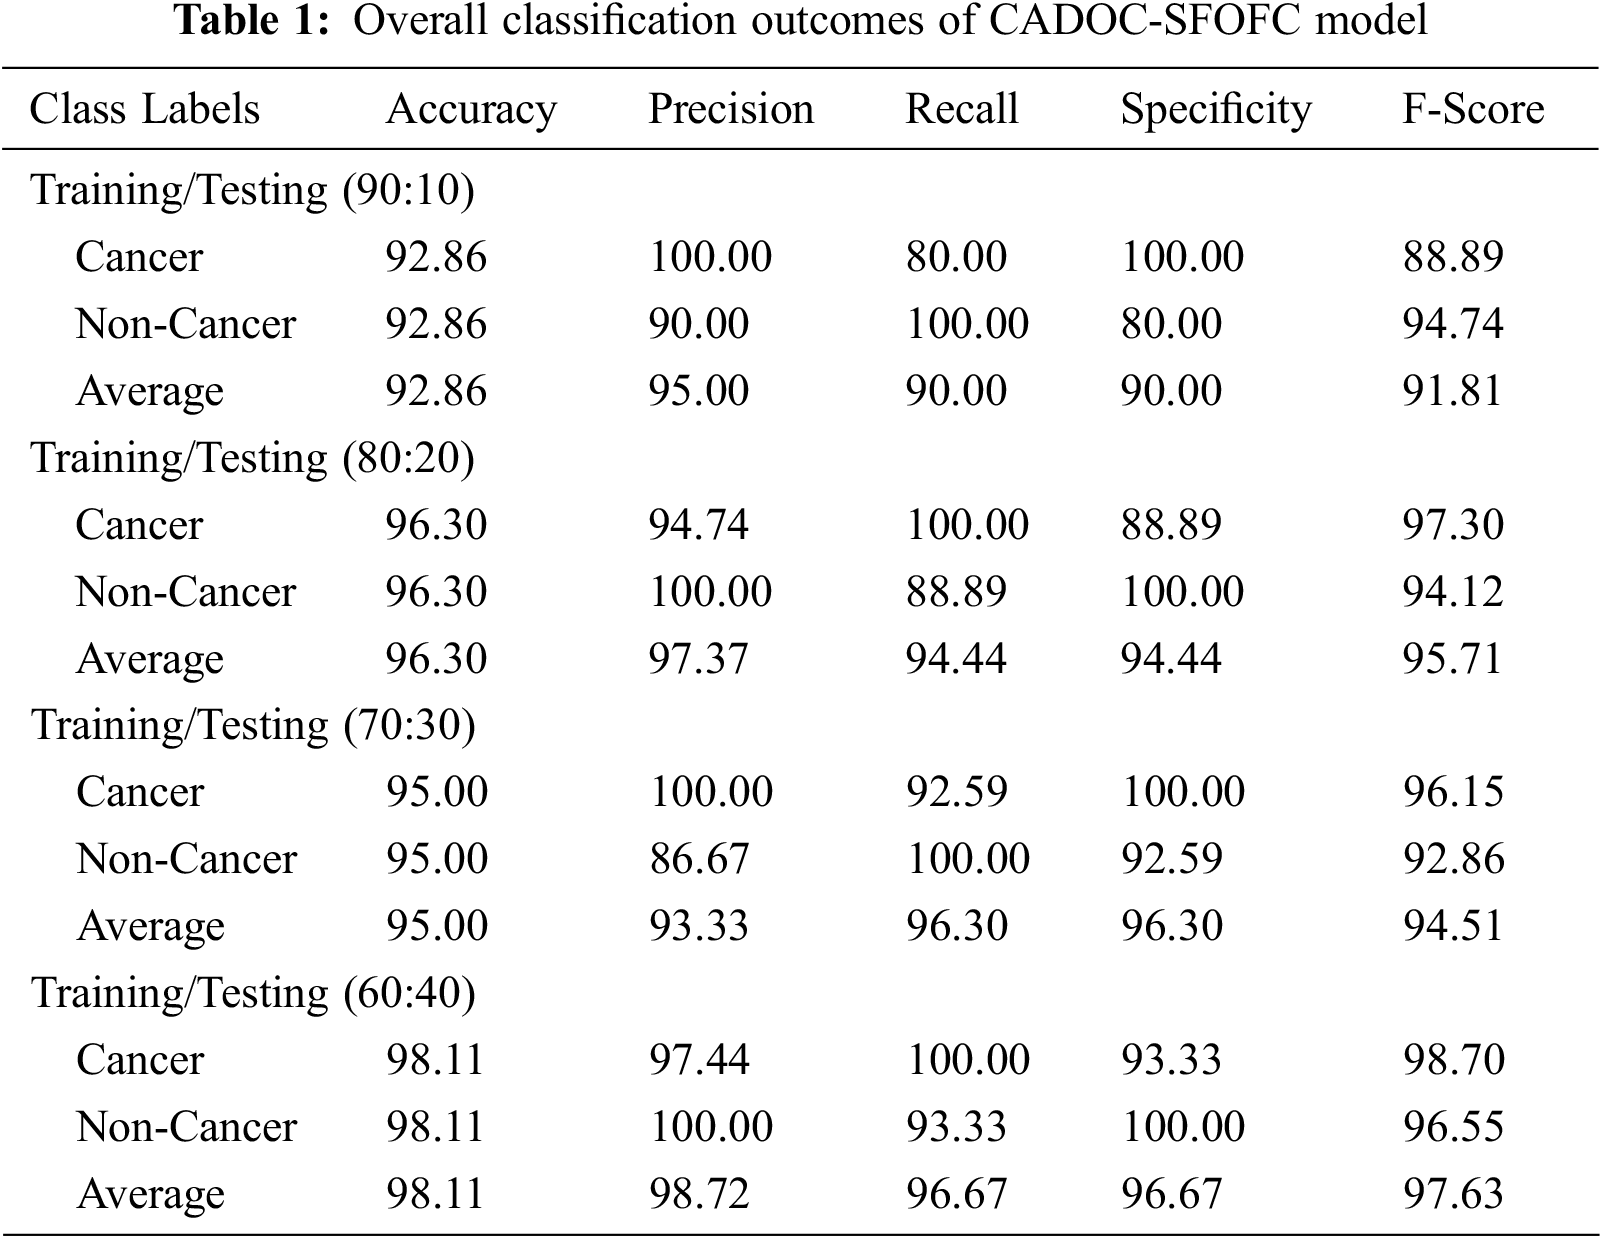

Figure 5: OC classification of CADOC-SFOFC model under distinct TR/TS data
For instance, with TR/TS of 90:10, the CADOC-SFOFC model has classified cancer images with
Fig. 6 demonstrates a clear training and validation accuracies of the CADOC-SFOFC model on test dataset. The training and validation accuracies are measured under varying numbers of epochs. It is exhibited that the CADOC-SFOFC model has gained increased values of training and validation accuracies.

Figure 6: Training and validation accuracies of CADOC-SFOFC model
Fig. 7 validates the training and validation losses of the CADOC-SFOFC model on test dataset. The training and validation losses can be determined with a rising number of epochs. It is displayed that the CADOC-SFOFC model has extended reduced values of training and validation losses.

Figure 7: Training and validation losses of CADOC-SFOFC model
Fig. 8 highlights the ROC curves of the CADOC-SFOFC model obtained under distinct sizes of TR/TS data. The figures reported that the CADOC-SFOFC model has accomplished effectual OC classification under two classes namely cancer and non-cancer. It is also noticed that the CADOC-SFOFC model has gained maximum ROC values under two classes.

Figure 8: Precision-recall curves of CADOC-SFOFC model under distinct TR/TS data
Fig. 9 demonstrates the precision-recall curves of the CADOC-SFOFC model attained under dissimilar sizes of TR/TS data. The results represented that the CADOC-SFOFC model has reached maximum OC classification under two classes namely cancer and non-cancer. It is observed that the CADOC-SFOFC model has showcased improved precision-recall values under two classes.

Figure 9: ROC of CADOC-SFOFC model under distinct TR/TS data
For assessing the enhanced outcomes of the CADOC-SFOFC model, a comparison study with recent models [21–23] is made in Tab. 2 and Fig. 10. The results implied that the ADCO-DL, Inception-v4, and DenseNet models have reached lower OC classification results. Followed by, the artificial neural network (ANN)-support vector machine (SVM) and C-Net models have tried to showcase moderately improved classification outcomes. Though the random forest (RF) model has accomplished reasonable OC classification results with
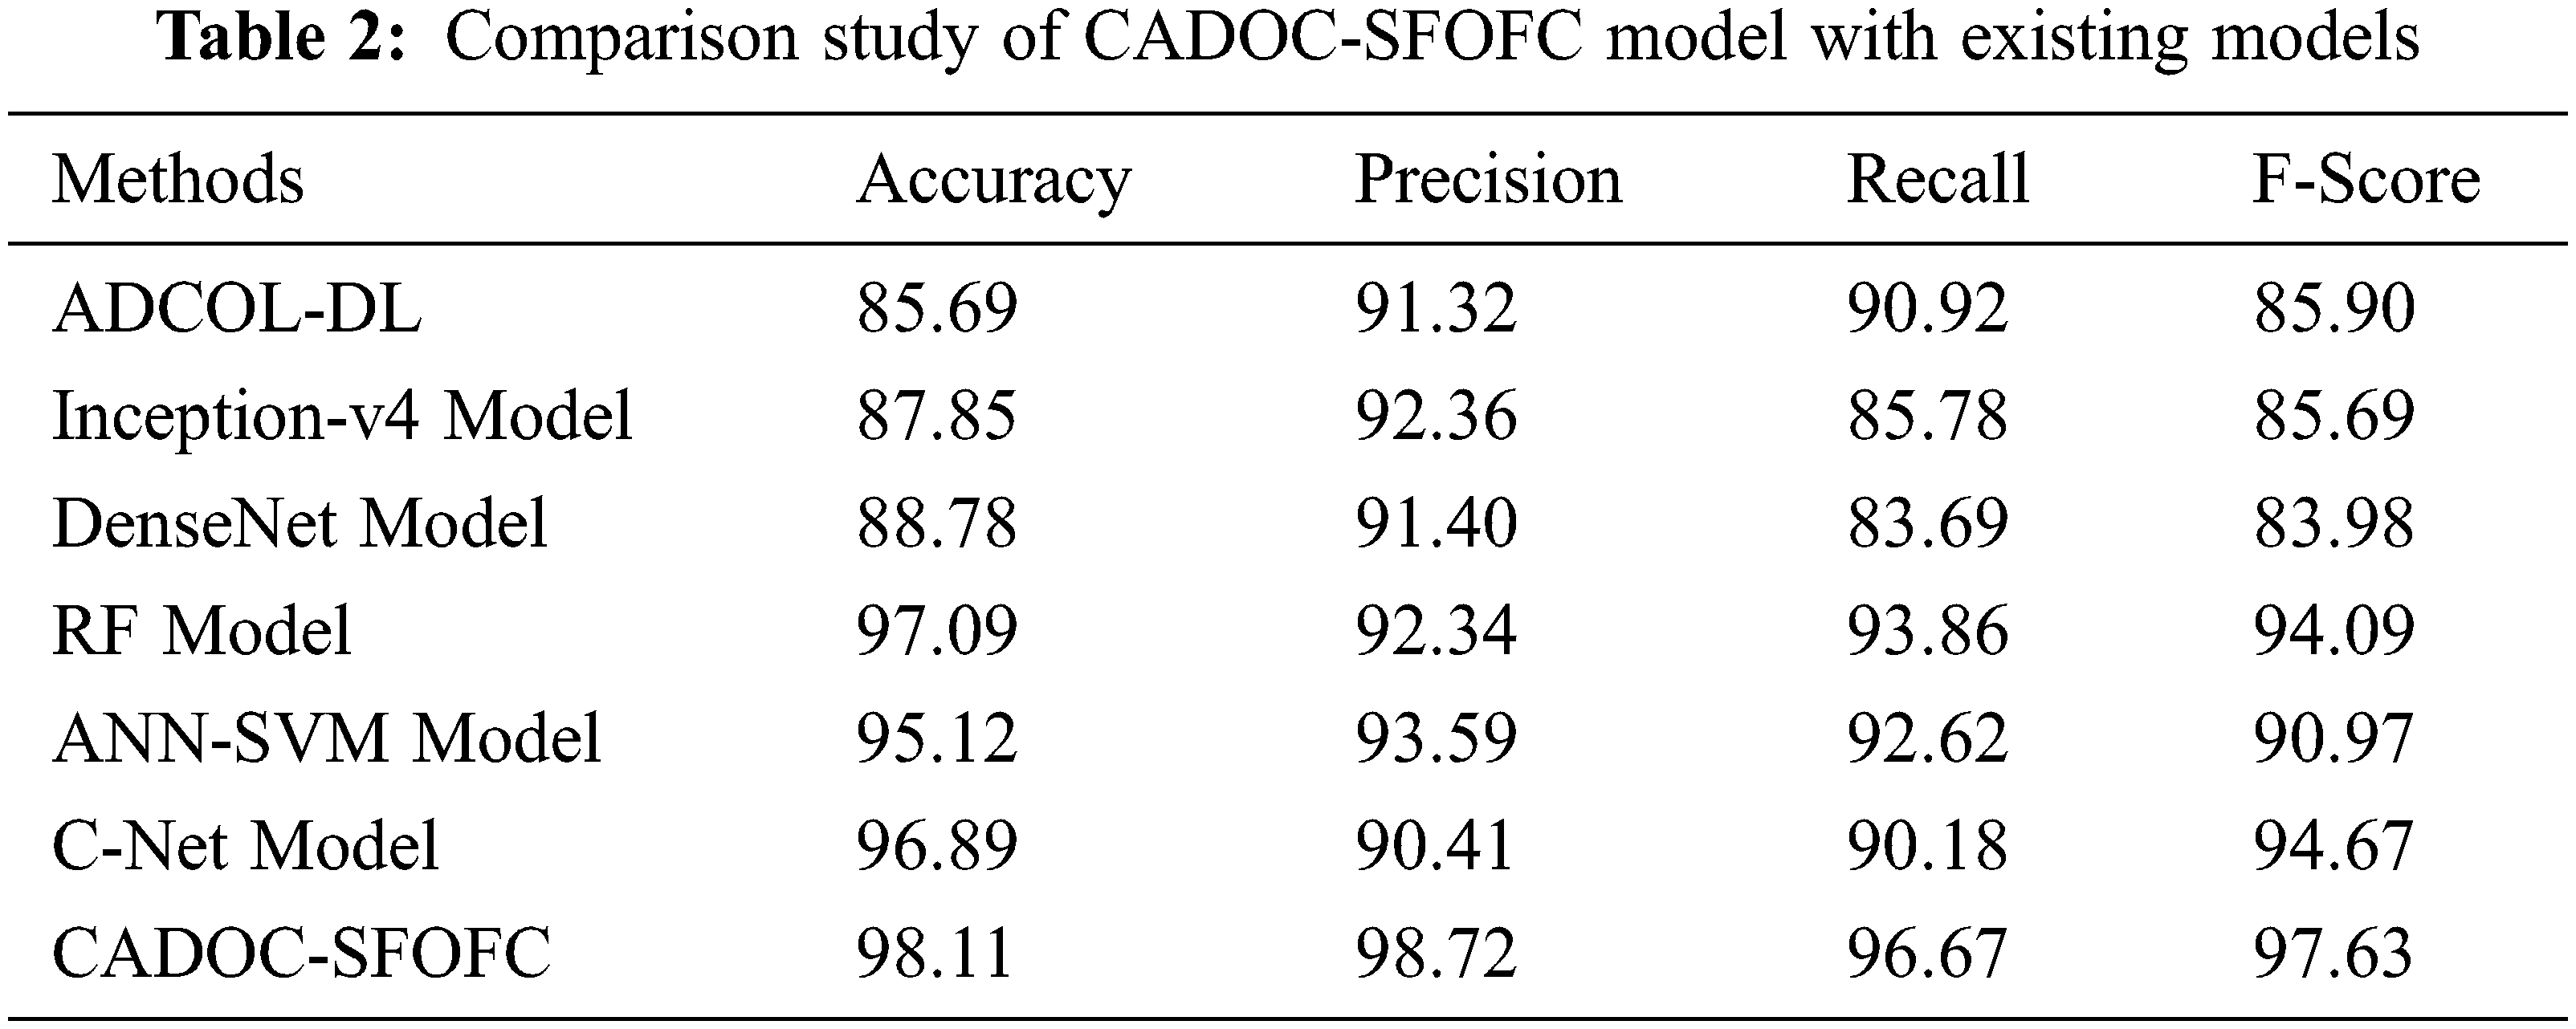

Figure 10: Comparative analysis of CADOC-SFOFC model with recent approaches
The enhanced performance of the CADOC-SFOFC model is due to the inclusion of SFO based parameter optimization process. After investigating the above mentioned results and discussion, it can be ensured that the CADOC-SFOFC model has the ability to outperform the other methods with improved OC classification outcomes.
In this study, a novel CADOC-SFOFC model has been devised to determine the existence of OC on medical images. Initially, the CADOC-SFOFC model carried out the fusion based feature extraction procedure using VGGNet-16 and ResNet model. In addition, feature vectors are fused and passed into the ELM model for classification process. Finally, the SFO algorithm is utilized for effective parameter selection of the ELM model, consequently resulting in enhanced performance. The experimental analysis of the CADOC-SFOFC model was tested on Kaggle dataset and the results reported the betterment of the CADOC-SFOFC model over the compared methods. Therefore, the CADOC-SFOFC model has maximum potential as an inexpensive and non-invasive tool which supports screening process and enhances the detection efficiency. In future, the detection efficiency can be improvised by the design of advanced DL based classifier models.
Funding Statement: The authors extend their appreciation to the Deanship of Scientific Research at King Khalid University for funding this work under grant number (RGP 2/142/43). Princess Nourah bint Abdulrahman University Researchers Supporting Project number (PNURSP2022R151), Princess Nourah bint Abdulrahman University, Riyadh, Saudi Arabia. The authors would like to thank the Deanship of Scientific Research at Umm Al-Qura University for supporting this work by Grant Code: 22UQU4310373DSR13. This research project was supported by a grant from the Research Center of the Female Scientific and Medical Colleges, Deanship of Scientific Research, King Saud University.
Conflicts of Interest: The authors declare that they have no conflicts of interest to report regarding the present study.
References
1. Y. Kim, J. W. Kang, J. Kang, E. J. Kwon, M. Ha et al., “Novel deep learning-based survival prediction for oral cancer by analyzing tumor-infiltrating lymphocyte profiles through CIBERSORT,” OncoImmunology, vol. 10, no. 1, p. 1904573, 2021. [Google Scholar]
2. S. B. Khanagar, S. Naik, A. A. A. Kheraif, S. Vishwanathaiah, P. C. Maganur et al., “Application and performance of artificial intelligence technology in oral cancer diagnosis and prediction of prognosis: A systematic review,” Diagnostics, vol. 11, no. 6, p. 1004, 2021. [Google Scholar]
3. M. P. Kirubabai and G. Arumugam, “Deep learning classification method to detect and diagnose the cancer regions in oral MRI images,” Medico-Legal Update, vol. 21, no. 1, p. 462, 2021. [Google Scholar]
4. R. Dharani and S. Revathy, “DEEPORCD: Detection of oral cancer using deep learning,” in Journal of Physics: Conf. Series, Int. Conf. on Innovative Technology for Sustainable Development 2021 (ICITSD 2021), Chennai, India, vol. 1911, p. 012006, 2021. [Google Scholar]
5. X. R. Zhang, X. Sun, W. Sun, T. Xu and P. P. Wang, “Deformation expression of soft tissue based on BP neural network,” Intelligent Automation & Soft Computing, vol. 32, no. 2, pp. 1041–1053, 2022. [Google Scholar]
6. X. R. Zhang, J. Zhou, W. Sun and S. K. Jha, “A lightweight CNN based on transfer learning for COVID-19 diagnosis,” Computers Materials & Continua, vol. 72, no. 1, pp. 1123–1137, 2022. [Google Scholar]
7. R. K. Gupta and J. Manhas, “Improved classification of cancerous histopathology images using color channel separation and deep learning,” Journal of Multimedia Information System, vol. 8, no. 3, pp. 175–182, 2021. [Google Scholar]
8. G. E. V. Landivar, J. A. B. Caballero, D. H. P. Moran, M. A. Q. Martinez and M. Y. L. Vazquez, “An analysis of deep learning architectures for cancer diagnosis,” in CIT 2020: Artificial Intelligence, Computer and Software Engineering Advances, Advances in Intelligent Systems and Computing Book Series. Vol. 1326. Cham: Springer, pp. 19–33, 2021. [Google Scholar]
9. J. H. Yoo, H. G. Yeom, W. Shin, J. P. Yun, J. H. Lee et al., “Deep learning based prediction of extraction difficulty for mandibular third molars,” Scientific Reports, vol. 11, no. 1, p. 1954, 2021. [Google Scholar]
10. K. B. Bernander, J. Lindblad, R. Strand and I. Nyström, “Replacing data augmentation with rotation-equivariant CNNs in image-based classification of oral cancer,” in Iberoamerican Congress on Pattern Recognition, CIARP 2021: Progress in Pattern Recognition, Image Analysis, Computer Vision, and Applications, Lecture Notes in Computer Science Book Series. Vol. 12702. Cham: Springer, pp. 24–33, 2021. [Google Scholar]
11. B. Song, S. Sunny, S. Li, K. Gurushanth, P. Mendonca et al., “Bayesian deep learning for reliable oral cancer image classification,” Biomedical Optics Express, vol. 12, no. 10, p. 6422, 2021. [Google Scholar]
12. G. Tanriver, M. S. Tekkesin and O. Ergen, “Automated detection and classification of oral lesions using deep learning to detect oral potentially malignant disorders,” Cancers, vol. 13, no. 11, pp. 2766, 2021. [Google Scholar]
13. S. Camalan, H. Mahmood, H. Binol, A. L. D. Araújo, A. R. S. Silva et al., “Convolutional neural network-based clinical predictors of oral dysplasia: Class activation map analysis of deep learning results,” Cancers, vol. 13, no. 6, p. 1291, 2021. [Google Scholar]
14. J. H. Lim, C. S. Tan, C. S. Chan, R. A. Welikala, P. Remagnino et al., “D’OraCa: deep learning-based classification of oral lesions with mouth landmark guidance for early detection of oral cancer,” in Annual Conf. on Medical Image Understanding and Analysis, MIUA 2021: Medical Image Understanding and Analysis, Lecture Notes in Computer Science Book Series, Cham, Springer, vol. 12722, pp. 408–422, 2021. [Google Scholar]
15. H. Lin, H. Chen, L. Weng, J. Shao and J. Lin, “Automatic detection of oral cancer in smartphone-based images using deep learning for early diagnosis,” Journal of Biomedical Optics, vol. 26, no. 08, pp. 086007–086017, 2021. [Google Scholar]
16. K. Simonyan and A. Zisserman, “Very deep convolutional networks for largescale image recognition,” arXiv: 1409.556, 2014. [Google Scholar]
17. K. He, X. Zhang, S. Ren and J. Sun, “Deep residual learning for image recognition,” in 2016 IEEE Conf. on Computer Vision and Pattern Recognition (CVPR), Las Vegas, NV, USA, pp. 770–778, 2016. [Google Scholar]
18. M. A. Khan, I. Ashraf, M. Alhaisoni, R. Damaševičius, R. Scherer et al., “Multimodal brain tumor classification using deep learning and robust feature selection: A machine learning application for radiologists,” Diagnostics, vol. 10, no. 8, p. 565, 2020. [Google Scholar]
19. S. Aziz, E. A. Mohamed and F. Youssef, “Traffic sign recognition based on multi-feature fusion and ELM classifier,” Procedia Computer Science, vol. 127, no. 13, pp. 146–153, 2018. [Google Scholar]
20. S. Shadravan, H. R. Naji and V. K. Bardsiri, “The sailfish optimizer: A novel nature-inspired metaheuristic algorithm for solving constrained engineering optimization problems,” Engineering Applications of Artificial Intelligence, vol. 80, no. 14, pp. 20–34, 2019. [Google Scholar]
21. G. Tanriver, M. S. Tekkesin and O. Ergen, “Automated detection and classification of oral lesions using deep learning to detect oral potentially malignant disorders,” Cancers, vol. 13, no. 11, pp. 2766, 2021. [Google Scholar]
22. R. A. Welikala, P. Remagnino, J. H. Lim, C. S. Chan, S. Rajendran et al., “Automated detection and classification of oral lesions using deep learning for early detection of oral cancer,” IEEE Access, vol. 8, pp. 132677–132693, 2020. [Google Scholar]
23. S. Panigrahi, J. Das and T. Swarnkar, “Capsule network based analysis of histopathological images of oral squamous cell carcinoma,” Journal of King Saud University - Computer and Information Sciences, vol. 25, no. 6, p. S1319157820305280, 2020. [Google Scholar]
Cite This Article
 Copyright © 2023 The Author(s). Published by Tech Science Press.
This work is licensed under a Creative Commons Attribution 4.0 International License , which permits unrestricted use, distribution, and reproduction in any medium, provided the original work is properly cited.
 Downloads
 Citation Tools