
 Submit a Paper
 Propose a Special lssue
 Open Access
ARTICLE

Complete Cototal Roman Domination Number of a Graph for User Preference Identification in Social Media
Department of Mathematics, Noorul Islam Centre for Higher Education, Kumaracoil, 629175, India
* Corresponding Author: J. Maria Regila Baby. Email:
Computer Systems Science and Engineering 2023, 45(3), 2405-2415. https://doi.org/10.32604/csse.2023.032240
Received 11 May 2022; Accepted 14 June 2022; Issue published 21 December 2022
 View Full Text
 Download PDF
Abstract
Many graph domination applications can be expanded to achieve complete cototal domination. If every node in a dominating set is regarded as a record server for a PC organization, then each PC affiliated with the organization has direct access to a document server. It is occasionally reasonable to believe that this gateway will remain available even if one of the scrape servers fails. Because every PC has direct access to at least two documents’ servers, a complete cototal dominating set provides the required adaptability to non-critical failure in such scenarios. In this paper, we presented a method for calculating a graph’s complete cototal roman domination number. We also examined the properties and determined the bounds for a graph’s complete cototal roman domination number, and its applications are presented. It has been observed that one’s interest fluctuate over time, therefore inferring them just from one’s own behaviour may be inconclusive. However, it may be able to deduce a user’s constant interest to some level if a user’s networking is also watched for similar or related actions. This research proposes a method that considers a user’s and his channel’s activity, as well as common tags, persons, and organizations from their social media posts in order to establish a solid foundation for the required conclusion.Keywords
Social media platforms are an essential component of any digital marketing or long-term growth plan. A 3-star graph may be used to represent an interconnected social media marketing plan. The 3-star nodes represent social media, while the edges indicate direct communication links between two social media. So, in this architecture, 11 social media platforms are directly linked as shown in Figs. 1 and 2. Applications that try to personalize content by addressing an individual’s preferences or requirements might benefit from features such as user profile management, which necessitates a grasp of the user’s preferences.
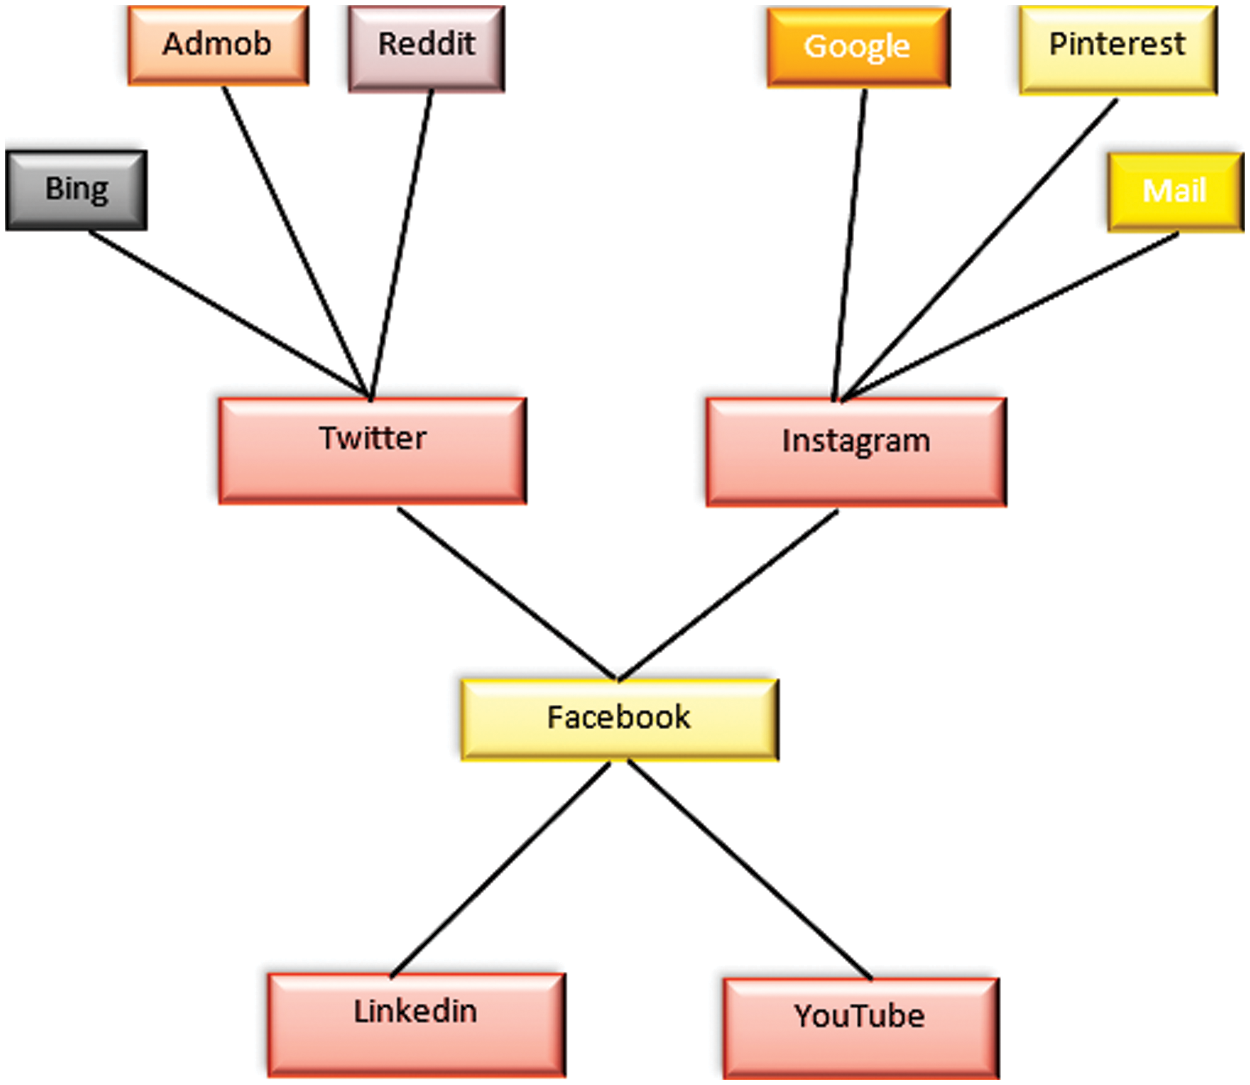
Figure 1: Social media advertising network
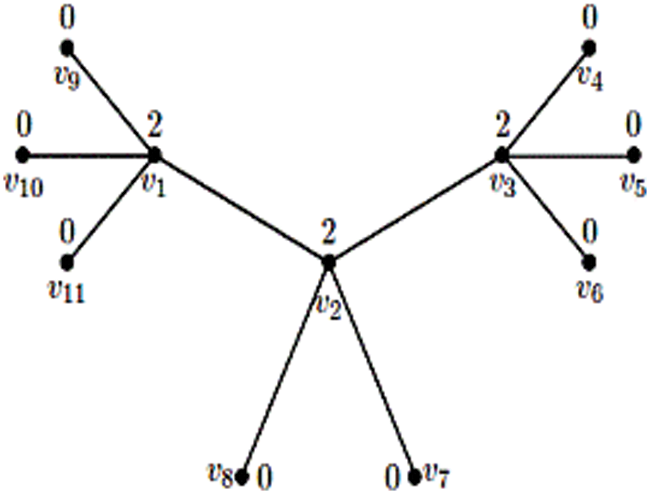
Figure 2: The graph structure for the above network
When there is no official knowledge of a user or when there is a cold start, studying the individual on social networks is a good idea. Facebook, Twitter, LinkedIn, and experience and understanding sites like Quora and Stack Overflow can all provide useful data of users; for example, looking at a person’s Facebook activity can reveal what is going on in their life. Likewise, Twitter reveals a lot about a woman’s domain, and one may develop a user’s career path by looking at their LinkedIn profile and activity. The primary source of news, such as location, interests, and talents, is the user’s social network profile.
Our goal is to promote any product that can successfully reach our followers at a cheap cost. So, we pick a limited group of social media sites known as advertising platforms, and each platform sends its product data to one of the small groups of advertising platforms. We are aware that virtually all other social networking sites have advertising possibilities as well. We’ve seen companies get up to 200 new followers each month by spending under $10 per day on advertising.
As a result, the expense of advertising is high. We may use complete cototal roman domination in this approach to decrease advertising costs. Assume three main popularizing media as strong support nodes in a three-star network. As a result, we find a complete cototal roman dominating set throughout all platforms. If a client paid greater weightage (assign 2) to strong support nodes for advertising, the client does not have to pay anything for the other platforms. This might lower the advertising costs. In the field of social media user interest modelling, alternative techniques have been presented, primarily work-around textual, topic modelling and topic categorization in the recommendation of items relevant to their interests from news and other sharing information web portals. Furthermore, understanding becomes quite helpful for an organization. It aids in increasing staff productivity and directing them in the proper direction.
Social network analysis is a group of graph theory based techniques that can be used to retrieve meaningful knowledge from networks formed by various followers. In the recent past, Complete Cototal Roman Domination (CCRD) techniques have been rapidly increasing their advance in a wide variety of applications and systems. Due to powerful computers, emerging and widely adapted platforms such as Facebook, Twitter, Instagram, and many others social media network analysis has become a commonly used approach to interpersonal connections analysis. Data about relationships of people are commonly available like never before, and applying analytical methods to them became a source of unique and valuable knowledge. The main aim of this paper is to present the application of CCRD methods to retrieve meaningful information, from commonly used social media platforms. The goal of the presented case studies is to show that CCRD can be a strong technique to investigate interpersonal connections. However, the application of CCRD has some limitations and requirements for input data.
This paper is further organized as follows: Section 2 describes related work in the domain of user interest modeling. In Section 3, the approach of this paper has been explained with derivation and evaluation of results in Section 4 and concluded with a glimpse of future work in Section 5.
Jiang et al. [1] had developed a HITS Latent Dirichlet Allocation approach that uses a combination of distinguish developing interests and high-influence persons from related users and their activities, we improved Hypertext Induced Topic Search (HITS)and Latent Dirichlet Assignment. Algorithm’s strategy Users’ communal interests can be more precisely and successfully divided using the Label Propagation Algorithm and Content-based filtering.
Dhelim et al. [2] had proposed a new technique for mining user interests based on the Big Five personality traits and dynamic interests, the bag-of-words hypothesis is relaxed. They ignore the fact that the user’s character could be a rich source to inter the topical preferences are deceptively reflected, which relaxes the bag-of-words insinuation. An interesting research direction is to develop a model that can reflect various rates of return.
Shi et al. [3] had developed an influence of general events is first removed using a hot event automatic filtering method, this enhances the event extraction process’ quality. A new user-interest model is added during the development of important events, which integrates the short texts of each cluster into a single long text file. Making determining the general topic in terms of each user’s interest dispersion easier.
Kang et al. [4] proposed architecture includes Youtube as a source of external information for bridging the semantic divide between traditional news sources and social media A short text and a news individual categories term-based attributes are transformed into Wikipedia-based aspects like Wikipedia division and article items.
Kim et al. [5] had proposed a The PCS Model (The combination of users’ A fruitful approach of combining customer preferences for sharing content within the bounds of localities and social media network data PCS Model (Place-Content-Social-Network-based Content Sharing) was a fruitful approach of incorporating user preferences for sharing components within the bounds of regions and social network data (place-content-social-network-based content sharing). In next-generation mobile computing settings, the context can be used to integrate user interests, location, and social network information at the same time, resulting in a smart and trust-enhancing method of content sharing.
Abbasi et al. [6] had proposed a Temporal user Topic (TUT) is a temporal user topic strategy that takes into account the text of any user’s tweet as well as the time of the tweet. It’s used to find Users who are topically similar during various periods. These users’ interests and relationships develop over time.
Ivaschenko et al. [7] innovative A model for formalizing social media user behaviour that may be used to integrate many social media sites, import data, and analyze it using modern Big Data analytic tools. This method can be used to record an online user’s activities a. by combining human and temporal variables. A software solution for social network analysis was created, allowing for the detection of positive and negative patterns in user focus development.
Chao et al. [8] had developed a system for merging to mine the spread of user preferences, and linguistic and visual elements of consumer social media data are used. User interest mining, feature extraction, and model training to acquire training and test data, we chose boards from popular Pinterest users.
Kulli et al. [9] proposed the Cototal Domination and established some results for these parameters. Anupama et al. [10] introduced several properties of cototal edge dominating sets and gave some bounds on the cototal edge dominating number.
Basavanagoud et al. [11], investigated two open problems related to complete cototal domination in graphs and provided bounds and some exact values for
Cockayne et al. [12] pioneered the concept of Roman domination. Emperor Constantine stipulated that an army or legion could be dispatched from its home to defend a neighboring location only if a second army remained to protect the home. As a result, there are two groups of armies: stationary and moving armies. Each vertex (city) that does not have an army must be surrounded by a vertex that does. Stationary armies then dominate their vertices, and the stationary army rules a vertex with two armies, while the moving army rules the open neighbors.
Liedloff et al. [13], provided a linear time algorithm for determining the Roman domination number in interval graphs, as well as other polynomial time algorithms for determining the Roman domination number in special classes of graphs.
Pushpam et al. [14] pioneered the study of edge Roman dominating function, defining certain characteristics and computing edge Roman domination number of Path and Cycle.
Liu et al. [15] presented the idea of Total Roman domination. Total Roman domination in graphs demands that each vertex in a graph (representing a place in the Roman Empire) be secure in the sense that at least one of its surrounding locations must have a legion stationed there. As a result, if a place is attacked, a legion from a neighboring location can be dispatched to defend it.
3 Complete Cototal Roman Domination Activities in Social Media
In this paper, we consider G as a connected, undirected graph without loops and multiple edges. Let
The technique for inferring user preferences is broken into two sections in this article:
The attention extrapolated from the users’ behaviour that another user follows is referred to as a small niche. Fig. 2 depicts the theoretical flow of determining niche interest. To do so, the network graph of user u is constructed using his Twitter public API following list. It is based on the properties graph model, which is executed using the Neo4j graph database. The built property graph shows a two-level network of persons you follow on social media, each with their own set of properties and a relationship. The channel’s depth can be increased to greater depths. Because the user follows others from a variety of domains, he is either engaged in or from the same domain. As a result, taking into account a networking user who goes ahead in detail, as shown in Fig. 1, reinforces the results. The numerous subdomains to which other users in u’s connection belong are deduced and used once more. An action graph for each node is formed using tweets received from all user nodes in the above-created network of a user as illustrated. The network of hashtags, persons and organizations referenced in tweets is represented by this Created activity graph. To retrieve persons and organizations that the user references in tweets, the Stanford Named Entity Recognition (NER) (3 class classifier) from Harvard core NLP (Natural Language Processing) library is used. These are the most crucial features of the tweets that were sent out. Finally, to establish niche interest, a proportional aggregate of these items from the entire network is inferred.
3.2 Inferring General Interest
People and organizations are evaluated in this step of inferring a user’s general interests are developed from specific interests as mentioned If a person identify certain people or organizations in a tweet, the User Interest Modelling from the Social Media Network Graph domain to which they belong may be of importance to him, according to the data. That domain is thought to be of general user interest. The ontology of person and organization is utilized to derive it. It aids in the extraction of structured data from Wikipedia. Other users on Twitter whom user ‘u’ likes, who are well-known organizations or are experts in some field and have Wikipedia material, their domain of knowledge is also obtained using a DB pedia. Inference’s intellectual flow is of common interest.
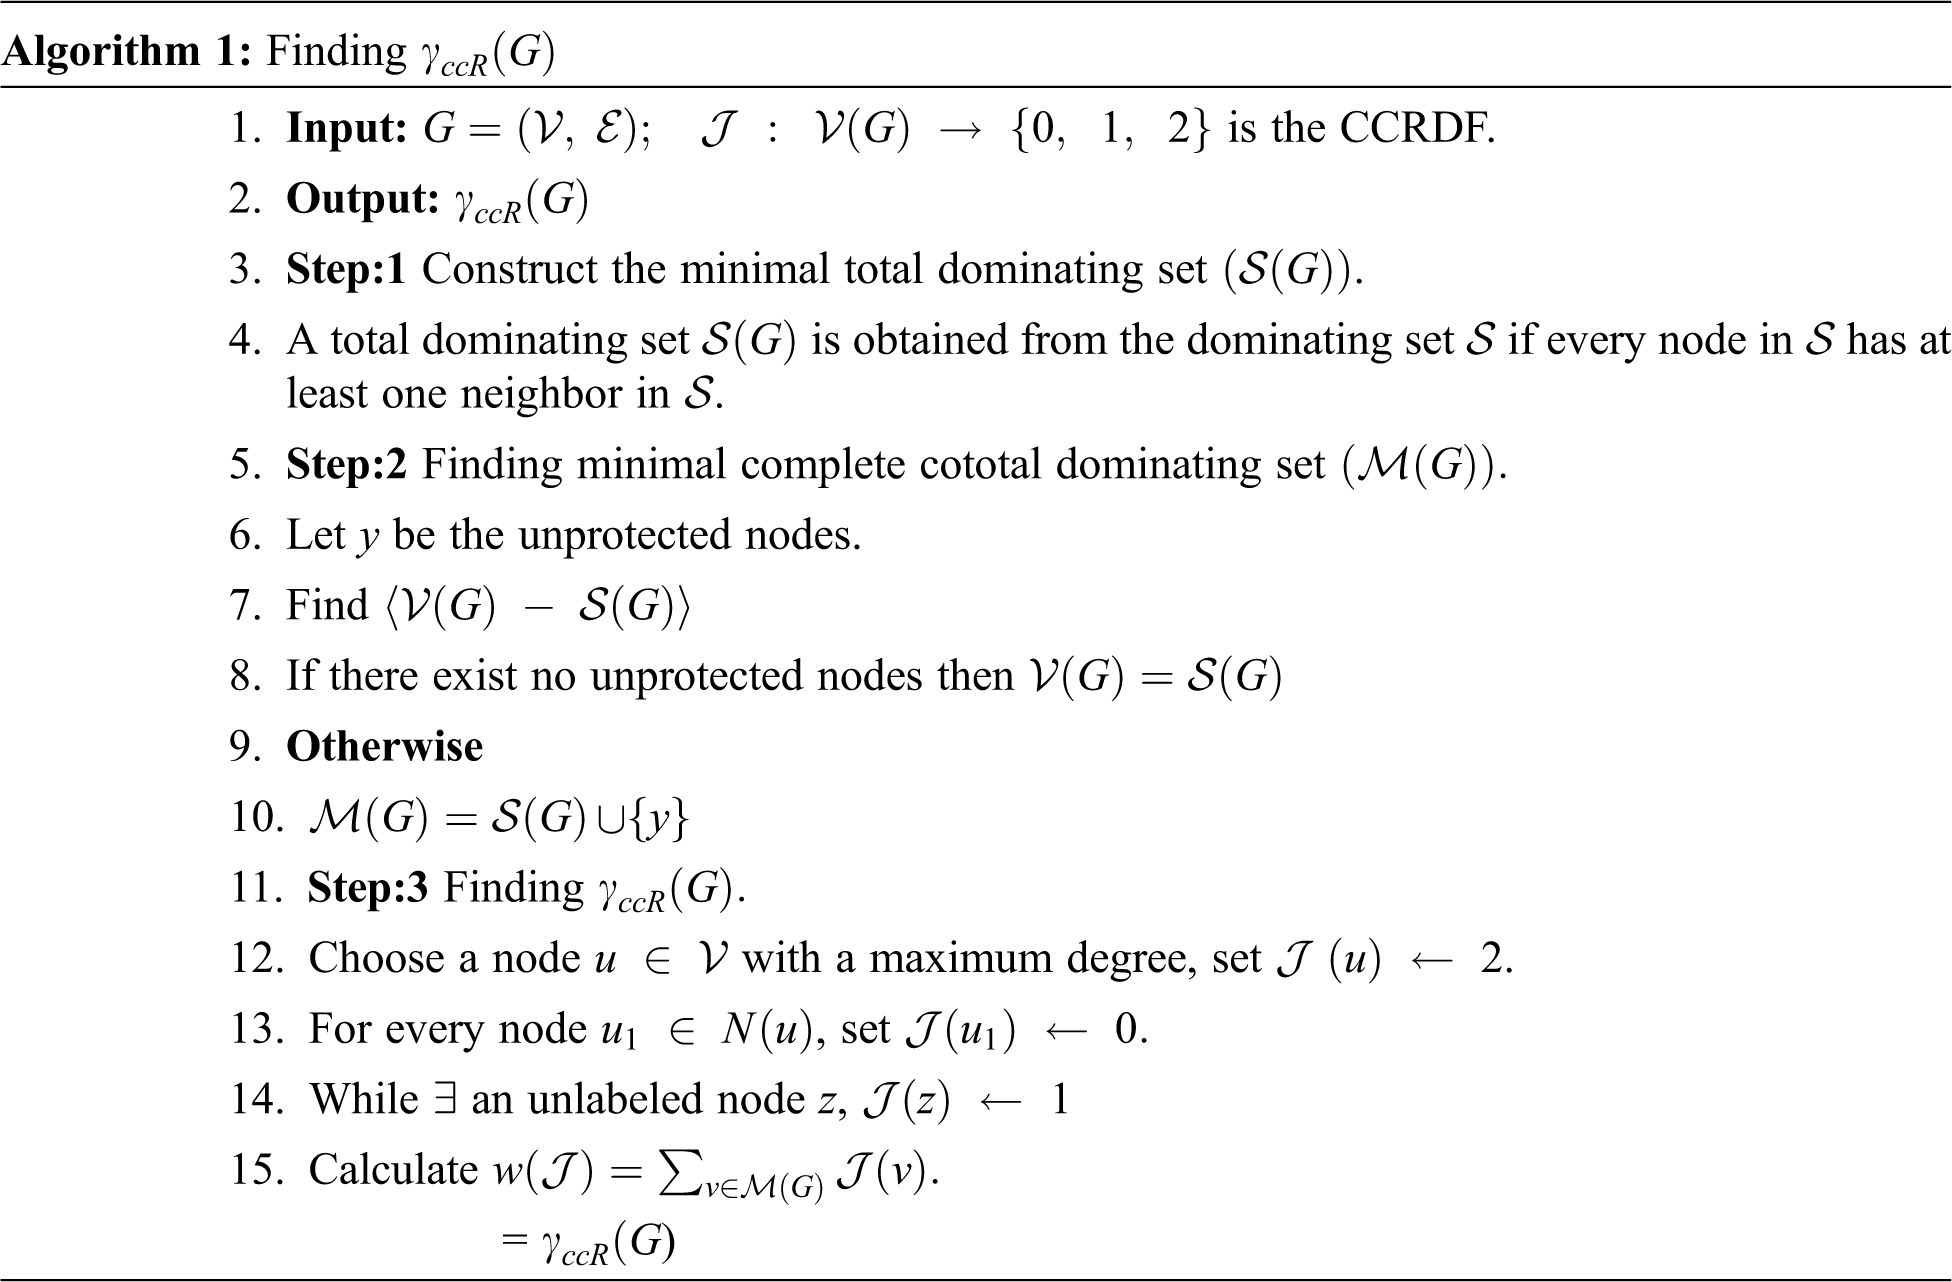
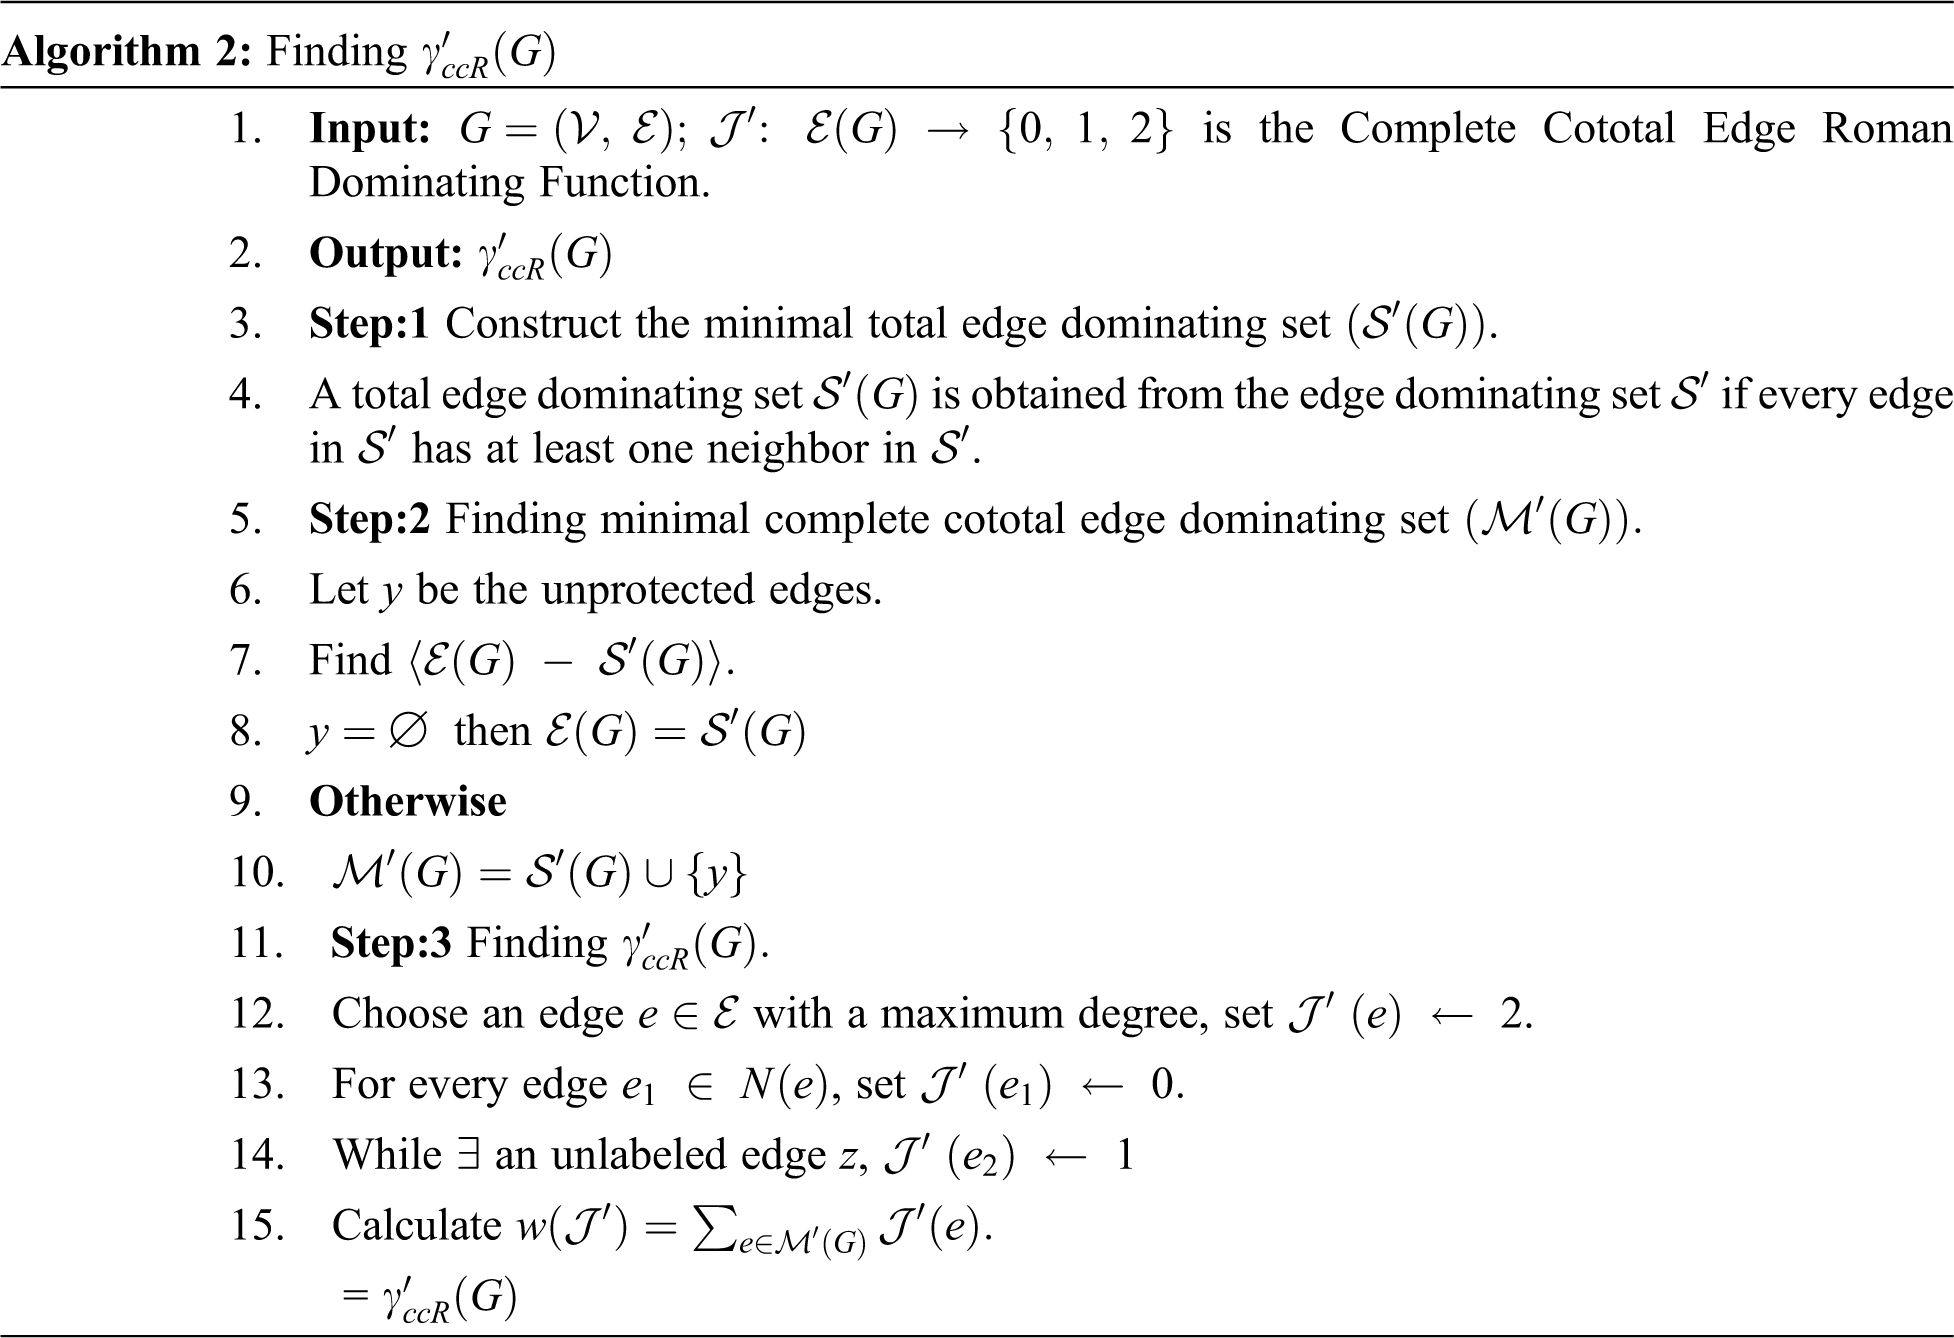
3.3 Complete Cototal Roman Domination Number of Certain Graphs
Definition 1: A Total Roman Dominating Function is called a Complete Cototal Roman Dominating Function (CCRDF)
Properties 1: A graph G with
i)
ii) If y is a support node and x is a leaf in G, then
iii) If w has a minimum of three pendant nodes, then
3.3.1 Theorems on Complete Cototal Roman Domination Number
After studying the fundamental features of the Complete Cototal Roman domination number, it will be highly beneficial to examine the specific instances of Complete Cototal Roman domination to obtain a more direct grasp of this concept. To accomplish so, we’ll show the value of
Observations 1
Observations 2
In a remote area of the earth, we have a collection of tiny settlements. We installed radio transmitters in several of these communities so that messages may be transmitted to every village in the area. The radio station’s transmission range is limited. To reach all of the communities, we’ll need to set up numerous stations. It’s incredibly expensive, therefore we utilize Complete Cototal Roman Domination concepts to find as few as possible so that all of the villagers are benefited. To do so, pick a community that is close to a lot of other villages and set up a radio station there.
This paper presented a changes in user preferences over time that can be portrayed using this strategy of developing a time as a property of a node in a user’s connection and activity graph and keywords referenced in tweets and facebook. A user’s interest is best known to himself. Taking this into consideration, the proposed method is examined by focusing on Twitter users in our immediate vicinity, which comprises both regular and infrequently users. Figs. 3 and 4 shows the network pattern of a user on face book.
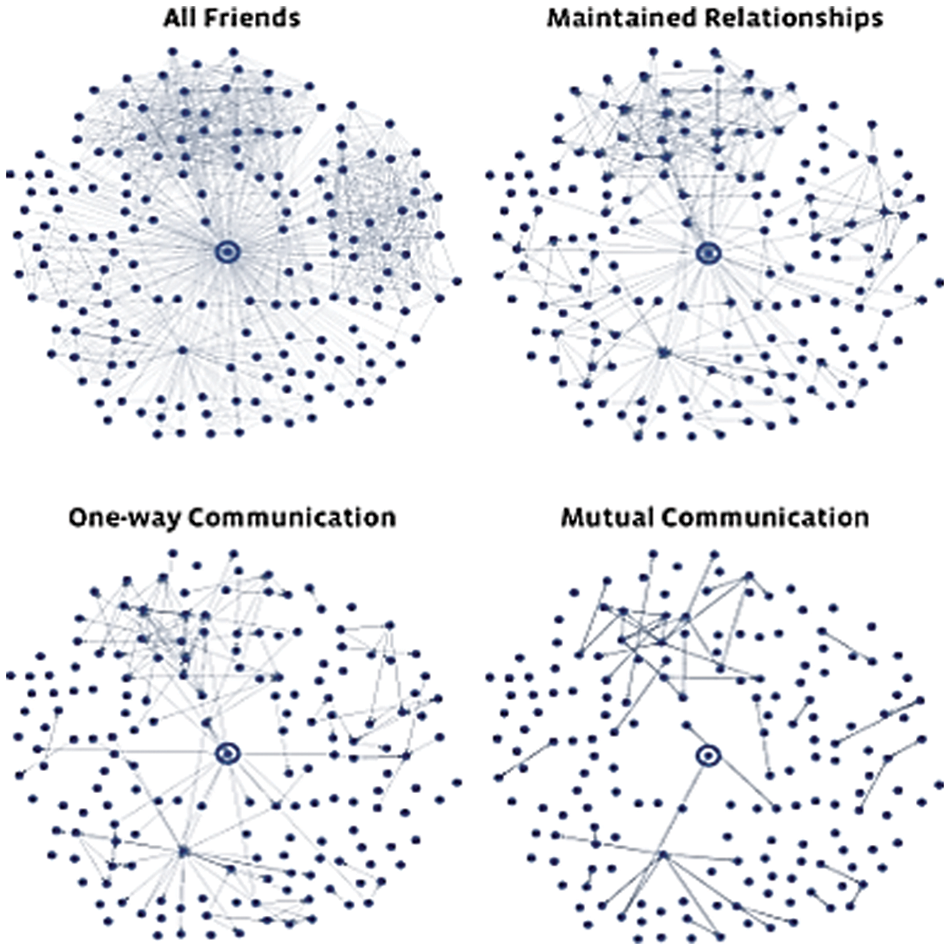
Figure 3: Network pattern of a user on facebook
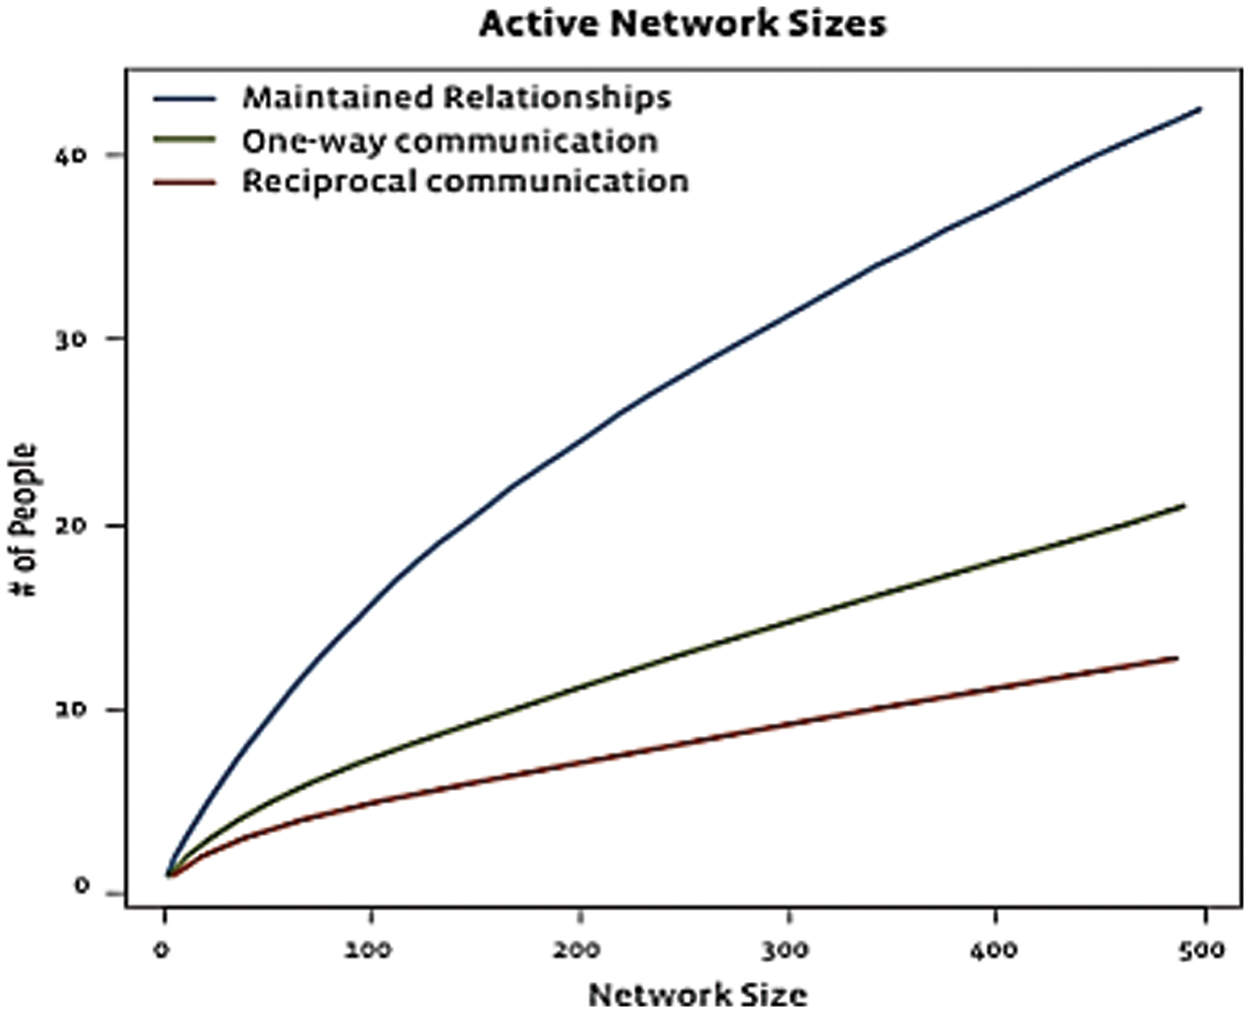
Figure 4: Graphical representation
The size of Facebook networks is depicted in this case study. A month of research was conducted on a group of random users, and the results were classified into four different network patterns.
All Friends: This approach to cybersecurity a user’s whole list of friends, making it the largest of all the depictions.
Reciprocal Communication: This diagram depicts the mutual communication between two parties; a network of this type arises when two parties share information between two parties’ information.
One-way Communication: It is made up of people with whom a user has exchanged messages.
Maintained Relationships: People whose profiles have been checked by the user more than once to sustain engagement make up this type of interaction.
The number of reciprocal ties shown in the picture, the number of one-way relationships shown in the green line, and the number of passive connections shown in the blue line, are all a consequence of the size of your network.
Figs 5a–5d show the results, which include degree, betweenness, eigenvector centrality and community detection measurements. We can see from the testing results that the computed closeness centrality for most nodes in the test network is comparable, with low values. The findings support theories concerning social networks’ free-scale character. Furthermore, the closeness estimated values for all nodes in the network are positive, implying that large values for one measurement for a single node lead to greater values for other metrics.
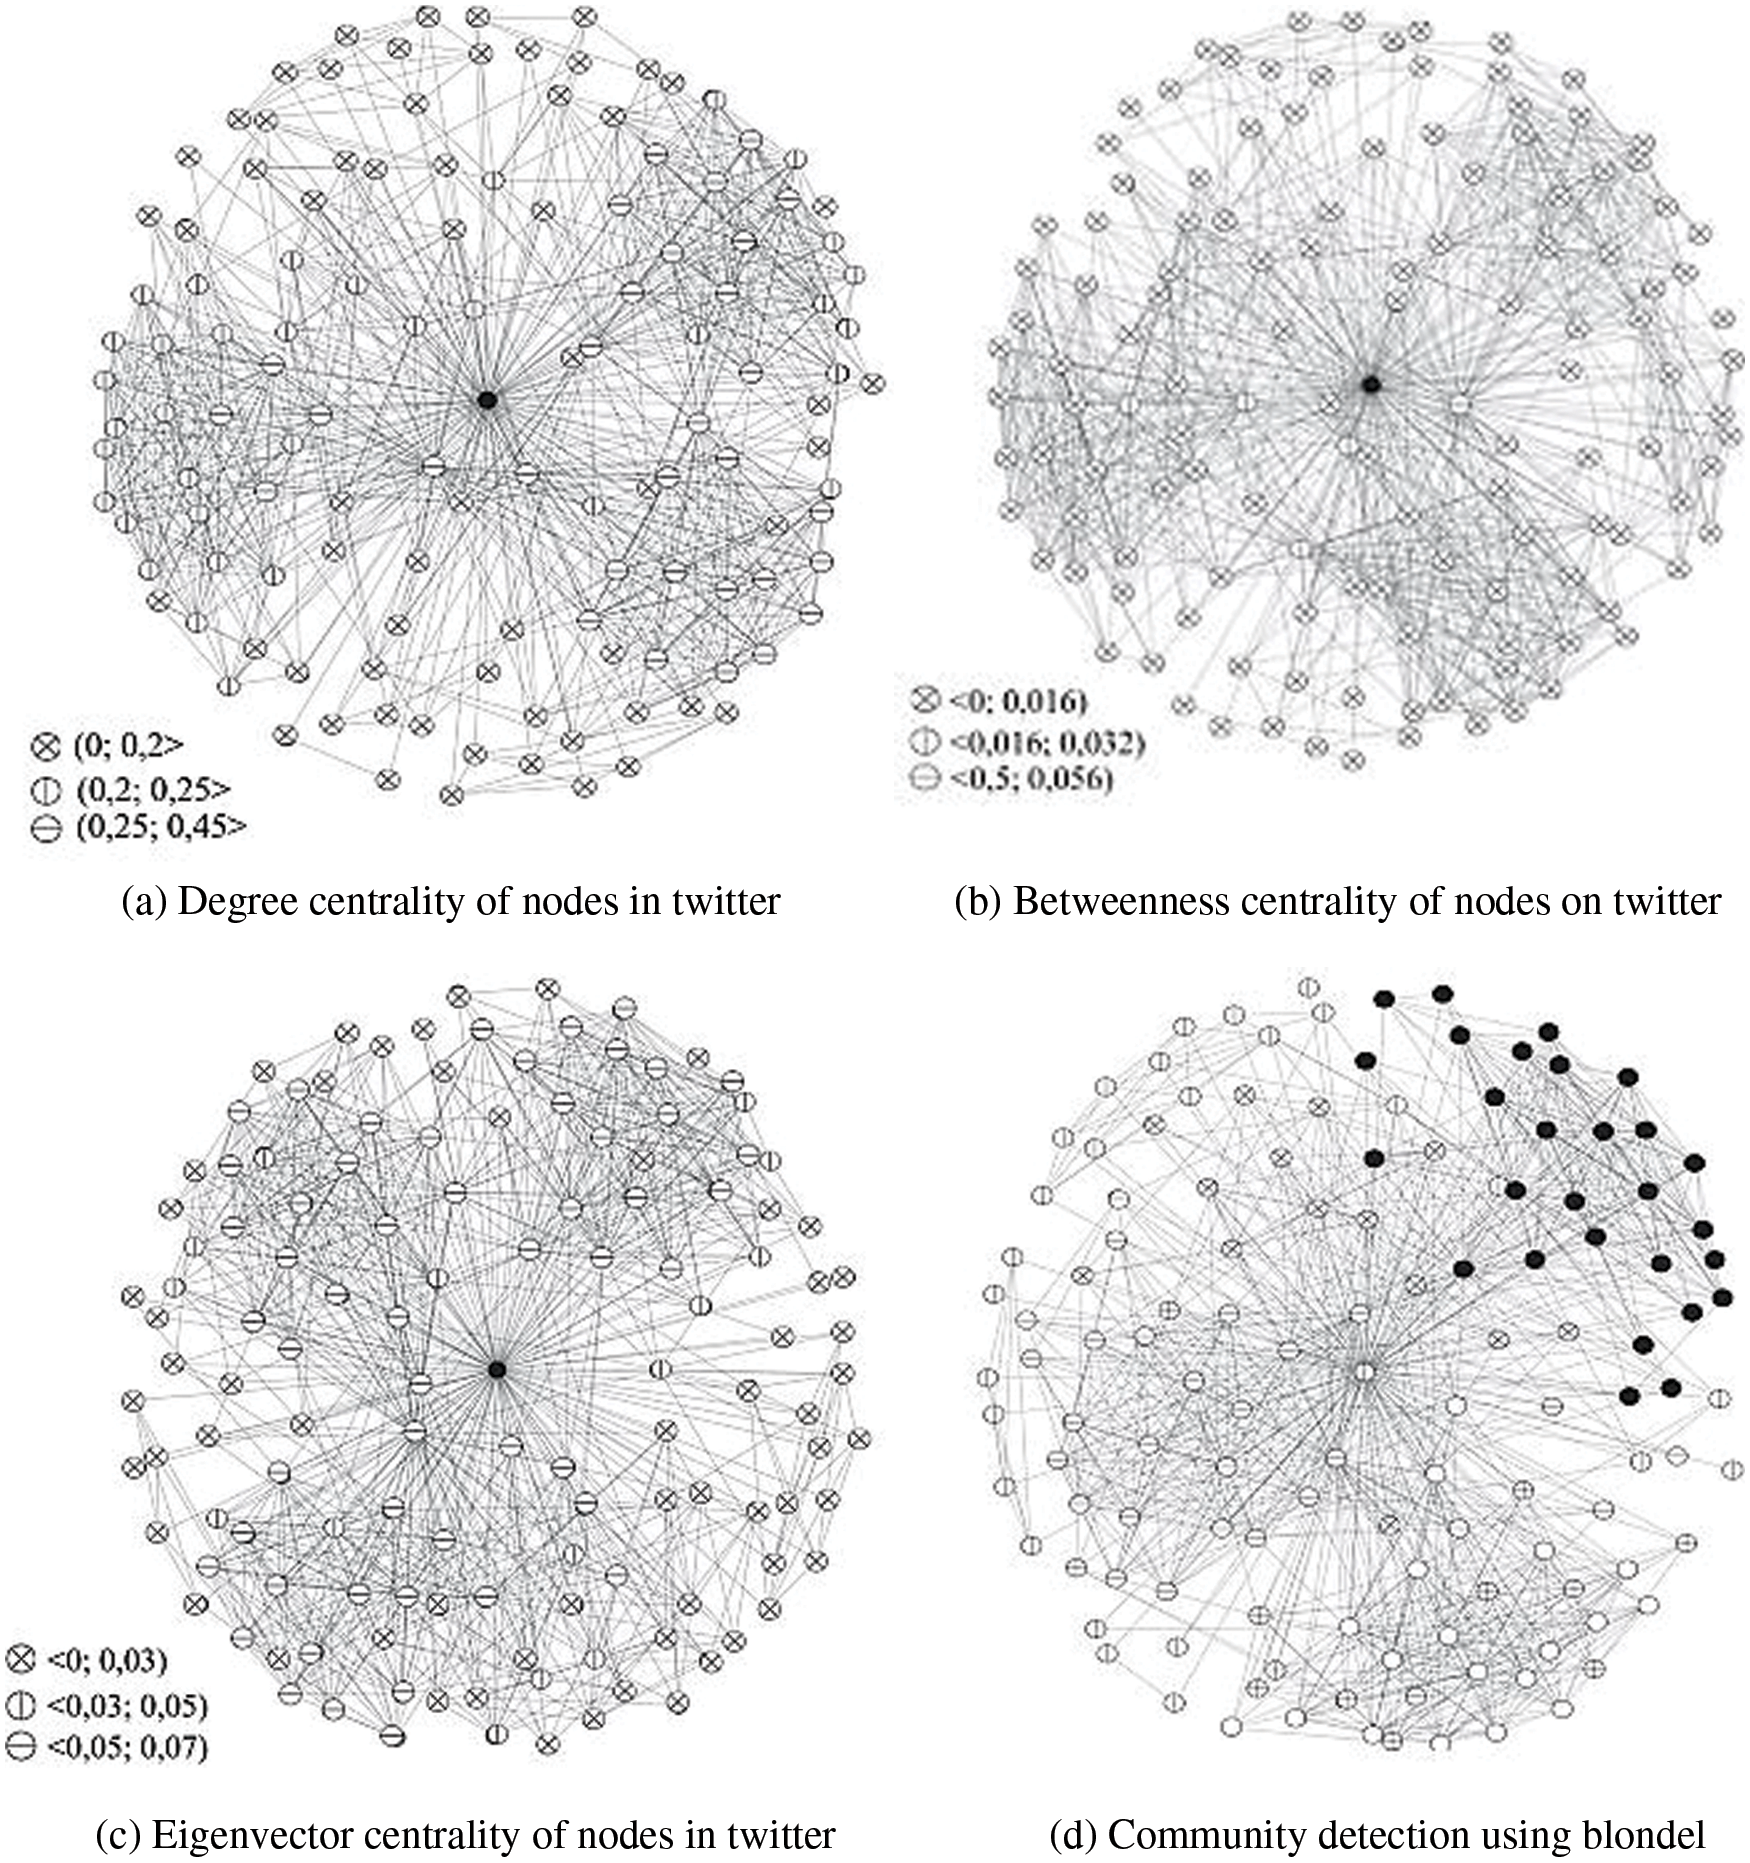
Figure 5: Network pattern of a user on twitter
In Fig. 6 shows the computed distributions, while Fig. 7 shows the Retweet distribution, which accounts for roughly 70% of all tweets. Networks based on topics, such as Twitter, are typical scale-free systems, according to our experiments. Fig. 7 depicts a complete cototal roman domination of the “India” network, which is a rare outcome. This system can be caused by a variety of agents with high importance.
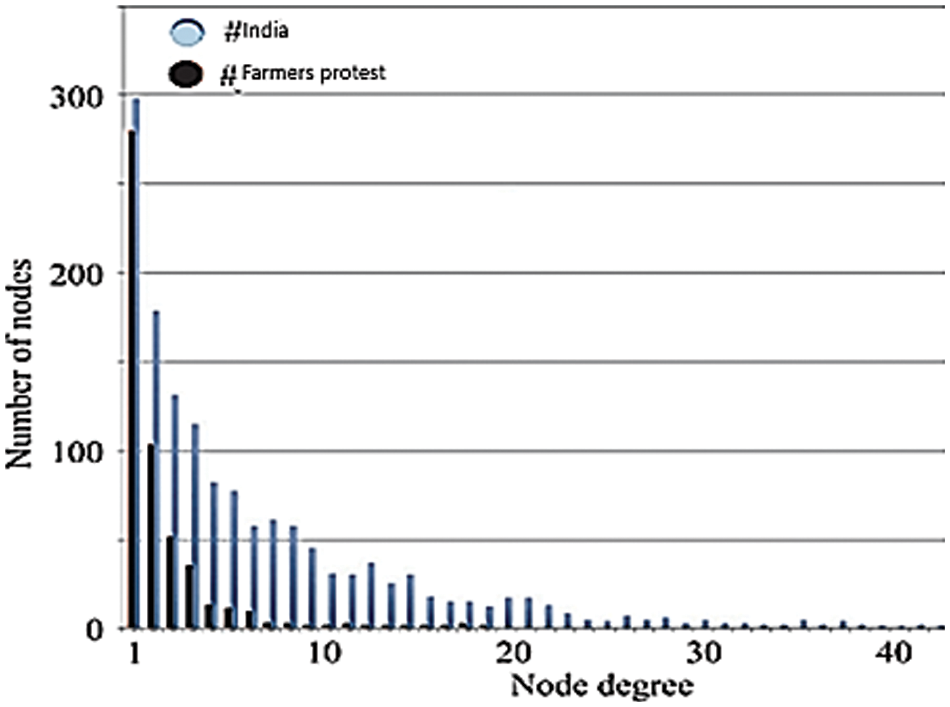
Figure 6: Degree distribution; the twitter network
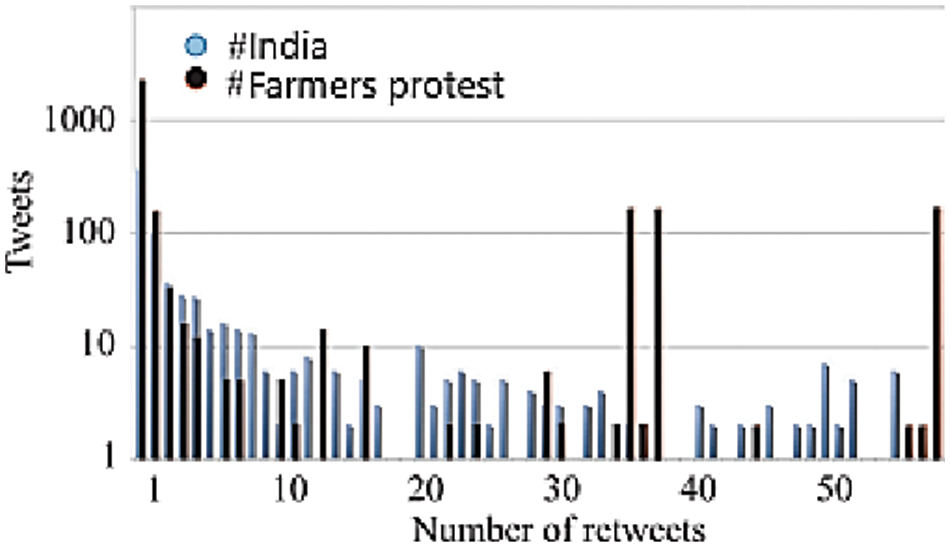
Figure 7: Retweet distribution using approximately 70% of tweets
The many elements of graphs and their basic properties have been explored in this study. Graphs are employed in social networks, which are becoming more sophisticated as technology advances. These complete cototal roman domination graphs are used to minimize the complexity of networks and to better comprehend them research for real-life social networks were carried out on Facebook and Twitter, two important social media sites. Twitter and Facebook are both typical social media networks, according to the research. A complete cototal roman domination of the “India” network, which is a rare outcome. This system can be caused by a variety of agents with high importance. The strategy was shown to be quite good for inferring interest even when the user was not very engaged, according to the evaluation. Aside from that, changes in user interest are mirrored throughout time. In future work the concept of CCRD is extended to other protection strategies.
Acknowledgement: We would like to thank the supervisors and the anonymous referees for their kind help in this research.
Funding Statement: The authors received no specific funding for this study.
Conflicts of Interest: The authors declare that they have no conflicts of interest to report regarding the present study.
References
1. L. Jiang, L. Shi, L. Liu, J. Yao and M. E. Ali, “User interest community detection on social media using collaborative filtering,” Wireless Networks, vol. 28, pp. 1169–1175, 2022. [Google Scholar]
2. S. Dhelim, N. Aung and H. Ning, “Mining user interest based on personality-aware hybrid filtering in social networks,” Knowledge-Based Systems, vol. 206, pp. 106227, 2020. [Google Scholar]
3. L. L. Shi, L. Liu, Y. Wu, L. Jiang and J. Hardy, “Event detection and user interest discovering in social media data streams,” IEEE Access, vol. 5, pp. 20953–20964, 2017. [Google Scholar]
4. J. Kang and H. Lee, “Modeling user interest in social media using news media and wikipedia,” Information Systems, vol. 65, pp. 52–64, 2017. [Google Scholar]
5. J. T. Kim, J. H. Lee, S. Kim and I. K. Kim, “Social contents sharing model and system based on user location and social network,” in Proc. IEEE Third Int. Conf. on Consumer Electronics Berlin (ICCE-Berlin), Berlin, Germany, pp. 314–318, 2013. [Google Scholar]
6. R. Abbasi, G. Rehman, J. Lee, F. M. Riaz and B. Luo, “Discovering temporal user interest on twitter by using semantic based dynamic interest finding model (TUT),” in Proc. IEEE 2nd Information Technology, Networking, Electronic and Automation Control Conf. (ITNEC), Chengdu, China, pp. 743–747, 2017. [Google Scholar]
7. A. Ivaschenko, A. Khorina, V. Isayko, D. Krupin, V. Bolotsky et al., “Modeling of user behavior for social media analysis,” in Proc. Moscow Workshop on Electronic and Networking Technologies (MWENT), Moscow, Russia, pp. 1–4, 2018. [Google Scholar]
8. F. Y. Chao, J. Xu and C. W. Lin, “Mining user interests from social media by fusing textual and visual features,” in Proc. Asia-Pacific Signal and Information Processing Association Annual Summit and Conf. (APSIPA), Jeju, Korea (Southpp. 1–8, 2016. [Google Scholar]
9. V. Kulli, B. Janakiram and R. R. Iyer, “The cototal domination number of a graph,” Journal of Discrete Mathematical Sciences and Cryptography, vol. 2, no. 2–3, pp. 179–184, 1999. [Google Scholar]
10. S. Anupama, Y. Maralabhavi and V. Goudar, “Cototal edge domination number of a graph,” Malaya Journal of Matematik, vol. 4, no. 2, pp. 325–337, 2016. [Google Scholar]
11. B. Basavanagoud and S. Hosamani, “Complete cototal domination number of a graph,” Journal of Scientific Research, vol. 3, no. 3, pp. 547–555, 2011. [Google Scholar]
12. E. J. Cockayne, P. A. Dreyer Jr, S. M. Hedetniemi and S. T. Hedetniemi, “Roman domination in graphs,” Discrete Mathematics, vol. 278, no. 1–3, pp. 11–22, 2004. [Google Scholar]
13. M. Liedloff, T. Kloks, J. Liu and S. L. Peng, “Efficient algorithms for roman domination on some classes of graphs,” Discrete Applied Mathematics, vol. 156, no. 18, pp. 3400–3415, 2008. [Google Scholar]
14. P. R. L. Pushpam and T. M. Mai, “Edge roman domination in graphs,” J. Combin. Math. Combin. Comput, vol. 69, pp. 175–182, 2009. [Google Scholar]
15. C. H. Liu and G. J. Chang, “Upper bounds on roman domination numbers of graphs,” Discrete Mathematics, vol. 312, no. 7, pp. 1386–1391, 2012. [Google Scholar]
Cite This Article
 Copyright © 2023 The Author(s). Published by Tech Science Press.
This work is licensed under a Creative Commons Attribution 4.0 International License , which permits unrestricted use, distribution, and reproduction in any medium, provided the original work is properly cited.
 Downloads
 Citation Tools