
 Submit a Paper
 Propose a Special lssue
 Open Access
ARTICLE

Human Stress Recognition by Correlating Vision and EEG Data
SRM Institute of Science and Technology, Department of Data Science and Business Systems, School of Computing, Kattankulathur, 603203, Tamilnadu, India
* Corresponding Author: S. Praveenkumar. Email:
Computer Systems Science and Engineering 2023, 45(3), 2417-2433. https://doi.org/10.32604/csse.2023.032480
Received 19 May 2022; Accepted 29 June 2022; Issue published 21 December 2022
A correction of this article was approved in:
Correction: Human Stress Recognition by Correlating Vision and EEG Data
Read correction
 View Full Text
 Download PDF
Abstract
Because stress has such a powerful impact on human health, we must be able to identify it automatically in our everyday lives. The human activity recognition (HAR) system use data from several kinds of sensors to try to recognize and evaluate human actions automatically recognize and evaluate human actions. Using the multimodal dataset DEAP (Database for Emotion Analysis using Physiological Signals), this paper presents deep learning (DL) technique for effectively detecting human stress. The combination of vision-based and sensor-based approaches for recognizing human stress will help us achieve the increased efficiency of current stress recognition systems and predict probable actions in advance of when fatal. Based on visual and EEG (Electroencephalogram) data, this research aims to enhance the performance and extract the dominating characteristics of stress detection. For the stress identification test, we utilized the DEAP dataset, which included video and EEG data. We also demonstrate that combining video and EEG characteristics may increase overall performance, with the suggested stochastic features providing the most accurate results. In the first step, CNN (Convolutional Neural Network) extracts feature vectors from video frames and EEG data. Feature Level (FL) fusion that combines the features extracted from video and EEG data. We use XGBoost as our classifier model to predict stress, and we put it into action. The stress recognition accuracy of the proposed method is compared to existing methods of Decision Tree (DT), Random Forest (RF), AdaBoost, Linear Discriminant Analysis (LDA), and K-Nearest Neighborhood (KNN). When we compared our technique to existing state-of-the-art approaches, we found that the suggested DL methodology combining multimodal and heterogeneous inputs may improve stress identification.Keywords
Human Activity Recognition understands, deduces, and defines with the help of a series of careful observations, the various activities, and goals undertaken by the subject human. Human actions produce an array of successive motions resulting in a need to model it to recognize the activity efficiently and automatically. Human activities can be categorized into four groups [1], the first is a gesture, which is a prominent physical movement that represents some particular message. It does not usually involve a verbal conversation or communication. The second is action; It is a series of substantial emotions like anger, disgust, fear, happiness, sadness, surprise, neutrality, and others. The third is interactions, a set of movements performed by at least one main subject that is a human and the counterpart may be another human or an object, if more than two such entities account for interaction then it may form the fourth and the last category that is the group activity.
Changes in the autonomic nervous system (ANS), which includes the sympathetic and parasympathetic nervous systems (SNS and PNS), are manifested in physiological signals as a result of mental stress. A person under mental stress, for example, has a highly stimulated SNS relative to the PNS, which raises the heart rate (HR) and respiration rate (RESP) but lowers the heart rate variability (HRV). Furthermore, since physiological signals are recorded via wearable devices, mental stress may be monitored continually. Although the notion of merging data streams from several sources to accomplish a goal seems simple, there are significant challenges to overcome. Using data from several sources, such as sensors, to anticipate outcomes has shown to be more successful.
Changes in the operator’s mental state may be connected to task-related stress assessment. Negative emotions such as worry, wrath, and dissatisfaction, for example, may accompany stress. Facial analysis of emotions and Electrocardiogram (ECG) signal has been studied in psychology and physiology for over four decades. Nonetheless, since human emotional behavior is nuanced and multimodal, affective computing systems still face a significant barrier in detecting human emotions from picture sequences.
Human Activity Recognition (HAR) is among the peak research domains but it is a very complicated task, because of the numerous issues and barriers like background, variations in activities, differences in behavior from person to person, and many more are very relevant. The human activity recognition methods can be broadly divided into the approach using Vision and the one using Sensors. Vision-based human activity recognition [2] relies on tools for visually sensing data through higher frame-rate video devices like cameras, video recorders, CCTV (Closed Circuit Television) cameras, and others. And hence, it is understandable that this method relies mostly on the quality of the image that is produced from the tools in use.
The sensor-based HAR similarly relies on the use of sensors and underlying mathematical models by directly measuring the response through linked sensors. The recognition of Human activity, using non-obtrusive sensing measures has gotten great attention he recent times. Areas including both research and the commercial industries have started realizing the potential that lies in it. As the semiconductor-related researches and technologies expand and progress, more sensors are becoming cost-effective. Like, sensors such as accelerometers and gyroscopes which were earlier less accessible are now widely used. These advancements have made the sensors much more reachable, lightweight and portable due to their small size, and energy efficiency due to the low energy consumption. It is no wonder that the use of sensors has so extensively increased and they are seen embedded in multiple devices around us today.
With the help of deep neural networks, the classification as as shown in Fig. 1 become much simpler as it eliminates the need for heuristic parameters and allows recognition of complex behavior as well as tasks. Multiple surveys have also shown that deep learning methods provide more efficient results than other techniques for feature-based human activity recognition [3,4]. CNN and the LSTM (Long-Short-Term Memory) are being widely used for the same reason [5]. However multiple factors could affect how the results are determined. Even though sensor-based recognition is a very promising HAR method, it can have limitations of its own. It’s also important to note that commonly available public datasets [6] might not be fully enough for recognizing tasks performed under different contexts such as contexts or outdoor activities and focusing on either one-video-based or sensor-based data could have drawbacks, as both, they are not free from errors [7,8]. We have thus been motivated to research a new method that would combine both of these essential techniques of human activity recognition for a more robust analysis.
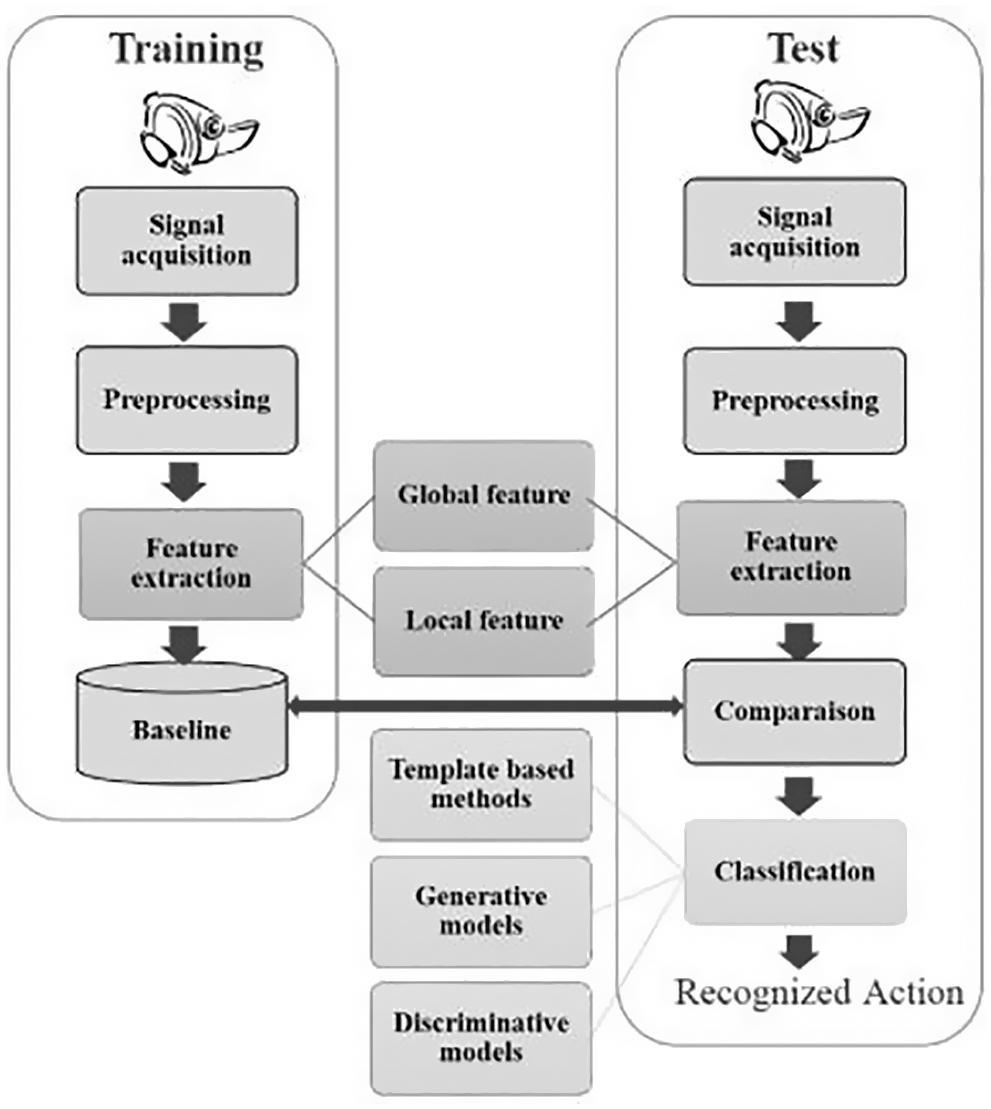
Figure 1: General layout of HAR system
In our research work, we aim to define the novel use of these human activity recognition techniques for the recognition of stress. Stress can be defined as mental or physical tension. Stress is becoming an increasing problem in our world and India. It has become a part of our everyday routine, and several people suffer due to it. Stress starts arising and can be seen very commonly in our in-born “fight-or-flight” responses [9] when we are put under short-term stress situations. Another type of stress is episodic stress which occurs when stressful times are more frequently seen but are periodically overcome. Lastly, chronic stress is the most harmful stress which persists for a very long time. It is of utmost importance that the stress of chronic levels is avoided, and hence detecting stress at earlier levels is very important so that it does not become fatal. The short-term consequences of stress can be very serious such as distraction, inability to perform, and king wrong or illegal actions which can impact a person, community, nation, or worldwide. The long-term consequences of stress affect health in a very damaging way, they can cause various musculoskeletal issues and chronic diseases [10]. Relevant data shows that prolonged stress or even deep penetrating short-term stress can lead to a person taking fatal steps.
It is a well-known fact that stress might not be outwardly visible. Hence, when using the above-said human activity recognition methods error-prone results may be obtained [11]. For example, when it comes to sensor-based data, the heart rate of a person could go to abnormal levels in times of stress but when reading only this data in isolation it is also possible that the same abnormal levels apply to a person doing some heavy physical activity, he or she may or may not be stressed. On the other hand, if we choose to filter out such conditions then we could miss out on instances such as a person running to the flight, where the person is stressed buy or may not be accounted for when only measuring inputs from sensors since no visual data here is available [12,13]. A similar applies when accounting for vision-based data.
The two methods [14] of human activity recognition as shown in Fig. 2 have drawbacks of their own like the vision-based human activity recognition is easily impacted by external factors including lighting condition, clothing color, image background, and so on. Sensor-based human activity recognition is also similarly im external factors [15] like pressure, heat, force, and others depending on the conditions it is being used in. Also, the mathematical modeling lying under a given sensor may not be completely confirmed to be the most efficient model for handling the problem at hand [16,17]. Hence, in our proposed research, we are establishing the understanding and need to combine the visual and sensor-based human activity recognition systems to get much more robust, efficient, timely, and error-free results.
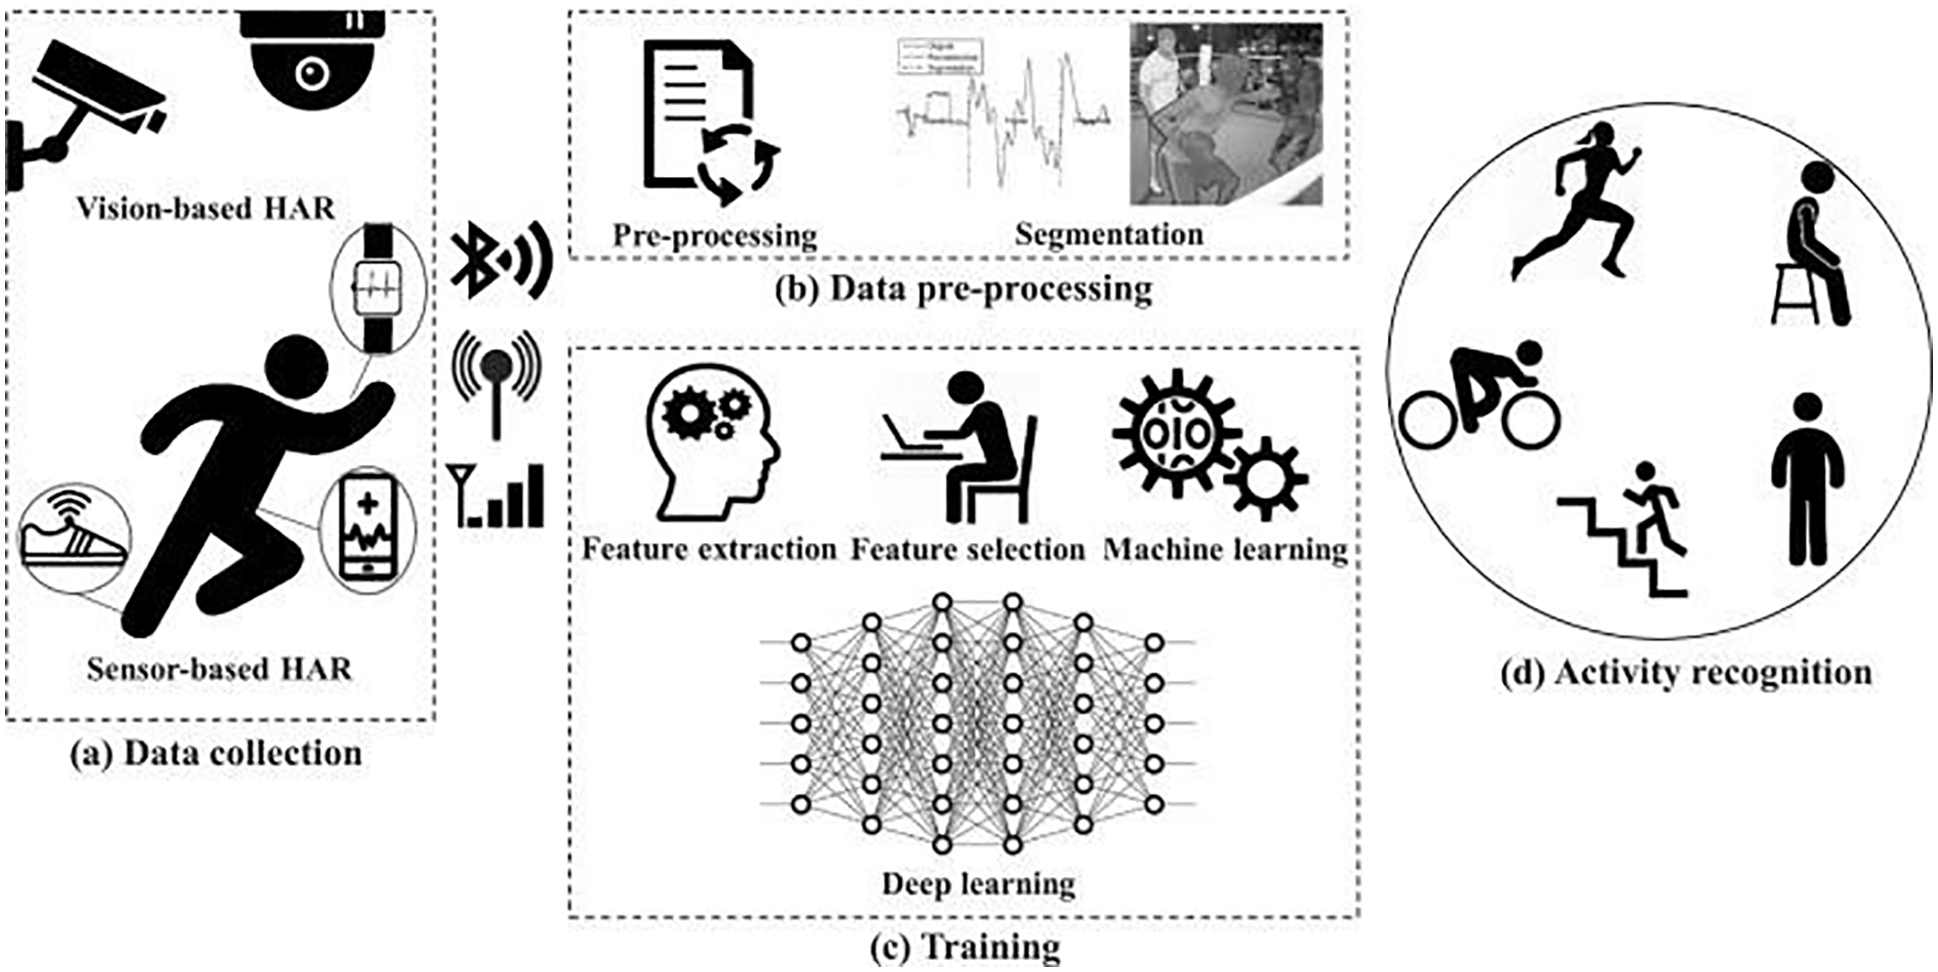
Figure 2: Understanding the common steps in sensor-based + vision-based human activity recognition
The utilization of multimodal and heterogeneous signals allows for more accurate stress detection since fused characteristics from many signals are employed instead of single-signal features. Because emotional traits cannot be retrieved from physiological data, the study [18] made use of face features. Attempting to utilize all information together, on the other hand, necessitates an ideal fusion technique, which increases the computing load and puts a strain on the data capacity. As a result, researchers should evaluate the usefulness of multimodal and heterogeneous signals when designing stress detection systems.
Based on the modalities offered in the dataset, the paper [19] analyses novel approaches to using the SWELL-KW (SWELL-Knowledge Work) dataset to predict stress levels and job load. For the predictions, they employed several multimodal fusion algorithms and compared and reported the best one. In [20], they offered a systematic investigation of unimodal and multimodal methods for emotional state analysis through valence and arousal prediction. The research has focused on employing valence and arousal markers to identify stress and predict mood. The stress levels for non-intrusive operator status monitoring will be easily deduced from speech and face information using the values anticipated by the underlying unimodal and multimodal model solutions.
In the visual modality, a multimodal strategy employs sequential temporal CNN and LSTM with an Attention Weighted Average layer [21]. They look at local and global descriptors including Mel-frequency cepstral coefficients, i-vector embeddings, and Fisher-vector encodings as a second modality. The multimodal-fusion technique employs a mechanism known as “late-fusion,” which entails combining unimodal model outputs as decision engine inputs.
The idea of the mental state has become a need in the well-being arrangement of today. It is basically because of its actuation by stress. The brain’s entrance frameworks are likewise initiated by pressure. The physiological and actual reactions [22] of the body to pressure are frequently associated with the activities of cell phones. Because of the expanding number of sensors and the utilization of versatile stages to break down fluctuated pressure occurrences, we would now be able to consider differed pressure occasions utilizing the accumulated data. Cell phones are additionally used to complete different undertakings. One of these is pressure acknowledgment. This procedure can be utilized to examine physiological information and actual information continuously.
Our literature survey was based on the existing human activity recognition and stress recognition using different methods. Some dealt with sensor-based recognition [23] and some solely depended on the image-based recognition which in the tin end can produce varied results. Human action acknowledgment is frequently alluded to as HAR [24]. It intends to examine and decipher the different activities of people. In any case, it is generally disregarded with regards to changes between genuine exercises. Concerning this particular referred paper [25], the authors have proposed and implemented a technique for perceiving human exercises in a nonstop sensor information stream is proposed. This strategy uses the sliding window method to group the crude sensor information. Using group examination, we can recognize the different sorts of human exercises and their advanced interiors periods. At that point, the sections between nearby human exercises are dissected to decide whether they are momentary or aggravation measures. The Random Forest classifier is utilized to characterize these sections.
Wearable sensors have been the subject of different endeavors to improve the presentation of human action acknowledgment. The advancement of profound learning has incredibly improved the productivity of this field. Despite the widespread adoption of these two techniques (CNN, and LSTM), their implementation is still limited by the complexity of their implementations and the lack of invariance. The case network that is CapsNet with the vector results and directing by acknowledgment is in a spot to get the equivariance. Concerning the particular referred paper [26], the authors have proposed. A container network called SensCapsNet was created to empower perceiving exercises from wearable sensors. Its engineering depends on a dispersed multi-center neural organization. The proposed CapsNet design is assessed by adjusting the dynamic directing between the container layers. This strategy is utilized to think about the presentation of SensCapsNet in contrast to the benchmark strategies [27]. This paper presents an action acknowledgment strategy that uses the 19 non-Sense datasets to recognize exercises in various settings. It is performed utilizing a sensor-based watch and e-Shoes. The proposed technique accomplishes a high precision pace of 80% and is effectively open through a web application.
More often than not, the idea of action acknowledgment is the motivation behind why more often than not, sensors are centered around perceiving predefined exercises. Exercises that are invalid or are out of interest are frequently perceived utilizing numerous sensors [28]. These exercises can be named imbalanced or invalid. The capacity to assemble and dissect information identified with human exercises utilizing distinctive sensor-installed gadgets has made it extremely simple to do such. In this examination, we present a one-dimensional convolution network-based procedure for perceiving human action dependent on the assembled information.
Because of the expanding ubiquity of cell phones with implanted sensors, the requirement for an overall model for continuous acknowledgment of human exercises has gotten more pervasive. This paper presents a profound learning-based methodology that can recognize arbitrary clients dependent on their accelerometer information [29]. They have likewise proposed a strategy that can consequently arrange exercises dependent on worldwide time arrangements. Concerning the paper [30] a wearable sensor that can distinguish the presence of people inside a changing range of 90 degrees is proposed. The framework is made conceivable using an ultra-sonic and PIR (Passive Infrared) sensor, which is both furnished with underlying protection and well-disposed highlights. Its vigor and importance are gotten from the different situations where human collaboration is recognized.
In this referred paper [31], the authors have first discussed the feature selection for the crowd and extraction and offer a multiple frame detection of the feature point and KLT (Kanade-Lucas-Tomasi) tracker-based tracking. They have stated that behavior modeling of the public crowd is coarser when compared to that of particular individuals. Instead of making general crowd behavior models, they offer to model events with the crowded for specified-user instances. Finally, the state of the art of scenarios may be modeled differently from one instance to another and varied models are to be shown.
Therefore, fast modeling is needed and is enabled by the usage of an extended Scenario Recognition Engine in their approach. Event models of the crowd are created; mainly, mixed events accommodating evidence collection allow to increase sensing reliability. Tests are done on real observation video parts which have crowd scenes. The algorithm for tracking crowds proves to be strong and offers a reliable crowd-based motion vector. The detection of crowd events on real instances provides reliable outputs of a few common crowd behaviors by simple committed models.
Human movement acknowledgment (HAR) is beginning to supplant the conventional strategies for grouping and highlight extraction. Because of its developing notoriety, numerous engineers are beginning to investigate profound learning as a possible strategy for different issues like the acknowledgment of actual situations and tricky signals. This paper [32] presents a novel dispersed recommendation that tends to these issues. This reference paper presents an outline of different order techniques that were utilized to distinguish the errands that were performed by sound subjects utilizing their wearable sensors. A decent information mining step is sifting through the missing and anomaly esteems. At that point, extricating or potentially picking highlights are the means that are taken around there. For inertial information, the cycle begins with the computation of time-space and recurrence area qualities.
The four directed grouping techniques [33] specifically, k–Nearest Neighbor, SVM (Support Vector Machine), GMM (Gaussian Mixture Model), and HMM (Hidden Markov Model) are contrasted against one another to assess their exhibition as far as arranging precision, review, F-metric, and explicitness. AR (Activity Recognition) is considered [34] as a characterization issue, where the informatics are time arrangement signals and the yield is a movement class name. In the classification stage, we first concentrate e highlights from inconspicuous crude information and afterward utilize the prepared expectation model to anticipate a movement mark. Feature extraction for Activity Recognition is a significant undertaking, which has been read for a long time. Statistical features like mean, standard deviation, entropy and relationship coefficients, and so on are the most generally utilized hand-made highlights in AR. Wavelet transform and Fourier transform [35] are other two generally utilized hand-made features, while discrete cosine transform (DCT) has likewise been applied with promising outcomes, just as auto-backward model coefficients. As of late, time-delay embeddings have been applied for action acknowledgment. It embraces nonlinear time arrangement investigation to separate highlights from time arrangement and shows a critical enhancement for occasional exercise acknowledgment (cycling includes an intermittent, two-dimensional leg development). Nonetheless, the highlights from time-delay inserting are less appropriate for non-intermittent exercises.
In this reference paper [36], they have proposed a feature extraction technique that depends on a convolutional neural network, which separates nearby reliance and scale changing qualities of the speed increase available arrangement. The CNN model’s [37] capacity to distinguish the characteristics that make up a decent examination has appeared to be at the top tier. Further upgrades could be made to the model to make it more powerful and precise. In our proposed system, we have referred to most of the existing systems and there does not exist a system that includes both sensor-based and video-based based. So, in our system, we have proposed to associate the sensor and video data to get a more refined prediction of stress when compared to the other existing system.
This dataset [38] comprises multimodal measurements taken using off-the-shelf equipment during 16 sessions of around 10-minute-long partnered discussions on a social problem, including video recordings, EEG, and external physiological reactions. It differs from earlier datasets in that it contains emotional analyses from all three aspects: self, debating partner, and outside observers. While watching the discussion clip, raters marked emotional displays every 5 s in terms of physiological and 18 other category emotions.
3.2 The Organizational Structure of CNN
To analyze the visual patch that represented the video frames point and acquire the interest points description of the image, we use a deep CNN structure. Figs. 3 and 4 show the construction of CNN, which consists of six layers: three convolutional layers with a 4*4 kernel and three pooling layers with a 2*1 kernel. A pooling layer follows each convolution layer. The extracted features that are the input to the succeeding layers are automatically generated by the convolutional layers using a set of kernels. Rectified Linear Unit is an approximate algorithm that further cleanses the feature maps (ReLU). Pooling preserves the important attributes in a kernel, deleting the weak elements and lowering the feature dimension.
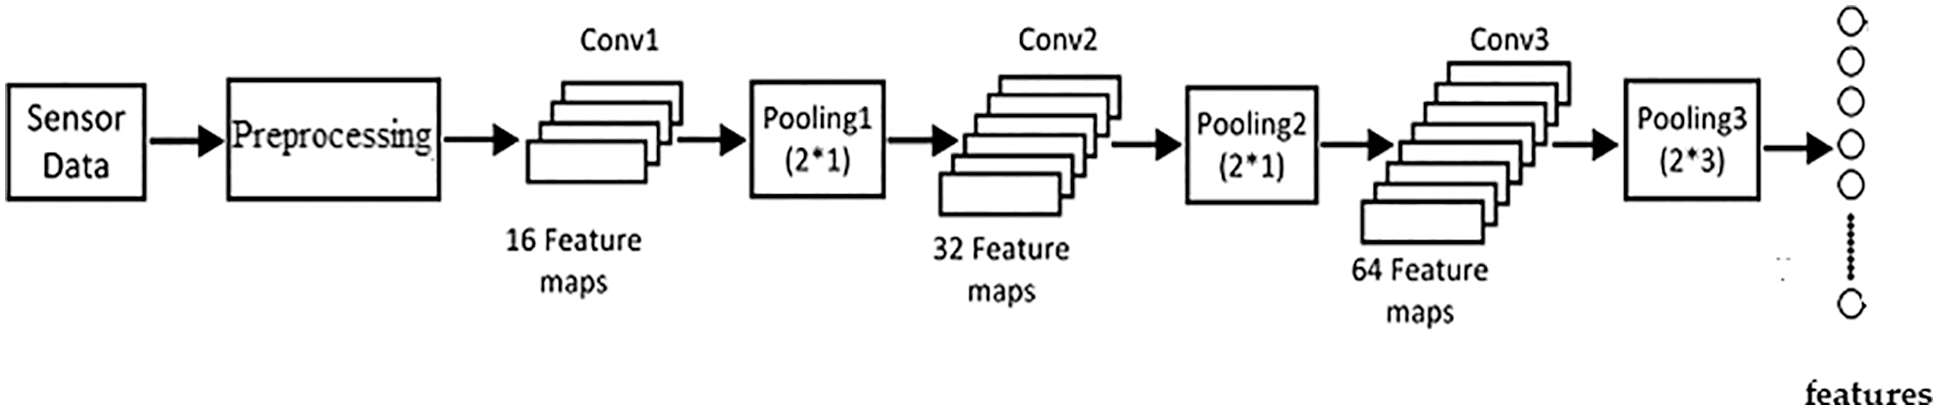
Figure 3: Feature extraction from EEG sensor data
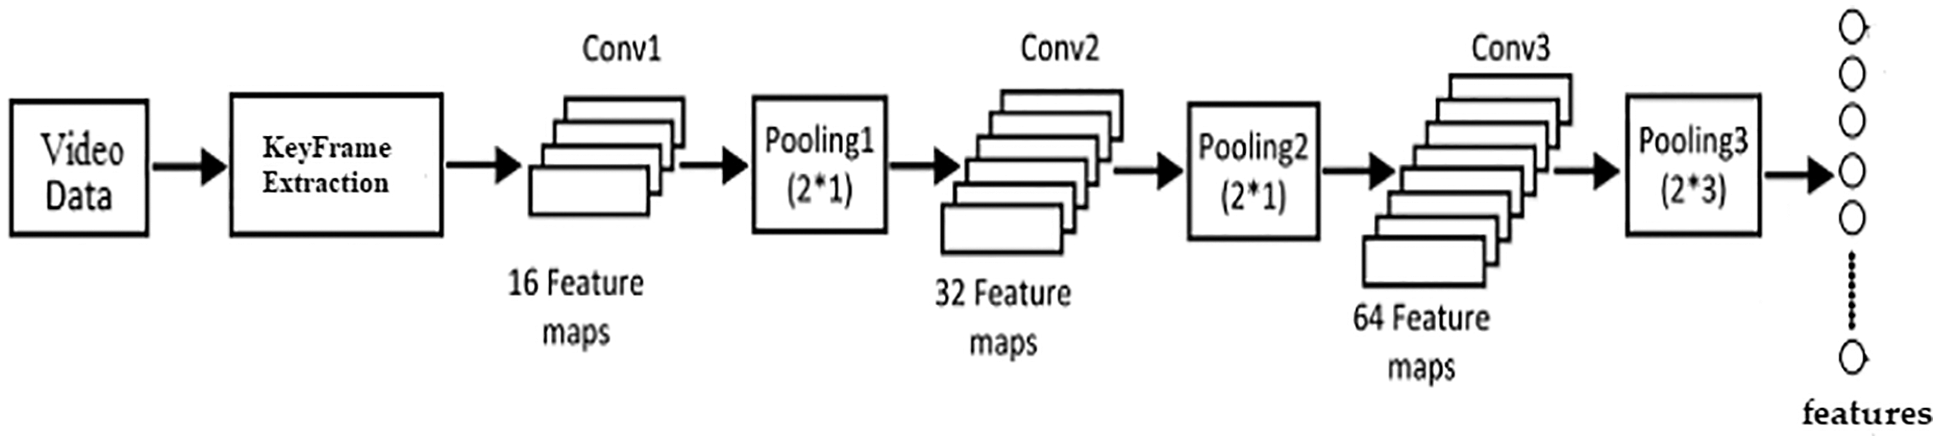
Figure 4: Feature extraction from video data
The goal of Backpropagation is to prevent the CNN model as shown in Fig. 5 from moving steadily or changing the distribution of values input to the active layer during model training, so that the contour of the network disappears in the case of backpropagation, resulting in a slower data transfer during training. At the same time, the over-fitting issue can be managed and the problem of the convolution network being insensitive to the activation weight can be mitigated.
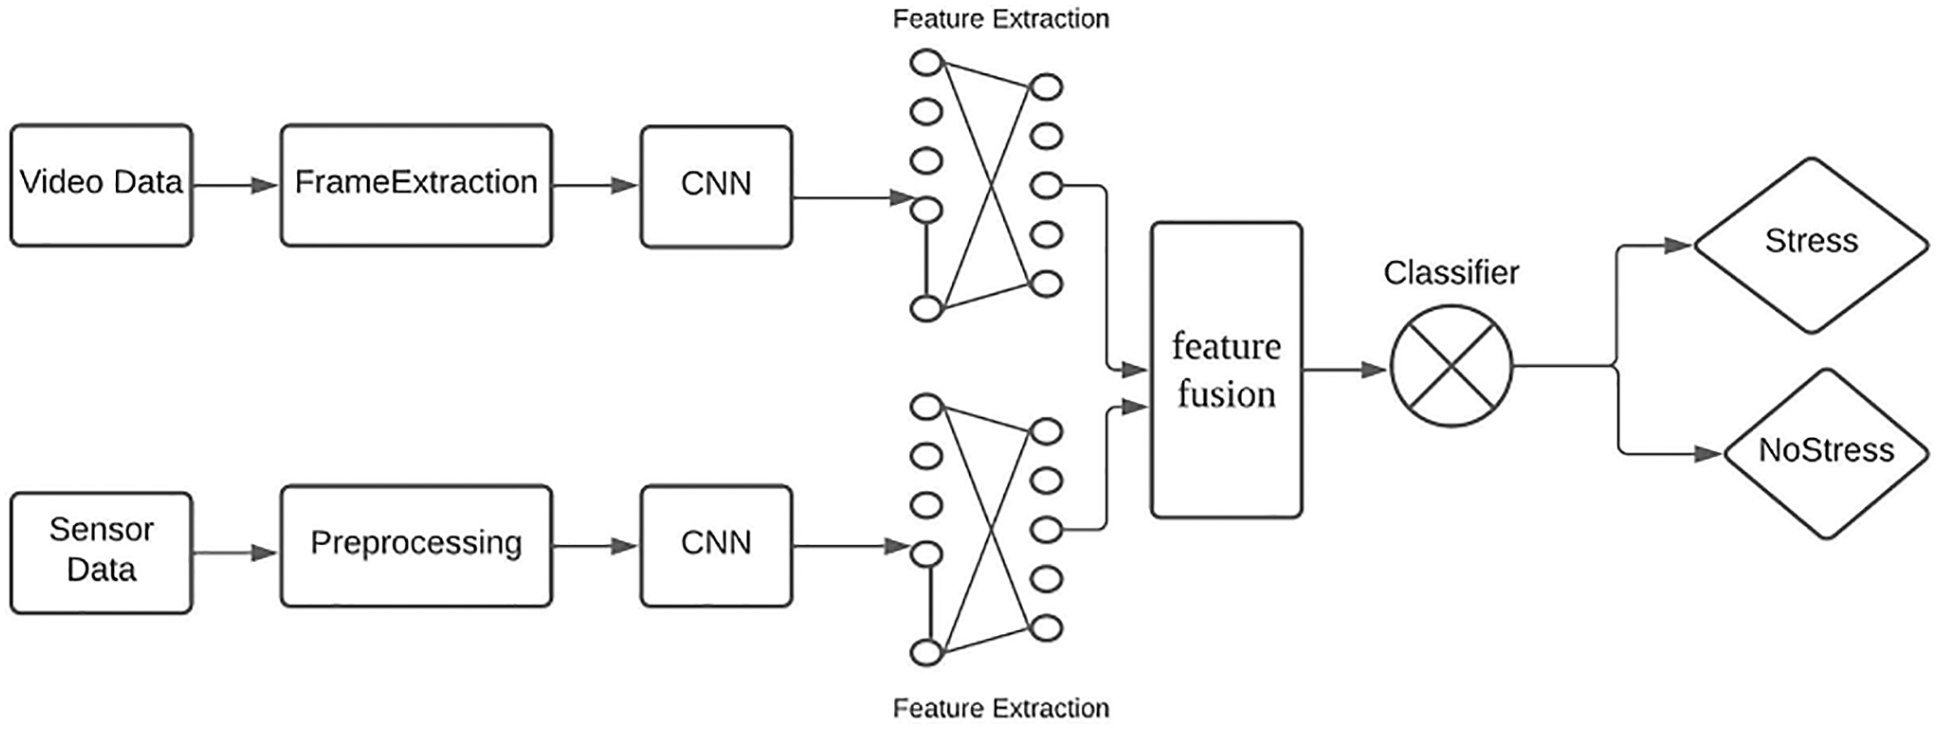
Figure 5: System architecture
Rectified Linear Unit (ReLu) is a bias vector that conducts nonlinear operations on feature data that has been treated by batch normalization. The function’s expression is presented as follows:
The ReLu function has unilateral suppression, making the CNN sparsely activated, allowing it to better mine picture characteristics and fit training data, as well as having great expression ability. The Dropout layer, which comes after ReLu’s sixth layer, tries to lessen the network’s over-fitting issue while also minimizing the coupling between distinct parameters. The Dropout layer is only used once since this convolutional neural network topology employs BN layers, which may help alleviate the overfitting issue.
The model is trained using the Triplet loss function. Positive and negative pair patches are included in the input data. From the various patches at each of the identical 3D locations, we create the positive pair patch. The patch is chosen at random from another picture as the negative patch pair. During the training phase, these three patches are combined into a group, which is then fed into the same network and given three sets of features.
The loss is estimated by the following formula.
where
To acquire the fusion features, we fuse these two types of features after feature extraction. Feature fusion combines the features acquired from the vision-based and sensor-based approaches to create more discriminative features. The recovered characteristics are sent into a Random Forest classifier, which determines whether or not the person is stressed.
3.4 CNN for Feature Extraction
In image processing, the CNN model has seen a lot of success. The key feature of CNN is that it learns the convolution in each convolution layer to get features. Multi-layer convolutional kernel operations, dimension reduction, and other techniques are used to extract image information from the input picture. The predicted information is obtained by communicating the layer information of the CNN model during the model’s training. The loss between the observed and predicted values is relayed back by backpropagation, and the fractional derivative of each layer’s parameter is transferred through the loss function. The gradient descent technique is used to update the parameters of each layer. The network has a significant capacity to describe the picture since it is constantly learning and changing parameters. We used the deep convolutional neural network structure in this article. The extraction of picture feature description is more precise thanks to the multi-layer convolution network. To improve the network’s resilience, the network was trained using the triple loss function, and the parameters were updated using the stochastic gradient descent approach.
3.5 Extreme Gradient Boosting (XGBoost)
Because of its capacity to cope with high-dimensional characteristics or unbalanced data, we utilize XGBoost as our categorization model for predicting stress class. XGBoost is a gradient boosting ensemble strategy that combines many predictors (e.g., decision trees) to create a stronger model. The output of the model can be described in the form:
where K is the total amount of variables and fj is a variable in the operational space F for the jth predictor. To determine a target variable, Yi, we employ the training feature xi. A unique equation for XGBoost is suggested in the training, which is tuned at each stage of gradient boosting:
where δ is the training error term that quantifies the variance between the prediction I and the ground truth Yi and is the model’s parameters. θ is a regularized term that penalizes the model’s complexity to prevent overfitting.
3.6 Feature Ranking Proposed by XGBoost
Because excellent features will be selected as nodes in the trees for XGBoost and feature size has minimal impact on the system performance, we may extricate renumbering additional features to increase accuracy during training. For future applications, however, a large number of characteristics may degrade the efficiency and raise the computing cost of the system. We thus suggest various efficient feature selection approaches in this part to reduce the number of calculations required by discovering the most dominating characteristics as quickly as possible.
1) The Importance of a Specific Feature: First, since the decision tree is often employed as the predictor, the relevance of each feature may be evaluated by counting the number of times a feature is used to divide the data across all trees. This helps in the selection of the dominant features in stress detection. With the use of a mechanism, we may progressively raise the feature size starting with the most important features and progressing until we get the same performance with all of the features. However, comparable features may not only lose their significance as a result of this effect on model performance, but they may also prevent our technique from selecting valuable features with diverse contributions since they are too similar. We must first determine the connection between all characteristics and identify dissimilar features as well as feat features of significance.
2) Correlation of Features: For machine learning, the correlation-based feature selection approach has been extensively employed. We use Pearson’s linear correlation coefficient to decrease comparable characteristics, which is a straightforward and effective method. The characteristics having a correlation coefficient absolute value greater than 0.9 were grouped together and only submitted to be chosen as representatives. Then, while maintaining model performance, we may pick several key aspects and consider them to be the most prominent features in stress detection.
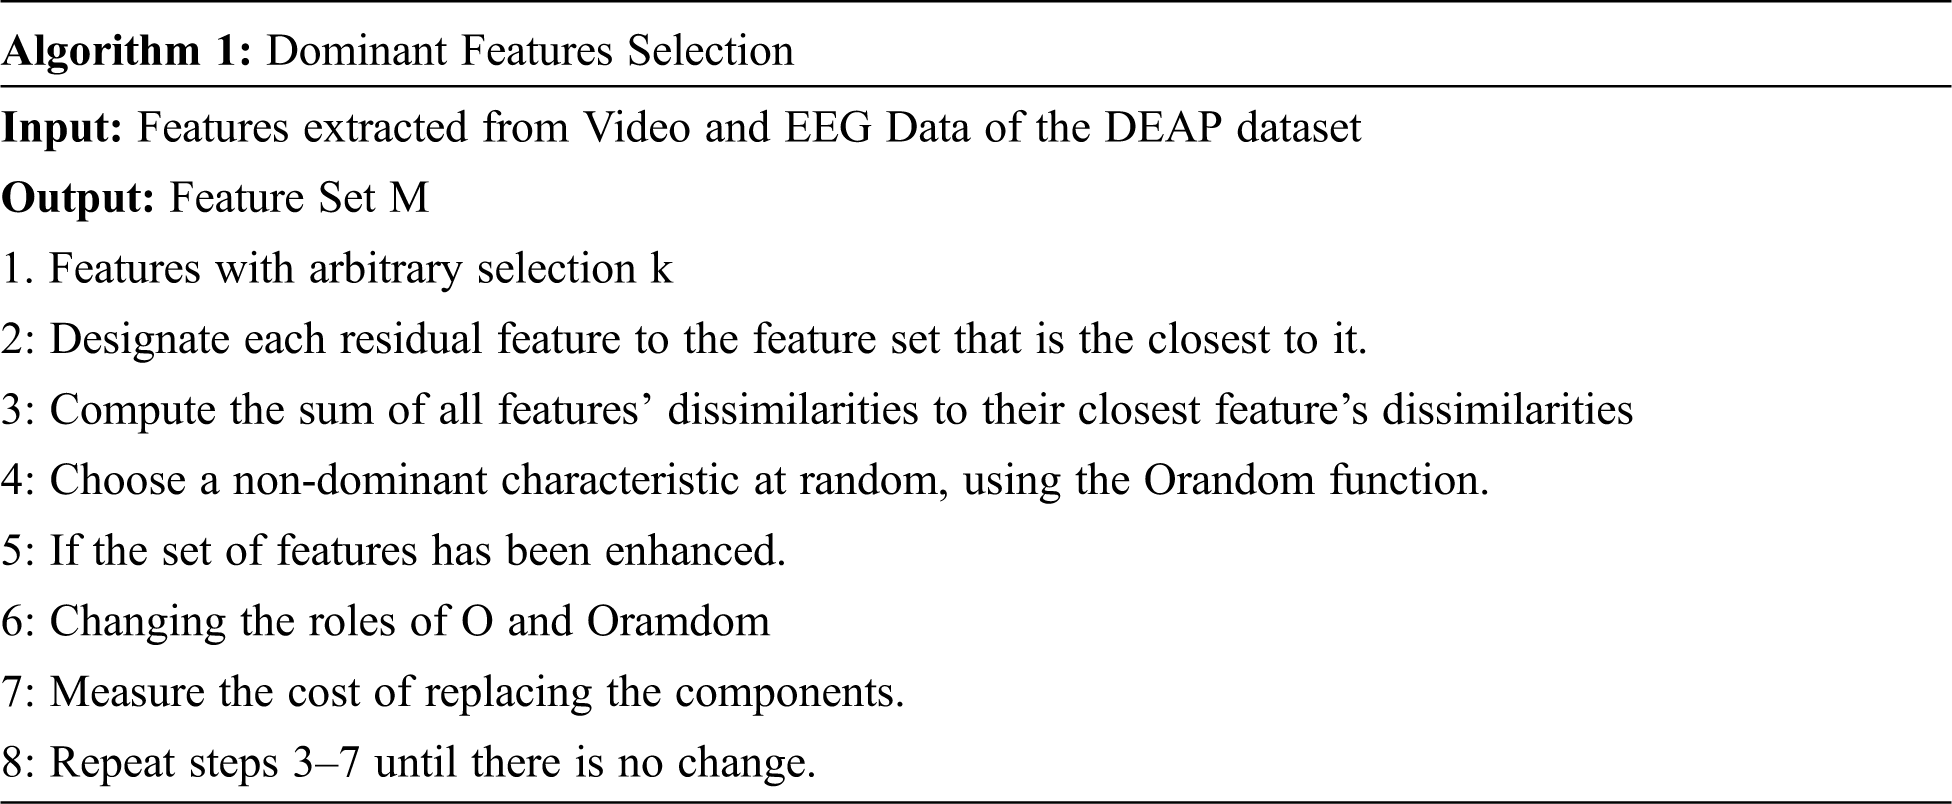
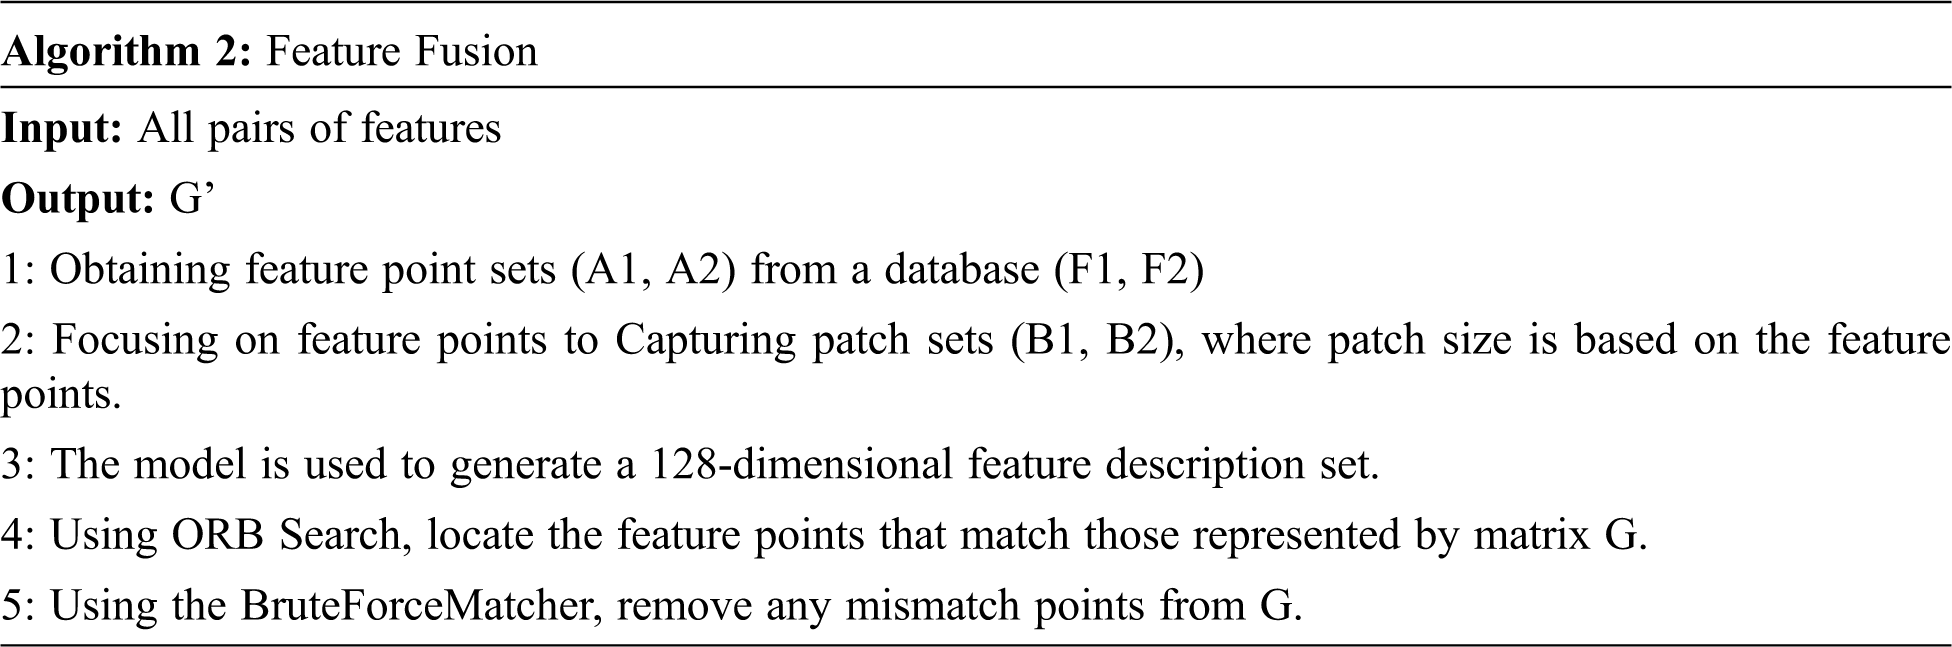
Fig. 6 shows the dominant characteristics in terms of fusion modality feature selection, with the features we suggest underlined in boldface. The harmonic component emphasizes entropy and difference, whereas the periodic component emphasizes mean level and signal range. The findings show that the low-frequency magnitude and high-frequency complexity of the sensor signal contain the most essential information in stress detection. Furthermore, one of these features shows a positive relationship with stress, suggesting that stress may lead to an increase in aberrant signal activity. We employ a nine-dimensional vector to express the dominant features across all data segments, in addition to discussing feature information. t-SNE [38] projects these vectors into a two-dimensional space, allowing us to differentiate the data distribution, as seen in Fig. 6. The visualization validates the prominent features’ capacity to distinguish between non-stress and stress affect states, with the non-stress class including baseline and amused affect states.
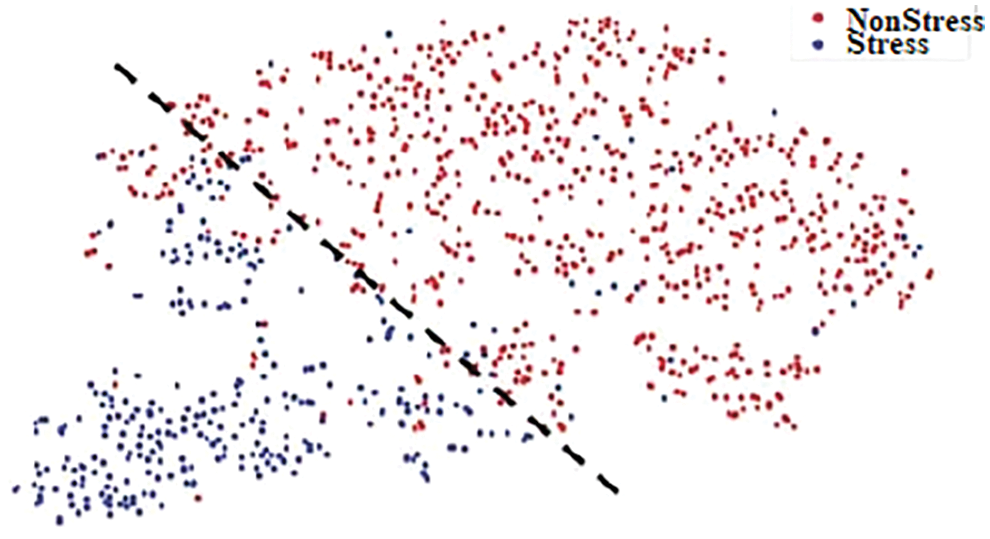
Figure 6: Visualization of dominant features
3.8 Mathematical Model for Feature Fusion
A Feature set A is a tuple of arbitrary tuples, elements of which belong to predefined sets:
here {A} is a tuple of sets s a tuple of elements tuples
The relation Is Majority-Vote Equal between two tuples and
and let such as and then
Relations between sets of aggregates are
Thus, the compatibility of the aggregates in (11) is as follows:
Then relations between sets of these aggregates are:
The rest of the aggregates do not have these relations between their sets. It can be indicated by using negation:
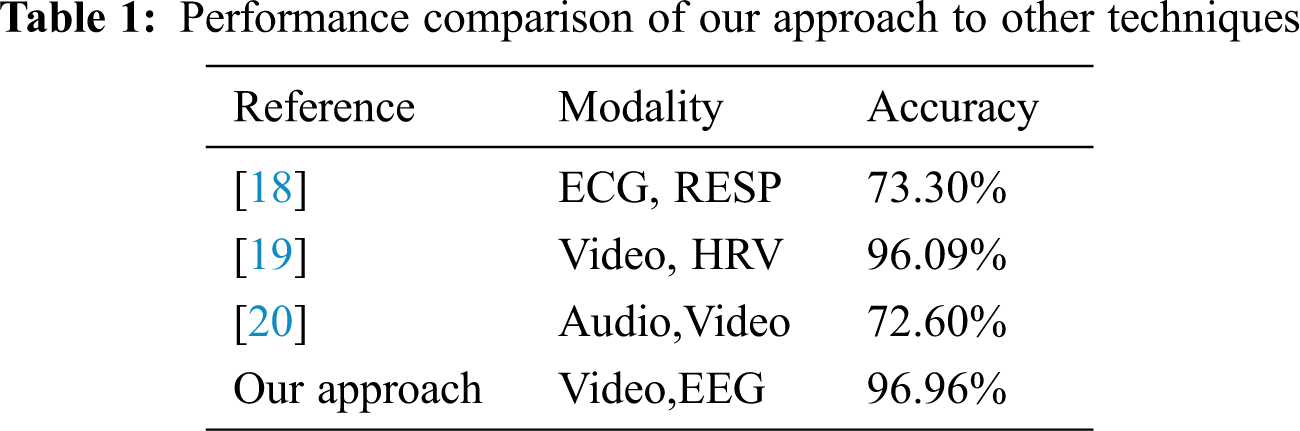
From Tab. 1, it is evident that the performance of our method is better when compared with other state-of-the-art methods.
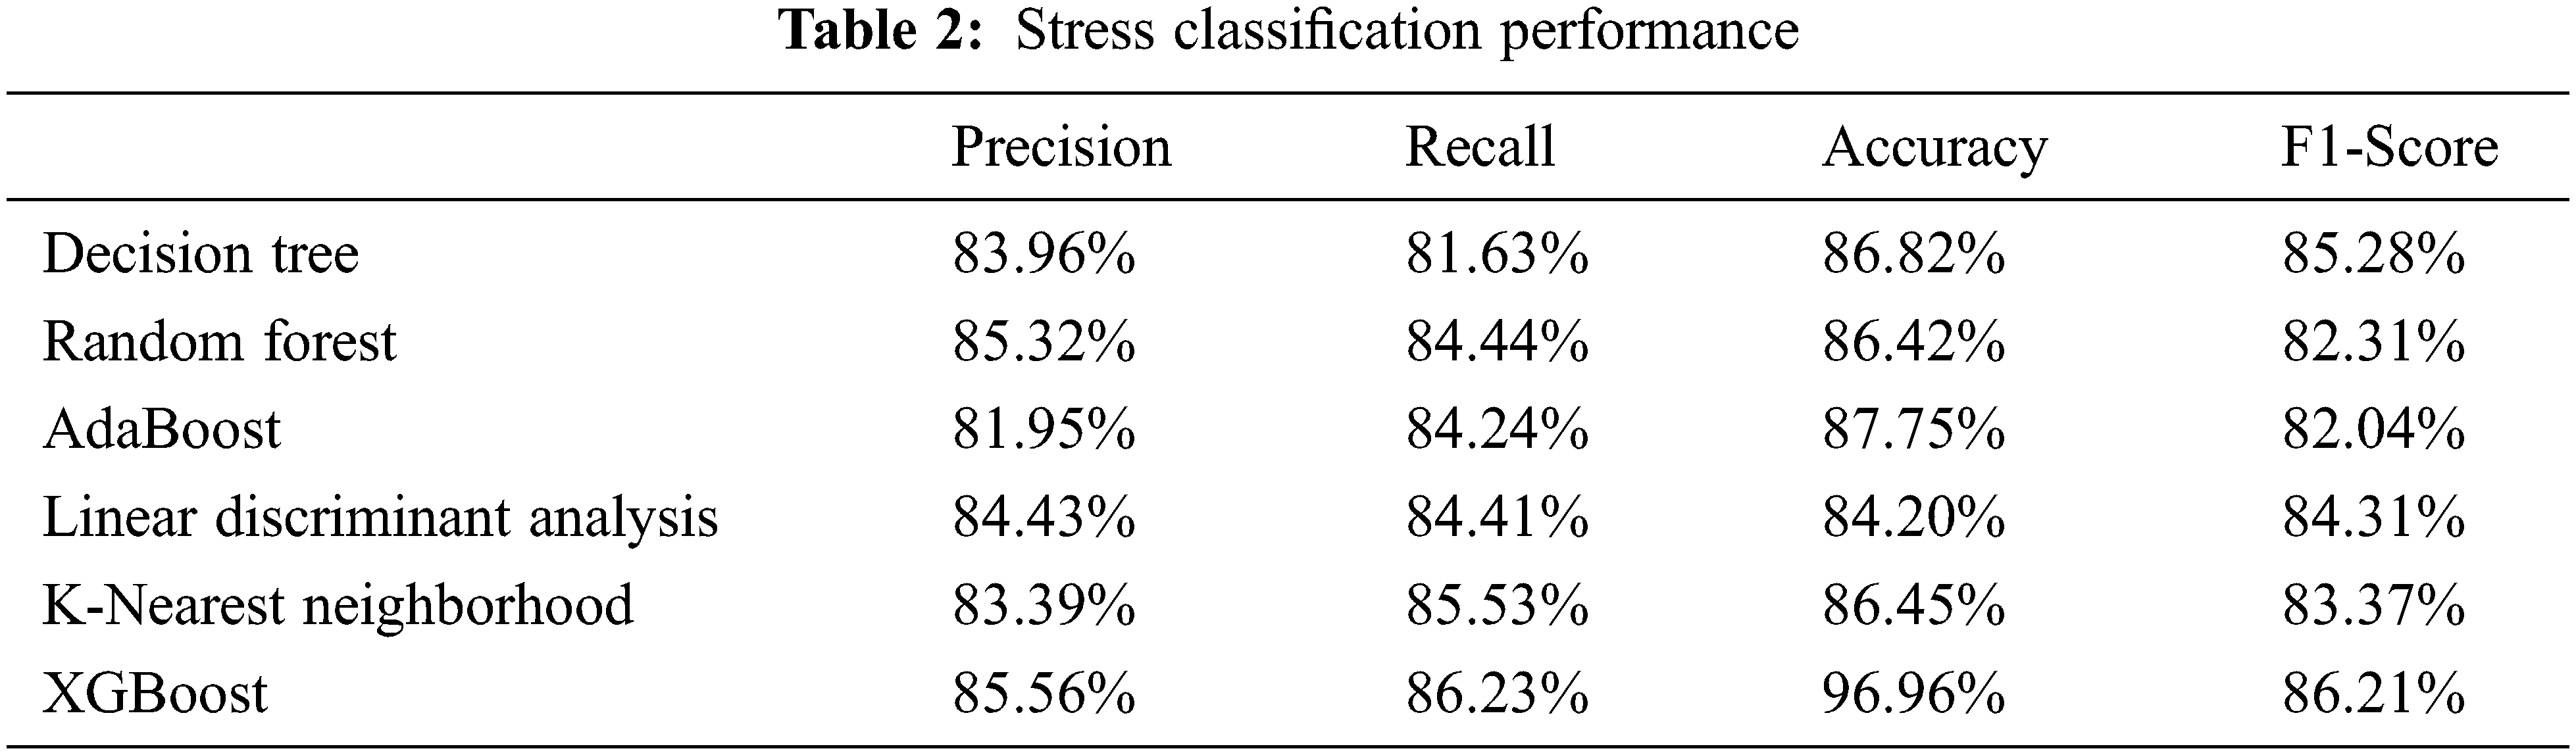
Tab. 2 shows six distinct models that were applied to video and EEG data from the DEAP dataset, along with their accuracy, precision, recall, and f1 score. The f1-score is a harmonic mean of accuracy and recall, providing a reliable performance assessment score.
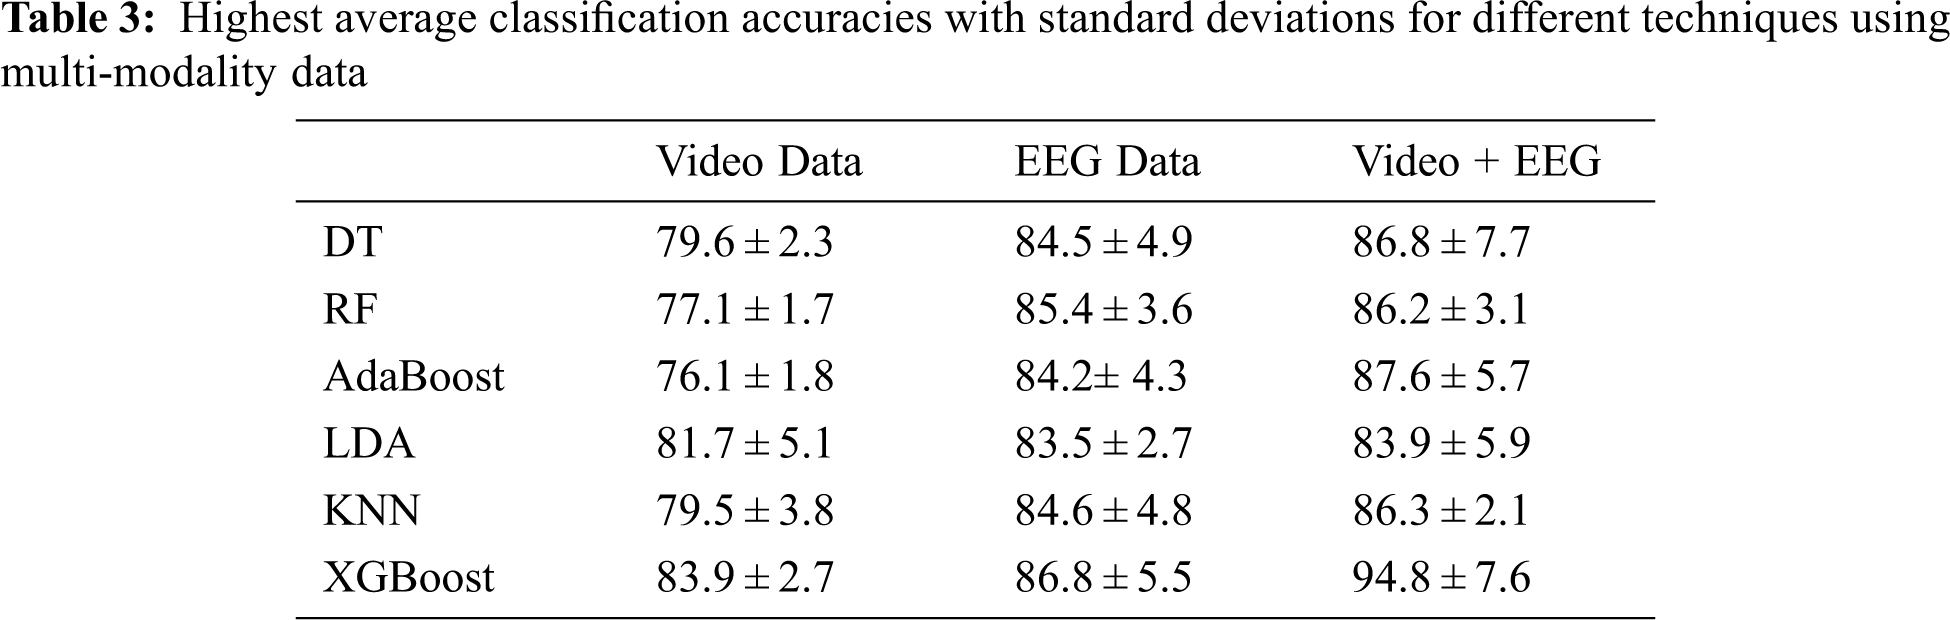
When K = 1, the XGBoost classifier behaves like a linear classifier and assumes data is linearly separable, as shown in Tab. 3. As a result, the suggested model’s f1 score is close to 86 percent for binary classification tasks. It can be shown that when the F1 score rises, the model complexity rises as well, however, this does not help to overfit, since, at K = 1, test performance drops.
In the matrix as shown in Tab. 4, we can see the true values common to the prediction class and true class and we have the stressed state which has a high value of more precise prediction by the model. This method can be really useful when it comes to dealing with classification problems. For one of the important and commonly used metrics in classification for the model using confusion matrix, we have accuracy. The following formula is used for the accuracy calculation:
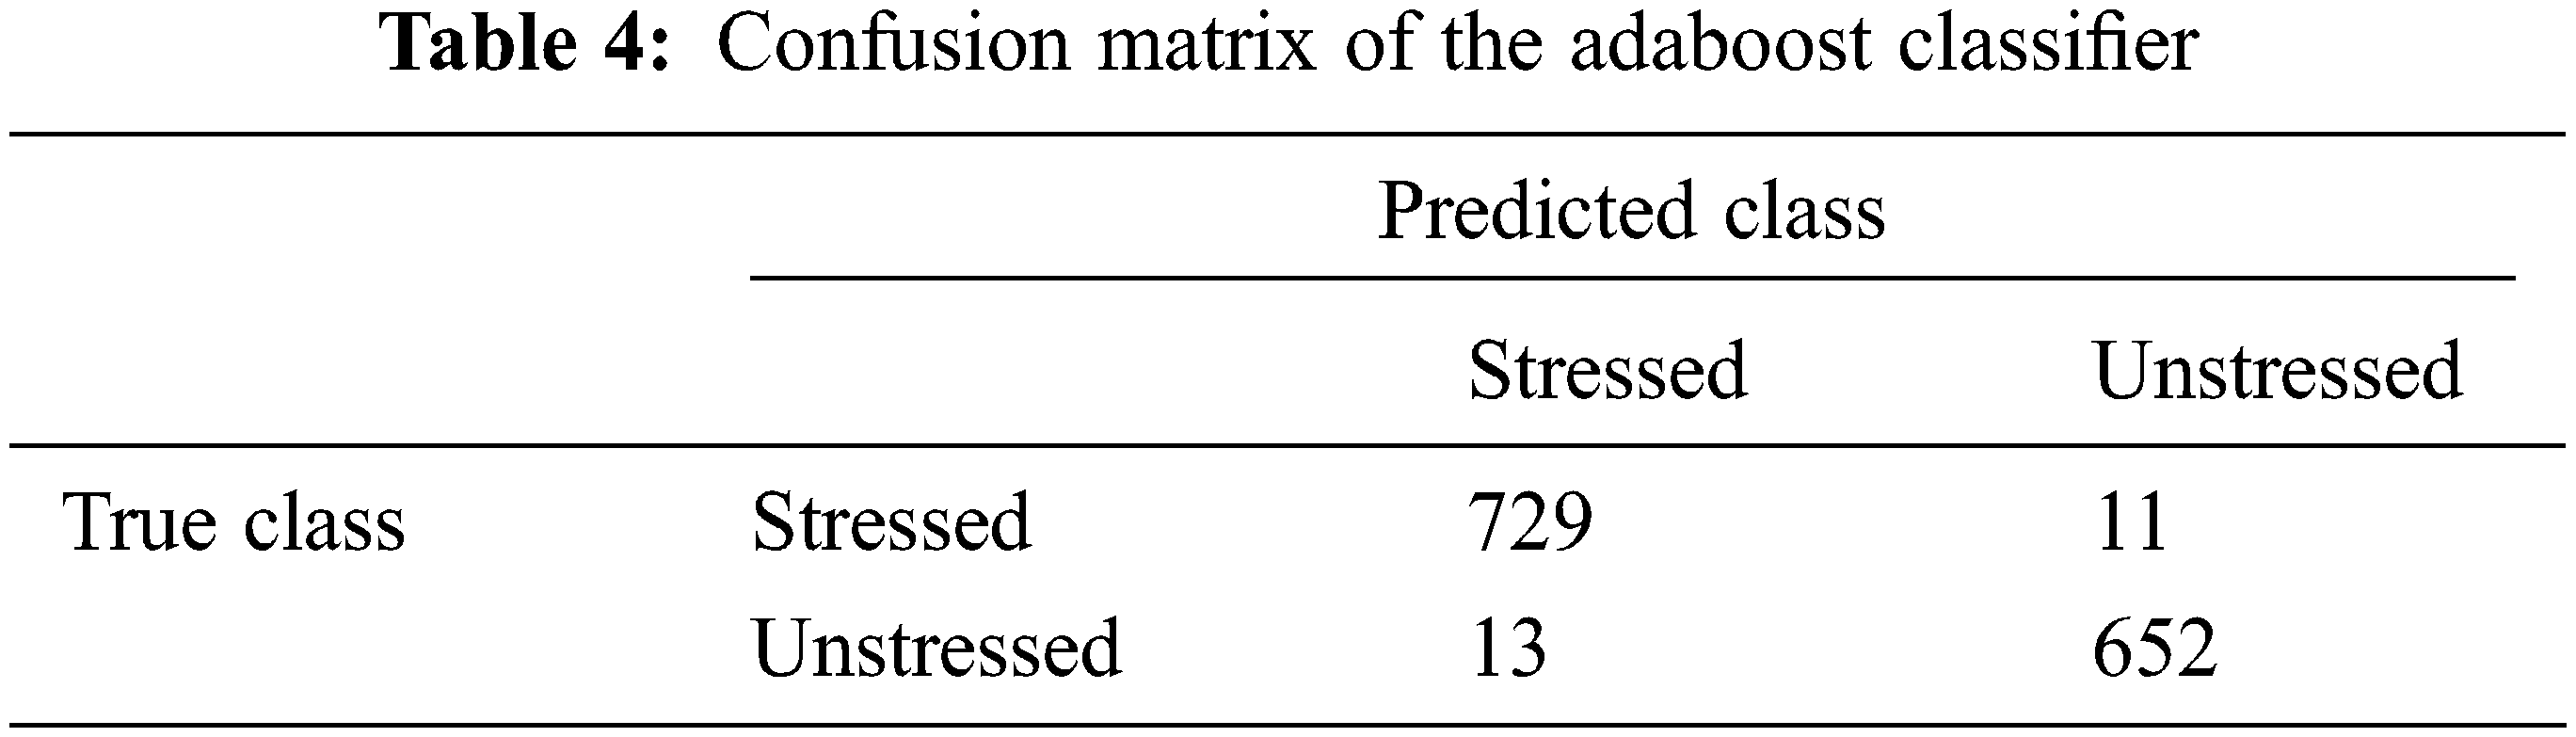
Accuracy = (TN + TP)/(TN + FP + FN + TP)
Here, TN, TP, FP, and, FN represent true negative, true positive, false positive, and false negative respectively which can be obtained using the confusion matrix.
Figs. 7 and 8 illustrate the model’s execution time and accuracy on video and EEG data from the DEAP multimodal dataset, as well as just video data from the DEAP dataset of each subject and only EEG data from the DEAP dataset of each subject. It was discovered that video data alone predicted stress state better than EEG data, with 89.77 and 88.57 accuracies, respectively, but both performed poorly when compared to the DEAP multimodal dataset’s entire video and EEG data, which had 96.37 accuracies. From Fig. 9, it is evident that the XGBoost classifier has the highest classification accuracy compared to other methods.
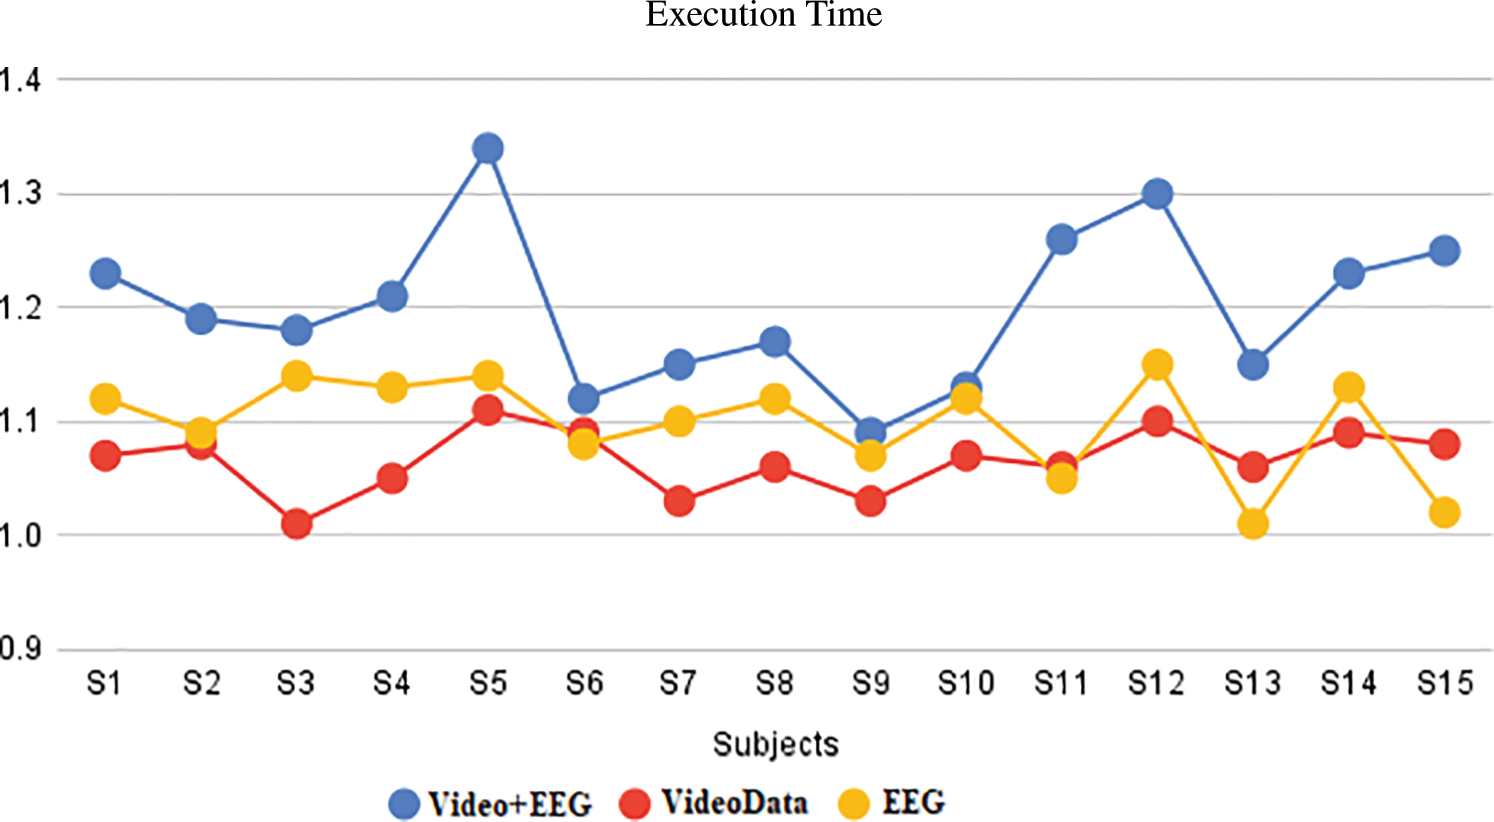
Figure 7: Results of average execution time for EEG and video data, utilizing individual and combined EEG and video data
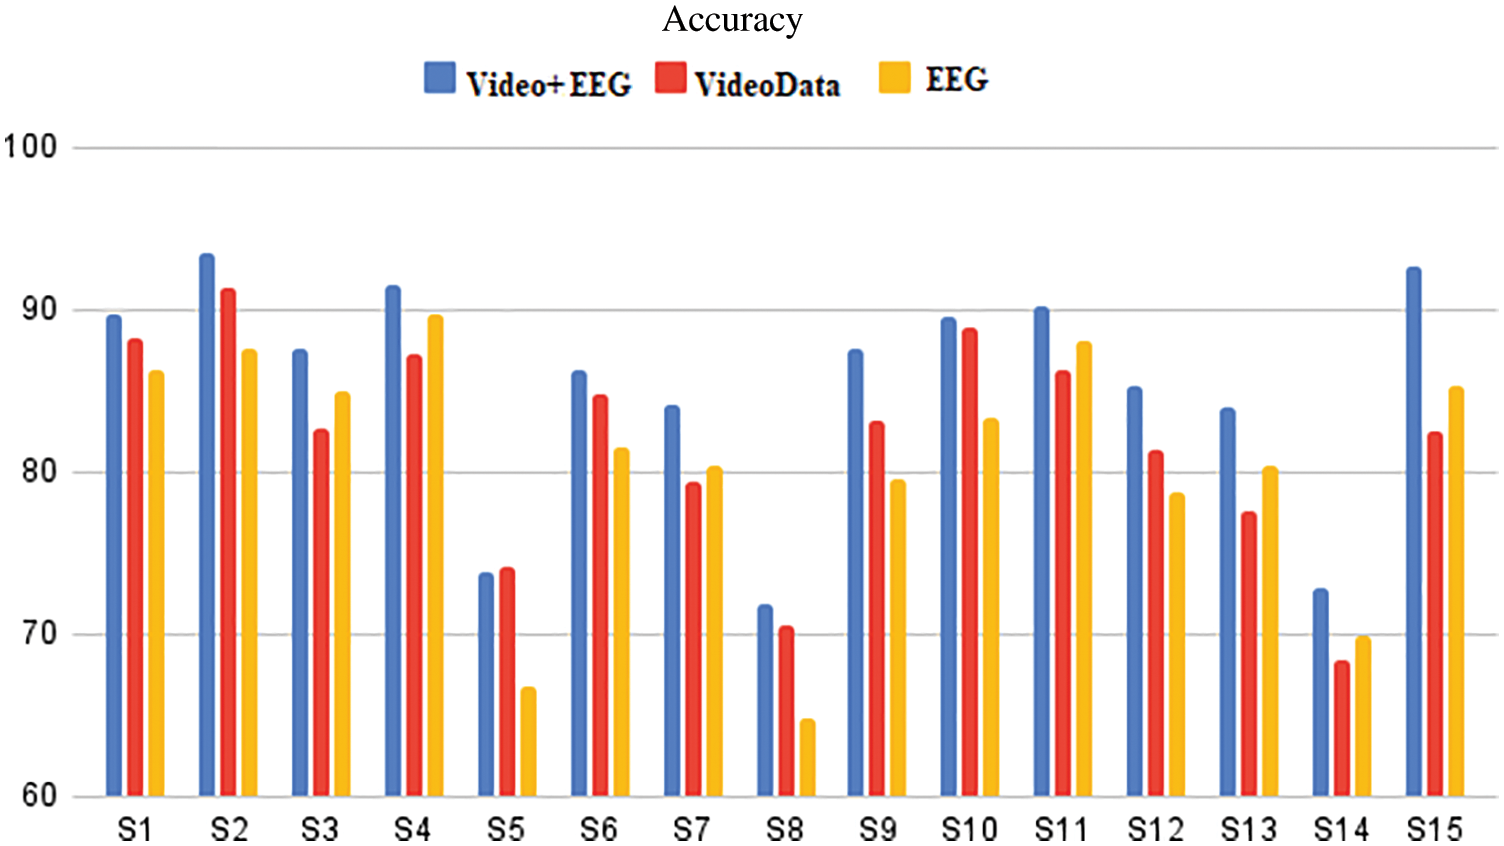
Figure 8: Results of average execution time for EEG and video data, utilizing individual and combined EEG and video data
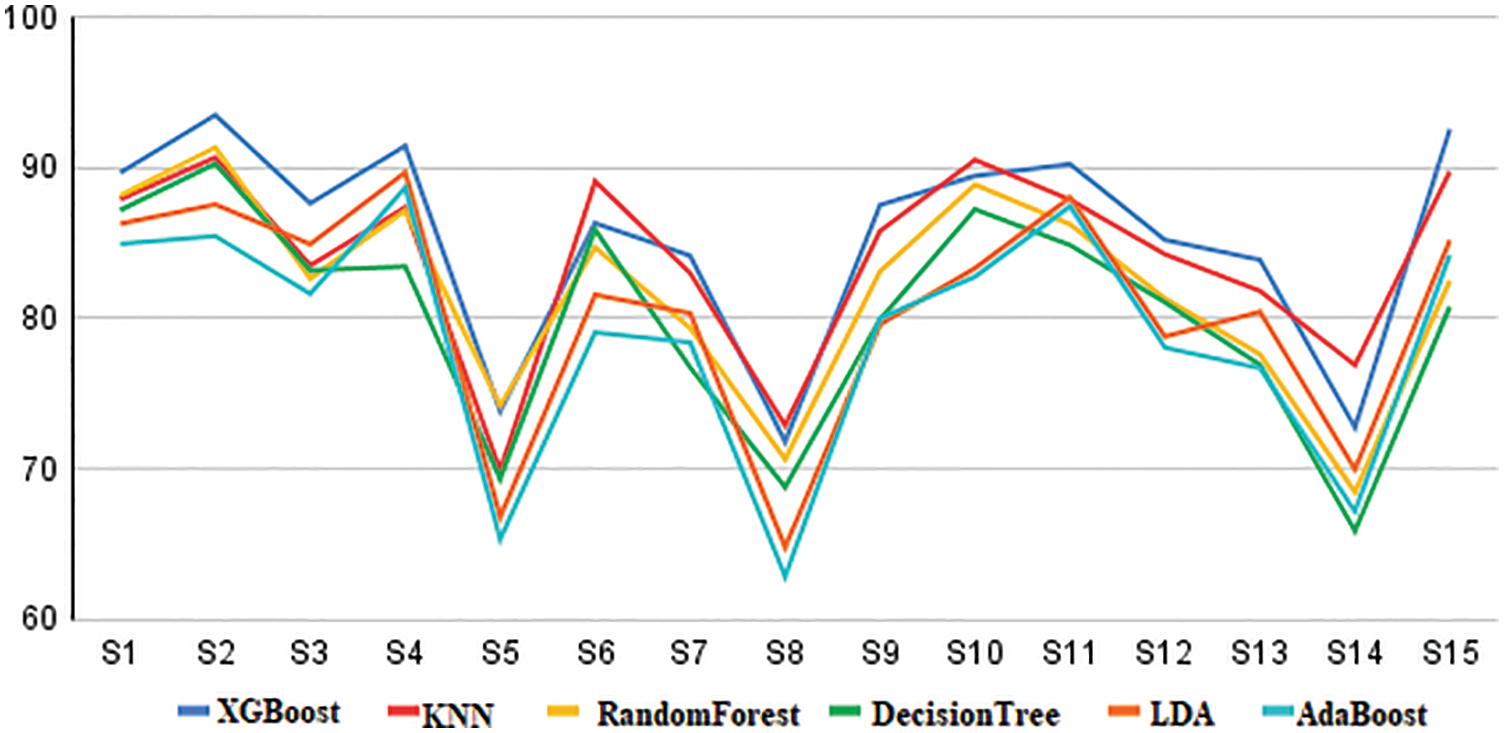
Figure 9: Comparison of accuracy for the different classification methods of decision tree, random forest, adaboost, linear discriminant analysi and k-nearest neighborhood
As can be seen from the figures, the accuracy for all three situations has reached 96 percent. This may minimize decision latency for important medical services and offer precise identification of an individual’s present mental health status in real-time healthcare. The model may be trained using raw data to reduce the risk of a little decline in accuracy, and XGBoost clustering can be used to summarise the continuous incoming data while evaluating the health condition in real-time to avoid decision delays.
Furthermore, although the model is currently trained on just 2 h of physiological data, more data over a longer period might be collected to increase accuracy. Furthermore, because real-time smart healthcare services necessitate high precision and inefficiency can result in a loss of life, each feature can be explicitly trained with computationally less expensive and well-learned models to improve the effectiveness/accuracy of real-time health analysis prediction.
The DEAP dataset was used to train a CNN model utilizing a multimodal psychological-based mental health dataset. For the goal of stress recognition, we created a deep neural network. This work was divided into two parts: feature extraction and temporal feature fusion exploitation. We experimented with a basic design on DEAP, the biggest contemporary multimodal database. A combination of visual and EEG characteristics, on the other hand, may boost performance. The suggested categorization model is an excellent place to start when it comes to detecting stress and emotion in real-time. This area of work might be expanded in the future to include a resource-constrained device that does not need calibration. User Independence is not only useful for detecting human stress and mood; it can also be used for Authentication processes, Sentimental Analysis, and other tasks.
Funding Statement: The authors received no specific funding for this study.
Conflicts of Interest: The authors declare that they have no conflicts of interest to report regarding the present study.
References
1. J. H. Li, L. Tian, H. Wang, Y. An, K. Wang et al., “Segmentation and recognition of basic and transitional activities for continuous physical human activity,” IEEE Access, vol. 7, pp. 42565–42576, 2019. [Google Scholar]
2. X. Xu, J. Tang, X. Zhang, X. Liu, H. Zhang et al., “Exploring techniques for vision-based human activity recognition: Methods, systems, and evaluation,” Sensors (Basel), vol. 13, no. 2, pp. 1635–1650, 2013. [Google Scholar]
3. C. Pham, S. Nguyen-Thai, H. Tran-Quang, S. Tran, H. Vu et al., “Senscapsnet: Deep neural network for non-obtrusive sensing based human activity recognition,” IEEE Access, vol. 8, pp. 86934–86946, 2020. [Google Scholar]
4. S. Lee, S. Yoon and H. Cho, “Human activity recognition from accelerometer data using convolutional neural network,” in 4th IEEE Int. Conf. on Big Data and Smart Computing (BigComp), Jeju Island, Korea, pp. 131–134, 2017. [Google Scholar]
5. D. O. Lara, A. Miguel and A. Labrador, “A survey on human activity recognition using wearable sensors,” IEEE Communications Surveys & Tutorials, vol. 15, no. 3, pp. 1192–1209, 2013. [Google Scholar]
6. C. A. Ronao and S. Cho, “Deep convolutional neural networks for human activity recognition with smartphone sensors,” in 38th Annual Int. Conf. on Neural Information Processing, Istanbul, Turkey, vol. 9492, pp. 46–53, 2015. [Google Scholar]
7. J. Morales, D. Akopian and S. Agaian, “Human activity recognition by smartphones regardless of device orientation,” in Proc. of IS&T/SPIE Electronic Imaging, San Francisco, California, United States, vol. 9030, 2014. [Google Scholar]
8. N. Tasnim, M. K. Islam and J. Baek, “Deep learning-based human activity recognition using spatio-temporal image formation of skeleton joints,” Applied Sciences, vol. 11, no. 6, pp. 2675, 2021. [Google Scholar]
9. H. Griffith, Y. Shi and S. Biswas, “A wearable system for asymmetric contactless human sensing,” in Int. Conf. of the IEEE Engineering in Medicine and Biology Society, Florida, USA, pp. 4991–4994, 2016. [Google Scholar]
10. S. F. Maier and L. R. Watkins, “Cytokines for psychologists: Implications of bidirectional immune-to-brain communication for understanding behavior, mood, and cognition,” Psychological Review, vol. 105, no. 1, pp. 83–107, 1998. [Google Scholar]
11. O. Dobrucalı and B. Barshan, “Sensor-activity relevance in human activity recognition with wearable motion sensors and mutual information criterion,” in Int. Symp. on Computer and Information Sciences and Systems (ISCIS 2013), Paris, France, vol. 264, 2013. [Google Scholar]
12. J. Yin, Q. Yang and J. Pan, “Sensor-based abnormal human-activity detection,” IEEE Transactions on Knowledge Data Engineering, vol. 20, no. 8, pp. 1082–1090, 2008. [Google Scholar]
13. B. Sonawane and P. Sharma, “Acceleration of CNN-based facial emotion detection using NVIDIA GPU,” Intelligent Computing and Information and Communication, Singapore, Springer, 2018. [Online]. Available: https://doi.org/10.1007/978-981-10-7245-1_26. [Google Scholar]
14. Z. Liu, Y. Yao, Y. Liu, Y. Zhu, Z. Tao et al., “Learning dynamic spatio-temporal relations for human activity recognition,” IEEE Access, vol. 8, pp. 130340–130352, 2020. [Google Scholar]
15. H. Jebelli, M. M. Khalili and S. Lee, “A continuously updated, computationally efficient stress recognition framework using electroencephalogram (eeg) by applying online multitask learning algorithms (OMTL),” IEEE Journal of Biomedical and Health Informatics, vol. 23, no. 5, pp. 1928–1939, 2019. [Google Scholar]
16. A. Das Antar, M. Ahmed and M. A. R. Ahad, “Challenges in sensor-based human activity recognition and a comparative analysis of benchmark datasets,” in Joint 8th Int. Conf. on Informatics, Electronics & Vision and 3rd Int. Conf. on Imaging, Vision & Pattern Recognition, Eastern Washington University, USA, pp. 134–139, 2019. [Google Scholar]
17. J. Kwapisz, G. Weiss and S. Moore, “Activity recognition using cell phone accelerometers,” ACM SIGKDD Explorations Newsletter, vol. 12, no. 2, pp. 74–82, 2010. [Google Scholar]
18. W. Seo, N. Kim, C. Park and S. M. Park, “Deep learning approach for detecting work-related stress using multimodal signals,” IEEE Sensors, vol. 22, no. 12, pp. 11892–11902, 2022. [Google Scholar]
19. W. Rahee, N. Pranav, B. Ashmit and K. Ketan, “Employing multimodal machine learning for stress detection,” Journal of Healthcare Engineering, vol. 2021, pp. 20–22, 2021. [Google Scholar]
20. M. Dahmane, J. Alam, P. L. St.Charles, M. Lalonde, K. Heffner et al., “A multimodal non-intrusive stress monitoring from the pleasure-arousal emotional dimensions,” IEEE Transactions on Affective Computing, vol. 13, no. 2, pp. 1044–1056, 2022. [Google Scholar]
21. K. P. Vijayakumar, K. P. M. Kumar, K. Kottilingam, T. Karthick, P. Vijayakumar et al., “An adaptive neuro-fuzzy logic-based jamming detection system in WSN,” Soft Computing-A Fusion of Foundations, Methodologies and Applications, vol. 23, no. 8, pp. 2655–2667, 2019. [Google Scholar]
22. I. K. Ihianle, A. O. Nwajana, S. H. Ebenuwa, R. I. Otsuka, K. Owa et al., “A deep learning approach for human activities recognition from multimodal sensing devices,” IEEE Access, vol. 8, pp. 179028–179038, 2020. [Google Scholar]
23. I. R. Atadjanov and S. Lee, “Robustness of Reflection Symmetry Detection Methods on Visual Stresses in Human Perception Perspective,” IEEE Access, vol. 6, pp. 63712–63725, 2018. [Google Scholar]
24. A. Saxena, A. Khanna and D. Gupta, “Emotion recognition and detection methods: A comprehensive survey,” Journal of Artificial Intelligence and Systems, vol. 2, no. 1, pp. 53–79, 2020. [Google Scholar]
25. S. Jaiswal and G. C. Nandi, “Robust real-time emotion detection system using CNN architecture,” Neural Computing and Applications, vol. 32, no. 15, pp. 11253–11262, 2020. [Google Scholar]
26. E. Kim, S. Helal and D. Cook, “Human activity recognition and pattern discovery,” IEEE Pervasive Computing, vol. 9, no. 1, pp. 48–53, 2010. [Google Scholar]
27. P. Turaga, R. Chellappa, V. Subramanian and O. Udrea, “Machine recognition of human activities: A survey,” IEEE Transactions on Circuits Systems and Video Technology, vol. 18, no. 11, pp. 1473–1488, 2008. [Google Scholar]
28. T. Kawashima, Y. Kawanishi, I. Ide, H. Murase, D. Deguchi et al., “Action recognition from an extremely low-resolution thermal image sequence,” in 14th IEEE Int. Conf. on Advanced Video and Signal Based Surveillance, Lecce, Italy, pp. 1–6, 2017. [Google Scholar]
29. S. Saxena, F. Brémond, M. Thonnat and R. Ma, “Crowd behavior recognition for video surveillance,” Advanced Concepts for Intelligent Vision Systems, vol. 5259, pp. 970–981, 2008. [Google Scholar]
30. Y. N. Hammerle, S. Halloran and T. Ploetz, “Deep, convolutional, and recurrent models for human activity recognition using wearables,” in 25th Int. Joint Conf. on Artificial Intelligence, New York, USA, pp. 1533–1540, 2016. [Google Scholar]
31. T. Karthick, A. V. A. Sai, P. Kavitha, J. Jothicharan and T. Kirthiga Devi, “Emotion detection and therapy system using chatbot,” International Journal of Advanced Trends in Computer Science and Engineering, vol. 9, no. 4, pp. 5973–5978, 2020. [Google Scholar]
32. T. Karthick and M. Manikandan, “Fog assisted Iot based medical cyber system for cardiovascular diseases affected patients,” Concurrency and Computation: Practice and Experience, vol. 31, no. 5, pp. 48–61, 2018. [Google Scholar]
33. T. Samarth, T. Sarthak and H. Beigi, “Multi-modal emotion recognition on IEMOCAP dataset using deep learning,” arXiv:1804.05788, 2018. [Google Scholar]
34. H. Zhang, Z. Xiao, J. Wang, F. Li and E. Szczerbicki, “A novel IoT-perceptive human activity recognition (HAR) approach using multihead convolutional attention,” IEEE Internet of Things Journal, vol. 7, no. 2, pp. 1072–1080, 2020. [Google Scholar]
35. M. Anandan, M. Manikandan and T. Karthick, “Advanced indoor and outdoor navigation system for blind people using raspberry-pi,” Journal of Internet Technology, vol. 21, no. 1, pp. 183–195, 2020. [Google Scholar]
36. J. Biesiada and W. Duch, “Feature selection for high-dimensional data a Pearson redundancy based filter,” Advances in Soft Computing, vol. 45, pp. 242–249, 2007. [Google Scholar]
37. S. Koelstra, C. Muehl, M. Soleymani, J. S. Lee, A. Yazdani et al., “DEAP: A database for emotion analysis using physiological signals,” IEEE Transactions on Affective Computing, vol. 3, no. 1, pp. 18–31, 2012. [Google Scholar]
38. J. Birjandtalab, D. Cogan, M. B. Pouyan and M. Nourani, “A Non-EEG biosignals dataset for assessment and visualization of neurological status,” IEEE International Workshop on Signal Processing Systems (SiPS), vol. 14, pp. 110–114, 2016. [Google Scholar]
Cite This Article
 Copyright © 2023 The Author(s). Published by Tech Science Press.
This work is licensed under a Creative Commons Attribution 4.0 International License , which permits unrestricted use, distribution, and reproduction in any medium, provided the original work is properly cited.
 Downloads
 Citation Tools