
 Submit a Paper
 Propose a Special lssue
 Open Access
ARTICLE

Automatic Optic Disc Detection in Retinal Images Using FKMT‒MOPDF
Technology and Business Information System Unit, Mahasarakham Business School, Mahasarakham University, Mahasarakham, 44150, Thailand
* Corresponding Author: Kittipol Wisaeng. Email:
Computer Systems Science and Engineering 2023, 45(3), 2569-2586. https://doi.org/10.32604/csse.2023.033226
Received 11 June 2022; Accepted 12 July 2022; Issue published 21 December 2022
 View Full Text
 Download PDF
Abstract
In recent days, detecting Optic Disc (OD) in retinal images has been challenging and very important to the early diagnosis of eye diseases. The process of detecting the OD is challenging due to the diversity of color, intensity, brightness and shape of the OD. Moreover, the color similarities of the neighboring organs of the OD create difficulties during OD detection. In the proposed Fuzzy K‒Means Threshold (FKMT) and Morphological Operation with Pixel Density Feature (MOPDF), the input retinal images are coarsely segmented by fuzzy K‒means clustering and thresholding, in which the OD is classified from its neighboring organs with intensity similarities. Then, the segmented images are given as the input to morphological operation with pixel density feature calculations, which reduce the false detection in the small pixel of the OD. Finally, the OD area is detected by applying the Sobel edge detection method, which accurately detects the OD from the retinal images. After detection optimization, the proposed method achieved Sensitivity (SEN), Specificity (SPEC) and Accuracy (ACC), with 96.74%, 96.78% and 96.92% in DiaretDB0 (Standard Diabetic Retinopathy Database Calibration level 0), 97.12%, 97.10% and 97.75% in DiaretDB1 (Standard Diabetic Retinopathy Database Calibration level 1) and 97.19%, 97.47% and 97.43% in STARE (Structured Analysis of the Retina) dataset respectively. The experimental results demonstrated the proposed method’s efficiency for segmenting and detecting OD areas.Keywords
The advances in retinal images have also been widely used in diagnosing and detecting eye diseases early. The retinal imaging advancement achieved better image quality storage without deterioration over time. Information provided by the World Health Organization (WHO) reported that the number of patients with diabetes will rise to roughly 440 million people by 2030 [1]. The detection application process requires an assessment of the OD by an expert ophthalmologist. Being an image analysis process, it has a costly processing time. Detection of OD from retinal images is used to detect the OD boundary region. Therefore, accurate OD detection is essential in retinal image analysis as it helps to analyze and diagnose different types of eye diseases. In addition, accurate OD detection often provides information for diagnosis and screening for the ophthalmologist. A combination of the various OD detection methods has been proposed, but most researchers prefer to discuss the limitations of these practices. First, most proposed OD detection defines the correct location of the detected Optic Cup (OC), which lies within the OD area. Nevertheless, the various methods often fail to detect OD with false positive detection of the OC area. Second, most developed OD detection assumes that the OD has bright yellowish pixels more than other pixels in the whole of the retinal images (see Fig. 1). Third, most proposed algorithms consider the OD classification as two separate issues under the developed method to simultaneously detect the OD region and the OD boundary.
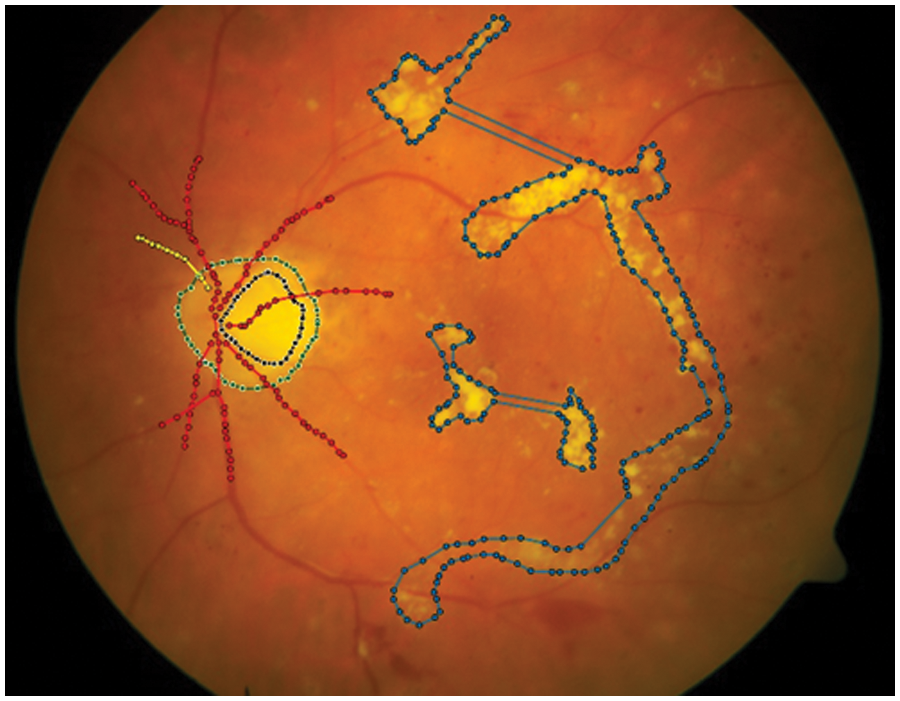
Figure 1: Structure of the retinal images. OD is a central yellowish pixel of the retina (in green). It is the orifice of the retinal vessel within the retina. Retinal vessels (in red) are arteries and veins close to each other. OC (in black) is a bright-colored region in the central depression of OD. It is variable in the sizes presented. Exudates are other regions that are away from retinal images. It is used to segment Diabetic Retinopathy (DR) diseases (in blue)
The proposed method is structured as follows. Section 2 presents a literature review, research objective, and main contribution. Then, Section 3 describes the proposed method, including the dataset used and candidate OD area using Fuzzy K‒Means Threshold (FKMT), Fuzzy K‒Means Threshold and Morphological Operation (FKMT‒MO) and Fuzzy K‒Means Threshold and Morphological Operation with Pixel Density Feature (FKMT‒MOPDF) for OD detection. Section 4 highlights the experimental results with details of standard performance evaluation, segmentation results and comparison of performance measures with other testing detection methods in retinal images. Finally, Section 5 presents the conclusion.
A large number of methods for OD detection have been proposed in previous work. One strategy of approach that detects the OD area is based on a high–intensity circular feature within the retinal images. Few proposed methods assume that the OD has a bright yellowish pixel or that the dark pixel is the background image. The technique focuses on detection tasks by observing the anatomy guidelines and compactness feature segmentation is proposed to capture both the location of the OD and boundary simultaneously. Furthermore, OD detection is further challenged by the density of blood vessels covering parts of the OD, which vary in color intensity between the OD center and the OD rim. Therefore, accurate OD detection plays a significant and essential role in diagnosing and screening eye diseases. Some detection methods have also been proposed by Panda et al. [2] for detecting OD based on a Global Symmetric and Partial Hausdorff‒Distance (PHD) method. Two stages were involved in the process; first, a Global Symmetric was applied to segment blood vessels in OD. Second, the PHD method was used to locate the centers of the OD. Obtained data from two methods are then compared with publicly available datasets, namely DRIVE (Digital Retinal Images for Vessel Extraction), STARE (Structured Analysis of the Retina) and HRF (High‒Resolution Fundus). Their method in OD detection achieved an average SEN of 97.50%, 97.50% and 100%, respectively. To overcome the drawback of a large number of retinal images, Xiong et al. [3] developed simple thresholding and mathematical morphology to detect OD. The Region of Interest (ROI) was initially extracted with the vertical edges and the intensity or brightness of the image’s pixel. ROI was later applied for the detection of OD without‒initialization. OD detection is handled by simple thresholding with a threshold value of 35, which was used to generate the OD mask. The detection is done by a morphology determination with opening, closing and erosion to remove background information by the thresholding method. The study was based on a large number of retinal images on DRIVE, STARE, DiaretDB0 (Standard Diabetic Retinopathy Database Calibration level 0) and DiaretDB1 (Standard Diabetic Retinopathy Database Calibration level 1) datasets for testing. The proposed method was evaluated; segmenting OD had an average ACC rate of 100%, 95.80%, 99.20% and 97.80%, respectively. Therefore, to rectify the accuracy problem, Pernil et al. [4] have presented OD detection using retinal images with the Hough circle cloud applied. They used 129 images on DRIVE and DiaretDB1 and reported an average experimental ACC value of 99.6%. Similarly, Soares et al. [5] used a large pathological change to detect OD in retinal images. Then, the modified corner classification method is applied to enhance vessels. The authors reported a segmentation ACC of 99.15%, which achieved an average computation time of 18.34 s per image on eight publicly available online datasets. However, Zhang et al. [6] proposed a new method for detecting OD that utilizes vessel distribution and directional characteristics to improve the existing method. Afterward, the two-dimension Gabor filter and adaptive thresholding were applied to segment blood vessels. The segmentation was done by Hough transformation and the Parabola fitting method. They reported 93.80% to 99.70% accuracy on four open-access datasets: DRIVE, STARE, DiaretDB0 and DiaretDB1. The method required an average processing time of 3.4 to 1.5 s per image on the STARE dataset. Afterward, Panda et al. [7] found that the first stage of the study used global vessel symmetry to segment the OD area. Two stages of segmentation method are then used for detection of OD boundary using vessel component count and local vessel symmetry method. The accuracy of detecting OD was 99.49% on ten publicly available datasets. Also, Dai et al. [8] proposed an OD detection based on a variational model with multiple energies technique. In addition, the circular Hough transform is used to detect and obtain the rough circular OD boundary approximation. Also, the proposed work was done on MESSIDOR (Methods to Evaluate Segmentation and Indexing Techniques in the field of Retinal Ophthalmology), ONHSD (Optic Nerve Head Segmentation) and DRIONS (Digital Retinal Images for Optic Nerve Segmentation) dataset. Rodrigues et al. [9] have also presented Wavelet transforms and a mathematical morphology that can be used to classify OD. They reported 94.65% accuracy on the DRIVE, which contains 40 images with ground truth annotated by clinicians. Bharkad [10] used a gray-scale morphological dilation operation followed by median filtering to obtain an approximation value of the OD boundary. The detection method was developed on the four open-access datasets: DRIVE, DiaretDB0, DiaretDB1 and DRIONS. They reported an accuracy of 100%, 96.92%, 98.98% and 100%, respectively. Tan et al. [11] proposed a convolution neural network method. They segmented the retrieved OD using three channels from the neighboring points where the OD contour segmented is processed. For instance, Zou et al. [12] proposed a method for detecting OD by automatic thresholding. The white pixel represented OD and the black pixel represented the background. OD detection has achieved an average ACC of 96.30%, 100%, 100% and 100% on STARE, DRIVE, DiaretDB0, and DiaretDB1. Besides discussed methods, Gui et al. [13] developed a new method for the detection of OD using an improved corner detection method. The proposed method was evaluated using three open-access datasets: DRIVE, STARE and MESSIDOR. The authors reported the performance of the method of 100%, 86.40% and 98.48% for all the testing sets. The average detection accuracy of 98.00% is achieved. With a few accuracies, Hou et al. [14] applied template‒matching based on the best‒buddy similarities to locate OD and report detection. The method had an average ACC of 100% and 97.70% in DRIVE and DiaretDB1. Pruthi et al. [15] used the ant colony optimization and Cuckoo search technique to detect OD. The initial stage in their study was the median filtering on the RGB (Red, Green and Blue) channel of the input image, followed by contrast enhancement using the adaptive histogram equalization technique. The OD detection method achieved the highest accuracy of 99.55%, 100%, 100% and 98% in DiaretDB1, HEI‒MED (Hamilton Eye Institute Macular Edema), DRIVE, and STARE datasets. Nergiz et al. [16] have developed a method that detects the OD using the fuzzy logic controller. The method was evaluated with the success score for detecting OD of 100%, 91.35%, 90% and 100% in four open-access datasets: DRIVE, STARE, DiaretDB0, and DiaretDB1, respectively. Also, Pruthi’s work was done on HEI‒MED and STARE, which require more image processing than contrast adjustment. The study by Guo et al. [17] detects the OD with the fractional-order Darwinian particle swarm optimization. Then, OD boundaries are detected using the Canny edge operator and ellipse–fitting. Lastly, the contour of OD was obtained by computing the size of the encircled region. Fu et al. [18] detected OD using deep learning based on a neural network and used optimal Otsu’s thresholding. The method proposed by Li et al. [19] also segmented OD candidates using a multi-stage, region-based, convolution neural network and support vector machine, which were used to locate the OD. Furthermore, Ünver et al. [20] performed OD detection based on the statistical edge segmentation and circular Hough transform. In DRIVE, DiaretDB0 and DiaretDB1, this method had an average ACC of 100%, 96.92% and 98.88% respectively. Diettera et al. [21] proposed an OD detection based on strong technical artifacts with a two-stage method. The OD was initially detected using vessel orientation and brightness to segment the region of the OD. Afterward, the OD boundaries were located using a modified score function by Lu [22]. As a result, this provides more than 95% of the detection using 5,052 images. Also, the method achieved an overlap score of 88.80% in OD detected by the method, confirmed by an expert ophthalmologist. In the study by Mvoulana et al. [23], the OD is localized based on combining a brightness criterion and a template matching method. Finally, the OD boundary was developed by Joshi et al. [24] and used the interference map and thresholding technique to localize the OD. Finally, OD occurrence was detected using the graph cut, a method presented by Naqvi et al. [25] in OD detection. They detected OD using variation active contour estimation, and then the OD boundary was extracted by the gradient–independent, active contour model. Raj et al. [26] proposed the Harris corner detection technique followed by Voronoi image decomposition to detect the OD using the structural features found in blood vessels from the retinal images. The proposed method obtained the SEN, SPEC and ACC of 85%, 97% and 96%, respectively. Furthermore, Zabihollahy et al. [27] presented a deep learning method to detect OD from the retinal images obtained from patients with DR. The OD center was localized, and OD locations were refined using the random forest method. Afterward, a Convolution Neural Network (CNN) was used to detect OD from the chosen ROI in the retinal images. The method has been tested on 49 images of a public Indian DR image. Zou et al. [28] formulated an algorithm based on salience–based segmentation and connectivity before finding the OD location. Also, thresholding and ellipse fitting‒based methods were used to estimate the area of the OD. To improve the methods by Kumar et al. [29], a new method was proposed based on mathematical morphology and watershed algorithms for detecting the blood vessels and OD area. They proved that the ensemble methods could perform better than a single method for detecting the OD. Similarly, Abdullah et al. [30] developed an automated OD detection using an active contour followed by fuzzy clustering. This algorithm was tested on DRIVE, DiaretDB1 and DRIONS and obtained an average ACC of 100% and 97.53% on STARE. The method achieved accuracy and overlap of 97.01% and 99.46% in these four datasets. Lu et al. [31] introduced a new method for accurate detection of OD by using the Grab cut method. The author reported performance of ACC, SEN and SPEC was 99.72%, 92.87% and 99.96% on RIM‒ONE (Retinal IMage database for Optic Nerve Evaluation) and DRISHTI‒GS dataset. Recently, Kim et al. [32] used a deep learning framework based on AlexNet with a linear regression to locate OD on three open-access datasets, namely EyePACS (Kaggle EyePACS. Diabetic Retinopathy Detection Identify signs of diabetic retinopathy in eye images), Messidor and IDRID (Indian Diabetic Retinopathy Image Dataset). The method achieved an accuracy of 88.35% and 97.66% for the merged image dataset. Guo et al. [33] found that OD had been detected based on an index of convexity and concavity and the weighted gradient accumulation map and reported ACC performance of 98%, 98.40%, 98.80% and 100% for MESSIDOR, DiaretDB0, DiaretDB1 and DRIVE, respectively.
The above literature review shows successful reports show that a Computer-Aided Diagnosis (CAD) system can help with retinal image segmentation. Nevertheless, a common challenging task in the above and the main limitations of literature can be summarized as; i) these algorithms detect good–contrasted OD when using required image pre-processing methods; ii) the result may be false detection when there is a presence of artifacts or noise, low contrast, abnormalities and lesions in retinal images; iii) the proposed method was evaluated with a standard publicly available online dataset and private dataset. However, the researcher did not consult an expert ophthalmologist during the detection process to see if it was consistent with the diagnosis and iv) ambiguity in the segmentation together with detection of size, location and precise boundary of OD.
The purpose and contributions of the proposed method to adopt the detection of OD can be summarized as follows: i) the application is capable of detecting the area of the OD with false detection that is substantially lower than another existing method in the literature; ii) the application is capable of detecting the small pixel of OD in a low‒resolution image, many of which other applications cannot handle properly; iii) the application has robustness as well as substantially and is faster than other existing methods in the literature and iv) the pixels with the pixel density or compactness feature along all connected are determined, which could be used to locate OD and boundaries accurately.
The method proposed in this paper aims to locate the OD and boundaries in low-resolution images. This application will help experts to assist in the early diagnosis of eye diseases based on the detection of retinal images. The proposed method is tested and evaluated in the retinal images datasets, including DiaretDB0, DiaretDB1 and STARE. The flowchart of the proposed method is shown in Fig. 2.
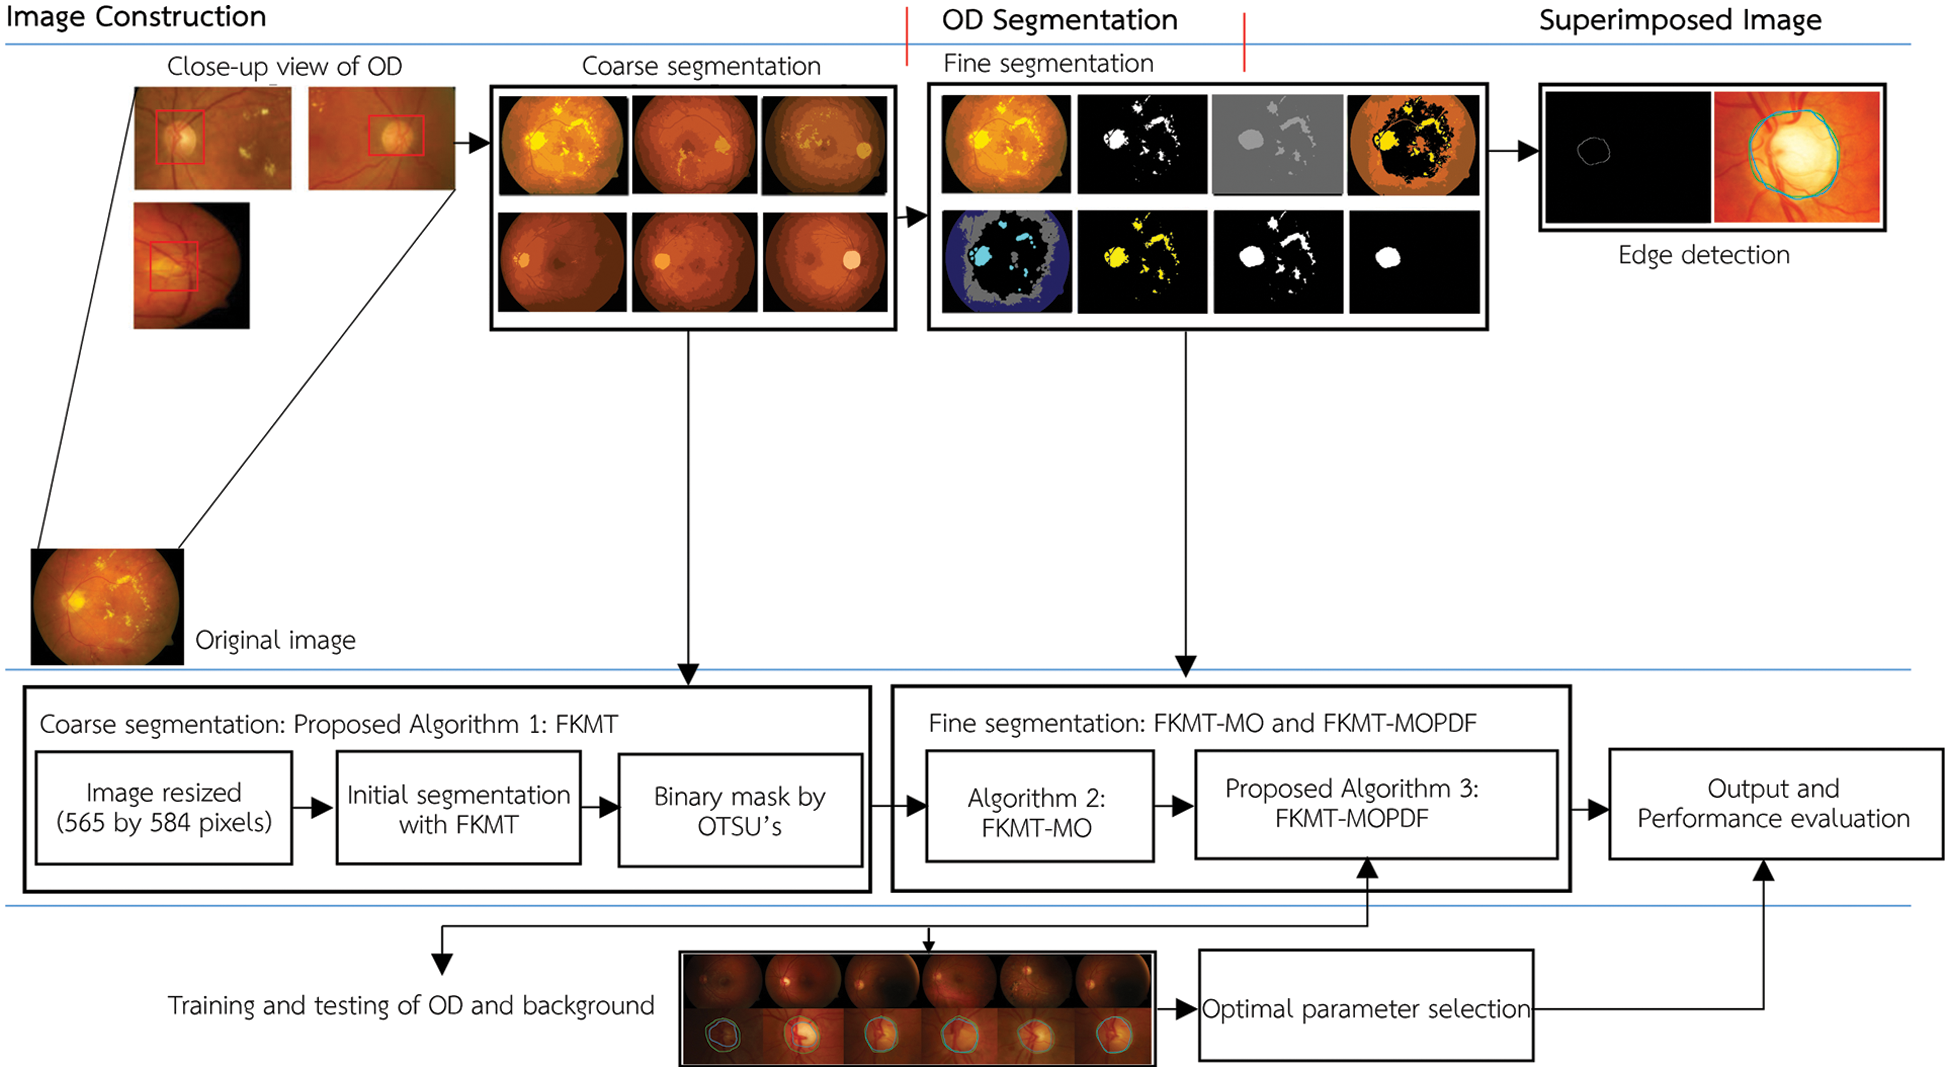
Figure 2: The flowchart of FKMT–MOPDF proposed method
Using the open-access dataset, 616 images were randomly selected. The retinal images were in the DiaretDB0 [34] and included 130 images, of which 110 contain different signs of DR as a sign of DR like cotton wool spots, hard and soft exudates and so on. DiaretDB1 [35] was developed for training and testing for the detection of OD. The dataset consists of 89 images, of which only 84 have DR signs and the remaining 5 images are normal. The STARE consists of 397 images captured by a TopCon TRV–50 retina camera with 35‒degrees Field of View (FOV) [36]. During image acquisition, retinal images configurations are set as follows: i) DiaretDB0, the retinal images were captured at 50‒degrees FOV with the size of 1,500 × 1,152 pixels, ii) DiaretDB1, each image resolution was 565 by 584 with a 45‒degrees FOV, 3) STARE, the retinal images were in color and were 700 by 605 pixels, with 24‒bits per image.
3.2 Proposed Algorithm 1: FKMT
We use FKMT (Fuzzy K‒Means Threshold) as the backbone because assigning a single point in a soft cluster can belong to more than one cluster for overlapping, while K‒means seeking the hard cluster of the points and belongs to one cluster. The principal method of FKMT and initial fuzzy segmentation matrix U of K group are defined in Eq. (1) [37].
This method of fuzzy knowledge is based on the satisfaction of the fuzzy partition such that a set of properties defines the constraints in Eq. (2).
The method is an iterative clustering that gives the fuzzy C–cluster by minimizing the weight within group sum of squares of distances in each cluster. In the determination of the fuzzy C–partition matrix U for grouping a collection of n data points into C classes, we define an objective of the function Jm for a fuzzy C‒partition which is defined in Eq. (3).
Here C is the number of clusters in a set of n data set, N is the number of sample data point (stored in a data matrix X), m is a parameter that determines the degree to which partial members of a cluster affect the clustering result, uij is the membership degree function of xi, X = {x1, x2,…, xN} is a set of N objects, where each observation is a S‒dimensional vectors and can be investigated as a set of points in a high–dimensional data space, V = {v1, v2,…, vK} is a set the mean of a matrix of class centers, ||•|| is the squared distance between individual xi, xi is the i‒th of d‒dimensional vectors measured sample data, cj is the class d‒dimensional center of the cluster and center cj according to a chosen definition of distance which is an arbitrarily any real number that is said to be rational if greater than or equal to one, yes. The squared distance between i‒th and j‒th shown in Eq. (3) is computed in A‒norm by Eq. (4).
With these observations, we can decompose Jm into its basic elements to see what property of the points (xi) is measured by Eqs. 5(a–d).
Input to the FKMT is the number of clusters K when m > 1, under the assumption that xj ≠ ci, and then with update of membership uij by Eq. (6).
where uij is the degree to which element xj belongs to cluster ci,
To obtain centroid Eqs. 5(a–d), membership Eq. (6) and solutions Eq. (7) are used in an iterative fashion to update the memberships and until the centers or memberships are constant to within some small value. This process stops when Eq. (8) is the defined number of iterations reached.
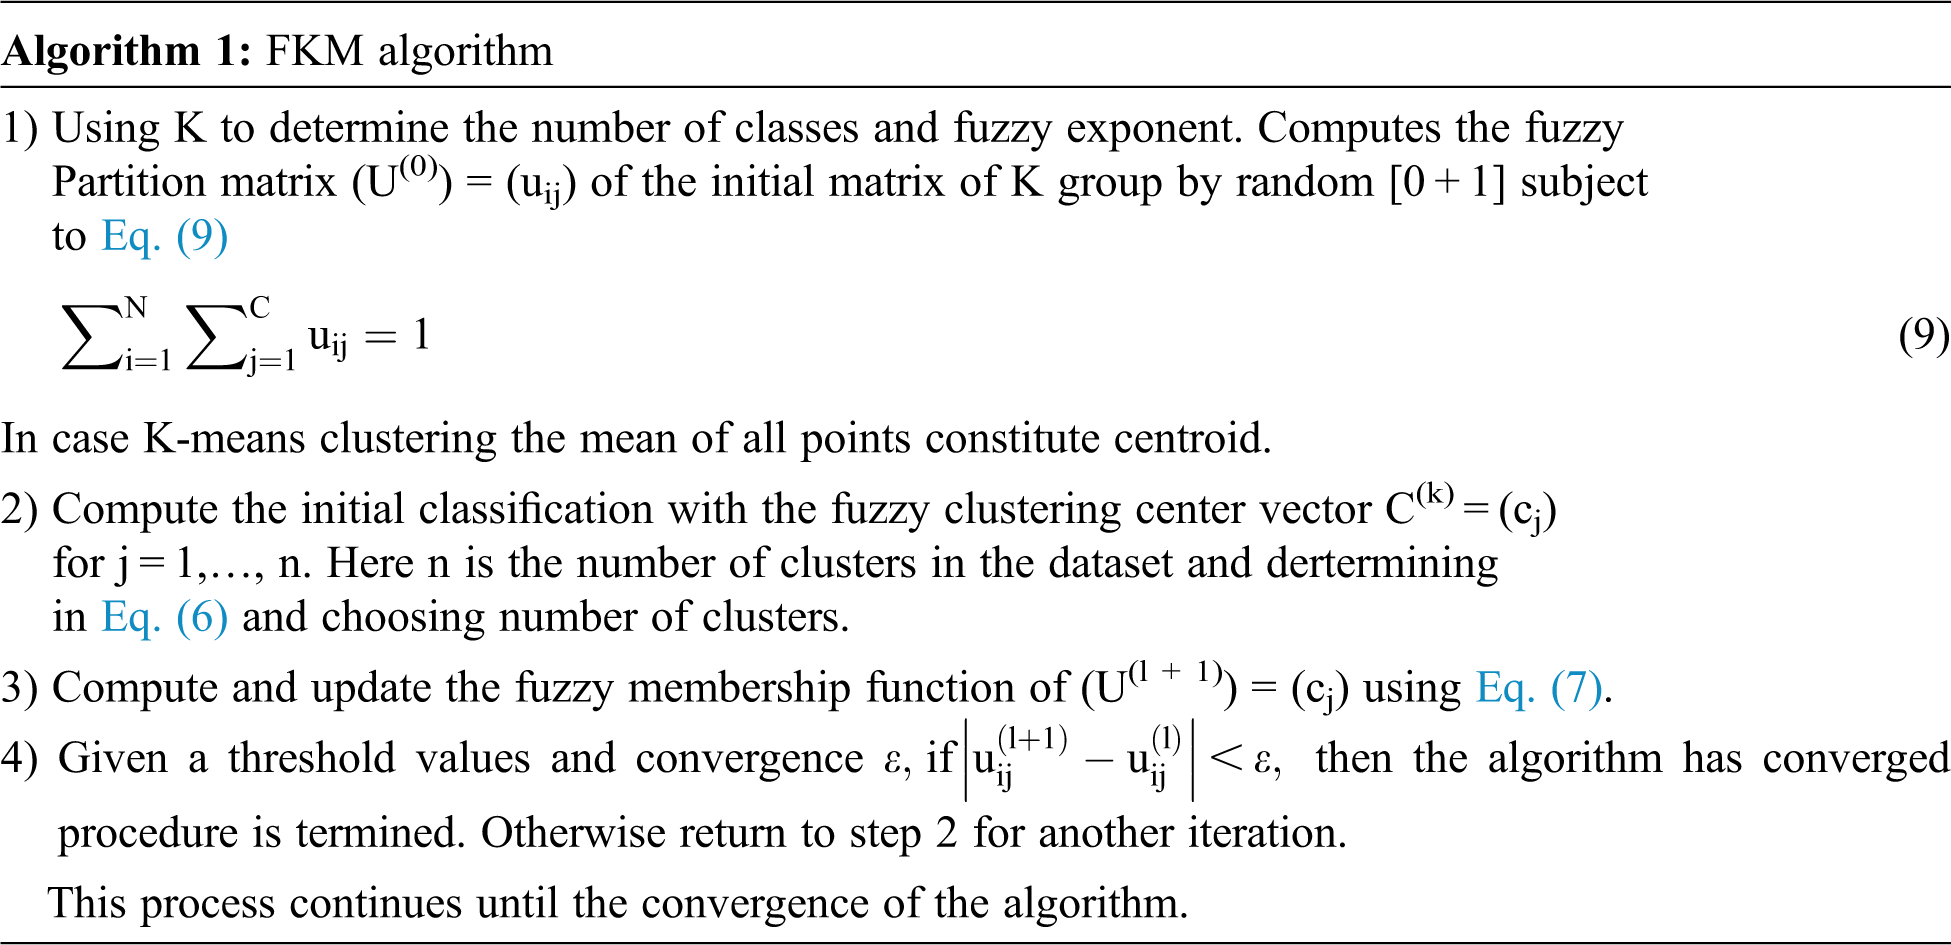
where T is a termination criterion, K is the iteration number. The input to the FKMT method is a set of features. The effective algorithm for FKMT is called iterative optimization as follows in Algorithm 1.
In this study, assuming that we want to use FKMT to partition the dataset into two clusters (i.e., the background and optic disc pixel), we set the parameter m in FKMT at 2 and the initial method to coarse segmentation. The obtained clusters were then optimized to get the fuzzy set and segmentation result, as illustrated in Fig. 3 and then the binary mask by OTSU is done with the threshold value of 0.67.
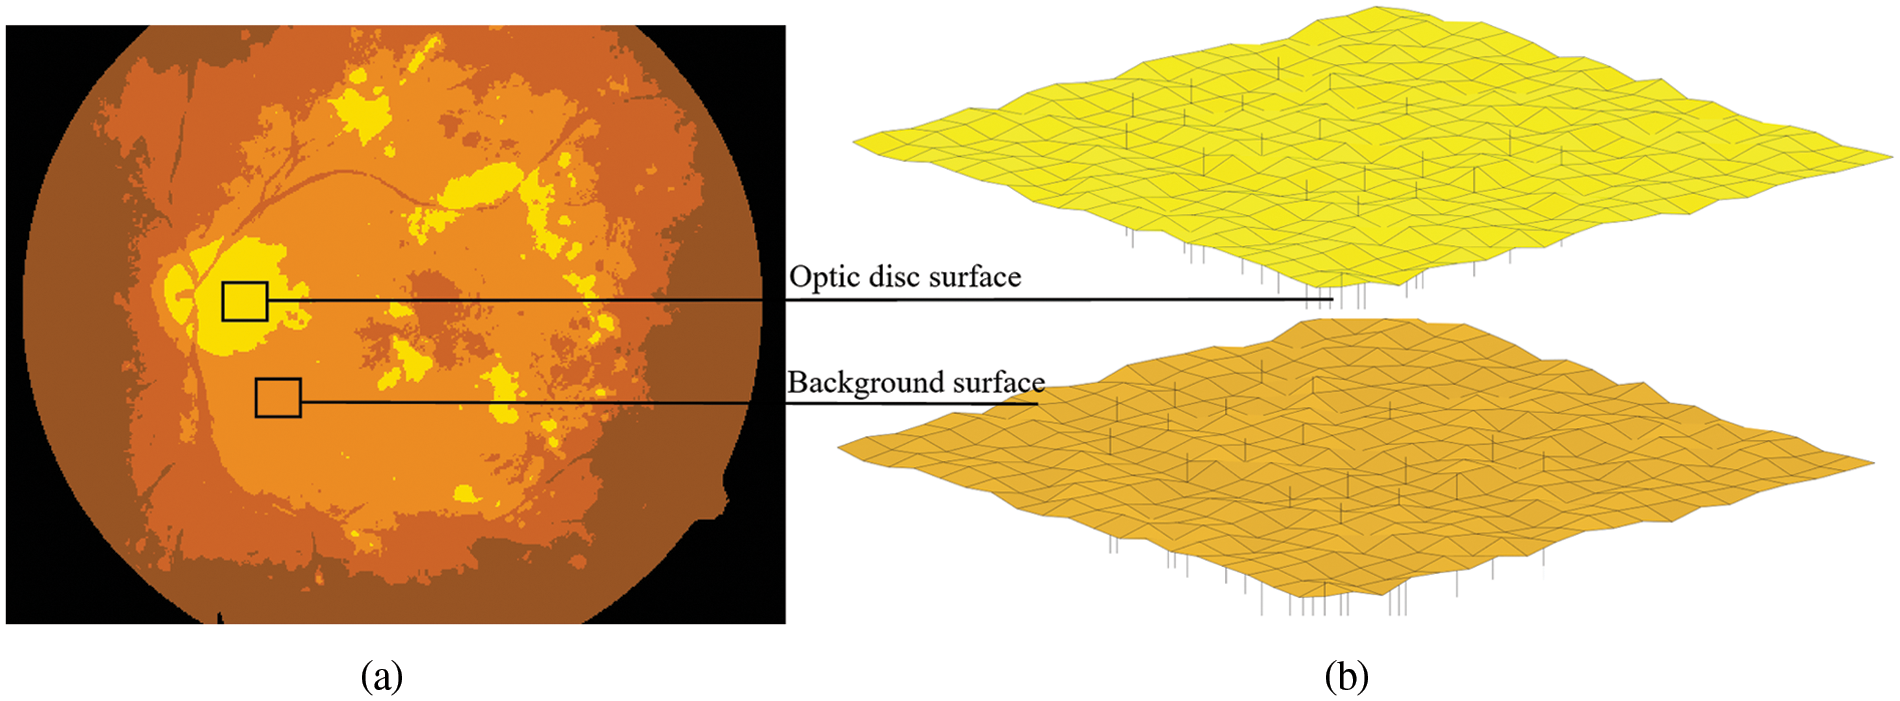
Figure 3: The example segmentation processes for the proposed FKMT to estimate the OD. (a) OD segmented, (b) the mesh and surface plotting functions display OD surfaces in 3–dimensions, in which intensity images are OD segmented
3.3 Proposed Algorithm 2: FKMT‒MO
The second proposed method is named FKMT‒MO (Fuzzy K‒Means Threshold (FKMT) and Morphological Operation (MO). To improve the backbone FKMT presented in Subsection 3.2, we incorporate OD binarization into a morphological dilation operation. Binary image transformation is done by applying OTSU’s threshold, which is used to remove background, DR lesion and blood vessels in the retinal images. Then, all the resized images are used for binary image transformation and its threshold is normalized, which the minimum and maximum threshold values between 0 and 1 inclusively [38]. In experiments on OTSU, the threshold value between 0.28 and 0.85 (0.28, 0.42, 0.55, 0.67, 0.71 and 0.85) was selected, and it was observed for different threshold values that the value of 0.67 is more suitable to remove the background pixel without affecting the OD pixel of the image. Examples of binaries images with a threshold value of 0.67 are presented in Fig. 4a. OTSU’s threshold has been successfully used in the binary mask stage. However, in some cases where illumination in retinal images is non‒uniform, the OD may be considered background after thresholding the image. On the other hand, the segmented OD may be less than the actual OD in this process. As it is challenging to use coarse segmentation, we propose using MO (Morphological Operation) based on a dilation operation as all the binaries images. In this stage, a disk-shaped structuring element with a radius from 1 to 10 is used to dilate OD detail. The detailed steps of MO are explained as follows:
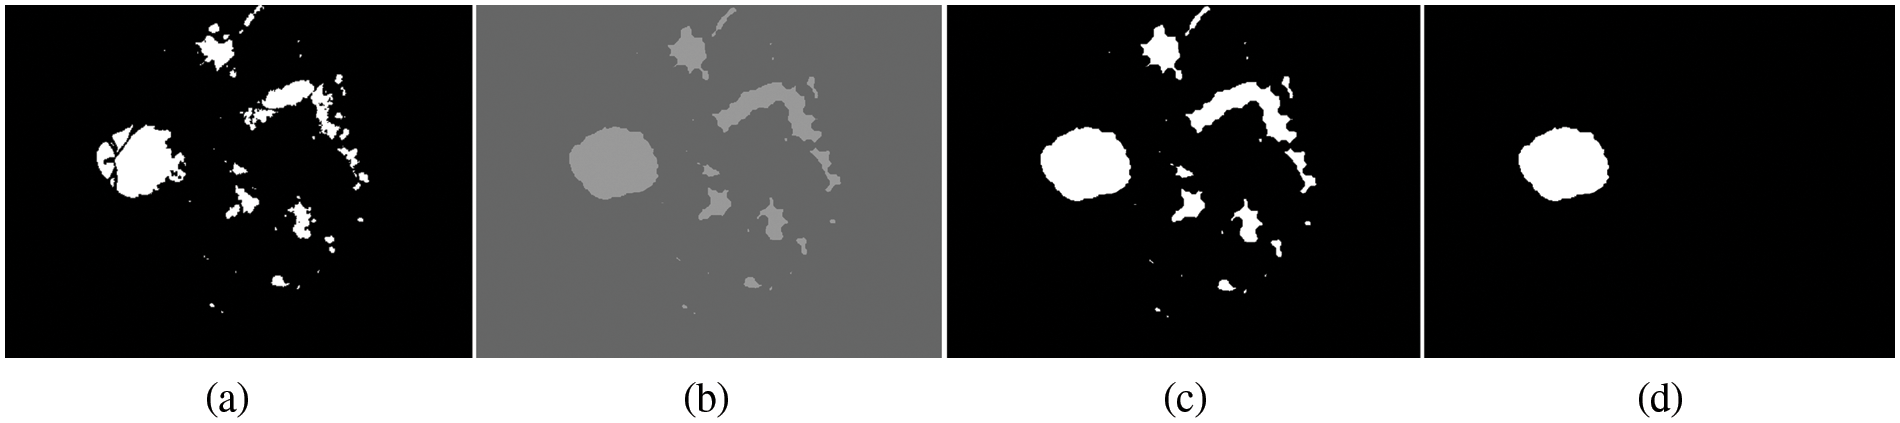
Figure 4: Processing for OD detection. (a) Candidate OD segmented, (b) morphological dilation, (c) binarization and dilation, (d) OD detection
For a square binary image, the sets in question are members of the 2‒dimensional integer elements Z2, here the element of the A is the tuples (2‒dimensional vector) that represent all vectors in OD pixels in the image. Let A and B be a set in Z2, morphological dilation is defined by the expression. The morphological dilation of A by B denoted as
Dilation is based on reflecting B about its origin and shifting the reflection by z as in erosion. The dilation of A by B then is the set of all displacements z, such that reflection of B and A translate and overlap by at least one nonzero element. Based on interpretation, Eq. (10) can be written equivalently using Eq. (11).
By using morphological image processing with disk‒structuring elements, we can create the strel object function. The experiments are performed using the flat morphological structuring element of size 7, which has suitable values to produce a more accurate segmentation of OD. The result of filling gaps by using a morphological dilation operation is shown in Fig. 4b. The same threshold value is applied for translation in a binary image to a binary mask for every pixel. Initially, the threshold value starts from 0.20 and is then increased to 0.85 iteratively until the best way to get the suitable value. In this experiment, it was observed that the threshold value of 0.70 is very much suitable for detecting the OD for all three datasets. The reason for increasing the threshold value by 0.28 to 0.85 is that the OD is segmented at this threshold point. If the threshold value is decreased from 0.66 to 0.20, it was observed that the OD missed a small region of the OD detection, which is primarily incorrect segmentation.
3.4 Proposed Algorithm 3: FKMT–MOPDF
We proposed the third method: FKMT–MOPDF (Fuzzy K‒Means Threshold and Morphological Operation with Pixel Density Feature), by calculating the compactness feature for all the connected regions. FKMT–MO is feed-forward for PDF (Pixel Density Feature) and feature learning with the biggest area among all the regions of retinal images. PDF is developed to locate the OD-specific image and achieve a better result and less computation time as it does not compute on the DR region. PDF is defined as the ratio of the OD region to the region of a circular shape with the same perimeter. Therefore, the compactness feature means the pixels of OD are connected and grouped. The compactness features can be calculated using Eq. (12).
where Com is the compactness feature of OD connected region, Area is the shape or number of pixel in OD region and Perimeter (Perimeter = 2π(radius/2)) is the boundary shape or number of pixels around the OD region. This compactness represents the location of OD. Fig. 4d shows the result of the OD with compactness feature by Eq. (12). OD region searching is stopped when the pixel satisfies the predefined criteria. The OD connected region is tested for the different pixel sizes of 2,800, 3,000, 3,200 and 3,400 and selected 3,200 for compactness features binary mask creation. From that knowledge, the OD candidate features having connected pixels less than 3,200 are considered background and removed from the binary mask creation image. Due to the retinal images being tested on different datasets, some OD regions are smaller or bigger than the PDF; in that case, the compactness feature threshold is reduced to 2,800 and 1,500 pixels. The resulting image of the highest pixel is classified as an OD segmentation. Algorithm 2 shows the pseudocode of the proposed FKMT–MOPDF method.
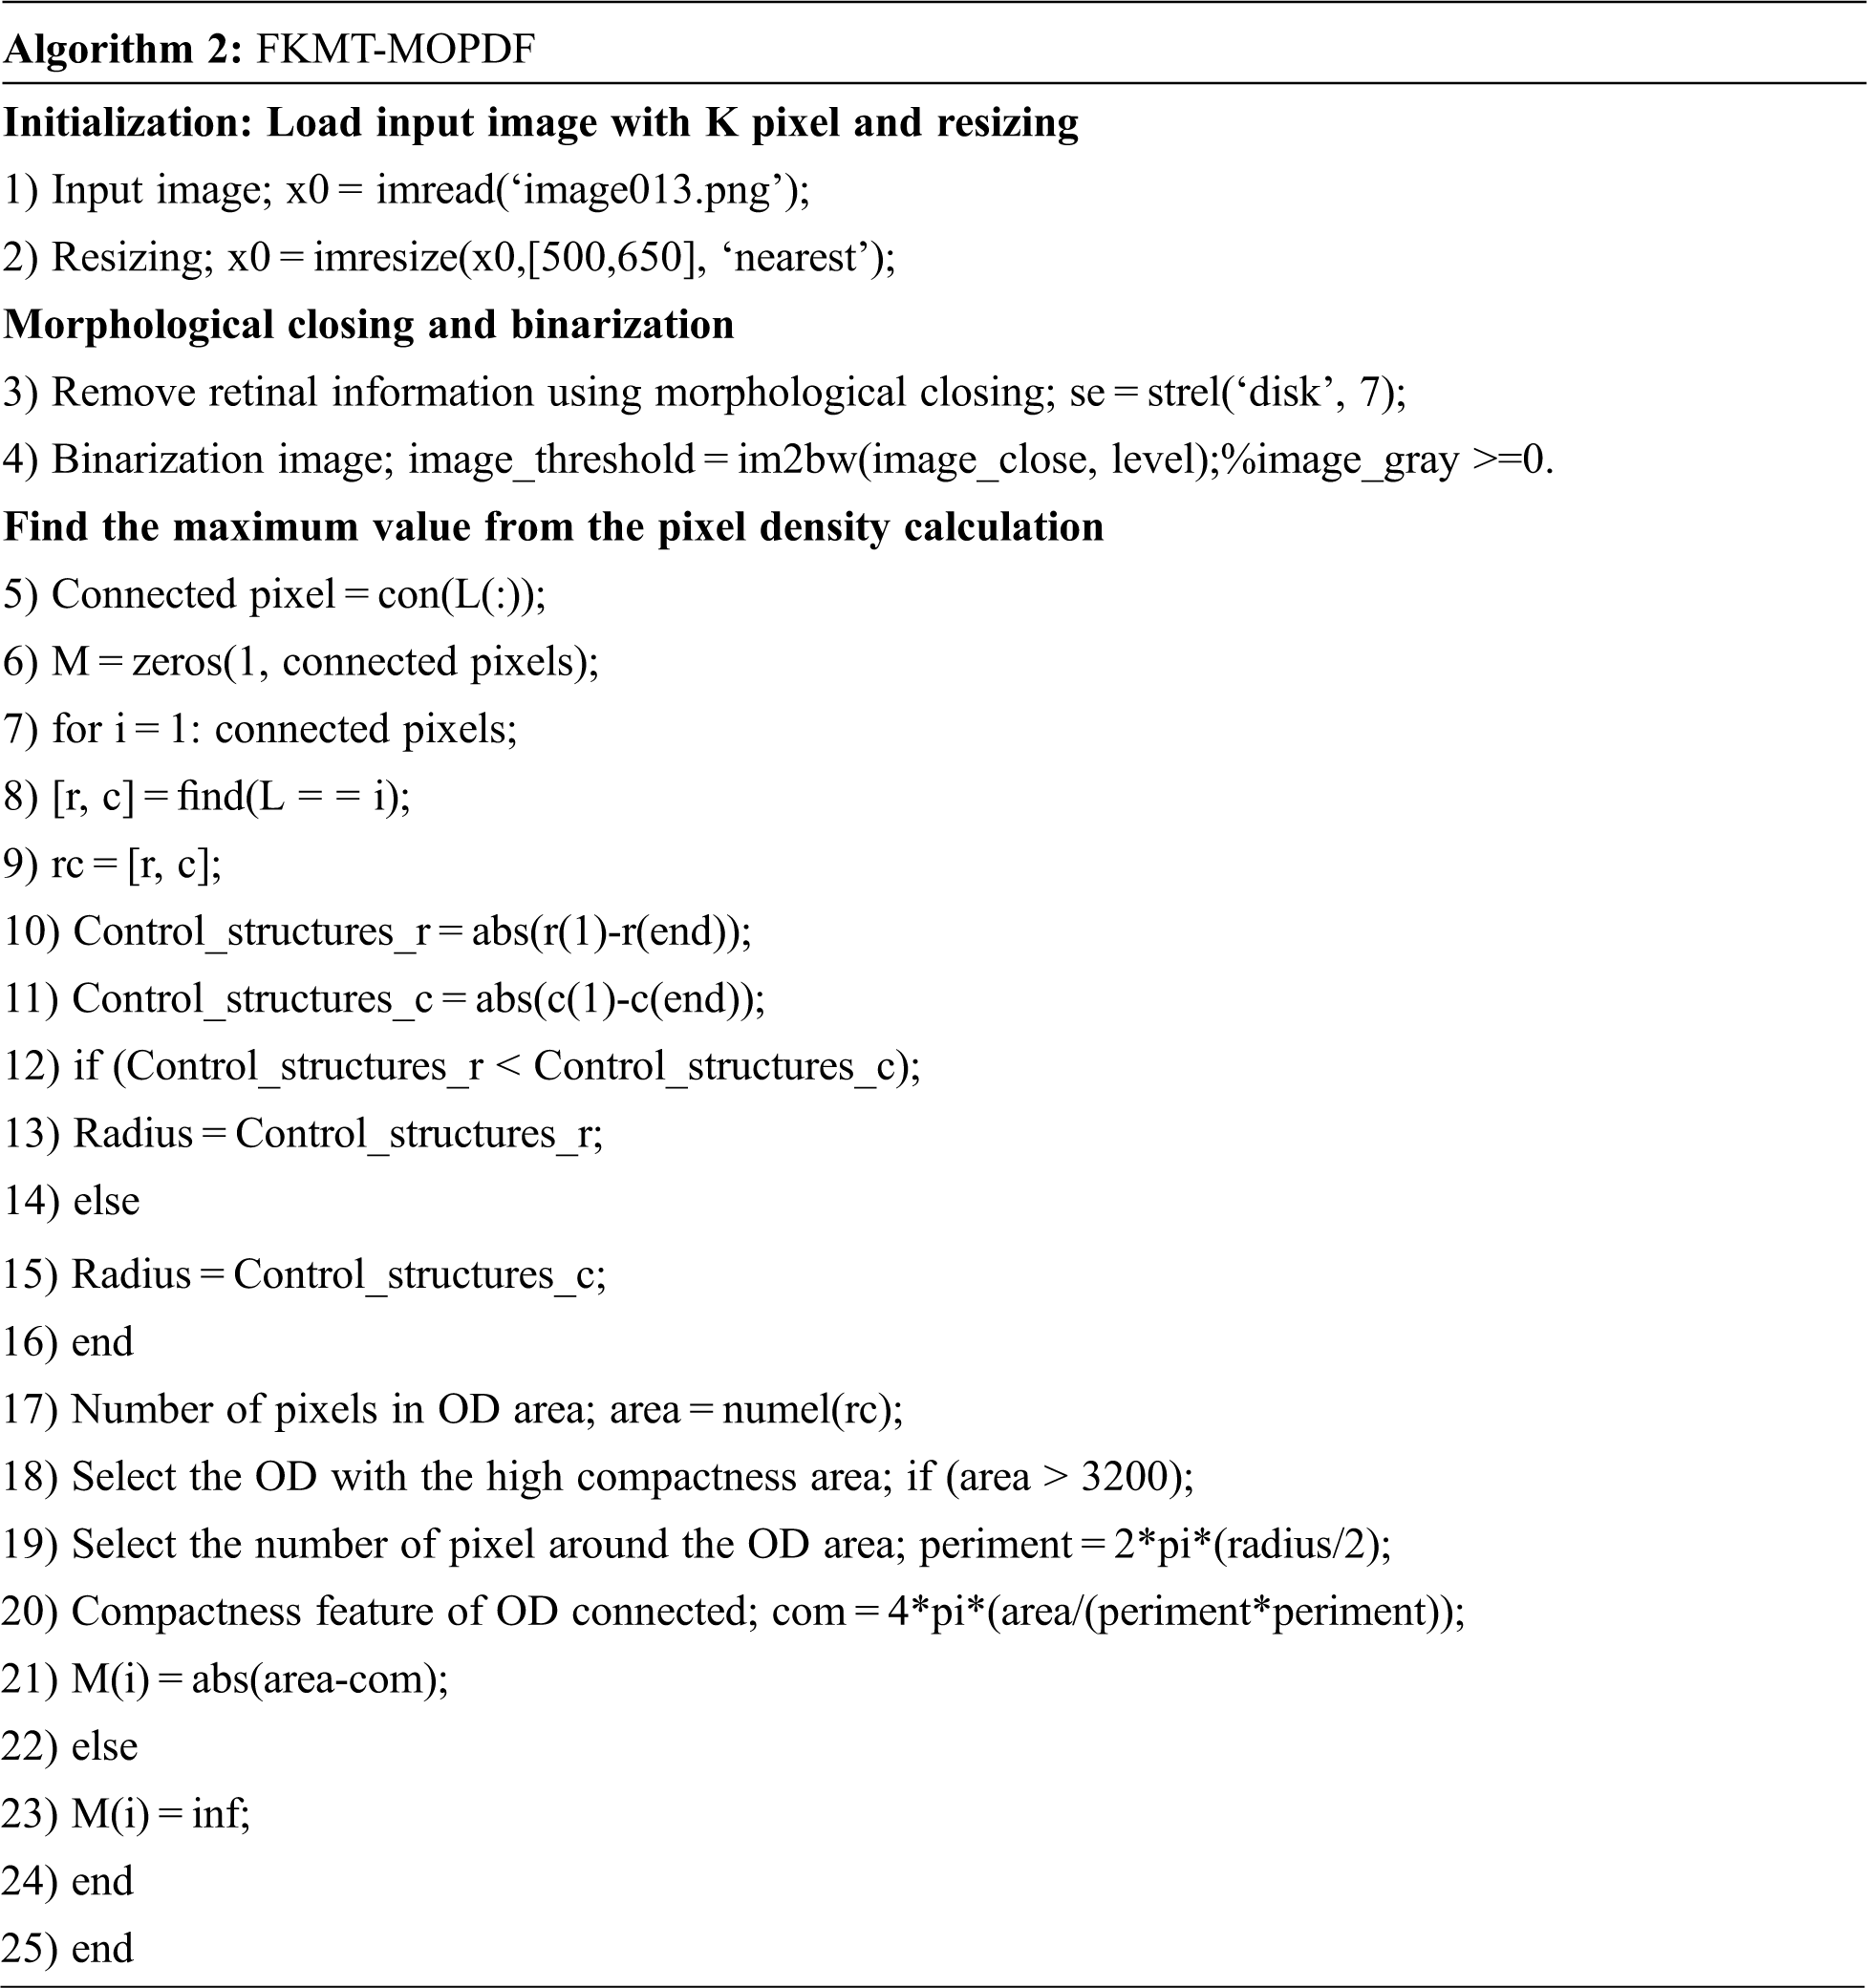
The novelty of the methodology is that an improved FKMT based on MOPDF for OD detection using the compactness feature will be adjusted to between 2,800 and 3,400 pixels. This value used in the proposed method on all three open-access datasets is compared with the ground truth for the real image. We set the FKMT as 7 clusters suitable for OD coarse segmentation for the testing parameters. After OD is segmented, the binary mask is done with the threshold value of 0.67, using suitable values to produce a more accurate OD segmenting without affecting the image pixel. Then, morphological dilation operation using a flat structuring element with a radius of 7 is used to process fine segmentation as the shape of OD is almost like a disc. For circular shape segmentation, the OD candidate features with connected pixels less than 3,200 pixels are considered background and removed from the binary mask creation image. Finally, the Sobel edge detector is used to achieve the edge of an OD by total pixel density region calculation.
This section presents evaluation criteria, OD detection results and a comparison of performance measures metrics in detection with the existing method. Each method is tested with the OD features used as input and evaluated on the test set. This means that efficiency measures are created by comparing input and output; see expressing measurements with three or more variables.
In each evaluation, the detection performance of all three proposed methods is compared with the ground truth images. We denote the performance of OD accurately detected as two criteria. First, the pixel‒base evaluation measures were validated in terms of SEN, SPEC and ACC values. SEN represents the detected OD pixels as belonging to OD pixels. Here, SEN, which is the outcome of OD pixels accurately detected as OD by the algorithm, is calculated using Eq. (13) [18].
SPEC represents the detected pixels as non‒OD as belonging to non‒OD. Here, SPEC, which is the outcome of non‒OD correctly detected pixel as non‒OD by the algorithm is calculated in Eq. (14).
ACC is determined as the sum of correctly detected pixels as OD plus the sum of the total number of pixels as non‒OD and is divided by two as calculated in Eq. (15). The proposed method achieves higher accuracy values which means a better algorithm.
Based on the confusion matrix, the performance metrics were computed by the value of TP (True Positive), which is the result of OD detected where the method correctly detects the positive class, TN (True Negative), which is the result of non‒OD detected where the method correctly detects the negative class, FP (False Positive) which is the result of non‒OD detected where the method incorrectly detects the positive class and FN (False Negative) which is the result of OD detected where the method incorrectly detects the negative class. The second criterion aimed to evaluate the OD detection based on image-based evaluation and is often called the overlapping area and corresponding manually marked regions of OD by experts and the detected OD area by the proposed method. It is possible to develop an image-based evaluation based on overlapping, which is the ratio of detected area intersection with the ratio of the marked area, divided by the ratio of segmented area union with the ratio of a marked area by three experts ophthalmologists. Overlapping criteria are evaluated over a known metric of OD overlap, which is calculated as shown in Eq. (16) [40]. These metrics score between 0 and 100 and a higher overlapping score means a better detection performance.
Detection methods have been tested on three publicly available datasets, namely DiaretDB0, DiaretDB1 and STARE are evaluated by the first criterion to show the performance of detection with different shapes, sizes, resolutions and intensity. To segment all of the OD detected, a total of 297 images were taken. We can see from Tab. 1, comparative results of FKMT, FKMT–MO and FKMT–MOPDF show their mean accuracies are 76.75%, 91.94% and 97.11%, respectively. FKMT–MOPDF shows the best accuracies among these methods in testing. FKMT–MOPDF has achieved the mean SEN of 96.74%, 97.12% and 97.19%, SPEC of 96.78%, 97.10%, 97.76% and ACC of 96.76%, 97.11% and 97.47% for DiaretDB0, DiaretDB1 and STARE based on the first criterion. In some cases, the method fails by appearing in a variety of DR. In particular, the performance results were calculated for the OD overlapping criterion in Eq. (16). The accuracies calculated were 96.92% (DiaretDB0), 97.75% (DiaretDB1), comparable to the best performance and 97.43% (STARE). A possible explanation for the result between input and output in FKMT–MOPDF, as shown in Fig. 5. Moreover, the proposed method can detect a small OD from a poor-quality image on the DiaretDB1, as illustrated in Fig. 6. However, the STARE image shows signs of DR and high bright yellowish where OD can be detected properly, as shown in Fig. 7. It may make the proposed method tend to detect OD and boundaries as the incorrect outcome. However, despite these limitations, the methodology for detecting the OD demonstrated an exciting performance in decreasing false positives in low-intensity images. The detection process for the publicly available dataset, as displayed in Fig. 8.
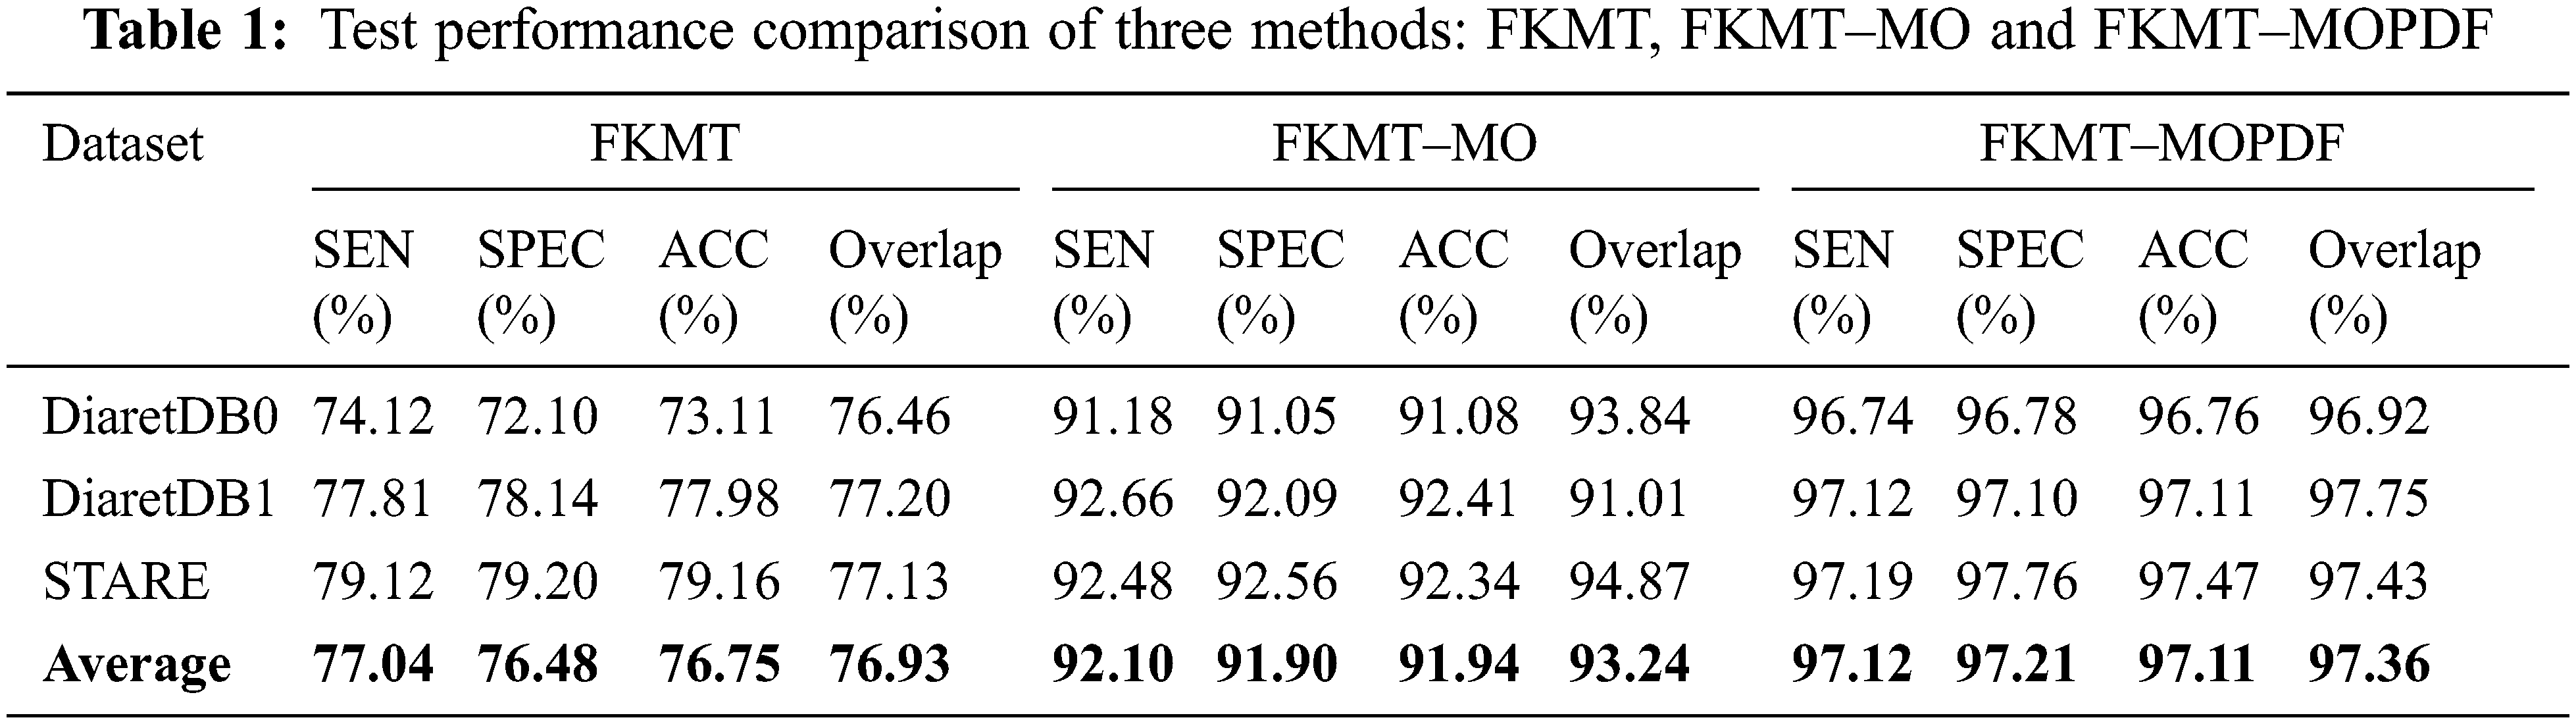
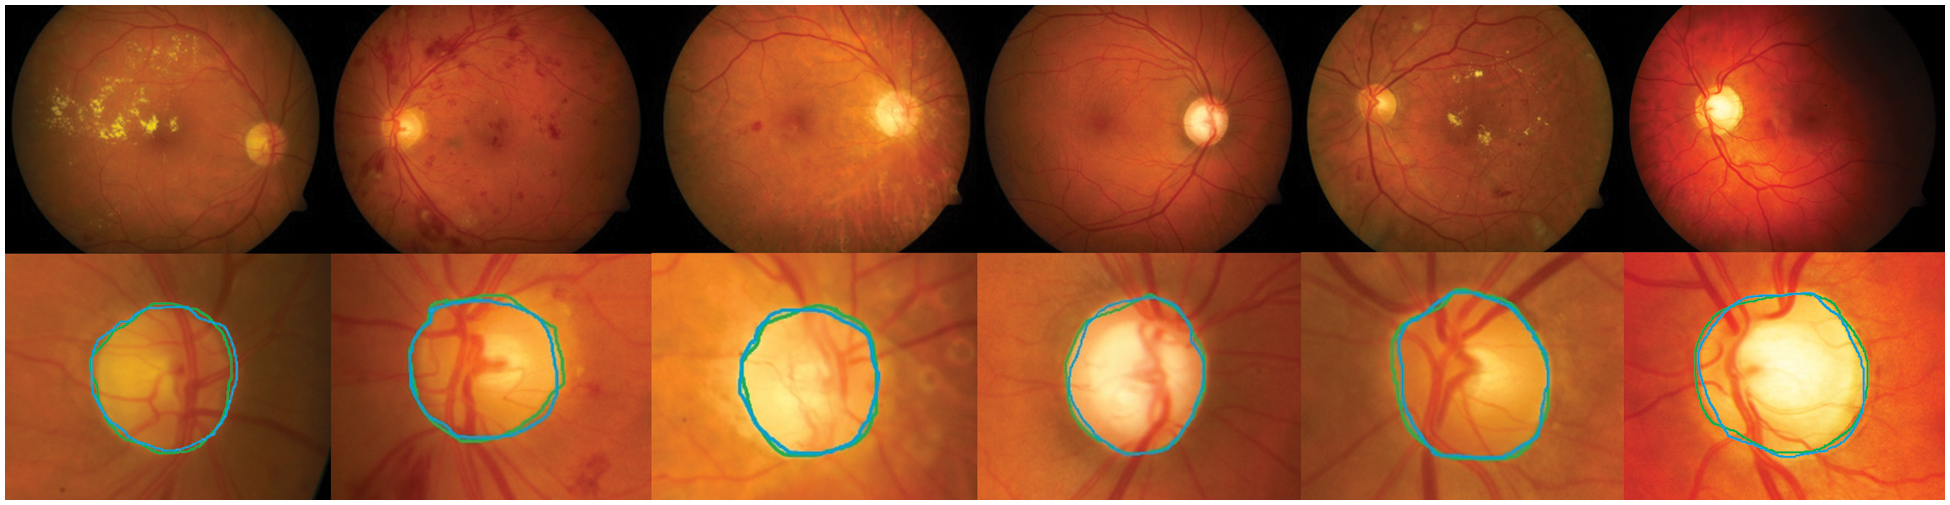
Figure 5: OD detection under the normal and presence of DR: The two rows show examples of retinal images and the close‒up view of the detected OD region. The green boundary in the second row represents the manually labeled OD by experts and the blue boundary denotes the OD detected by the proposed method
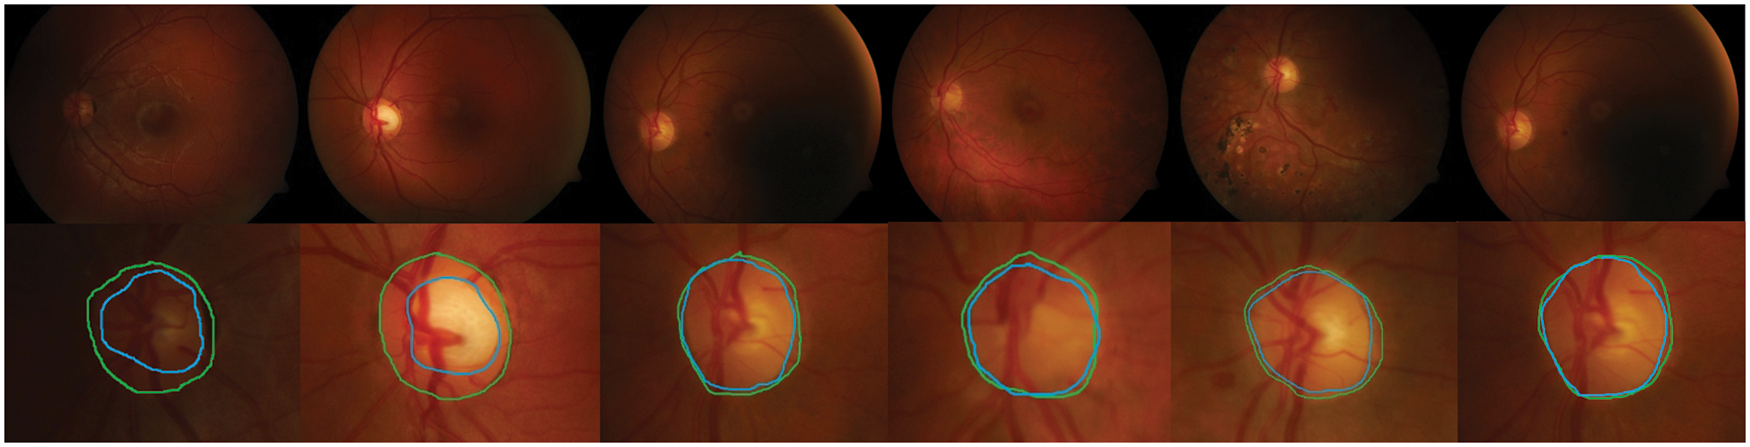
Figure 6: The proposed method can detect a small OD from the poor quality image: The green boundary in the second row denotes the manually labeled OD by experts and the blue boundary denotes the OD detected by the proposed method
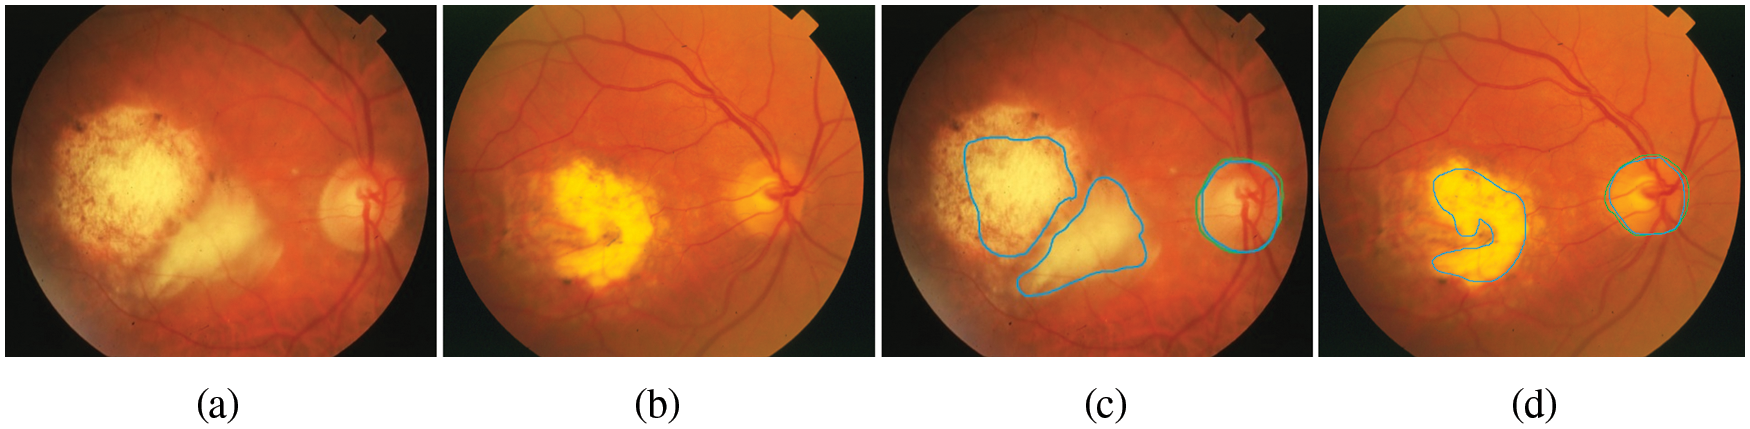
Figure 7: The retinal images show signs of DR and OD area, (a)–(b) the first row denotes the image from SATRE, (c)–(d) the OD boundary in green represents the manually labeled OD by experts and in the blue boundary denotes the OD detected by the proposed method

Figure 8: OD detection process for publicly available dataset, (a)–(d) Original image, (a1)–(d1) detected using FKMT–MOPDF, (a2)–(d2) OTSU’s with T = 0.67, (a3)–(d3) morphological dilation with disk–structure element of 7, (a4)–(d4) detected OD based on PDF by using Eq. (12)
4.3 Comparison with Other Methods
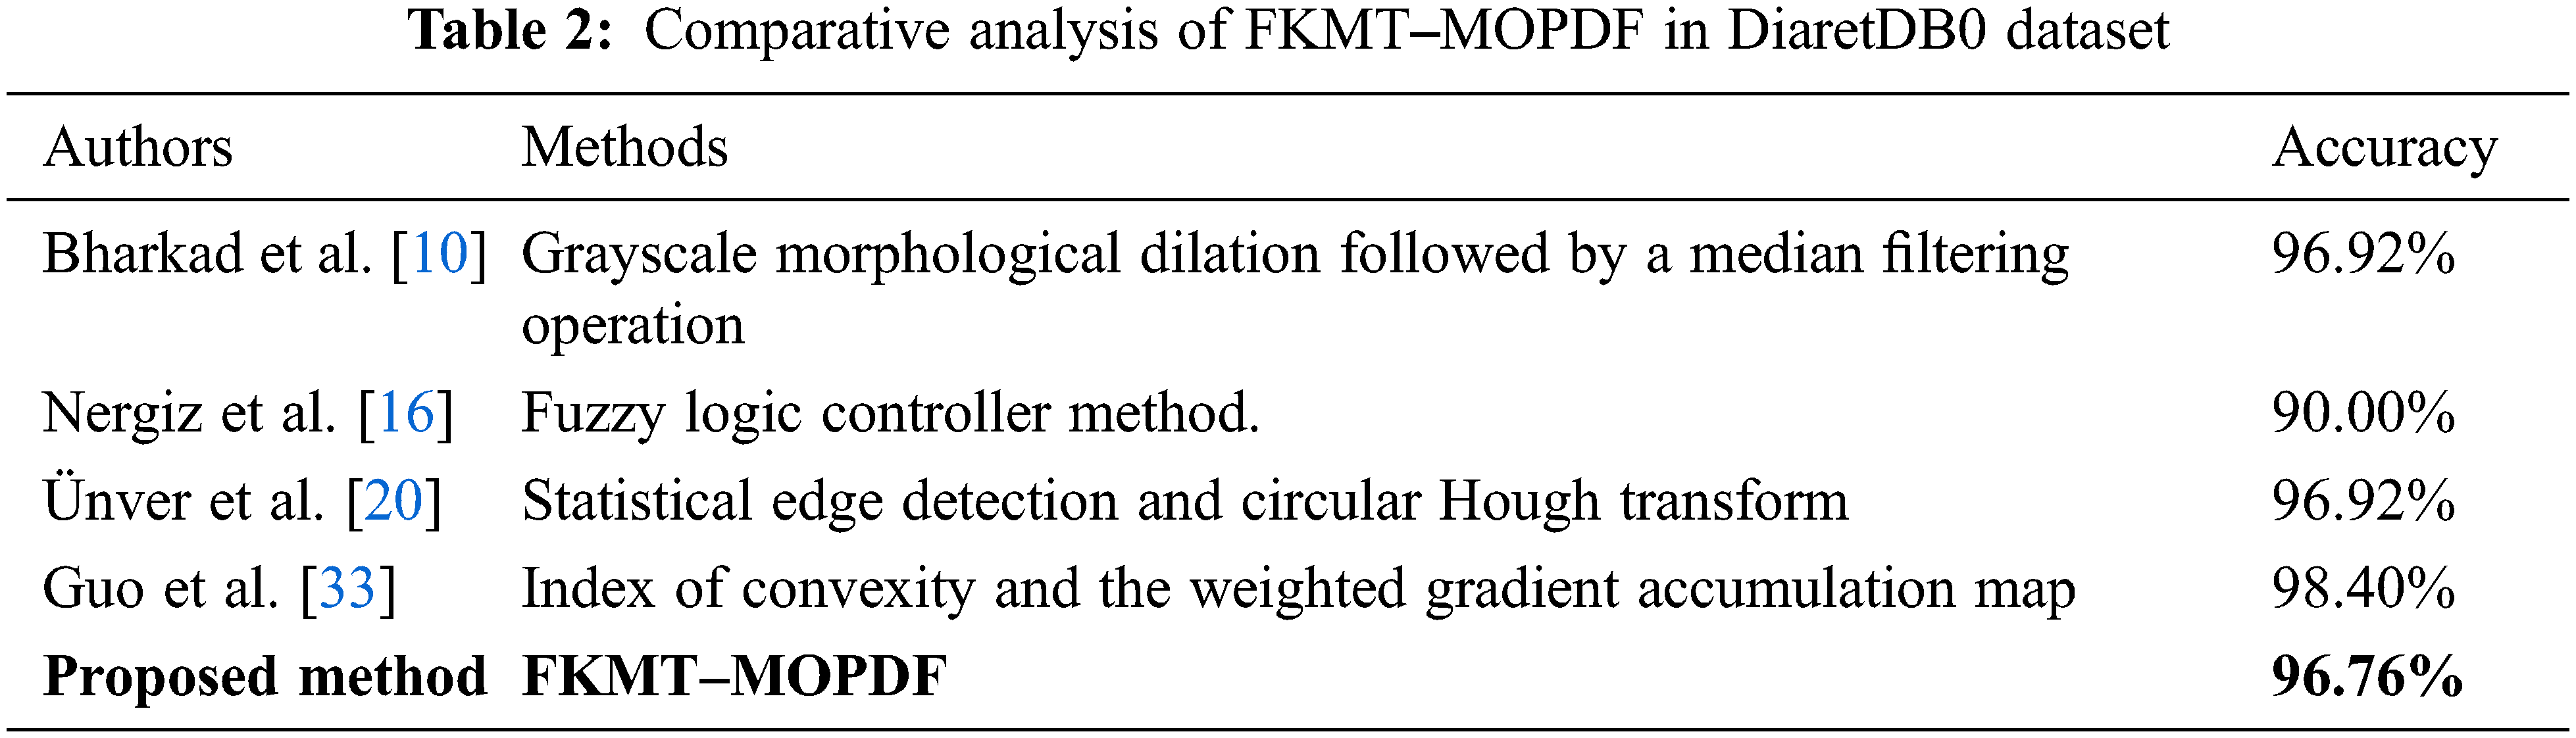
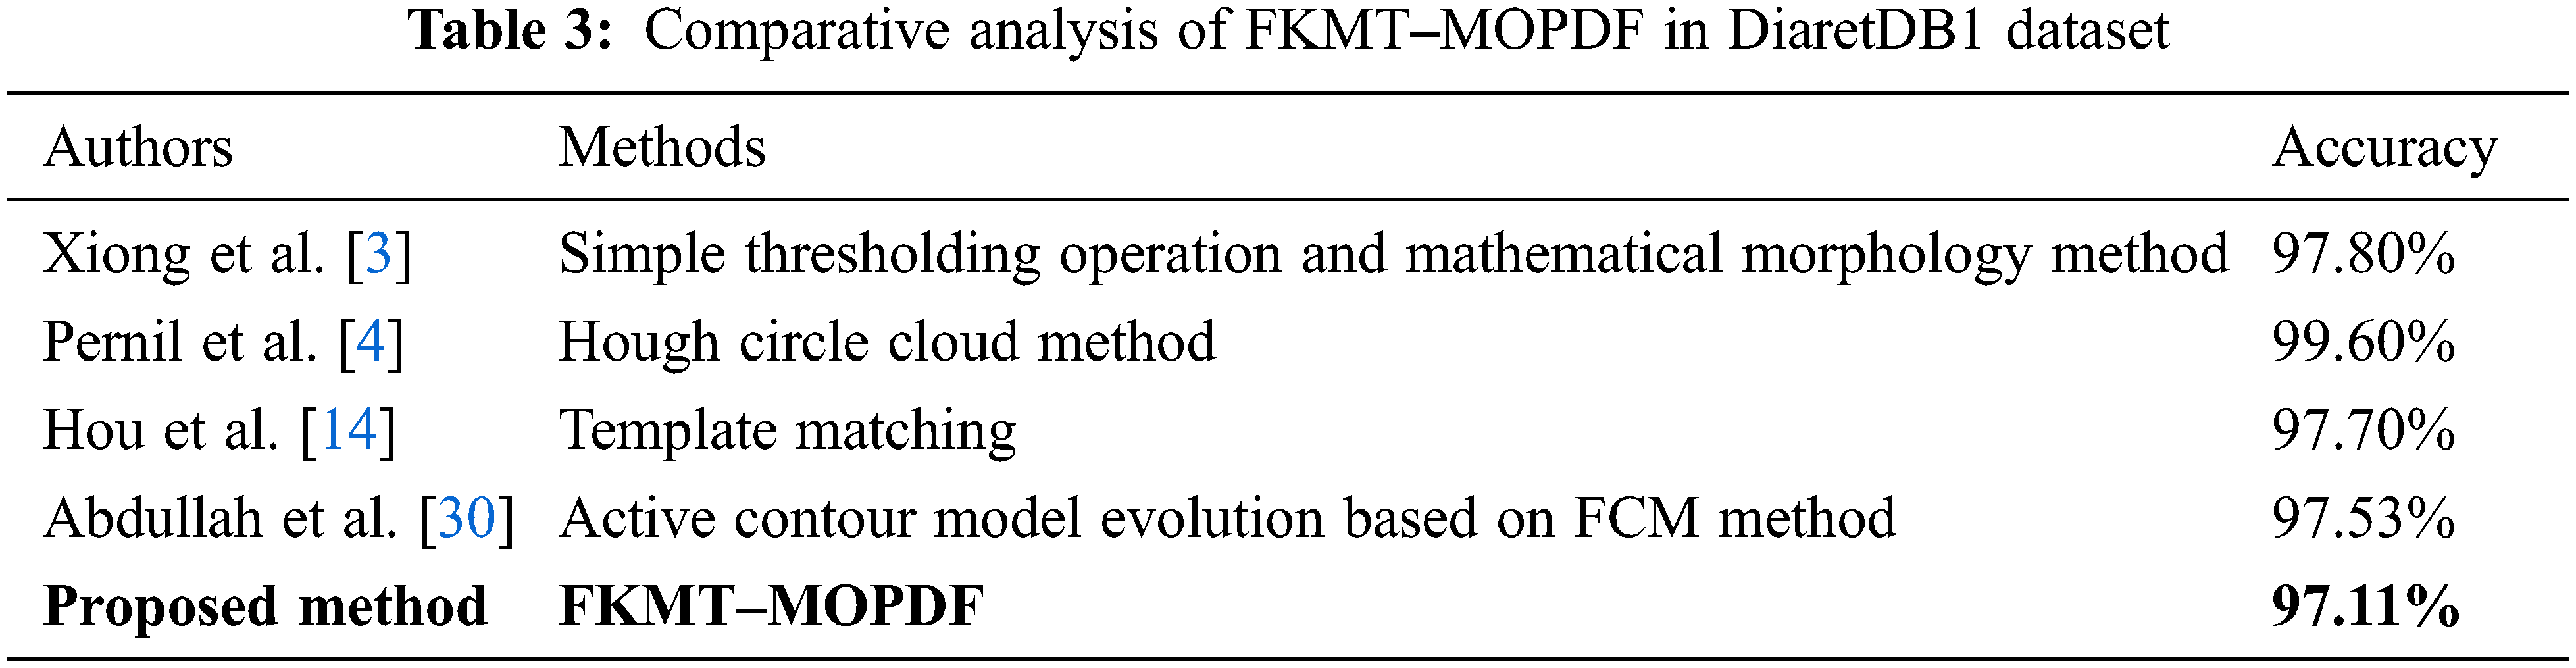
We adapt all referred algorithms to the detection task here to provide a fair comparison. However, the direct comparison of performance measures with other methods is difficult because most reported OD detection are evaluated on a private dataset. In this study, comparative studies are a method of assessment of [2, 3, 4, 10, 13, 14, 15, 16, 20, 30 and 33], including their comparison to other methods. The above techniques were selected to improve the speed and performance of OD detection. Our proposed FKMT‒MOPDF shows excellent performance compared with other works, especially with the dataset from publication with DiaretDB0, DiaretDB0 and STARE. The experimental results show that the proposed method has efficiency and accuracy of around 97%, as shown in Tabs. 2‒4.

The OD detection is proposed by implementing different machine learning methods. In experiments, the proposed method is evaluated based on two criteria (pixel-based and image-based evaluation). In the pixel-based analysis, the performance of the methods achieved SEN, SPEC and ACC, with 96.74%, 96.78% and 96.92% in DiaretDB0, 97.12%, 97.10% and 97.75% in DiaretDB1 and 97.19%, 97.47% and 97.43% in STARE, respectively. While the OD detection is addressed by the overlapping criterion and obtains an accuracy calculated at 96.92% (DiaretDB0), 97.75% (DiaretDB1, which is comparable to the best performance), and 97.43% (STARE). The results evoke that the proposed novel method based on OD detection was planned to extend the detection of eye diseases through the detection of the OD framework. In the future, the proposed method will be tested and evaluated with a new large-scale or private dataset. Results will be evaluated with another challenge in benchmarking the real-time dataset.
Acknowledgement: This research project was financially supported by Mahasarakham University, Thailand. The authors’ thankfulness also goes to the following expert ophthalmologists: M.D. Ekkarat Pothiruk, KhonKaen Hospital, Thailand, M.D. Wiranut Suttisa, Kantharawichai Hospital, Thailand, M.D. Sakrit Moksiri, Borabue Hospital, Thailand, for their kind provisions of the OD detection for this study. Finally, we thank Assist. Prof. Dr. Intisarn Chaiyasuk from Mahasarakham University who helped in checking our English.
Ethical Approval: The author of this manuscript declares that this article does not contain any studies with human participants or animals.
Funding Statement: This research project was financially supported by Mahasarakham University, Thailand.
Conflicts of Interest: The authors declare that they have no conflicts of interest to report regarding the present study.
References
1. J. Mo, L. Zhang and Y. Feng, “Exudate-based diabetic macular edema recognition in retinal images using cascaded deep residual networks,” Neurocomputing, vol. 290, pp. 161–171, 2018. [Google Scholar]
2. R. Panda, N. B. Puhan and G. Panda, “Global vessel symmetry for optic disc detection in retinal images,” in Fifth National Conf. on Computer Vision, Pattern Recognition, Image Processing and Graphics (NCVPRIPG), Patna, India, pp. 1–4, 2015. [Google Scholar]
3. L. Xiong and H. Li, “An approach to locate optic disc in retinal images with pathological changes,” Computerized Medical Imaging and Graphics, vol. 47, pp. 40–50, 2016. [Google Scholar]
4. D. D. Pernil, I. Fondon, F. C. Cantillana and M. A. G. Naranjo, “Fully automatized parallel segmentation of the optic disc in retinal fundus images,” Pattern Recognition Letters, vol. 83, pp. 99–107, 2016. [Google Scholar]
5. I. Soares, M. C. Branco and A. M. G. Pinheiro, “Optic disc localization in retinal images based on cumulative sum fields,” IEEE Journal of Biomedical and Health Informatics, vol. 20, no. 2, pp. 574–585, 2016. [Google Scholar]
6. D. Zhang and Y. Zhao, “Novel accurate and fast optic disc detection in retinal images with vessel distribution and directional characteristics,” IEEE Journal of Biomedical and Health Informatics, vol. 20, no. 1, pp. 333–342, 2016. [Google Scholar]
7. R. Panda, N. B. Puhan and G. Panda, “Robust and accurate optic disk localization using vessel symmetry line measure in fundus images,” Biocybernetics and Biomedical Engineering, vol. 37, no. 3, pp. 466–476, 2017. [Google Scholar]
8. B. Dai, X. Wu and W. Bu, “Optic disc segmentation based on variational model with multiple energies,” Pattern Recognition, vol. 64, pp. 226–235, 2017. [Google Scholar]
9. L. C. Rodrigues and M. Marengoni, “Segmentation of optic disc and blood vessels in retinal images using wavelets, mathematical morphology and hessian-based multi-scale filtering,” Biomedical Signal Processing and Control, vol. 36, pp. 39–49, 2017. [Google Scholar]
10. S. Bharkad, “Automatic segmentation of optic disk in retinal images,” Biomedical Signal Processing and Control, vol. 31, pp. 483–498, 2017. [Google Scholar]
11. J. H. Tan, U. R. Acharya, S. V. Bhandary and K. C. Chua, “Segmentation of optic disc, fovea and retinal vasculature using a single convolutional neural network,” Journal of Computational Science, vol. 20, pp. 70–79, 2017. [Google Scholar]
12. B. Zou, C. Chen and Z. Chen, “Classified optic disc localization algorithm based on verification model,” Computer Graphic, vol. 70, pp. 281–287, 2018. [Google Scholar]
13. B. Gui, R. J. Shuai and P. Chen, “Optic disc localization algorithm based on improved corner detection,” Procedia Computer Science, vol. 131, pp. 311–319, 2018. [Google Scholar]
14. K. Hou, N. Liu, W. Jia and Y. He, “Optic disc detection from fundus photography via best-buddies similarity,” Applied Sciences, vol. 8, no. 5, pp. 1–12, 2018. [Google Scholar]
15. J. Pruthi, S. Arora and K. Khanna, “Metaheuristic techniques for detection of optic disc in retinal fundus images,” 3D Research, vol. 9, no. 4, pp. 1–22, 2018. [Google Scholar]
16. M. Nergiz, M. Akın, A. Yıldız and Ö. Takes, “Automated fuzzy optic disc detection algorithm using branching of vessels and color properties in fundus images,” Biocybernetics and Biomedical En-Gineering, vol. 38, no. 4, pp. 850–867, 2018. [Google Scholar]
17. F. Guo, H. Peng, B. Zou and Z. Rongchang, “Localization and segmentation of optic disk with the fractional-order Darwinian particle swarm optimization algorithm,” IET Image Processing, vol. 12, no. 8, pp. 1303–1312, 2018. [Google Scholar]
18. H. Fu, J. Cheng, Y. Xu, D. W. K. Wong, J. Liu et al., “Joint optic disc and cup segmentation based on multi‒label deep network and polar transformation,” IEEE Engineering in Medicine and Biology Society, vol. 37, no. 7, pp. 1597–1605, 2018. [Google Scholar]
19. X. Li, L. Shen and J. Duan, “Optic disc and fovea detection using multi-stage region-based convolutional neural network,” in ISICDM 2018: Pro-Ceedings of the 2nd Int. Symp. on Image Computing and Digital Medicine, Chengdu, China, pp. 7–11, 2018. [Google Scholar]
20. H. M. Ünver, Y. Kökver, E. Duman and A. Erdem, “Statistical edge detection and circular hough transform for optic disk localization,” Applied Sci-ences, vol. 9, no. 2, pp. 1–16, 2019. [Google Scholar]
21. J. Diettera, W. Haqa, I. V. Ivanov, L. A. Norrenberg, M. Völker et al., “Optic disc detection in the presence of strong technical artifacts,” Biomedical Signal Processing and Control, vol. 53, no. 101535, pp. 1–11, 2019. [Google Scholar]
22. S. Lu, “Accurate and efficient optic disc detection and segmentation by a circular transformation,” IEEE Transactions on Medical Imaging, vol. 30, no. 12, pp. 2126–2133, 2011. [Google Scholar]
23. A. Mvoulana, R. Kachouri and M. Akil, “Fully automated method for glaucoma screening using robust optic nerve head detection and unsupervised segmentation based cup‒to‒disc ratio computation in retinal fundus images,” Computerized Medical Imaging and Graphics, vol. 77, no. 101643, 2019. [Google Scholar]
24. P. Joshi, R. K. S. Ranjth, V. Masilamani, J. Alike and S. K. K. Kumaresh, “Optic disc localization using interference map and localized segmentation using grab cut,” Journal for Control, Measurement, Electronics, Computing and Communications, vol. 62, pp. 1–10, 2020. [Google Scholar]
25. S. S. Naqvi, N. Fatima, T. M. Khan, Z. U. Rehman and M. A. Khan, “Automatic optic disk detection and segmentation by variational active contour estimation in retinal fundus images,” Signal, Image and Video Processing, vol. 13, pp. 1191–1198, 2019. [Google Scholar]
26. P. K. Raj, J. R. H. Kumar, S. Jois, S. Harsha and C. S. Seelamantula, “A structure tensor based voronoi decomposition technique for optic cup segmentation,” in IEEE Int. Conf. on Image Processing (ICIP), Taipei, Taiwan, pp. 22–25, 2019. [Google Scholar]
27. F. Zabihollahy and E. Ukwatta, “Fully automated segmentation of optic disk from retinal images using deep learning techniques,” in Proceedings, Medical Imaging Computer-Aided Di-Agnosis, San Diego, California, USA, vol. 10950, 2019. [Google Scholar]
28. B. Zou, Q. Liu, K. Yue, Z. Chen, J. Chen et al., “Saliency-based segmentation of optic disc in retinal images,” Chinese Journal of Electronics, vol. 28, no. 1, pp. 71‒75. 2019. [Google Scholar]
29. S. Kumar, A. Adarsh, B. Kumar and A. K. Singh, “An automated early diabetic retinopathy detection through improved blood vessel and optic disc segmentation,” Optics & Laser Technology, vol. 121, no. 105815, pp. 1–11, 2020. [Google Scholar]
30. A. S. Abdullah, J. Rahebi, Y. E. Özok and M. Aljanabi, “A new and effective method for human retina optic disc segmentation with fuzzy clustering method based on active contour model,” Medical & Biological Engineering & Computing, vol. 58, pp. 25–37, 2020. [Google Scholar]
31. Z. Lu and D. Chen, “Weakly supervised and semi-supervised semantic segmentation for optic disc of fundus image,” Symmetry, vol. 12, no. 1:145, 2020. [Google Scholar]
32. D. E. Kim, R. E. Hacisoftaoglu and M. Karakaya, “Optic disc localization in retinal images using deep learning frameworks,” in Proceedings Disruptive Technologies in Information Sciences, California, USA, vol. 11419, no. 1141904, 2020. [Google Scholar]
33. X. Guo, H. Wang, X. Lu, X. Hu, S. Che et al., “Robust fovea localization based on symmetry measure,” IEEE Journal of Biomedical and Health Informatics, vol. 24, no. 8, pp. 2315–2326, 2020. [Google Scholar]
34. DiaretDB0: Standard Diabetic Retinopathy Database Calibration Level 0, 2021. [Online]. Available: https://www.it.lut.fi/project/imageret/diaretdb0. [Google Scholar]
35. DiaretDB1: Standard Diabetic Retinopathy Database Calibration Level 1, 2021. [Online]. Available: https://www.it.lut.fi/project/imageret/diaretdb1. [Google Scholar]
36. SATRE. Structured Analysis of the Ret-ina, 2021. [Online]. Available: http://cecas.clemson.edu/∼ahoover/stare. [Google Scholar]
37. S. Miyamoto and M. Mukaidono, “Fuzzy c-means as a regularization and maximum entropy approach,” in the Seventh Int. Fuzzy Systems Association World Congress, University of Economics, Prague, Czech Republic, pp. 25–29, 1997. [Google Scholar]
38. N. Otsu, “A threshold selection method from gray-level histograms,” IEEE Transactions on Systems, Man, and Cybernetics, vol. 9, no. 1, pp. 62–66, 1979. [Google Scholar]
39. D. Marin, M. E. G. Arias, A. Suero and J. M. Bravo, “Obtaining optic disc center and pixel region by automatic thresholding methods on morphologically processed fundus images,” Computer Methods and Programs in Biomedicine, vol. 118, no. 2, pp. 173–185, 2015. [Google Scholar]
40. L. Wang, Z. Jianbing, S. Mao, A. Cribb, S. Zhu et al., “Simultaneous segmentation and bias field estimation using local fitted images,” Pattern Recognition, vol. 74, pp. 145–155, 2018. [Google Scholar]
Cite This Article
 Copyright © 2023 The Author(s). Published by Tech Science Press.
This work is licensed under a Creative Commons Attribution 4.0 International License , which permits unrestricted use, distribution, and reproduction in any medium, provided the original work is properly cited.
 Downloads
 Citation Tools