
 Submit a Paper
 Propose a Special lssue
 Open Access
ARTICLE

Al-Biruni Earth Radius Optimization for COVID-19 Forecasting
1 Department of Communications and Electronics, Delta Higher Institute of Engineering and Technology, Mansoura, 35111, Egypt
2 Department of Computer Science, Faculty of Computer and Information Sciences, Ain Shams University, 11566, Cairo, Egypt
3 Department of Computer Science, College of Computing and Information Technology, Shaqra University, 11961, Saudi Arabia
4 Computer Engineering and Control Systems Department, Faculty of Engineering, Mansoura University, 35516, Mansoura, Egypt
5 Department of System Programming, South Ural State University, 454080, Chelyabinsk, Russia
6 Department of Computer Sciences, College of Computer and Information Sciences, Princess Nourah bint Abdulrahman University, P.O. Box 84428, Riyadh, 11671, Saudi Arabia
* Corresponding Author: Amal H. Alharbi. Email:
Computer Systems Science and Engineering 2023, 46(1), 883-896. https://doi.org/10.32604/csse.2023.034697
Received 25 July 2022; Accepted 11 October 2022; Issue published 20 January 2023
 View Full Text
 Download PDF
Abstract
Several instances of pneumonia with no clear etiology were recorded in Wuhan, China, on December 31, 2019. The world health organization (WHO) called it COVID-19 that stands for “Coronavirus Disease 2019,” which is the second version of the previously known severe acute respiratory syndrome (SARS) Coronavirus and identified in short as (SARSCoV-2). There have been regular restrictions to avoid the infection spread in all countries, including Saudi Arabia. The prediction of new cases of infections is crucial for authorities to get ready for early handling of the virus spread. Methodology: Analysis and forecasting of epidemic patterns in new SARSCoV-2 positive patients are presented in this research using metaheuristic optimization and long short-term memory (LSTM). The optimization method employed for optimizing the parameters of LSTM is Al-Biruni Earth Radius (BER) algorithm. Results: To evaluate the effectiveness of the proposed methodology, a dataset is collected based on the recorded cases in Saudi Arabia between March 7th, 2020 and July 13th, 2022. In addition, six regression models were included in the conducted experiments to show the effectiveness and superiority of the proposed approach. The achieved results show that the proposed approach could reduce the mean square error (MSE), mean absolute error (MAE), and R2 by 5.92%, 3.66%, and 39.44%, respectively, when compared with the six base models. On the other hand, a statistical analysis is performed to measure the significance of the proposed approach. Conclusions: The achieved results confirm the effectiveness, superiority, and significance of the proposed approach in predicting the infection cases of COVID-19.Keywords
As of December 31, 2019, the World Health Organization (WHO) has declared a cluster of pneumonia cases in Wuhan, China, as Coronavirus Disease 2019 (COVID-19). A pandemic was declared on March 11, 2020, after the fast spread of COVID-19 globally [1]. The respiratory system is the primary site of COVID-19’s involvement, and the disease’s clinical presentation is strikingly similar to that of the SARS outbreak that occurred in 2003. COVID-19 has been classified as SARS Coronavirus 2 (SARS-CoV-2) because of its resemblance to that virus. The dynamics of infectious disease transmission can reveal a number of patterns during outbreaks [2]. COVID-19’s dynamic transmission during the pandemic was influenced by factors such as the density of population, infection rate, ratio of vaccinated persons to non-vaccinated people, and lifestyle [3]. A mathematical model for a given area cannot match ideally with others, and the same observation applies to a sub-area and its super-area in epidemiology [4–11].
Several optimization algorithms have been presented during the past decade in order to enhance the performance of machine learning models. Choosing a technique is often based on how well it performs from a range of angles, in the most generic sense. The cost of calculation, accuracy or even the difficulty of implementation can all be taken into consideration. According to [12,13], a viral optimization method was first proposed. As with other metaheuristics, its results are strongly reliant on the starting setup. Aside from that, it is able to imitate generic viruses without incorporating unique features for specific viruses. Its effectiveness has been demonstrated time and time again, and there can be no mistake about it. Genetic algorithms (GAs) are one of the most often utilized metaheuristics for improving deep learning parameters. Because of this, one may find the long short-term memory (LSTM) network optimized using GA by authors in [14]. According to a study, the suggested hybrid strategy outperformed the benchmark model while using the daily Korea Stock Price Index (KSPI). An LSTM and GA network traffic prediction model was suggested in 2019 [15]. LSTM and autoregressive integrated moving average were compared to see if the results were superior, and they were. Deep learning models can also benefit from multi-agent systems as presented by authors in [16]. Using kernel principal component analysis and a neural network with particle swarm optimization (PSO), the authors developed a model for estimating midterm power loads. Deep learning models were combined with PSO in [17]; however, this time, the authors used the approach to classify images. The ant colony optimization (ACO) model has also been used in conjunction with deep learning. As a result, researchers in [18] suggested an ACO-based deep recurrent neural network (RNN) for forecasting general aviation flight data. An ACO-based strategy for optimizing an LSTM-RNN was described in [19]. This time, the focus was on flight data records from an airline whose flights had been subjected to a significant amount of vibration. Recently, there have been a few publications on cuckoo search (CS) features. In [20], CS was used to find heuristics for changing the hyperparameters of another LSTM network. An accuracy level of 96% was reported by the authors for all data sets studied. Fast convergence and excellent accuracy may be achieved by the application of CS, according to authors of [21]. It outperformed other metaheuristics in terms of the results achieved. In addition, in the literature, the application of the artificial bee colony (ABC) optimization technique applied to LSTM can be discovered. As a result, an improved LSTM with ABC was created in [22] to anticipate the bitcoin price.
In this paper, we propose the application of Al-Biruni earth radius (BER) optimization algorithm for optimizing the parameters of LSTM network to improve the prediction of COVID-19 positive cases. The proposed approach is evaluated in terms of a dataset collected from the recorded cases in Saudi Arabia during the period from 7th March 2020 to 13th July 2022. The proposed approach is compared with six other regression models to show its effectiveness and superiority. What follows is the outline of the remainder of this paper. The background of COVID-19 prediction is presented in Section 2. The proposed methodology is discussed in Section 3, followed by an explanation of the achieved results in Section 4. Finally, the conclusions of the findings are presented in Section 5.
Time-series data is a type of numerical data that includes a time stamp for each value. It is possible to study the time series using either statistical or machine learning techniques. Autoregressive integrated moving average (ARIMA) is commonly used for this purpose, but it’s not always necessary. The ARIMA incorporates both the autoregression (AR) and the moving average (MA) models into a single equation. Two of the three components of ARIMA are the moving average and the auto-regression. Another ARIMA extension, known as seasonal ARIMA (SARIMA) [23], allows for the simulation of a seasonally dependent element inside a time series. Adding seasonal variables to the ARIMA model creates a SARIMA, a model that incorporates seasonal fluctuations in the seasonal period. Many researchers have used ARIMA and SARIMA models to predict the spread of an epidemic [24], including COVID-19 [25], and to estimate the death rate [26]. A number of assumptions have to be made for the statistical models, including the infectious disease’s beginning point, the interactions between persons, and the model’s input parameters. A logical technique based on repeated experiments is typically used to estimate input parameters [27]. ARIMA models, for example, rely on an underlying process (i.e., the ARIMA process) to produce data in order to estimate a set of parameters [28,29].
Authors in [30] studied the dynamics of cumulative COVID-19 cases in 16 countries, using ARIMA models based on forecasting the cumulative analysis to estimate the best ARIMA (p), d), and q for each country (Italy, Pakistan, Bangladesh, Chile, Brazil, Columbia, Iran, Italy, India, Mexico, Peru, South Africa). These models were shown to be most effective for predicting mortality in Italy in instances where the cause of death was established by autopsy or laboratory testing, respectively, according to authors’ research. As a result of the findings, COVID-19 trends may be divided into three primary categories: exponential growth (the United States), sharp linear increment (Russia, Chile, Pakistan, Saudi Arabia), and gradual linear increment (Bangladesh, Spain, UK, and Italy). Machine learning (ML) [31] and, more specifically, a subclass of it known as deep learning (DL) [32] are used in a second technique for analyzing time series trends. In this way, the assumptions that statistical techniques require can be circumvented [33]. A recent epidemic of COVID-19 may have been predicted using DL models, which have shown to be useful in time series analysis [34]. Artificial intelligence (AI) problems are solved using a NN (or a circuit of neurons) in DL. Most medical specialties have looked into the latter. The early discovery of the COVID-19 pandemic and the propagation and dynamics of the disease may both be accurately predicted using DL approaches [35]. Long-term memory (LSTM) may be utilized to provide a gated memory unit that is capable of handling vanishing gradient issues by integrating with a NN [36], which is often used to process both sequential and temporal data (e.g., time series). It’s possible to get around the problem of back-flow by employing both an LSTM architecture and an algorithm that relies on gradient-based learning [37]. Text properties are tracked by LSTM using its memory cells, which can store information across long distances. LSTM Researchers at Johns Hopkins University and the Canadian Health Agency used a DL technique based on LSTM to evaluate data obtained by the authors in [38]. Using COVID-19 data from Australia and Iran, authors in [39] analyzed six different DL approaches to explore the time series forecasting of new cases and the rate of new fatalities. According to the study, an in-depth analysis of the LSTM, Conv-LSTM, and gated recurrent units (GRUs) together with their bidirectional extensions: bidirectional GRU, bidirectional GRU, and convolutional GRU, respectively. Key findings from the authors’ comparative study include those listed below: There was a clear winner in the Australian dataset when it came to predicting new instances over the course of 1, 3, and 7 days: Conv-LSTM. For new deaths in the Australian dataset, Conv-LSTM ranked highest in all tests (i.e., prediction over 1, 3, and 7 days). The results from the Iranian dataset were much more mixed. As a result, the study’s findings show that there is no universally applicable optimum DL model and that each dataset must be evaluated on its own merits. Similarly, in [40], researchers looked into DL approaches based on NNs and recurrent NNs (RNNs). As long as the current condition is taken into consideration, the alterations of data flow can be transferred through hidden layers in one direction. It is possible to extend the memory of an RNN by adding an LSTM hidden layer or GRU to it.
To build a robust model for predicting COVID-19 positive cases, the LSTM is employed along with the BER optimization algorithm. A dataset is collected to verify the effectiveness of the proposed method. The records of the dataset are preprocessed by deleting empty entries, resolving missing values, and normalization. The steps depicted in Fig. 1 are used in the proposed model for predicting COVID-19. The next sections provide more explanation about the steps of the proposed methodology.

Figure 1: The stages of the proposed methodology
A comma-separated value (CSV) format was used to get the data of interest. According to the International Standards Organization (ISO) 3166-1 standard, a country can be identified by its country code. “KSA” is an ISO code that may be used to obtain the Saudi Arabian Department of Civil Protection’s dataset from “Our World in Data COVID-19 Cases”. To further narrow the scope of the data, a date range can be specified. In any dataset, we can find information that is irrelevant to our model. The information of interest, which included additional positive instances, was gathered during the preprocessing stage. We used autocorrelation analysis to find stationary spots in the time series. Functions for training and testing datasets were constructed based on the original dataset and the number of previous time steps used as input variables to forecast the future time period (i.e., look back), which are the two major variables. Datasets were constructed with the default setting of creating datasets with the number of observations (X) and look-backs at each point in time (t + look back). During training, we utilized a look-back value of seven (7 days or one week). In order to create the LSTM model, the data has to be transformed. The final format included [samples, time steps, and features]. “Looking back to the previous day’s information, the samples were made up of information from that day’s data, and the time step was one day (the data was gathered daily). We divided the data into two sets: one for training and the other for testing. 80% of the observations were used for training, while the remaining 20% were used for testing. Afterward, we preserved the test set and randomly selected 80% of the training set as the new training set, while the rest (20%) was the validation set.
The Long Short-Term Memory (LSTM) model, shown in Fig. 2, has lately gained favor as a recurrent neural network because it can mimic intricate time series with time delays of unknown magnitude. Self-loops, where the gradient may flow for long periods of time without bursting or vanishing, are at the heart of LSTM. In combination with this, a forget-gate allows the LSTM to accumulate information that, depending on the input data, may be “forgotten” later. LSTM models have been used for the first time to model short-term network flow sizes with exquisite granularity. LSTMs are characterized by the following recursive equations:

Figure 2: Standard structure of the LSTM network
where
To increase the accuracy of the COVID-19 prediction, a new approach is proposed by adjusting the hyperparameters of the LSTM. This section begins by presenting the LSTM’s structure and describing which parameters are being improved, followed by presenting the optimization algorithm that is employed to optimize the parameters of LSTM.
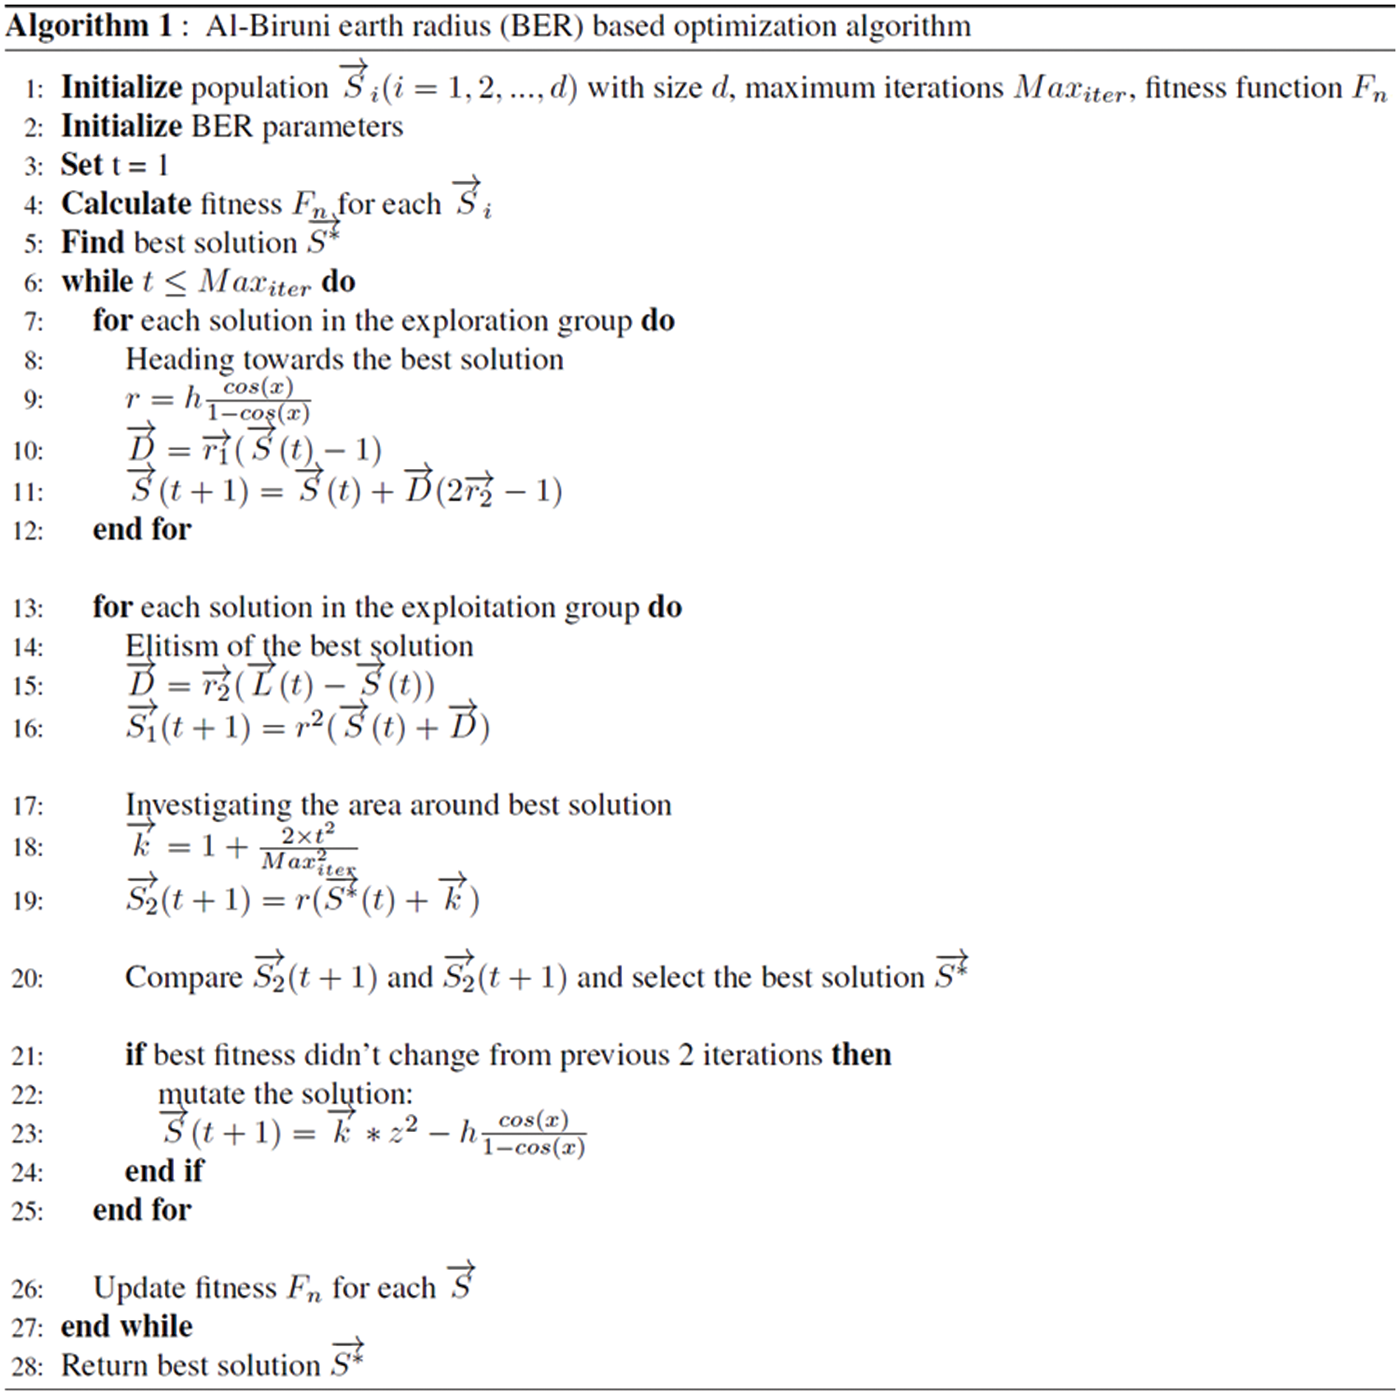
3.3 Al-Biruni Earth Radius (BER) Optimization Algorithm
It is the goal of optimization algorithms to find the best possible solution to a problem given limitations. When using BER, an individual from the population may be shown in the form of a ‘S’ vector,
The evaluation of the proposed approach is performed, and the results are explained in this section. The section starts by describing the dataset included in the conducted experiments, followed by the evaluation criteria and an explanation of the achieved results.
The “Our World in Data COVID-19 Cases” dataset (ourworldindata.org/covid-cases, accessed on 13 July 2022) was used in the suggested technique [41]. This collection is publicly accessible under a Creative Commons license and collects datasets from government agencies and academic organizations from 207 nations. For example, the Saudi Arabia dataset was obtained from the official GitHub Repository given by the Saudi Arabia Civil Protection Department. Covid-19 trends such as tested confirmed cases, reported deaths and reported recoveries from COVID-19 are all included in this daily report. It’s updated throughout the day to reflect this. We chose Saudi Arabia as a test case to show how the suggested system may evolve and be reused in the future. The plot in Fig. 3 depicts the aggregated data sources for the nations identified in the “Our World in Data COVID-19 Cases” dataset. In order to compute and forecast, the proposed methodology solely took into account data from newly discovered positive examples (or fresh instances). As a result of a change in daily case totals, a new case was created. Using this data, it is possible to create a time series based on the number of new instances that occur each day. Between 7th March 2020 and 13th July 2022, new cases were registered.

Figure 3: The location of interest in the conducted experiments
4.2 Key Performance Indicators
The metrics used to assess the proposed methodology and their corresponding formulas are presented in Table 1. These metrics are: root mean square error (RMSE), normalized RMSE (NRMSE), Nash–Sutcliffe model efficiency (NSE), mean absolute error (MAE), mean absolute percentage error (MAPE), and R2 metrics [42–48]. In these formulas, Fi is the forecast daily COVID-19 value, Ai is the actual daily COVID-19 value, yi is the observed daily COVID-19, xi is the model’s simulated daily COVID-19, and n is the number of data points.

To prove the effectiveness and superiority of the proposed approach, several experiments were conducted to predict COVID-19. Firstly, a set of baseline experiments were conducted using six base models, including LSTM, BILSTM, GRU, LSTMs, BILSTMs, and CONVLSTMs. The results of these models were compared to the achieved results using the optimized LSTM based on BER algorithm. Table 2 presented the results of the training and testing for each of the base models along with the proposed approach based on the adopted evaluation criteria.

As presented in the table, the proposed approach could achieve the best values over all the evaluation criteria, which confirms the superiority of the proposed approach. The achieved MSE on the test set using the proposed approach is (45965.88), whereas the best MSE achieved by the base models is (48329.74). In addition, MAE, R2, MAPE, and NSE of the test set using the proposed approach are (103.84), (0.99), (26.8), and (0.99). These values prove the effectiveness of the proposed approach.
On the other hand, a statistical analysis is performed to clearly investigate the effectiveness of the proposed approach. Table 3 presents the results of this statistical analysis. As presented in the table, the mean and standard deviation, for example, are the minimum when compared to the base models. These results confirm the findings of the proposed approach.

Moreover, the one-way analysis of variance (ANOVA) and the Wilcoxon signed rank tests are performed to study the stability of the proposed approach. The results of these tests are presented in Tables 4 and 5. The results presented in these tables show the significance and stability of the proposed approach as the value of F in the ANOVA test is (46279) and (P < 0.0001). In addition, the significance of all methods using the Wilcoxon test is satisfied.


On the other hand, more results are shown in the plots depicted in Figs. 4 and 5. In these figures, the ranges of RMSE using the base models and the proposed approach are shown in the plot of Fig. 4a. In this plot, the range of values of RMSE using the proposed approach is the minimum, which reflects the superiority of the proposed approach. In addition, the ROC curve using the proposed approach shows promising performance.

Figure 4: Comparison between the proposed approach and the other competing approaches in terms of RMSE and ROC

Figure 5: Analyzing the performance of the recorded predictions using the proposed approach
More plots are shown in Fig. 5 that presents the behavior of the residual, homoscedasticity, QQ, and heatmap of the achieved results. In these plots, the proposed approach shows a promising performance which makes it a proper and better solution to the problem of COVID-19 prediction using machine learning.
Al-Biruni metaheuristic optimization algorithm was used in this research to improve the performance of the standard LSTM network in the analysis and forecasting of the SARS-CoV-2 (COVID-19) positive cases. To prove the effectiveness of the proposed approach, a dataset is collected for analysis and prediction. The proposed approach was tested using the Saudi Arabian dataset collected from an official data source. The evaluation of the performance of the proposed approach is realized using six key performance indicators. In addition, the performance of the proposed approach is compared to the performance of the other six prediction models to show its superiority. On the other hand, a set of statistical analysis experiments, including ANOVA and Wilcoxon tests, was conducted to show the significance of the proposed approach. The recorded results confirmed the effectiveness, superiority, and significance of the proposed approach. By including numerous rates of contagiousness, as well as personal and clinical data sets, future research might improve monitoring of SARS-CoV-2 variations (e.g., clustering data for ages and comorbidities, susceptible patients, and statistics on mobility).
Acknowledgement: Princess Nourah bint Abdulrahman University Researchers Supporting Project Number (PNURSP2022R120), Princess Nourah bint Abdulrahman University, Riyadh, Saudi Arabia.
Funding Statement: Princess Nourah bint Abdulrahman University Researchers Supporting Project Number (PNURSP2022R120), Princess Nourah bint Abdulrahman University, Riyadh, Saudi Arabia.
Conflicts of Interest: The authors declare that they have no conflicts of interest to report regarding the present study.
References
1. S. Zhao, Q. Lin, J. Ran, S. Musa, G. Yang et al., “Preliminary estimation of the basic reproduction number of novel coronavirus (2019-nCoV) in China, from 2019 to 2020: A data-driven analysis in the early phase of the outbreak,” International Journal of Infectious Diseases, vol. 92, no. 1, pp. 214–217, 2020. [Google Scholar]
2. G. Knight, N. Dharan, G. Fox, N. Stennis, A. Zwerling et al., “Bridging the gap between evidence and policy for infectious diseases: How models can aid public health decision-making,” International Journal of Infectious Diseases, vol. 42, no. 1, pp. 17–23, 2016. [Google Scholar]
3. M. Lotfi, M. Hamblin and N. Rezaei, “COVID-19: Transmission, prevention, and potential therapeutic opportunities,” Clinica Chimica Acta, vol. 508, no. 1, pp. 254–266, 2020. [Google Scholar]
4. W. Kermack, A. McKendrick, W. Kermack and A. McKendrick, “Contributions to the mathematical theory of epidemics–I. 1927,” Bulletin of Mathematical Biology, vol. 53, no. 1, pp. 33–55, 1991. [Google Scholar]
5. R. Singh, M. Rani, A. Bhagavathula, R. Sah, A. Rodriguez-Morales et al., “Prediction of the COVID-19 pandemic for the top 15 affected countries: Advanced autoregressive integrated moving average (ARIMA) model,” Public Health Surveillance, vol. 6, no. 2, pp. 1–10, 2020. [Google Scholar]
6. E. Meibalan and M. Marti, “Biology of malaria transmission,” Cold Spring Harbor Perspective Medicine, vol. 7, no. a025452, pp. 1–17, 2017. [Google Scholar]
7. O. Sharomi, C. Podder, A. Gumel and B. Song, “Mathematical analysis of the transmission dynamics of HIV/TB coinfection in the presence of treatment,” Mathematical Biosciences and Engineering, vol. 5, no. 1, pp. 145–174, 2008. [Google Scholar]
8. Y. Ding, R. Huang and N. Shao, “Time series forecasting of US COVID-19 transmission,” Alternative Therapies in Health and Medicine, vol. 27, no. 1, pp. 4–11, 2021. [Google Scholar]
9. L. Abenavoli, P. Cinaglia, F. Luzza, I. Gentile and L. Boccuto, “Epidemiology of coronavirus disease outbreak: The Italian trends,” Reviews on Recent Clinical Trials, vol. 15, no. 1, pp. 87–92, 2020. [Google Scholar]
10. L. Abenavoli, P. Cinaglia, A. Procopio, R. Serra, I. Aquila et al., “SARS-CoV-2 spread dynamics in Italy: The calabria experience,” Reviews on Recent Clinical Trials, vol. 16, no. 1, pp. 309–315, 2021. [Google Scholar]
11. B. Nelson, “Statistical methodology: V. Time series analysis using autoregressive integrated moving average (ARIMA) models,” Academic Emergency Medicine, vol. 5, no. 1, pp. 739–744, 1998. [Google Scholar]
12. Y. Liang and J. Cuevas-Jua´rez, “A novel metaheuristic for continuous optimization problems: Virus optimization algorithm,” Engineering Optimization, vol. 48, no. 1, pp. 73–93, 2016. [Google Scholar]
13. Y. Liang and J. Cuevas Juarez, “A self-adaptive virus optimization algorithm for continuous optimization problems,” Soft Computing, vol. 24, no. 1, pp. 13147–13166, 2020. [Google Scholar]
14. H. Chung and K. Shin, “Genetic algorithm-optimized long short-term memory network for stock market prediction,” Sustainability, vol. 10, no. 1, pp. 3765, 2018. [Google Scholar]
15. J. Chen, H. Xing, H. Yang and L. Xu, “Network traffic prediction based on LSTM networks with genetic algorithm,” Lecture Notes in Electrical Engineering, vol. 550, no. 1, pp. 411–419, 2019. [Google Scholar]
16. Z. Liu, X. Sun and S. Wang, “Midterm power load forecasting model based on kernel principal component analysis and back propagation neural network with particle swarm optimization,” Big Data, vol. 7, no. 1, pp. 130–138, 2019. [Google Scholar]
17. F. Fernandes-Junior and G. Yen, “Particle swarm optimization of deep neural networks architectures for image classification,” Swarm Evolutionary Computing, vol. 49, no. 1, pp. 62–74, 2019. [Google Scholar]
18. T. Desell, S. Clachar, J. Higgins and B. Wild, “Evolving deep recurrent neural networks using ant colony optimization,” Lecture Notes in Computer Science, vol. 9026, no. 1, pp. 86–98, 2015. [Google Scholar]
19. A. ElSaid, F. El-Jamiy and J. Higgings, “Using ant colony optimization to optimize long short-term memory recurrent neural networks,” in Proc. of the Genetic and Evolutionary Computation Conf., New York, USA, pp. 13–20, 2018. [Google Scholar]
20. D. Srivastava, Y. Singh and A. Sahoo, “Auto tuning of RNN hyper-parameters using cuckoo search algorithm,” in Proc. of the Int. Conf. on Contemporary Computing, Noida, India, pp. 1–5, 2019. [Google Scholar]
21. A. Yuliyono and A. Girsang, “Artificial bee colony-optimized LSTM for bitcoin price prediction,” Advances in Science, Technology and Engineering Systems Journal, vol. 4, no. 5, pp. 375–383, 2019. [Google Scholar]
22. F. Sadia, S. Boyd and J. Keith, “Bayesian change-point modeling with segmented ARMA model,” PLoS One, vol. 13, no. 1, pp. 1–23, 2018. [Google Scholar]
23. Z. Li and Y. Li, “A comparative study on the prediction of the BP artificial neural network model and the ARIMA model in the incidence of AIDS,” BMC Medical Informatics and Decision Making, vol. 20, no. 143, pp. 1–13, 2020. [Google Scholar]
24. V. Chaurasia and S. Pal, “COVID-19 pandemic: ARIMA and regression model-based worldwide death cases predictions,” SN Computer Science, vol. 1, no. 288, pp. 1–12, 2020. [Google Scholar]
25. C. Qi, D. Zhang, Y. Zhu, L. Liu, C. Li et al., “SARFIMA model prediction for infectious diseases: Application to hemorrhagic fever with renal syndrome and comparing with SARIMA,” BMC Medical Research Methodology, vol. 20, no. 243, pp. 1–7, 2020. [Google Scholar]
26. H. Alabdulrazzaq, M. Alenezi, Y. Rawajfih, B. Alghannam, A. Al-Hassan et al., “On the accuracy of ARIMA based prediction of COVID-19 spread,” Results in Physics, vol. 27, no. 1, pp. 1–17, 2021. [Google Scholar]
27. A. Hernandez-Matamoros, H. Fujita, T. Hayashi and H. Perez-Meana, “Forecasting of COVID19 per regions using ARIMA models and polynomial functions,” Applied Soft Computing, vol. 96, no. 1, pp. 1–14, 2020. [Google Scholar]
28. K. ArunKumar, D. Kalaga, C. Sai Kumar, G. Chilkoor, M. Kawaji et al., “Forecasting the dynamics of cumulative COVID-19 cases (confirmed, recovered and deaths) for top-16 countries using statistical machine learning models: Auto-regressive integrated moving average (ARIMA) and seasonal auto-regressive integrated moving average (SARIMA),” Applied Soft Computing, vol. 103, no. 1, pp. 1–14, 2021. [Google Scholar]
29. K. Ngiam and I. Khor, “Big data and machine learning algorithms for health-care delivery,” Lancet Oncology, vol. 20, no. 5, pp. e262–e273, 2019. [Google Scholar]
30. A. Esteva, A. Robicquet, B. Ramsundar, V. Kuleshov, M. DePristo et al., “A guide to deep learning in healthcare,” Nature Medicine, vol. 25, no. 1, pp. 24–29, 2019. [Google Scholar]
31. Y. Xu, H. Yao and K. Lin, “An overview of neural networks for drug discovery and the inputs used,” Expert Opinion on Drug Discovery, vol. 13, no. 1, pp. 1091–1102, 2018. [Google Scholar]
32. M. Alassafi, M. Jarrah and R. Alotaibi, “Time series predicting of COVID-19 based on deep learning,” Neurocomputing, vol. 468, no. 1, pp. 335–344, 2022. [Google Scholar]
33. M. Alzubaidi, H. Zubaydi, A. Bin-Salem, A. Abd-Alrazaq, A. Ahmed et al., “Role of deep learning in early detection of COVID-19: Scoping review,” Computing Methods and Programs in Biomedicine Update, vol. 2021, no. 1, pp. 1–7, 2021. [Google Scholar]
34. A. Ibrahim, S. Mirjalili, M. El-Said, S. M. Ghoneim, M. Al-Harthi et al., “Wind speed ensemble forecasting based on deep learning using adaptive dynamic optimization algorithm,” IEEE Access, vol. 9, pp. 125787–125804, 2021. [Google Scholar]
35. K. Ghany, H. Zawbaa and H. Sabri, “COVID-19 prediction using LSTM algorithm: GCC case study,” Informatics in Medicine Unlocked, vol. 23, no. 1, pp. 1–9, 2021. [Google Scholar]
36. V. Chimmula and L. Zhang, “Time series forecasting of COVID-19 transmission in Canada using LSTM networks,” Chaos Solitons Fractals, vol. 135, no. 1, pp. 1–6, 2020. [Google Scholar]
37. N. Ayoobi, D. Sharifrazi, R. Alizadehsani, A. Shoeibi, J. Gorriz et al., “Time series forecasting of new cases and new deaths rate for COVID-19 using deep learning methods,” Results in Physics, vol. 27, no. 1, pp. 1–27, 2021. [Google Scholar]
38. M. Wilkosz and A. Szczesna, “Multi-headed conv-LSTM network for heart rate estimation during daily living activities,” Sensors, vol. 21, no. 15, pp. 1–15, 2021. [Google Scholar]
39. B. Zhang, D. Xiong, J. Xie and J. Su, “Neural machine translation with GRU-gated attention model,” IEEE Transactions in Neural Networks and Learning Systems, vol. 31, no. 1, pp. 4688–4698, 2020. [Google Scholar]
40. A. Zeroual, F. Harrou, A. Dairi and Y. Sun, “Deep learning methods for forecasting COVID-19 time-series data: A comparative study,” Chaos Solitons Fractals, vol. 140, pp. 110121, 2020. [Google Scholar]
41. H. Ritchie, E. Mathieu, L. Rodés-Guirao, C. Appel, C. Giattino et al., “Coronavirus pandemic (COVID-19). Our world in data,” 2020. [Online]. Available: https://ourworldindata.org/coronavirus (accessed on 18 May 2022). [Google Scholar]
42. E. -S. M. El-Kenawy, S. Mirjalili, A. Abdelhamid, A. Ibrahim, N. Khodadadi et al., “Meta-heuristic optimization and keystroke dynamics for authentication of smartphone users,” Mathematics, vol. 10, no. 16, pp. 1–26, 2022. [Google Scholar]
43. A. Abdelhamid and S. Alotaibi, “Optimized two-level ensemble model for predicting the parameters of metamaterial antenna,” Computers, Materials & Continua, vol. 73, no. 1, pp. 917–933, 2022. [Google Scholar]
44. A. Abdelhamid and S. R. Alotaibi, “Robust prediction of the bandwidth of metamaterial antenna using deep learning,” Computers, Materials & Continua, vol. 72, no. 2, pp. 2305–2321, 2022. [Google Scholar]
45. A. Alhussan, D. Khafaga, E. -S. M. El-Kenawy, A. Ibrahim, M. M. Eid et al., “Pothole and plain road classification using adaptive mutation dipper throated optimization and transfer learning for self driving cars,” IEEE Access, vol. 10, pp. 84188–84211, 2022. [Google Scholar]
46. D. Khafaga, A. Alhussan, E. -S. M. El-Kenawy, A. Ibrahim, M. Eid et al., “Solving optimization problems of metamaterial and double T-shape antennas using advanced meta-heuristics algorithms,” IEEE Access, vol. 10, pp. 74449–74471, 2022. [Google Scholar]
47. E. -S. M. El-Kenawy, S. Mirjalili, F. Alassery, Y. Zhang, M. Eid et al., “Novel meta-heuristic algorithm for feature selection, unconstrained functions and engineering problems,” IEEE Access, vol. 10, pp. 40536–40555, 2022. [Google Scholar]
48. A. Abdelhamid, E. -S. M. El-kenawy, B. Alotaibi, M. Abdelkader, A. Ibrahim et al., “Robust speech emotion recognition using CNN + LSTM based on stochastic fractal search optimization algorithm,” IEEE Access, vol. 10, pp. 49265–49284, 2022. [Google Scholar]
Cite This Article
 Copyright © 2023 The Author(s). Published by Tech Science Press.
This work is licensed under a Creative Commons Attribution 4.0 International License , which permits unrestricted use, distribution, and reproduction in any medium, provided the original work is properly cited.
 Downloads
 Citation Tools