
 Submit a Paper
 Propose a Special lssue
 Open Access
ARTICLE

BS-SC Model: A Novel Method for Predicting Child Abuse Using Borderline-SMOTE Enabled Stacking Classifier
B. S. Abdur Rahman Crescent Institute of Science and Technology, GST Road, Vandalur, Chennai, 600048, Tamil Nadu, India
* Corresponding Author: Arun Raj Lakshminarayanan. Email:
Computer Systems Science and Engineering 2023, 46(2), 1311-1336. https://doi.org/10.32604/csse.2023.034910
Received 01 August 2022; Accepted 22 November 2022; Issue published 09 February 2023
 View Full Text
 Download PDF
Abstract
For a long time, legal entities have developed and used crime prediction methodologies. The techniques are frequently updated based on crime evaluations and responses from scientific communities. There is a need to develop type-based crime prediction methodologies that can be used to address issues at the subgroup level. Child maltreatment is not adequately addressed because children are voiceless. As a result, the possibility of developing a model for predicting child abuse was investigated in this study. Various exploratory analysis methods were used to examine the city of Chicago’s child abuse events. The data set was balanced using the Borderline-SMOTE technique, and then a stacking classifier was employed to ensemble multiple algorithms to predict various types of child abuse. The proposed approach successfully predicted crime types with 93% of accuracy, precision, recall, and F1-Score. The AUC value of the same was 0.989. However, when compared to the Extra Trees model (17.55), which is the second best, the proposed model’s execution time was significantly longer (476.63). We discovered that Machine Learning methods effectively evaluate the demographic and spatial-temporal characteristics of the crimes and predict the occurrences of various subtypes of child abuse. The results indicated that the proposed Borderline-SMOTE enabled Stacking Classifier model (BS-SC Model) would be effective in the real-time child abuse prediction and prevention process.Keywords
Humanity is pondering the potential of expanding its presence throughout the universe. Humans are being developed as the first multiplanetary species, according to scientists and technologists. Children are the only ones who can keep humanity alive no matter where we go. As a result, it is the obligation of society to safeguard their safety and well-being. According to the WHO, children are the most vulnerable group when it comes to domestic and sexual abuse [1]. Child abuse includes a variety of behaviors such as corporal punishment, physical misconduct, emotional violations, and sexual exploitation. Child abuse can be perpetrated on the victim by a known or unknown individual. According to a report by the Children’s Bureau of the United States, 618000 children would be subjected to child abuse by 2020 [2]. In comparison to boys (7.9 per 1,000), girl children are more prone to abuse (8.9 per 1,000). Boys, on the other hand, have a greater mortality rate (2.99 per 100,000) than females who have been abused or neglected (2.05 per 100,000). In many situations (77.2%), parents are the major perpetrators, and astonishingly, females are more aggressive (52%) toward children than males (47.1%). It suggested that living at home might not be the safest option.
For the rest of their lives, child abuse victims will struggle with physical and/or mental trauma. Child abuse is a traumatic occurrence that can lead to eating disorders, unwanted pregnancies, HIV infection, heart illness, physical disabilities, learning difficulties, anxiety, despair, and relationship problems in the victim [3–5]. Adverse childhood experiences make people more sensitive to drug usage, severe menopausal symptoms, and cognitive problems later in life [6–8]. The victim’s sexual behavior in middle age was hampered by childhood mistreatment. Childhood hardship may also influence the pain and pleasure experienced during sexual intercourse [9]. Along with physical and neurological issues, the victims face difficulties with executive processes such as emotional control and decision-making [10]. Furthermore, victims of child sexual abuse are more likely to become perpetrators later in life [11]. As a result, governments and international child welfare groups are working to eliminate crimes against children by implementing effective countermeasures.
In the process of resolving real-world challenges, technical improvements are extremely beneficial. Child abuse is rampant all around the world, regardless of the countries’ economic, social, or religious backgrounds. Child abuse is linked to socio-demographic factors such as victim and offender details, financial position, geographic information, and legal delineations, much like any other crime. The data management and analysis processes are becoming more sophisticated as the amount of data grows. The challenges of data storage, retrieval, and analysis can all be addressed with the help of emerging big data technologies. The progress paved the way for the creation of a global repository of child abuse materials [12]. Artificial Intelligence (AI) has similarly cleared the door for the development of rigorous predictive policing frameworks. The AI-enabled smart police expert systems link different crime-related attributes and yielded better results [13].
In 2020, a ten-year-old Chicago schoolgirl was abused in the Grand hotel by a middle-aged man [14]. During the inquiry, the authorities discovered she had been sexually assaulted for the past three years. Even though the school and motel had made an official report, the perpetrators were not caught by law enforcement. Instead, the victim was transported to a mental institution and held there for more than a month. As an excuse to keep her in the hospital for a prolonged amount of time, the Illinois Department of Children and Family Services notified the court that there was no place for her to reside. The legal authorities were required to act against the abusers while the victim was being mistreated for the first time. The legal entities’ prompt steps may have rescued the girl from further abuse. The victim was subjected to retaliate as a result of the government’s continuous operational ineptitude. Artificial intelligence-based technologies could have helped predict child abuse and the probability of recidivism in such instances. We were inspired by the above incident and decided to conduct a study on child maltreatment in Chicago.
The remaining sections of the paper are as follows: Section 2 contains the literature review. The research gap and dataset description are discussed in Section 3. Section 4 explains the planned approach as well as the findings of this investigation. Section 5 contains the conclusion and recommendations for future research.
The term “child maltreatment” refers to any inappropriate behavior by an adult toward a child. The most common types of maltreatment are physical abuse, mental abuse, sexual abuse, neglect, induced disease, and social abuse [15]. The activities typically create bodily, mental, and sexual suffering in the youngster. Child abuse can occur in both the real and virtual worlds. On the internet, there are also adult-child sex advocacy websites that defend this perversion as a normal activity [16]. The breeding grounds for child sexual abuse are child sex pornographic websites, printed magazines, and adult-child sex advocacy forums. Individuals’ socioeconomic and psychological backgrounds also play a significant effect in child abuse. Crime classification approaches would be effective in developing countermeasures since the severity of child maltreatment varies from case to case [17].
Russell [18] discussed the limitations and opportunities of employing technological breakthroughs to predict child maltreatment. When a child is abused, child welfare groups ask who, how, and why. Though predictive algorithms are useful in predicting child abuse, they necessitate a sufficient amount of high-quality data. An effective analytics tool, according to the author, could be beneficial in social services. Gillingham praised the use of block box machine learning algorithms in social issues [19].
In New Zealand, Vaithianathan et al. developed a Predictive Risk Model (PRM) to forecast the likelihood of child abuse [20]. The model identified the children who may have been harmed as a result of the abuse. Those who were identified as being at risk were eventually enrolled in the public assistance system. It demonstrated the PRM’s effectiveness. Cherian et al. investigated the crimes that occurred in San Francisco and classified them [21]. The Random Forest model produced 84.68% and 29.31% accuracy in training and testing data, respectively. There was no doubt that it was an issue of overfitting. As a response, the demographic characteristics of the incident were included, and the models were revalued. The proposed approach achieved 31.84% in testing data and the training accuracy was reduced. Wilson et al. [22] proposed a predictive risk modelling strategy for predicting child abuse and neglect in New Zealand. They analyzed thirteen years of data gathered by the family protection agency. Partial Least Square and Multi-Level Model were identified as the best performers after comparing the results of twelve state-of-the-art algorithms. Both have an AUR rating of 88%, indicating that they might be utilized to make real-time predictions. The authors concluded, however, that the PRMs could only be employed as support units for traditional human judgement. Vaithianathan et al. suggested a Random Forest-based PRM model based on data from Allegheny County’s Child Protective Services (CPS) and General Protective Services (GPS) [23].
Horikawa et al. used the age of the kid, the age of the perpetrator, the history of maltreatment, and the financial background to predict the recurrence of child abuse. It assured that demographic data played a significant effect in the occurrence of crimes [24]. Injuries are one of the signs that a child has been abused. To assess the risk of child maltreatment, data from child protection and hospitals were matched [25]. The technique projected a 2 out of 100 chances of abuse-related harm among high-risk children. The same goes for the low-risk youngsters, who are predicted to have a risk factor of 0.2 out of 100. The suggested approach would be obligated to detect the risk associated with foster care families. Su et al. used hospital data to conduct a cross-functional analysis to predict the suicide risk among children and adolescents [26]. With an AUC of 0.84, the L1 Logistic regression models predicted both short and long-term suicidal tendencies. It confirmed the importance of hospital records in the development of predictive models. Walsh et al. developed a logistic regression model to estimate Adverse Childhood Experiences [27]. The relationship between the mother and her spouse, financial standing, community, and the health of the parents were all considered while making the prediction. With an AUC of 0.76, the model predicted the children who would be affected by adverse events.
Child abuse is common among children aged one to ten, according to data collected by Wongcharoenwatana et al. [28]. In most cases, the biological parents are the perpetrators, which is an unacceptable truth. Recurrent child maltreatment or recidivism should be eliminated since the child would lose hope in humanity. Using the demographic information of the children, the suggested logistic regression model successfully predicted child abuse. By studying hospital records, birth and death records, and child protection details, Putnam-hornstein et al. was able to discover child maltreatment [29]. According to the findings, data from related domains might improve the accuracy of child maltreatment prediction. Intentional injuries signify that a child has been maltreated or has a suicidal tendency. Yin et al. evaluated various Machine Learning models by utilizing data from the Chinese National Injury Surveillance System (NISS). Deep Neural Networks and AdaBoost models were more successful than the others in classifying injuries [30].
Child sexual abuse is more difficult to identify and analyze because there are no outward traces in many cases. By examining self-figure drawings, Kissos et al. suggested a novel method for performing the task [31]. The abuses were predicted with 70% accuracy using a CNN-based image classification model. Tsai et al. used image classification techniques to identify classic metaphyseal lesion (CML) injuries [32]. The residual Neural Network algorithm was used to evaluate the radiographic images of the newborns, and it categorized the injuries with 93%. The proposed methodology could be useful in identifying infants who have been vulnerable to physical abuse. Kim et al. examined data from the Korean Child Protection Service and compared victim, offender, and family background characteristics. Aside from severe repercussions for perpetrators, evidence-based intervention would be the best strategy for reducing future abuses [33]. Problematic childhood experiences were caused by certain societal characteristics of the families. Authorities and organizations need to use data analysis to identify those families. Early action could reduce the number of unlawful incidents [34].
One of the issues in child maltreatment research is data availability. Despite the establishment of venues such as the ISPCAN Working Group, data quantity, quality, and availability remain a problem [35]. Governments throughout the world should have a policy in place for collecting and sharing information about child maltreatment. Creating a centralized data pool, standardizing rules, cross-validating data, and evaluating the proposed model with multiple datasets could help to assure the efficiency of predictive risk models. The researchers should always be cognizant of the negative consequences that false positive predictions could have [36]. Hence, the model should be appraised with balanced training data to reduce the predictive bios [37]. PRM, like every progressive initiative, is confronted with ethical challenges [38]. PRM, on the other hand, has been shown to be effective in investigations and to produce superior results than existing approaches. The PRM models thrive in social corrective activities because of their practicality [39]. The PRM’s ethical challenges would be reduced if birth matching and algorithmic decision-making were transparent. The automated system for detecting child maltreatment should be held accountable for the stated decision [40]. Machine Learning models could only be acknowledged as a practice if they were human centrically designed. Researchers should guarantee that the strategy is transparent and that the solutions are accountable. Though the ultimate result is essential, the tools should never have unintentional or intended negative consequences [41].
Crimes are linked to multiple community nodes, which generate terabytes of data every day. Due to the dimensionality of crime data, the prediction process is more difficult. As a result, Machine Learning models were used to predict different sorts of crimes [42,43]. Since child abuse is considered a crime, legal entities are constantly monitoring society and attempting to address the problem through countermeasures. However, different approaches must be taken depending on the nature of the offence. We should view child abuse as a distinct class of crimes because of the victims’ lack of voice, the impact of the crimes on individuals and society, and the lesser likelihood of reporting. Addition of analyzing demographic information, medical records, and financial information, there is a need for scrutinizing the crime reports. By constructing a dedicated Machine Learning model for child abuse prediction, we could overcome the challenges that arise with it. We attempted to build a model that could predict child abuse by evaluating criminal data in this study.
3 Data Collection and Preprocessing
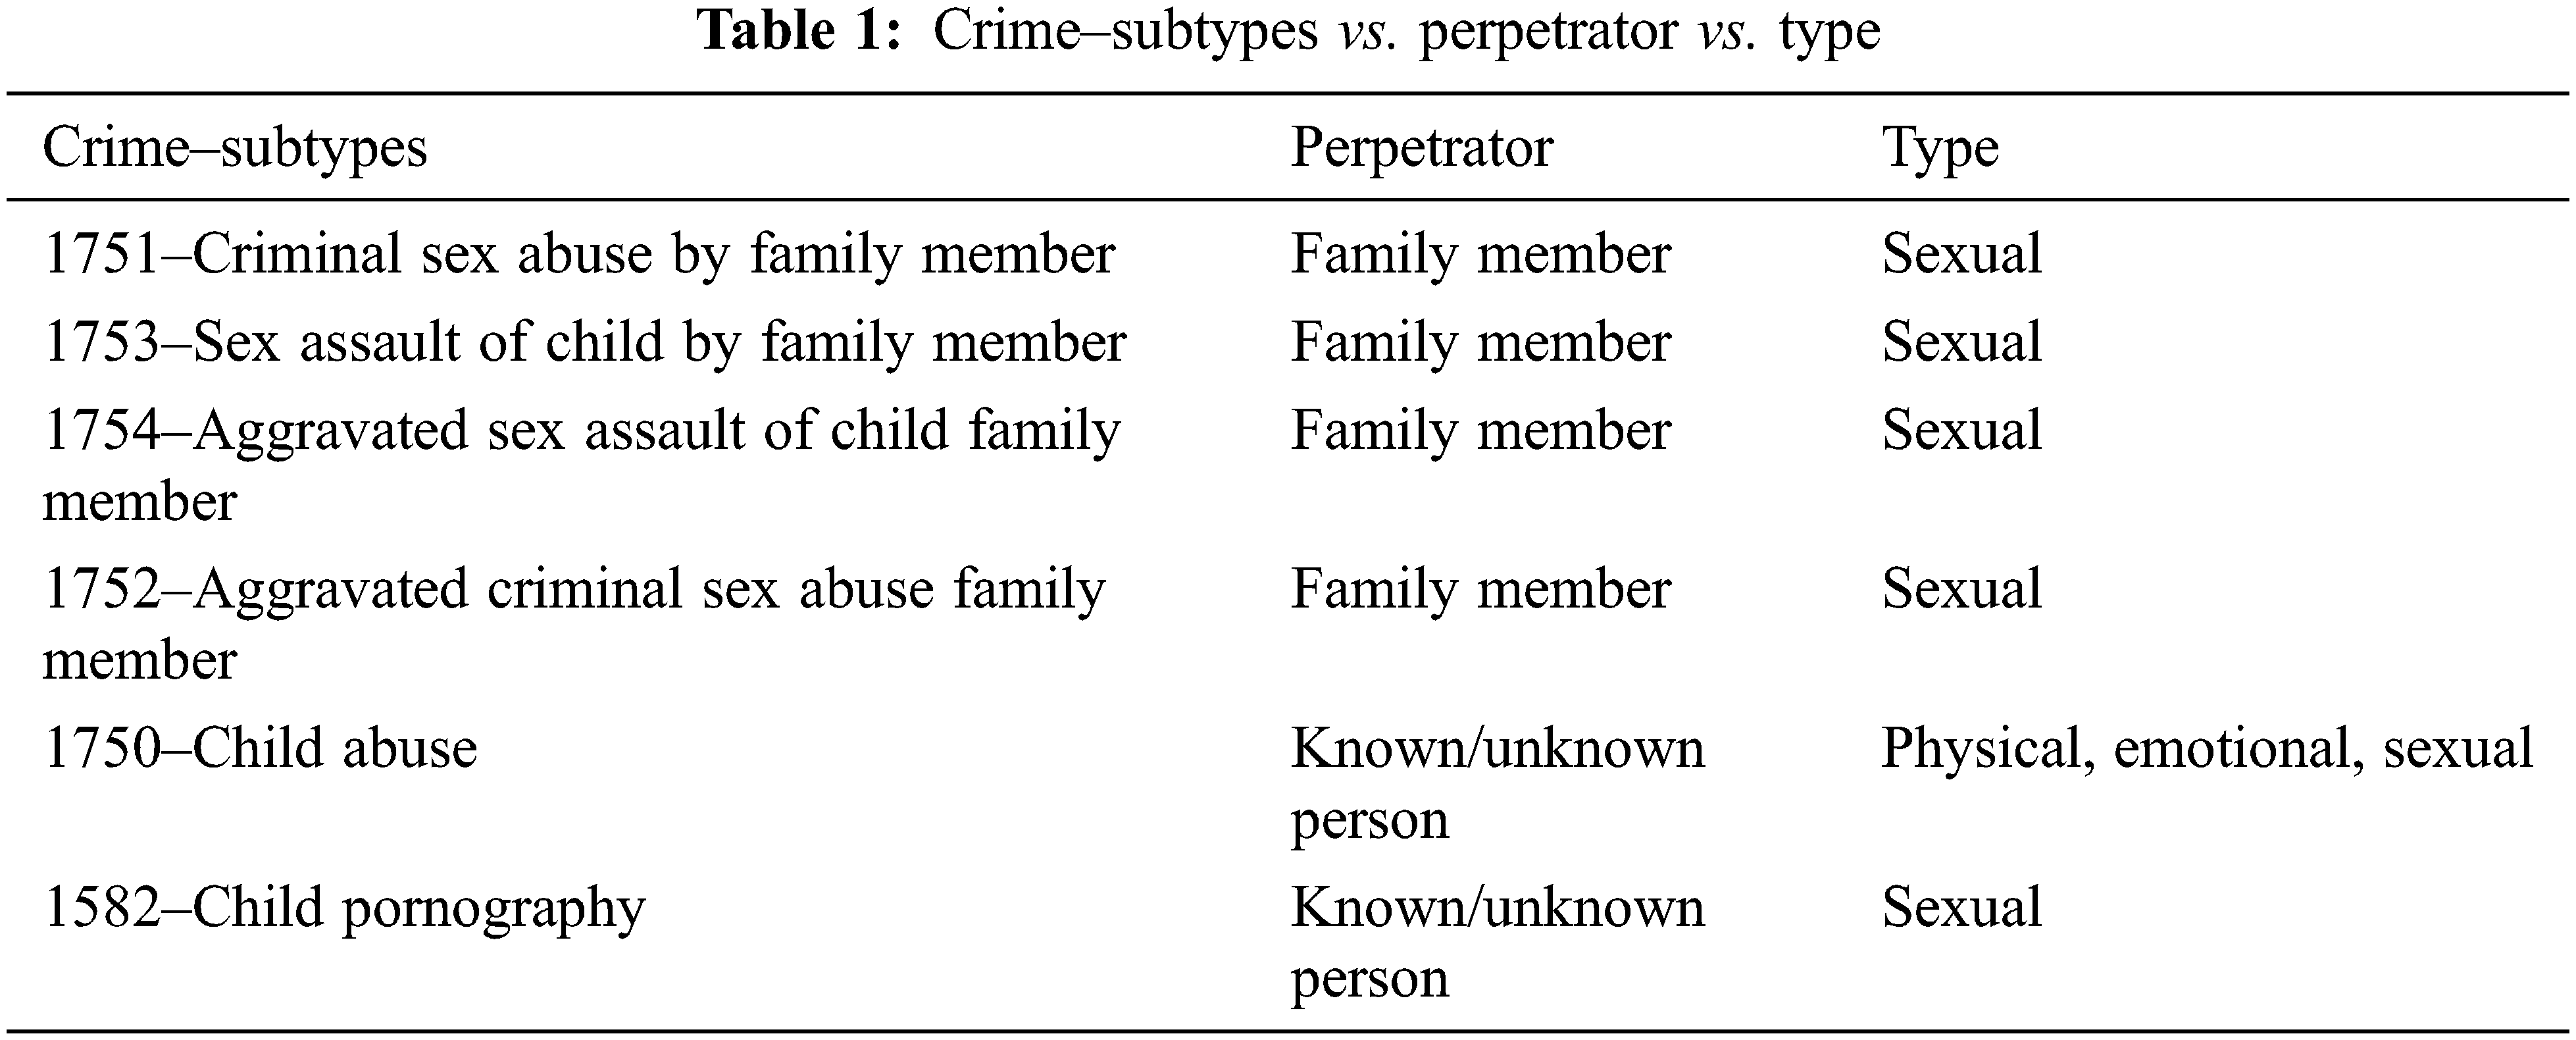
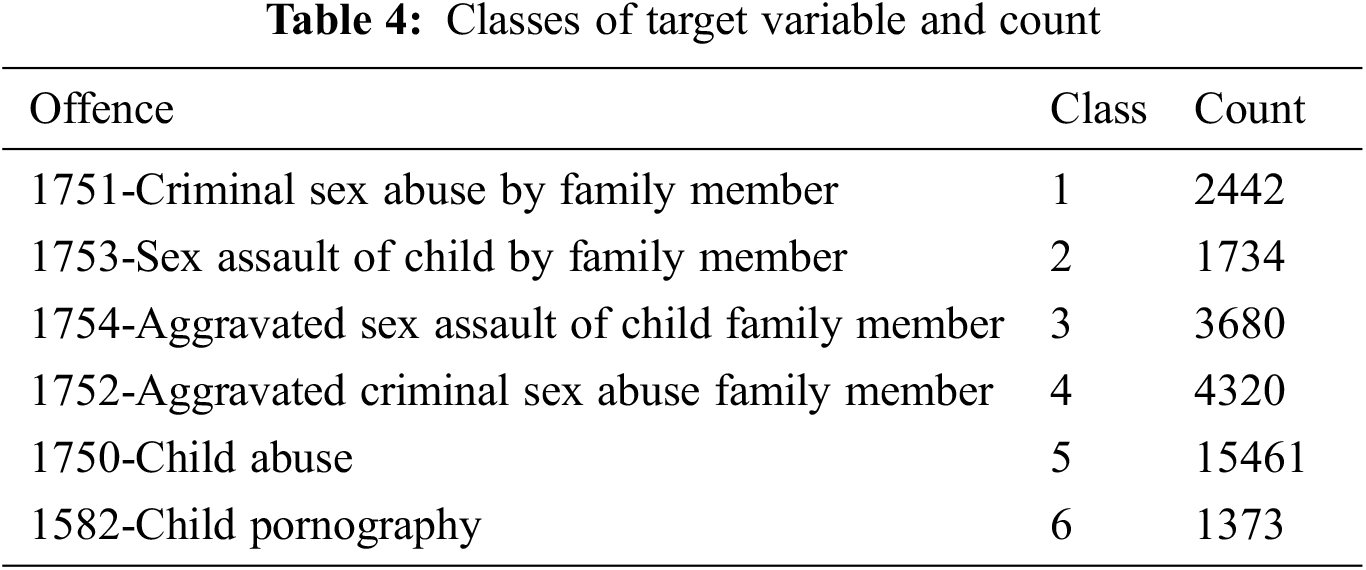
Fig. 1 illustrates the process flow for the data set preparation. The crime statistics were obtained from Chicago’s open data portal [44]. It includes information on crimes committed between 2001 to the present. ID, Case Number, Date, Block, IUCR, Primary Type, Description, Location Description, Arrest, Domestic, Beat, District, Ward, Community Area, FBI Code, X Coordinate, Y Coordinate, Year, Updated On, Latitude, Longitude, and Location information were all plotted for each occurrence. The dataset comprises 74,76,832 offences over the chosen time period. The incidents that occurred between January 2001 and December 2021 were then filtered. We chose the data under the primary type of ‘offence involving children’. We considered the crimes labelled as ‘criminal sexual abuse by a family member’, ‘sexual assault of a child by a family member’, ‘aggravated sexual assault of a child by a family member’, ‘aggravated criminal sexual abuse by a family member’, ‘child abuse’, and ‘child pornography’ which were very severe in nature. Illinois law defines the aforementioned categories as those including physical, emotional, and sexual abuse of children by known or unknown offenders. Table 1 depicts the specifics of the offence, offender, and type.
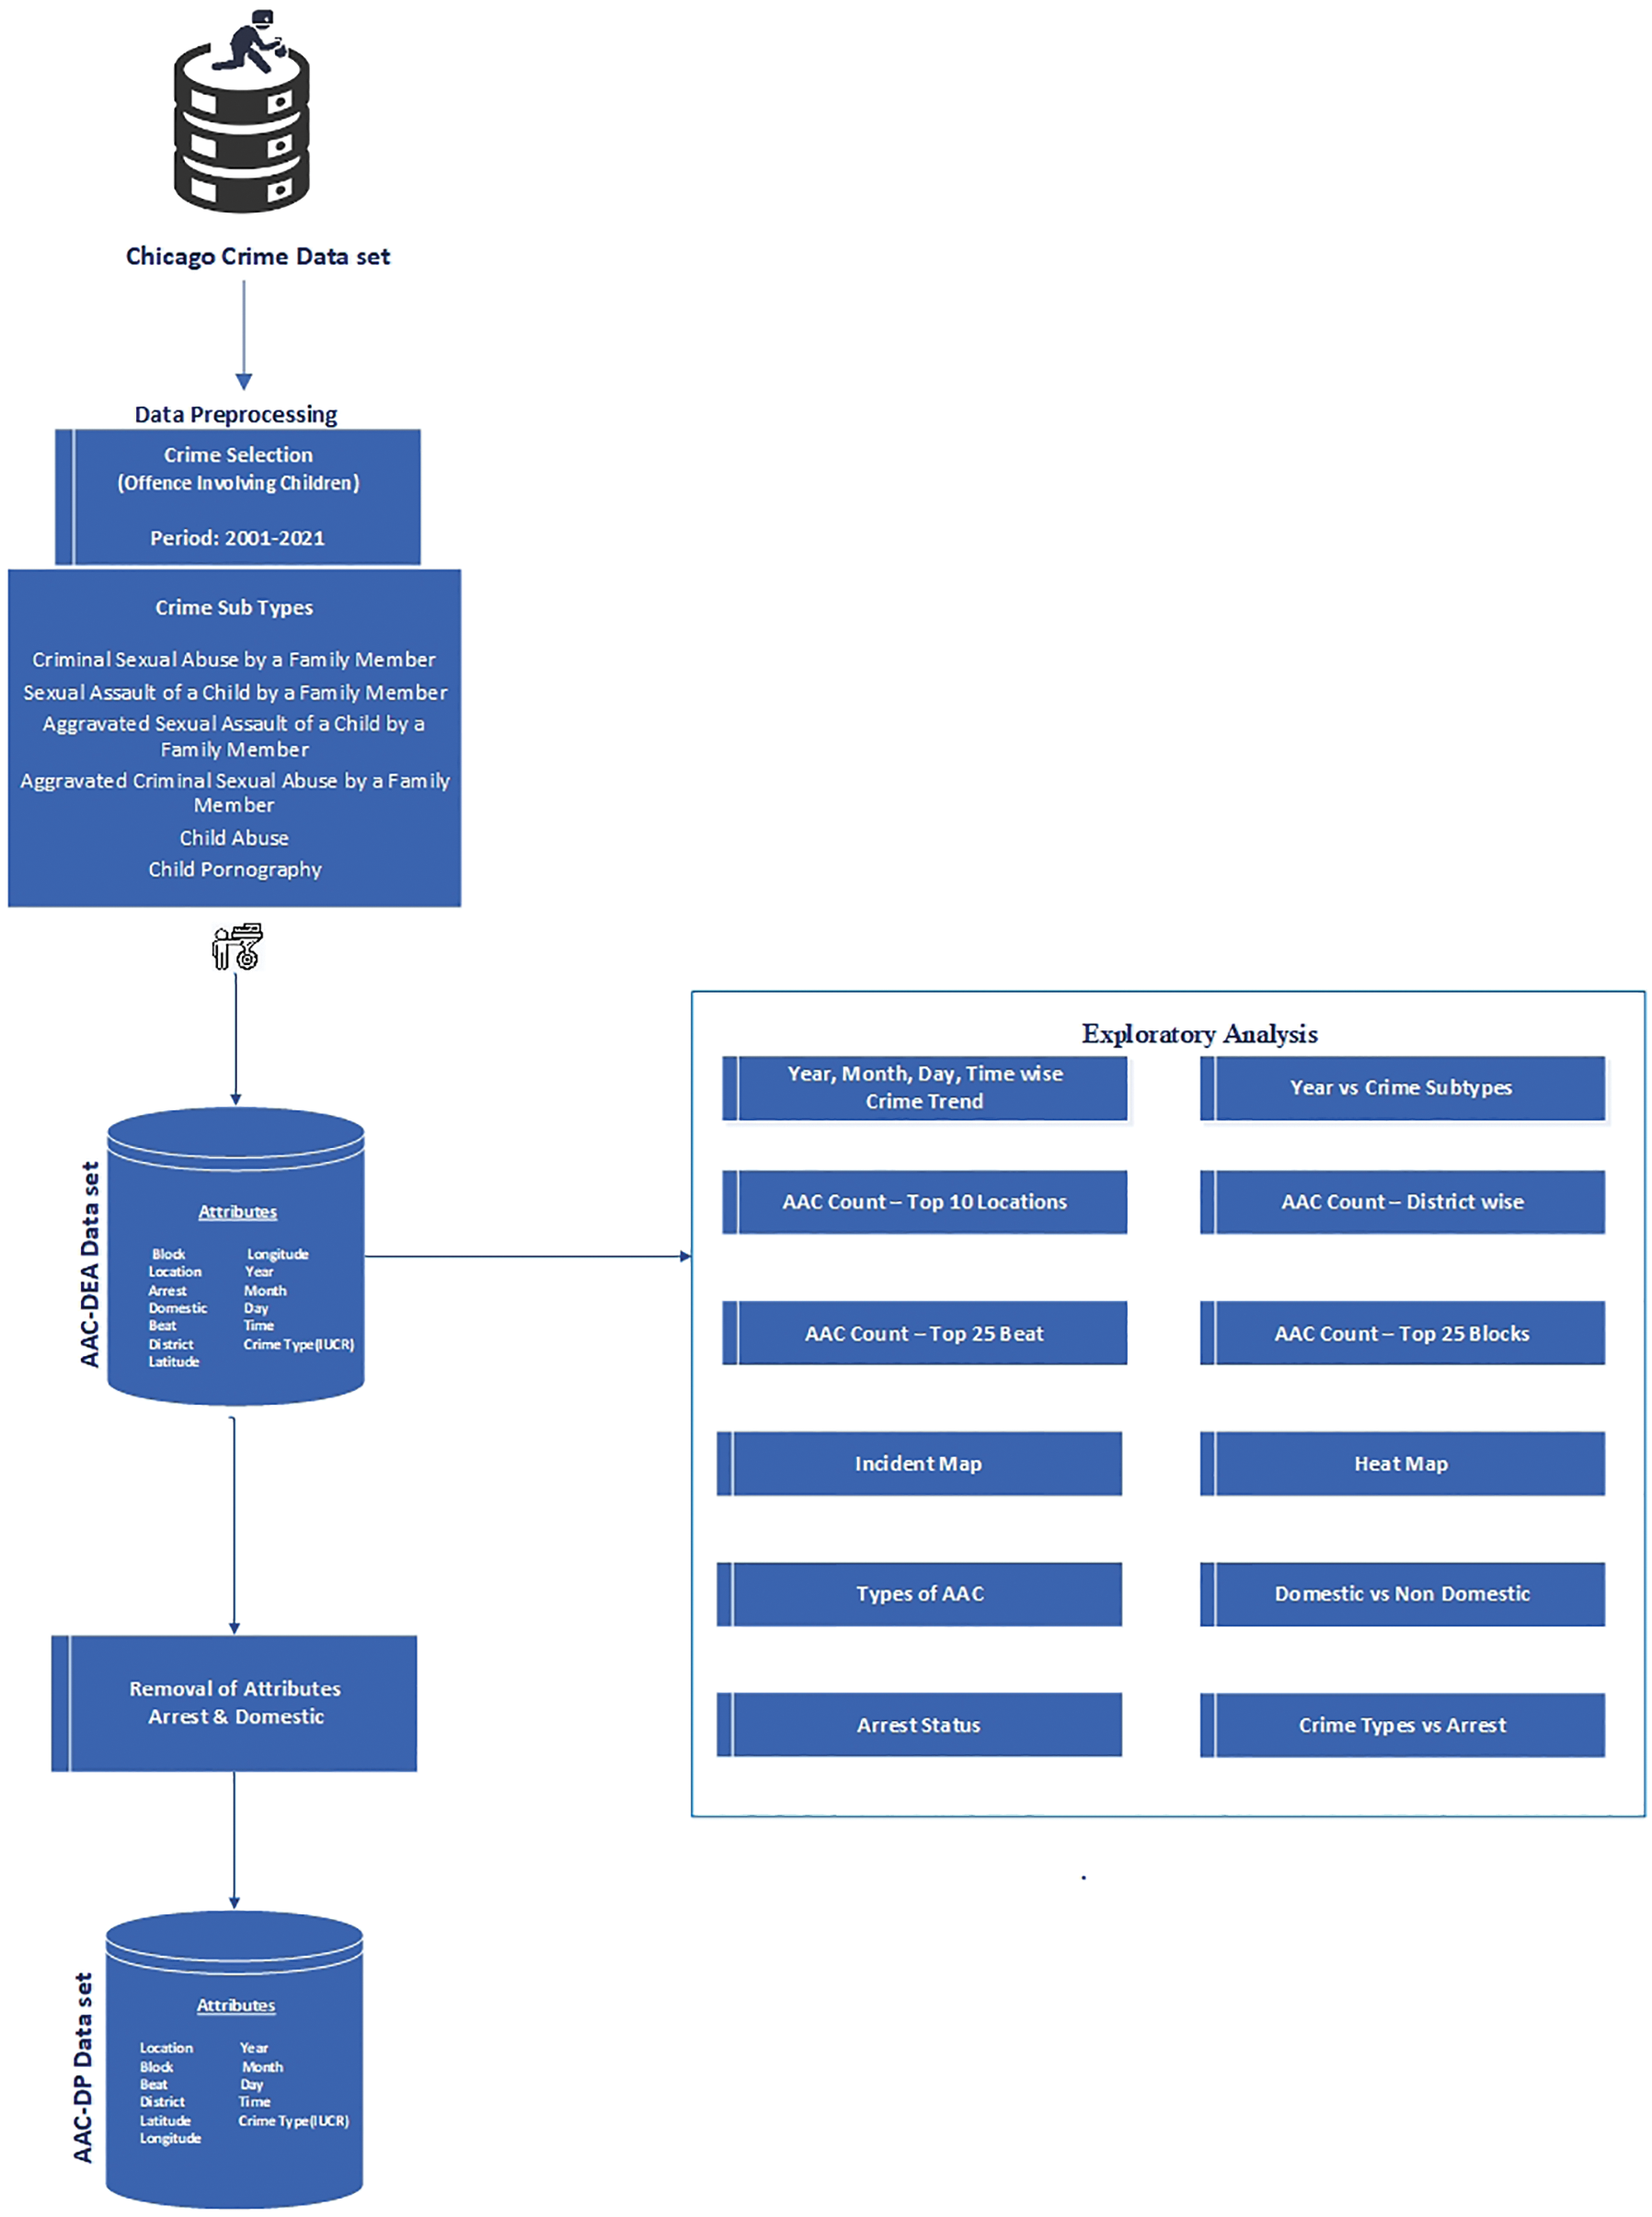
Figure 1: Phase I–data set preparation and exploratory analysis–flow diagram
The following columns were determined as less important and were removed: ID, Case Number, Primary Type, X Coordinate, Y Coordinate, Ward, Community Area, Updated On, Description, and Location. The FBI Code was also deleted from the data set because it represents the sort of crime in a tangential way. The crime incidences were only identified with block level information to protect the victims’ privacy. To generalize the data, the numerical portion of the block was eliminated. The description of the location was renamed to ‘Location,’ and the null value was replaced with the mode value. The Date column was separated into four columns: Year, Month, Day, and Time. The ‘Geopy’ package was used to replace the 3095 null values in the Latitude and Longitude columns by referencing the block name. The dataset had 1759 Blocks and 93 unique Locations that were replaced with unique numeric values. Each of the six main crime subtypes in the IUCR Code has been replaced by a numerical value ranging from one to six.
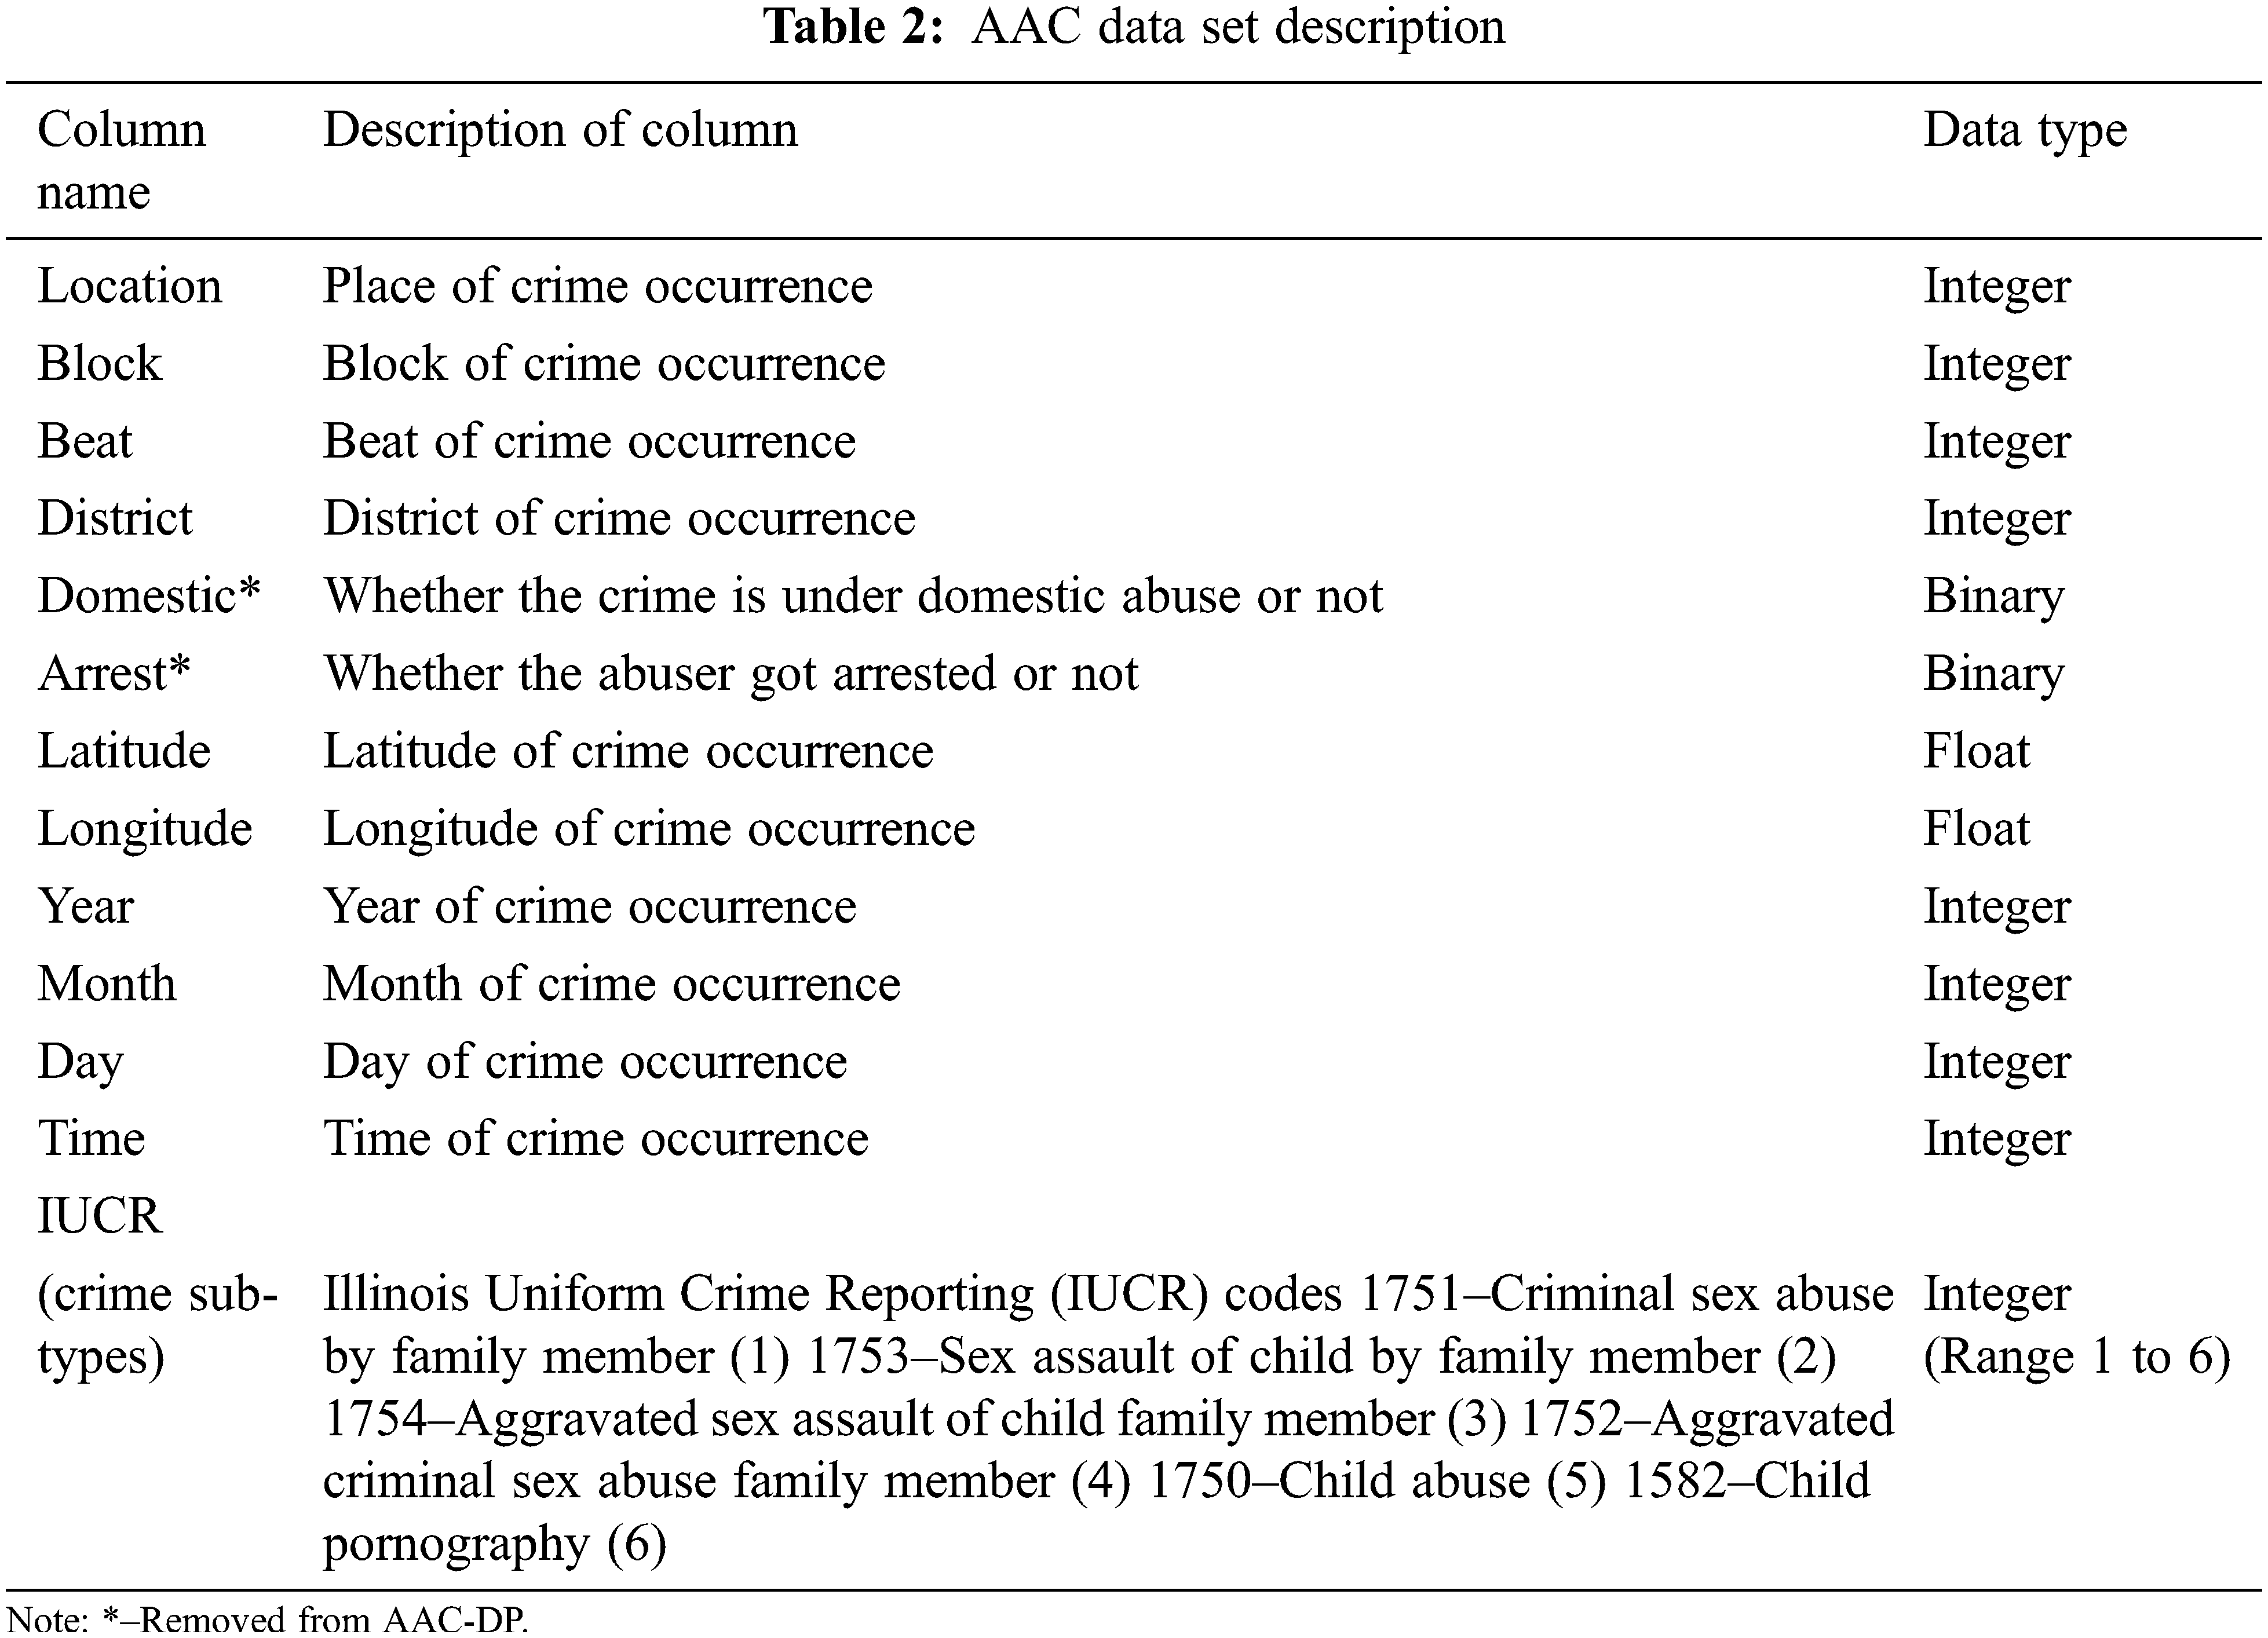
‘Abuses Against Children—Data set for Exploratory Analysis’ (AAC-DEA) is the processed dataset, which contains 29010 rows of information on Location, Block, Beat, District, Arrest, Domestic, Latitude, Longitude, Year, Month, Day, Time, and IUCR (Refer to Table 2). This data set was used for the exploratory analysis. Because Arrest and Domestic are post-occurrence attributes, they were deleted from the data set in order to continue. The finalized ‘Abuses Against Children—Data set for Prediction (AAC-DP)’ with Location, Block, Beat, District, Latitude, Longitude, Year, Month, Day, Time, and IUCR information was ready at the end of phase one.
According to Fig. 2, the number of Abuses Against Children (AAC) peaked between 2003 and 2005. Then it started to fall until 2012 when it started to rise again from 2013 to 2019. The number of crimes against children has decreased in the last two years. The lowest number of incidents was recorded in 2021. According to Fig. 3, the highest number of offences against children were committed in January, with the lowest in July and August. Fig. 4 depicts the AAC day-by-day trend, which shows that AAC incidents peaked on the first, tenth, fifteenth, and twentieth days of each month. The month ended on a low note, with only a few occurrences recorded on the 31st. The AAC events that occurred at various times are depicted in Fig. 5. The majority of the AAC activities took place during the night. The frequency of occurrences increased again in the middle of the day and later in the afternoon. There was a major crest of events at eight o’clock in the morning.
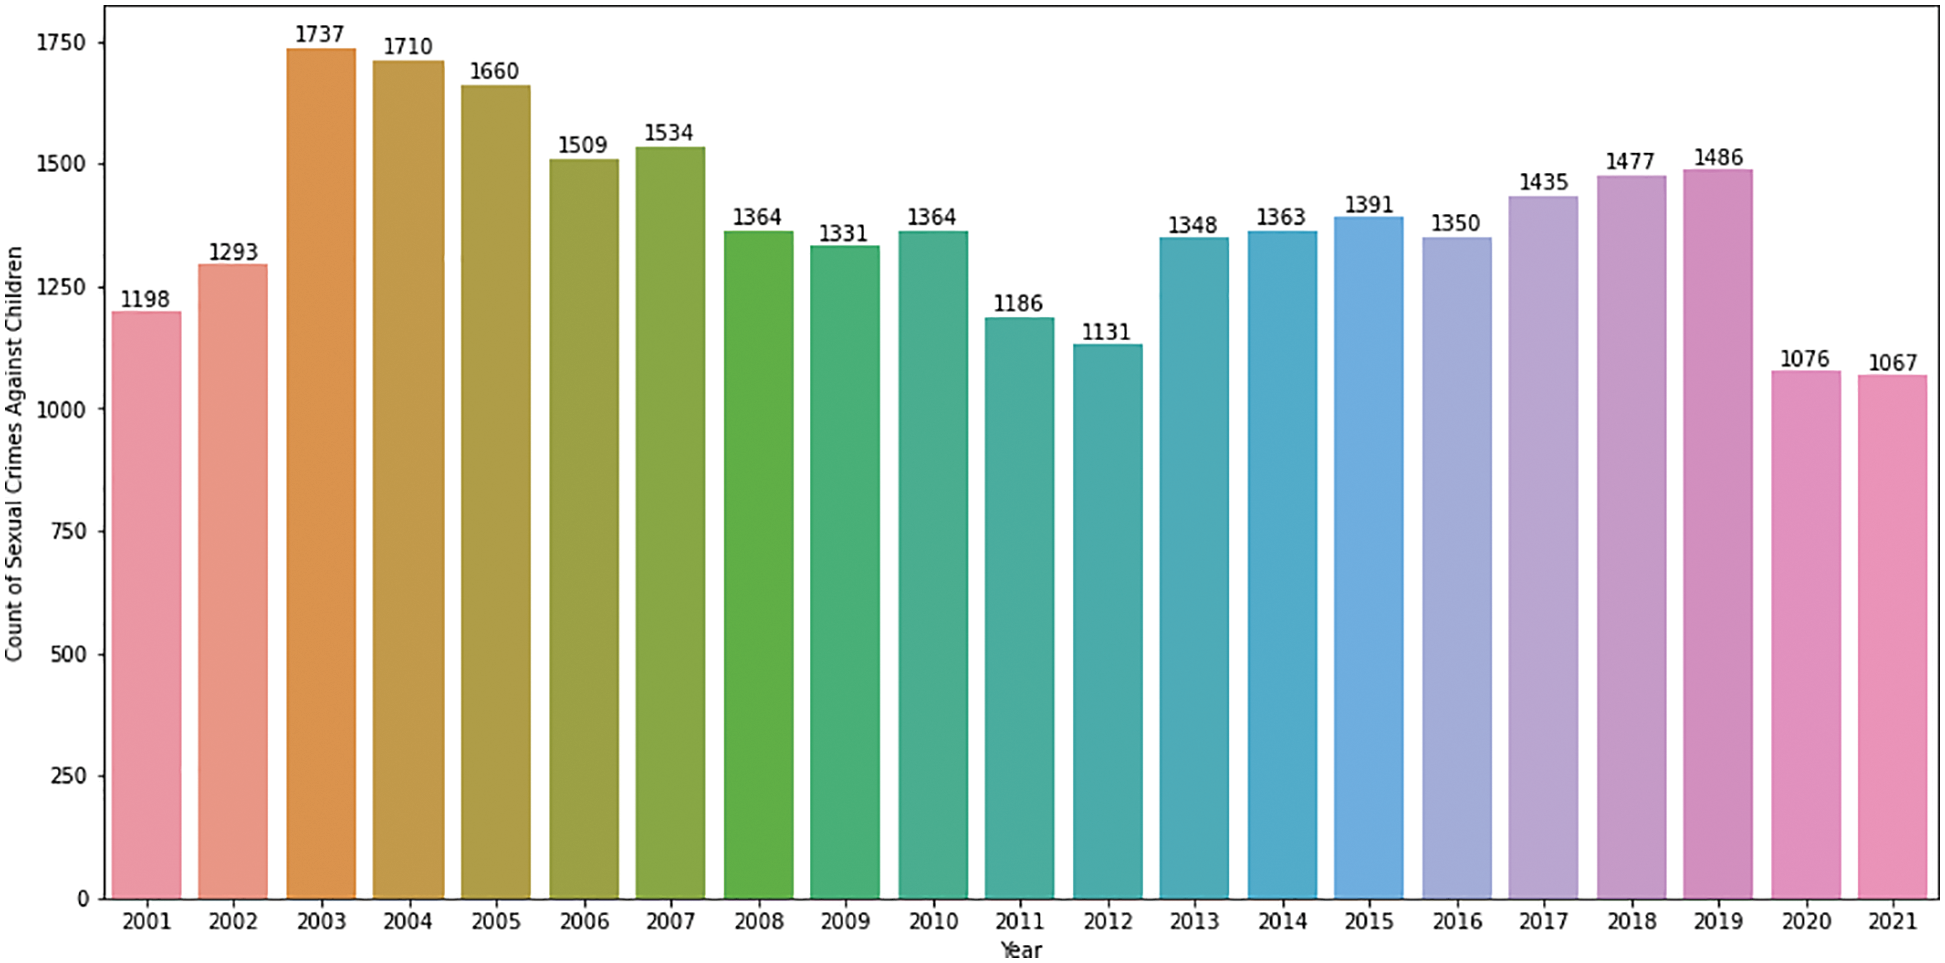
Figure 2: AAC–year wise
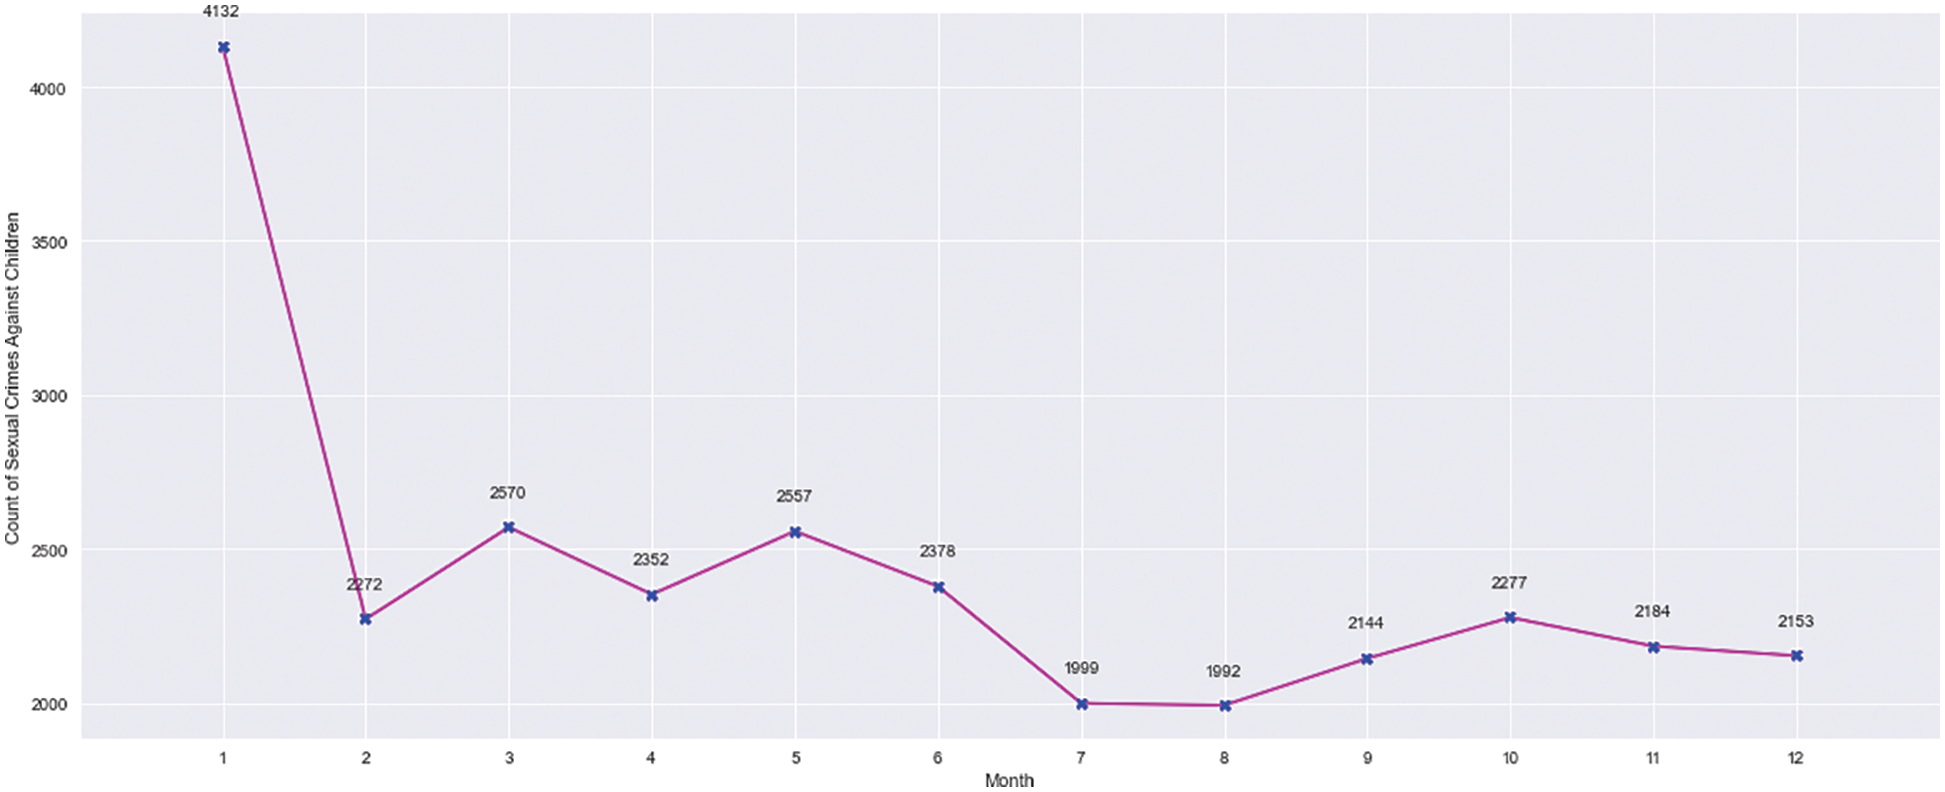
Figure 3: AAC–month wise
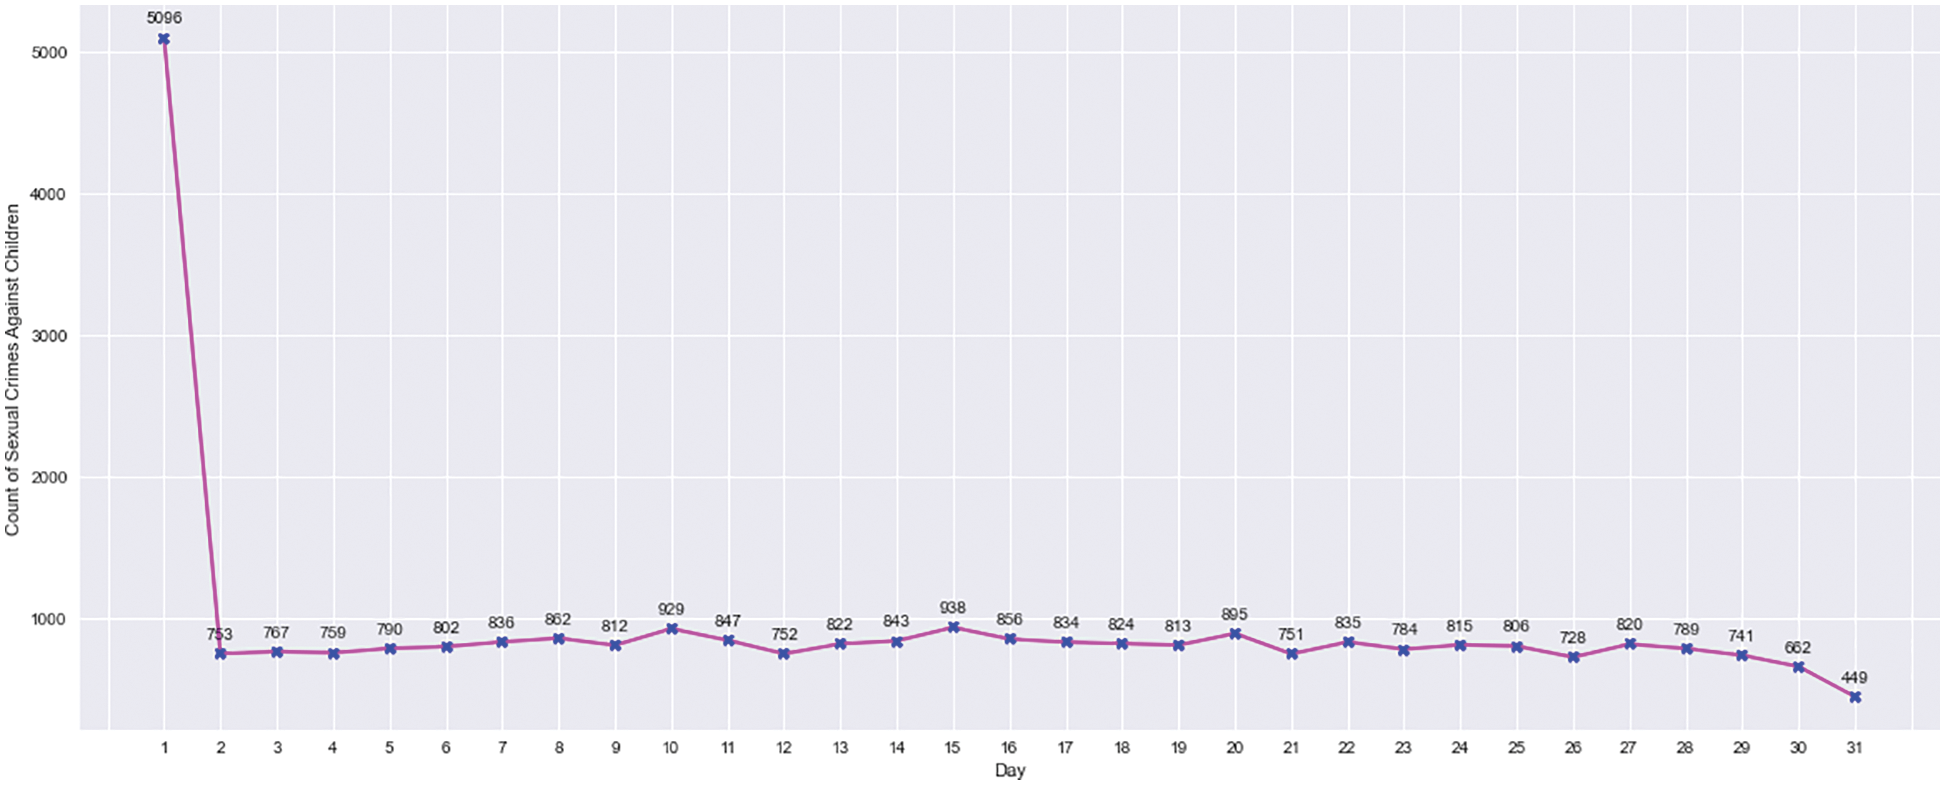
Figure 4: AAC–day wise
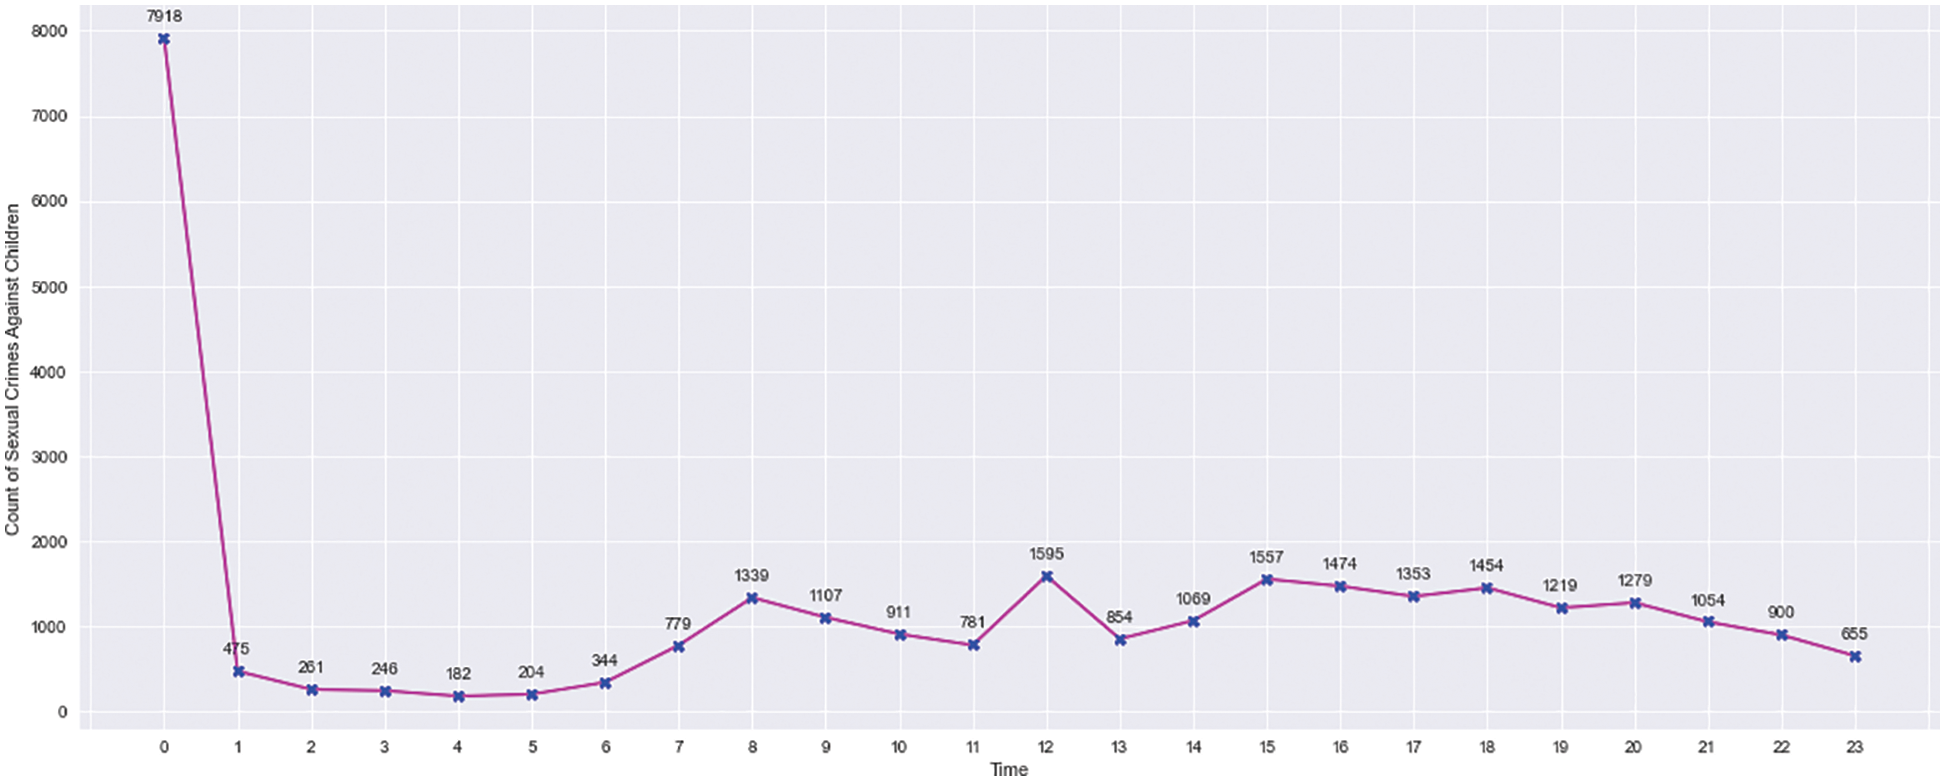
Figure 5: AAC–time wise
As shown in Fig. 6, child abuse was the most common occurrence among AAC events. Aggravated sexual assaults by family members were the second most common incident from 2001 to 2007. Following that, aggravated criminal sexual abuse by family members received the second highest ranking. Despite a decrease in child abuse in 2020, it increased in 2021. AAC events and their locations should be correlated in order to identify vulnerabilities. Most of these assaults occurred in homes, apartments, and schools (Refer to Fig. 7).
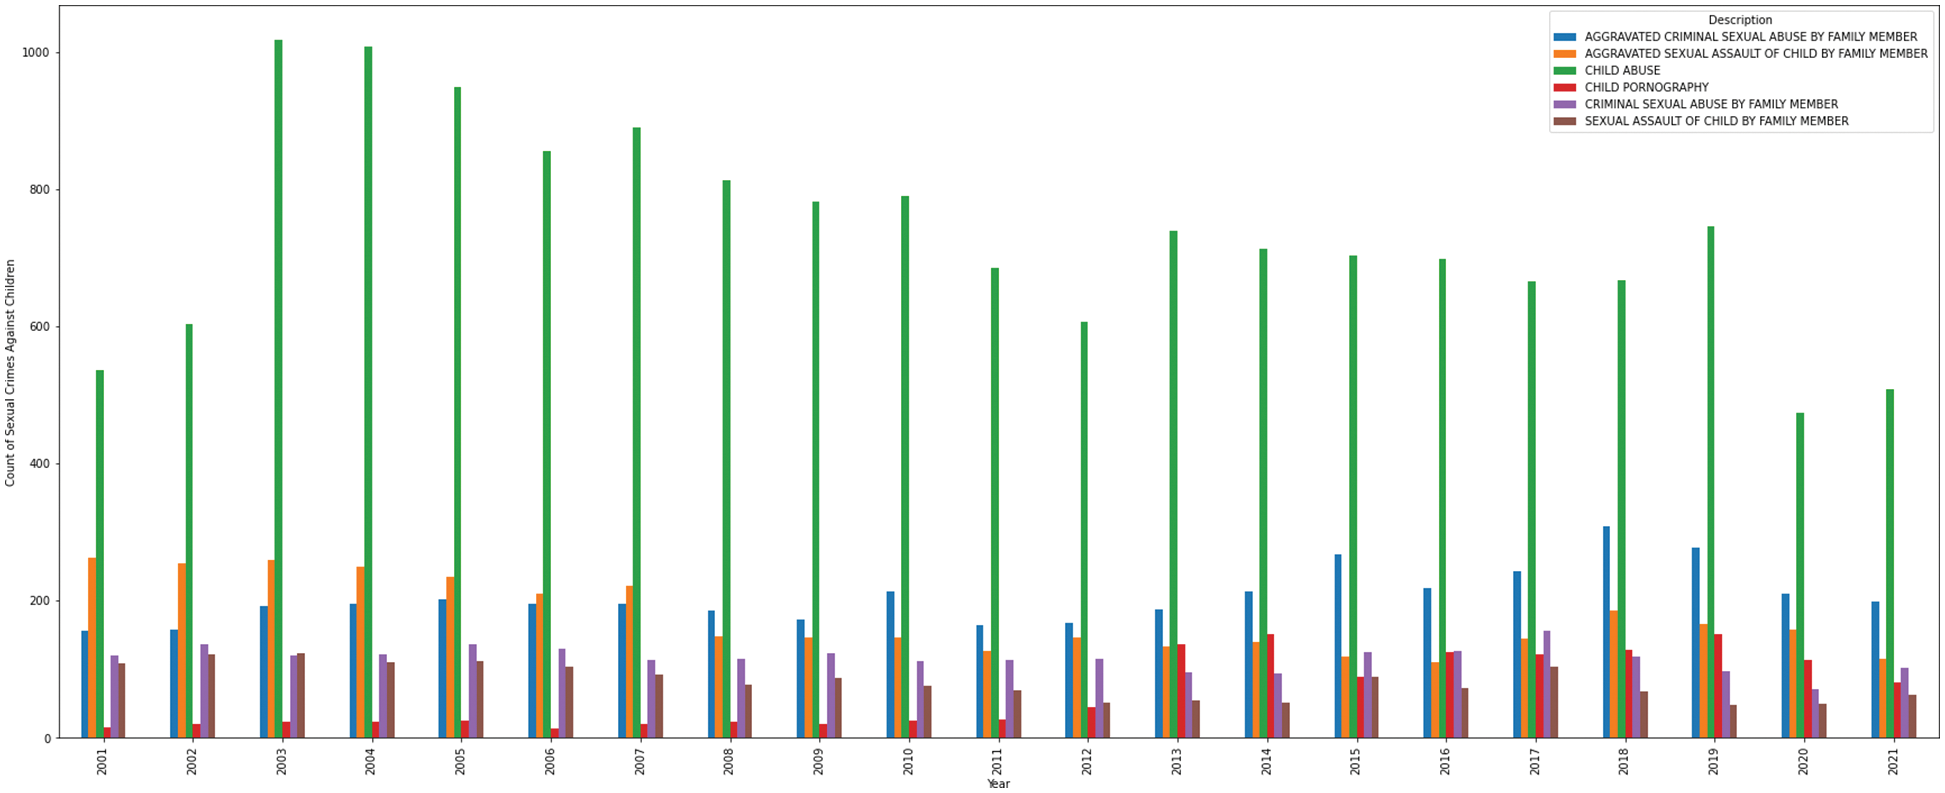
Figure 6: AAC–year vs. crime subtypes
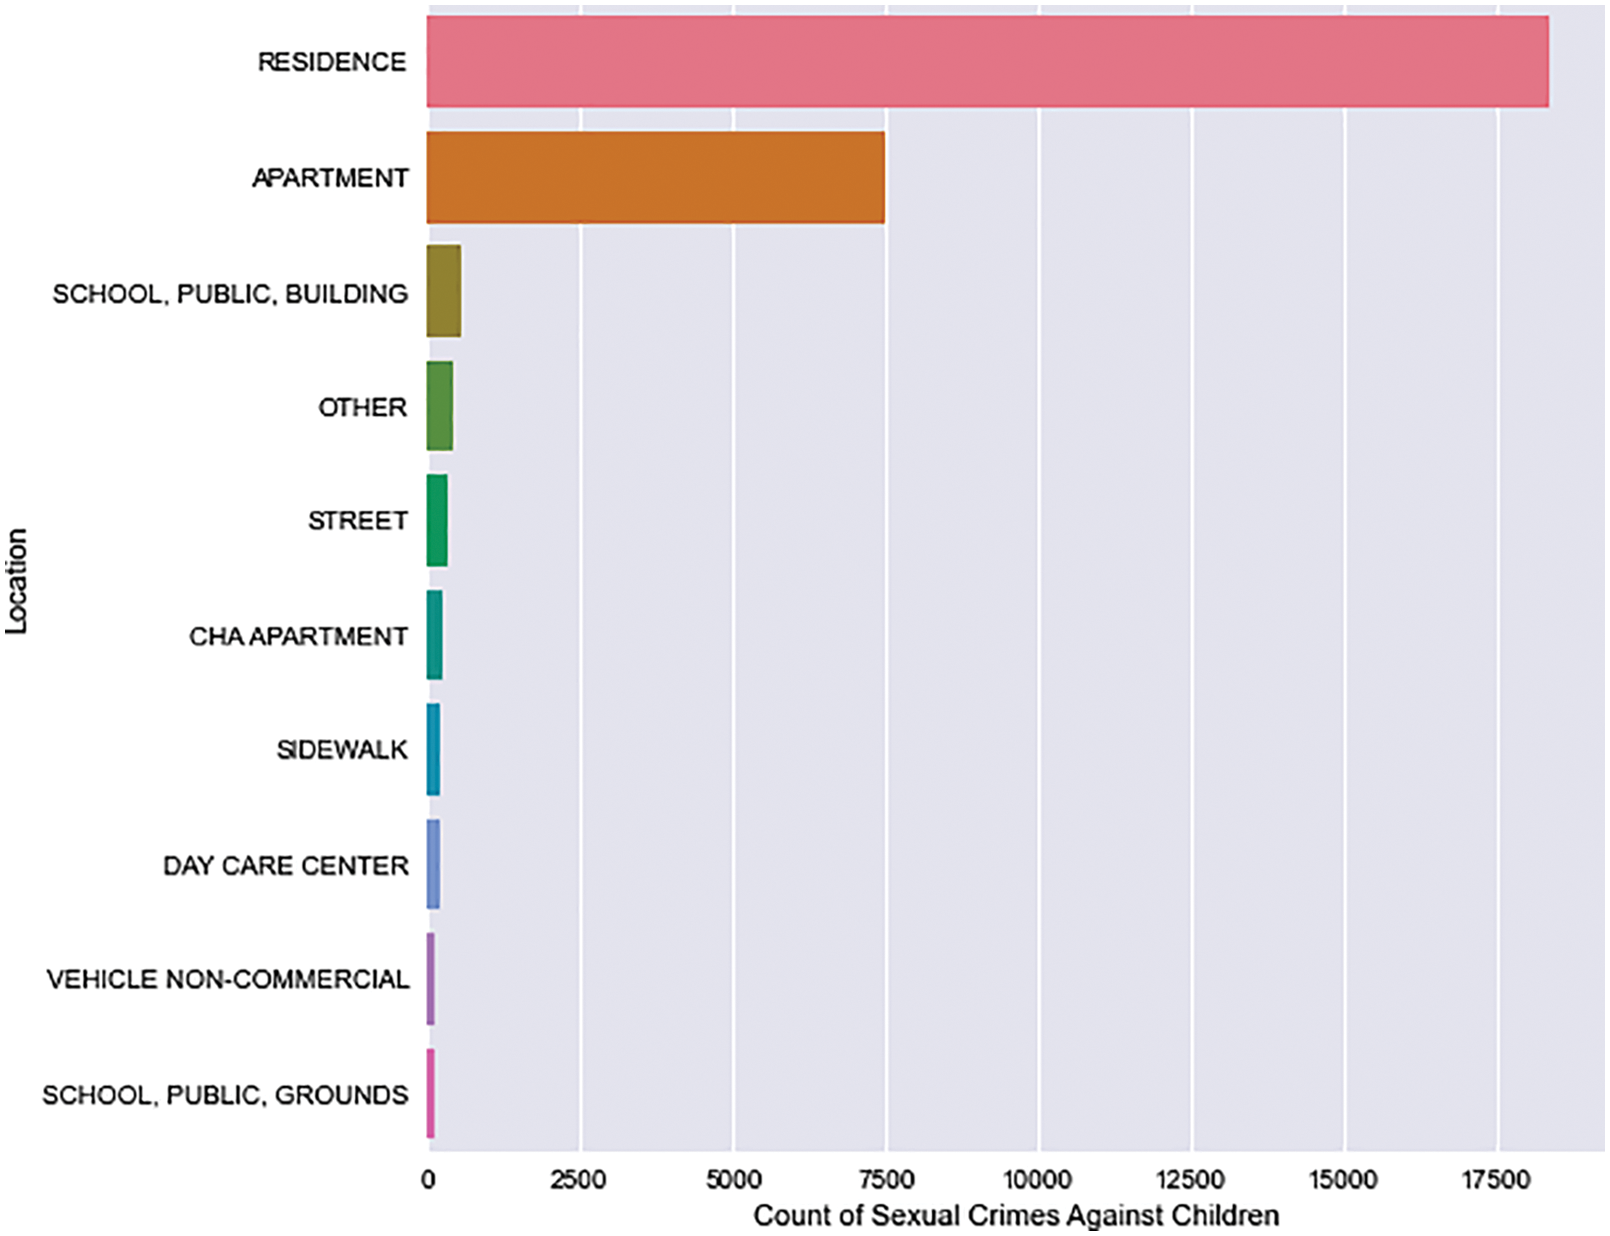
Figure 7: AAC–top 10 locations
According to Figs. 8 and 9, children are especially vulnerable in police districts 25, 8, and 4, as well as beats 423, 421, and 823. Along South Damen Avenue, South DR Martin Luther King Jr Drive, and South Michigan Avenue, the AAC has been designated as a vulnerable location (Refer to Fig. 10). Fig. 11 depicts the intensity of crime in Chicago. The incident map shows the number of crimes committed at the block level (Refer to Fig. 12).
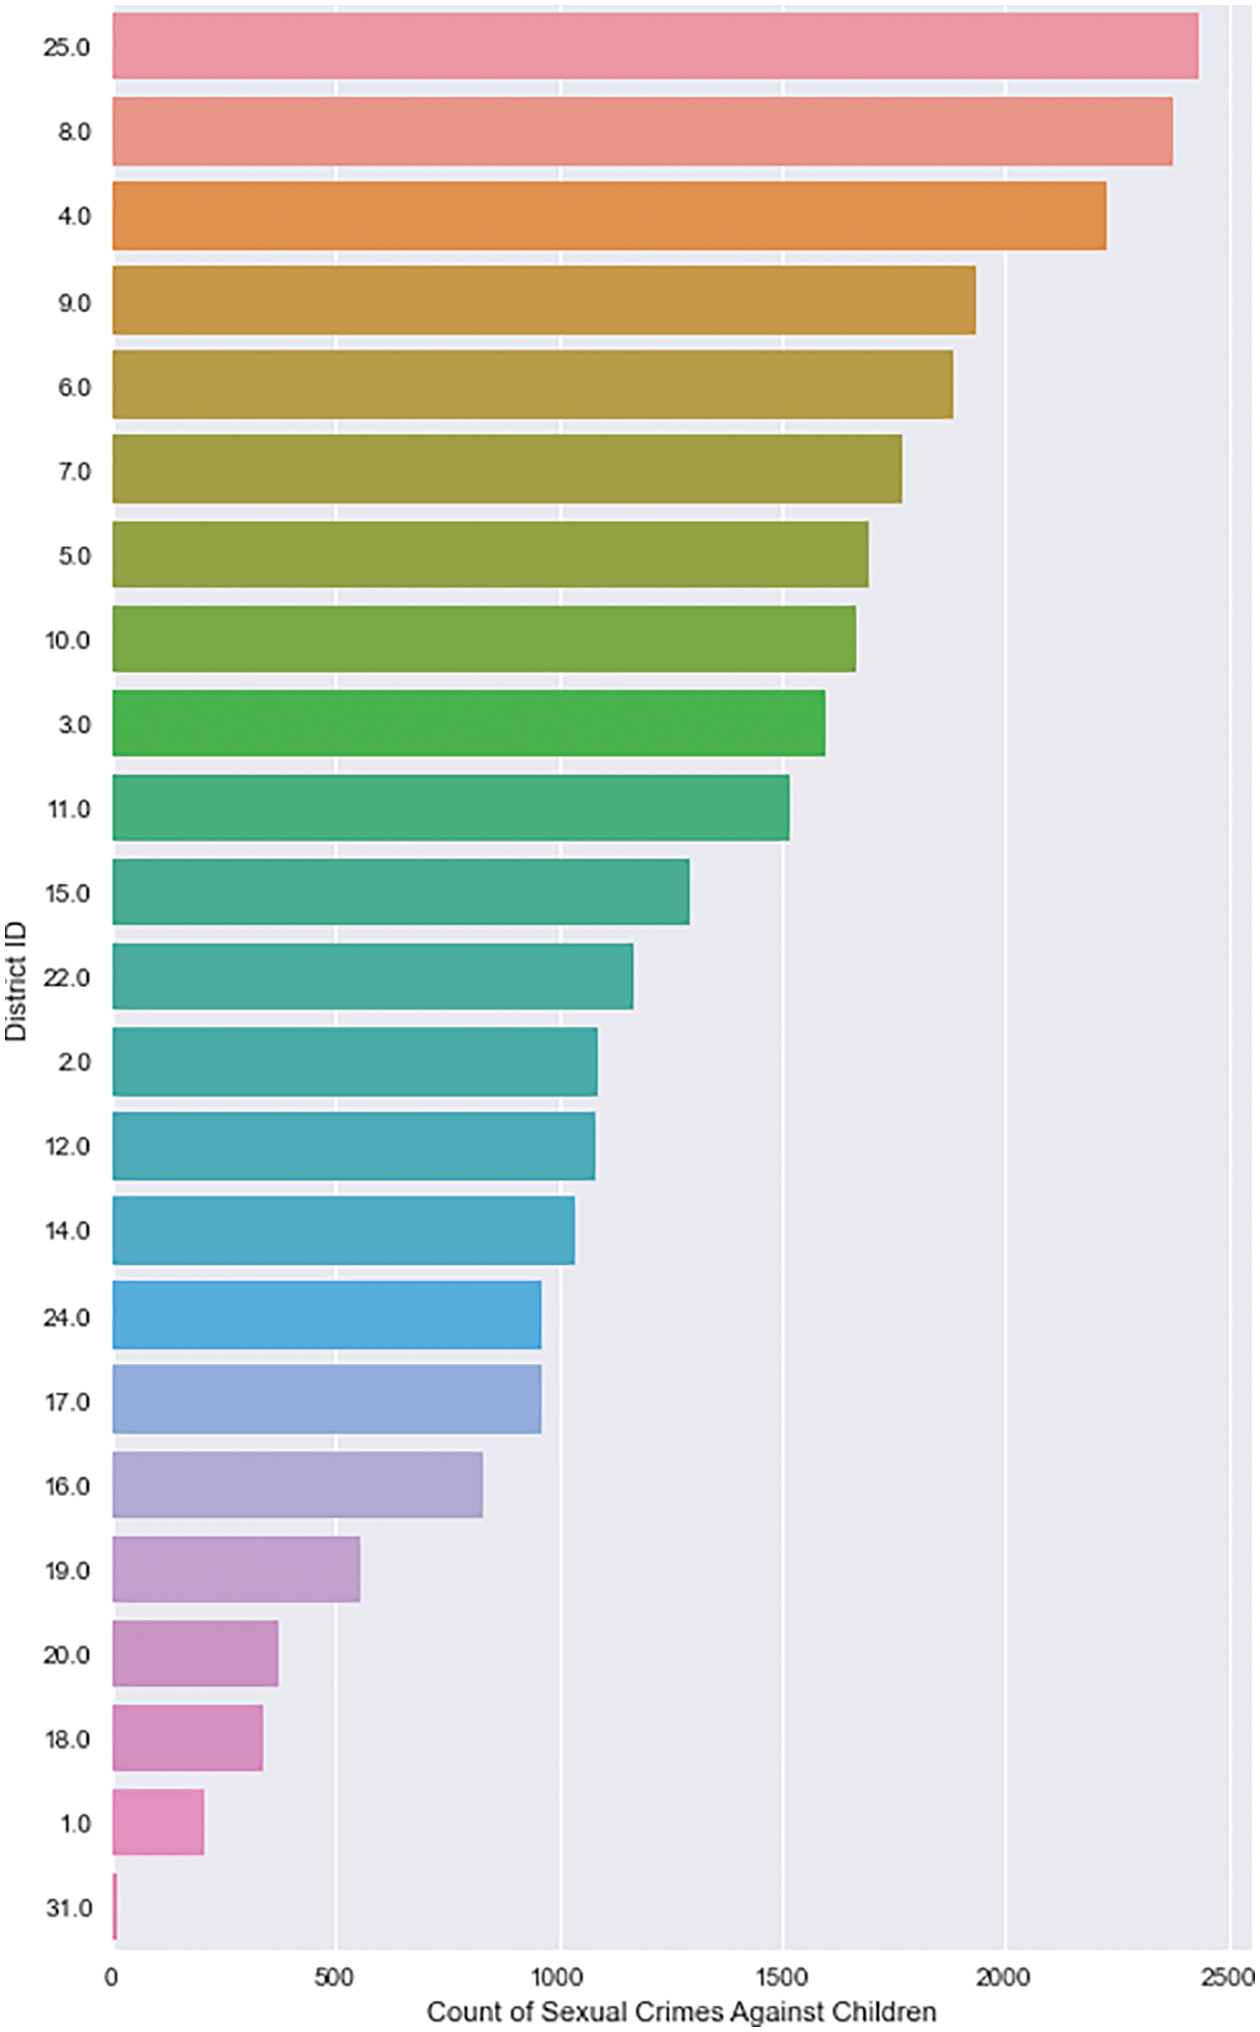
Figure 8: AAC–districts
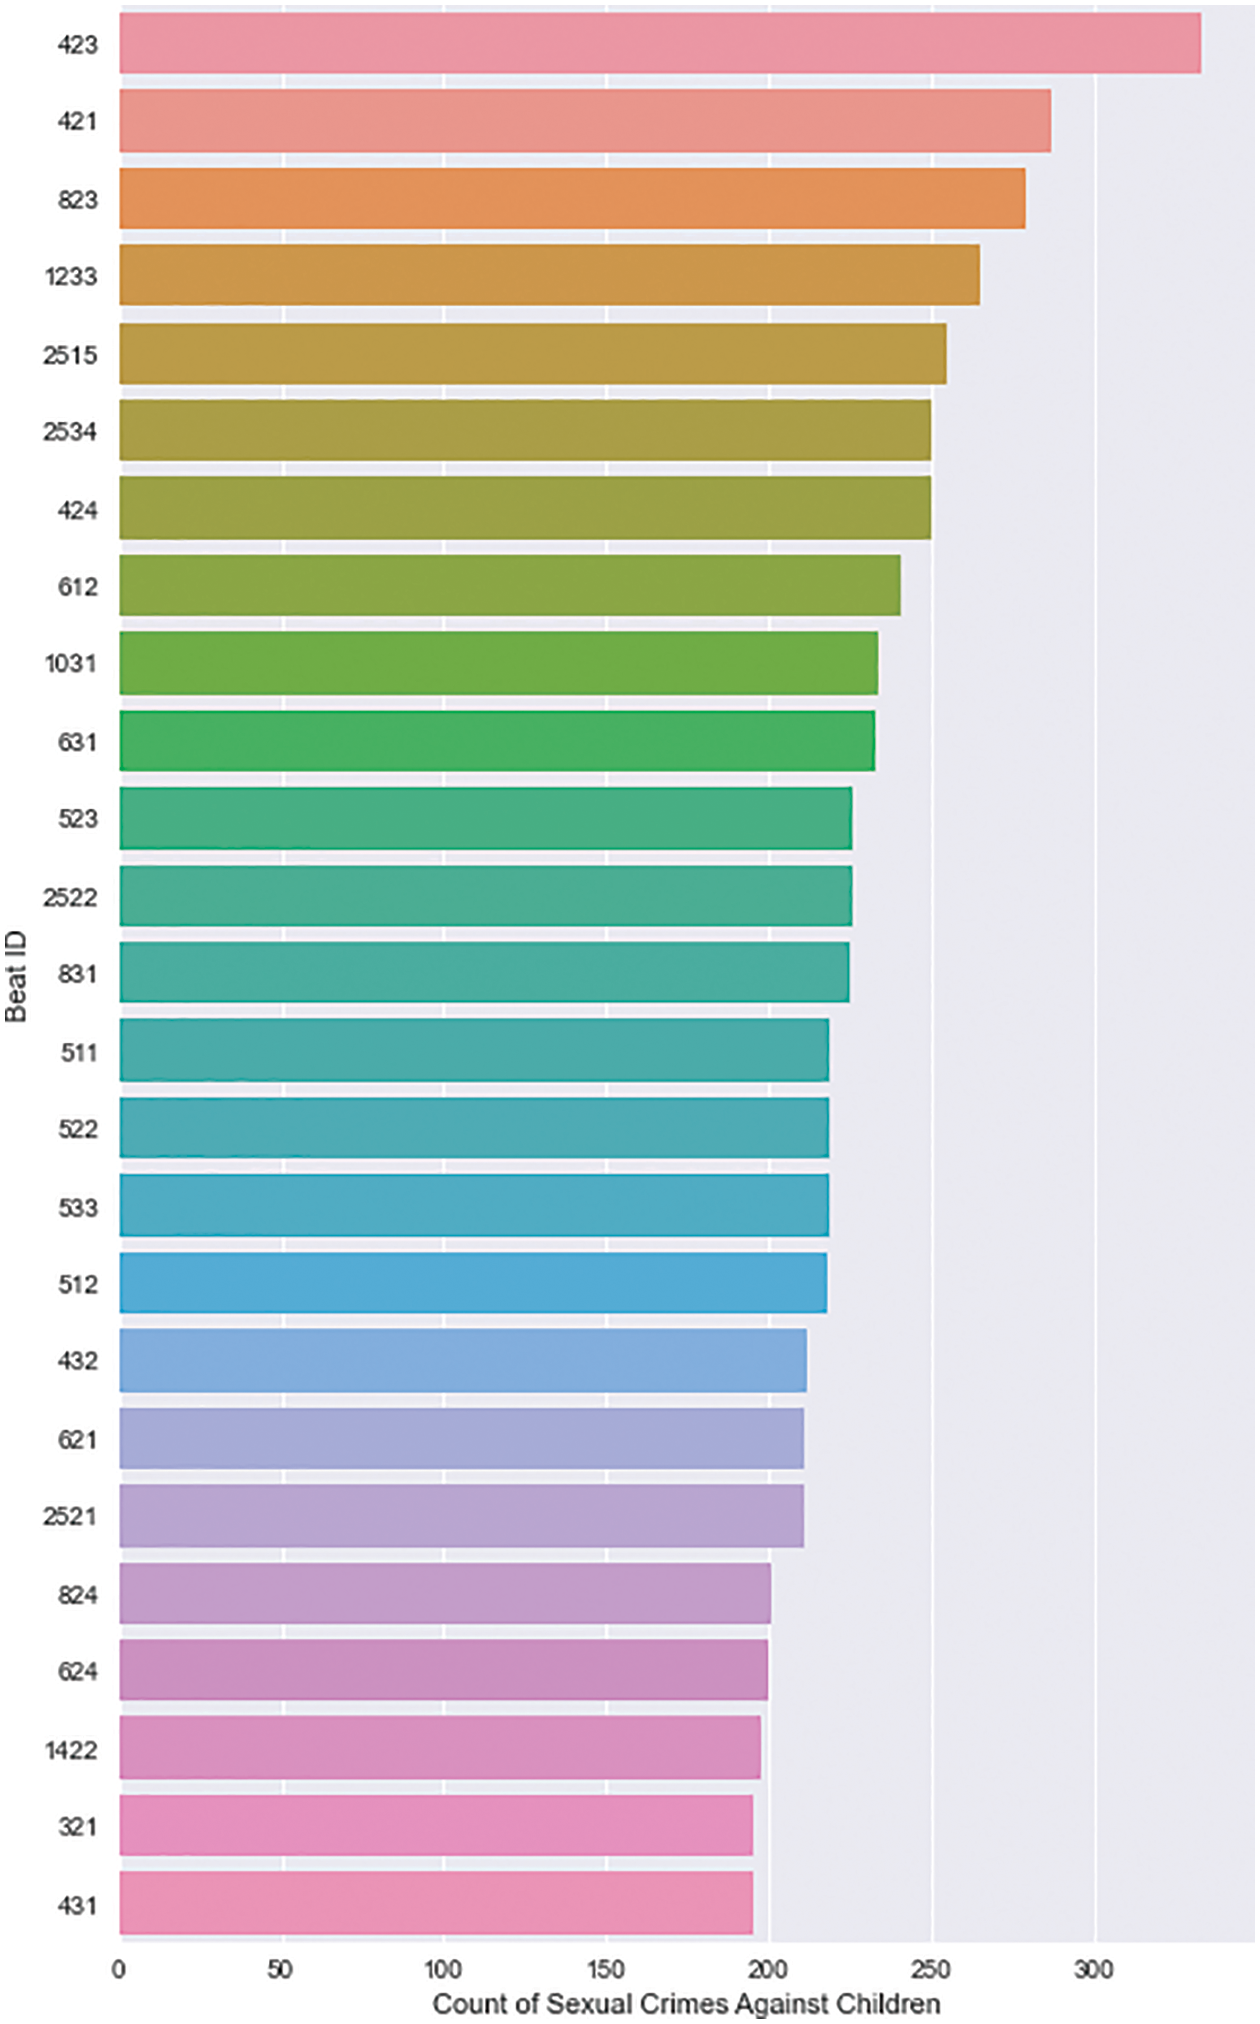
Figure 9: AAC–top 25 beats
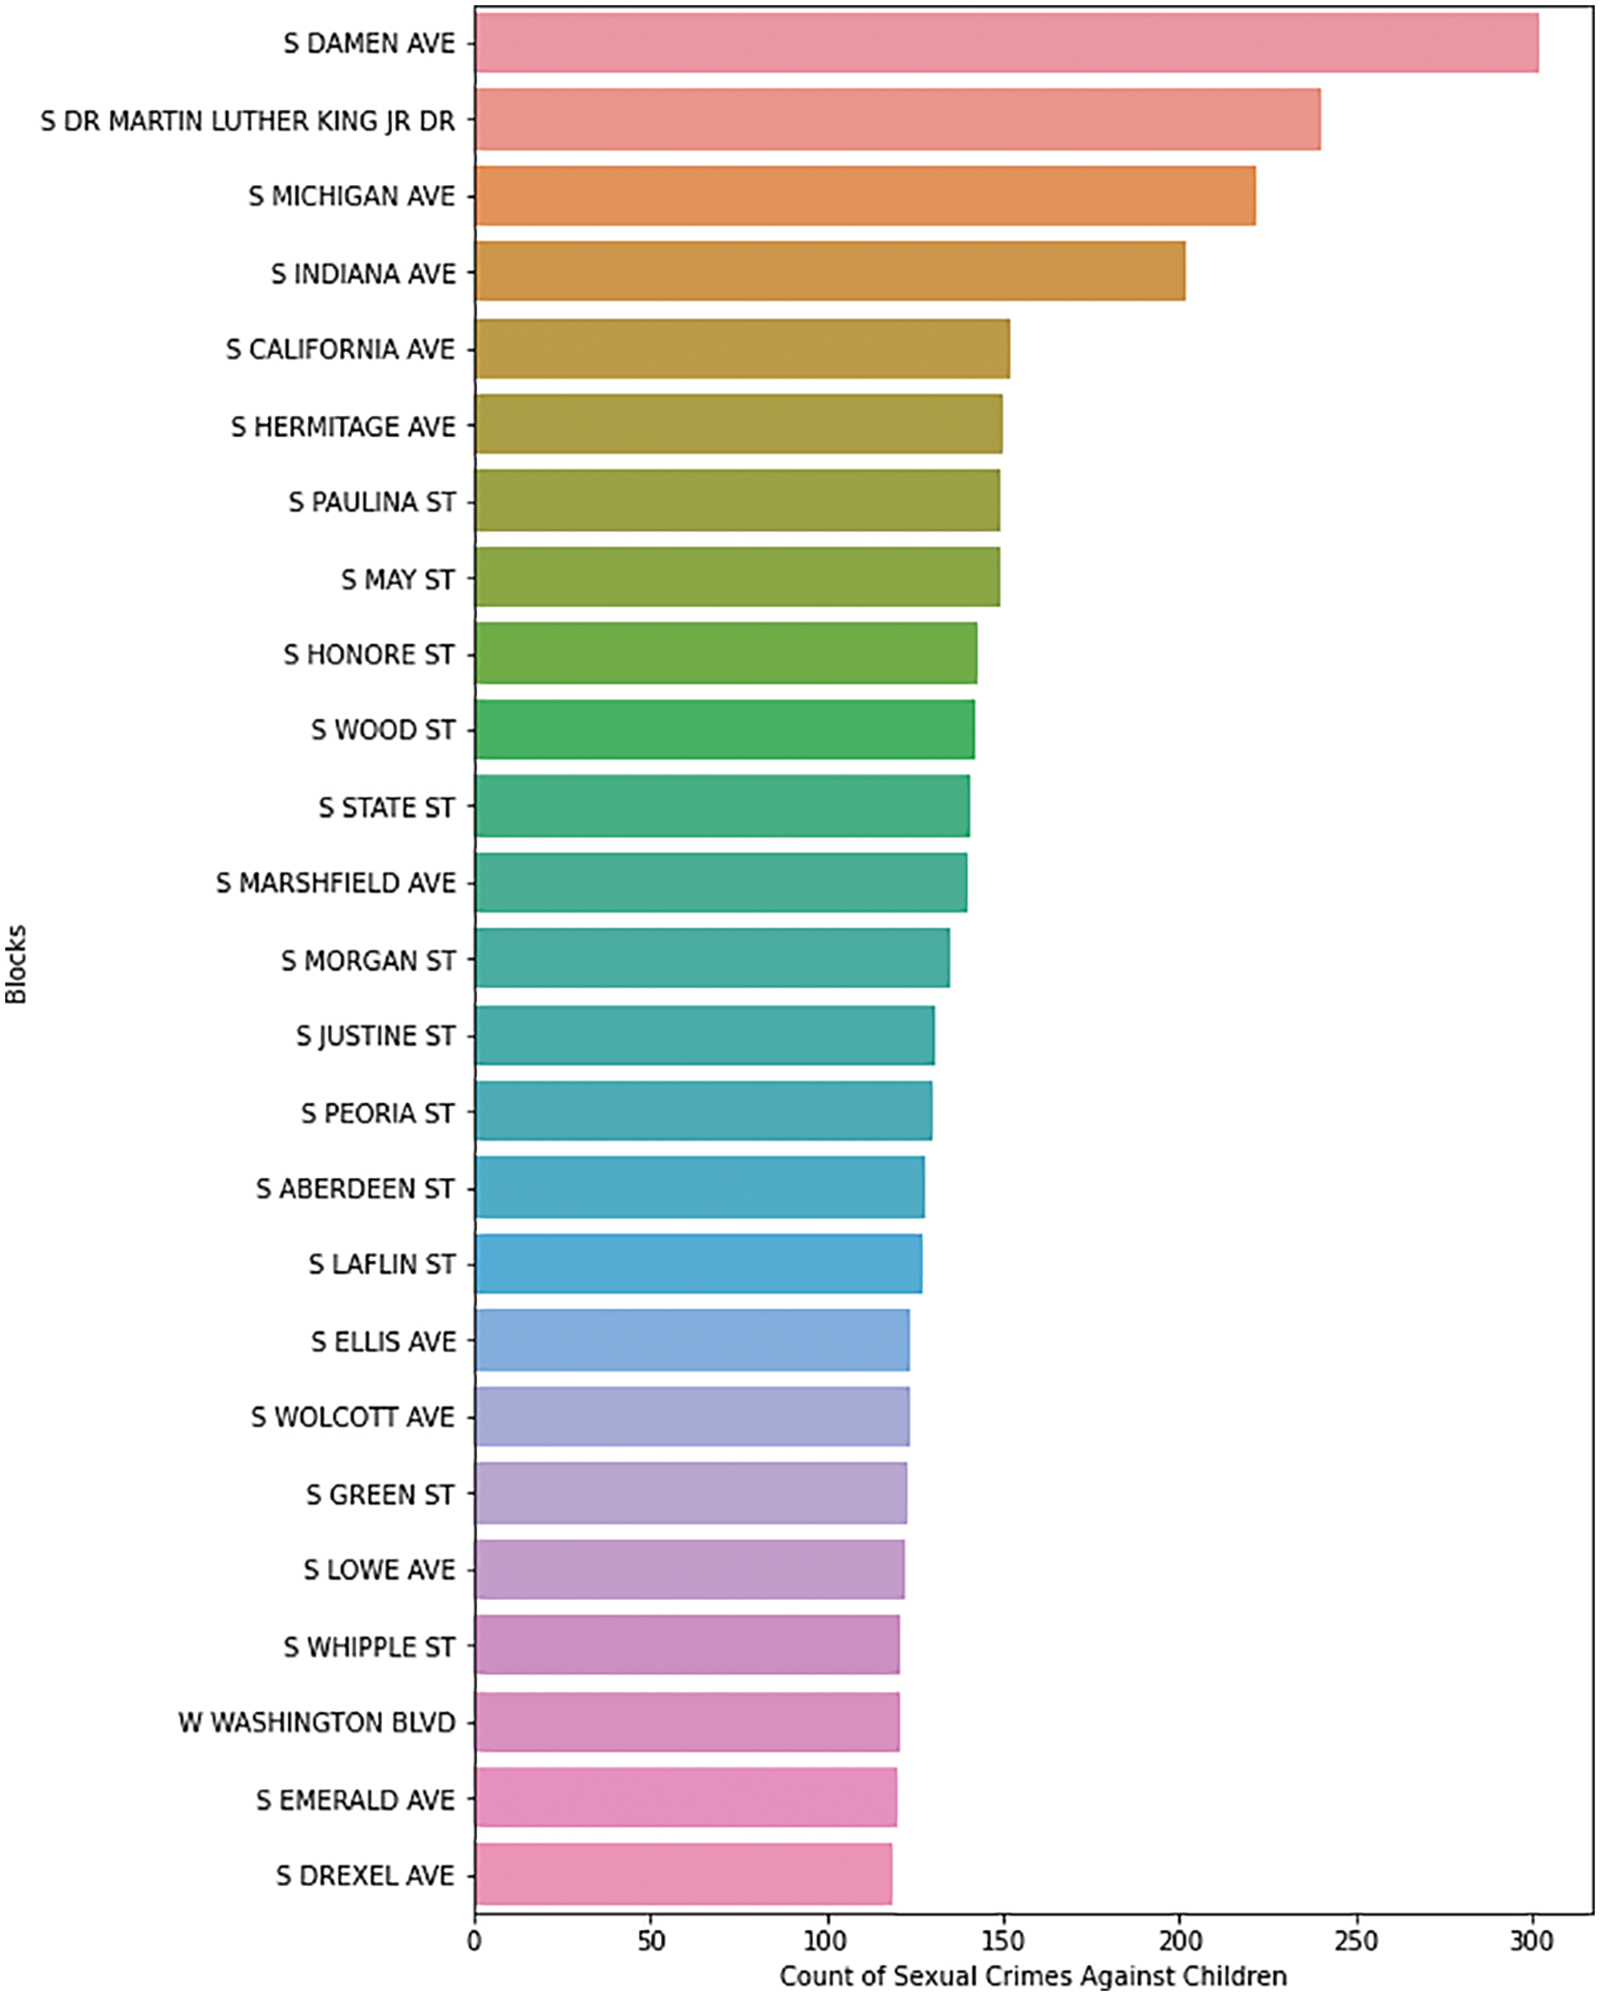
Figure 10: AAC–top 25 blocks
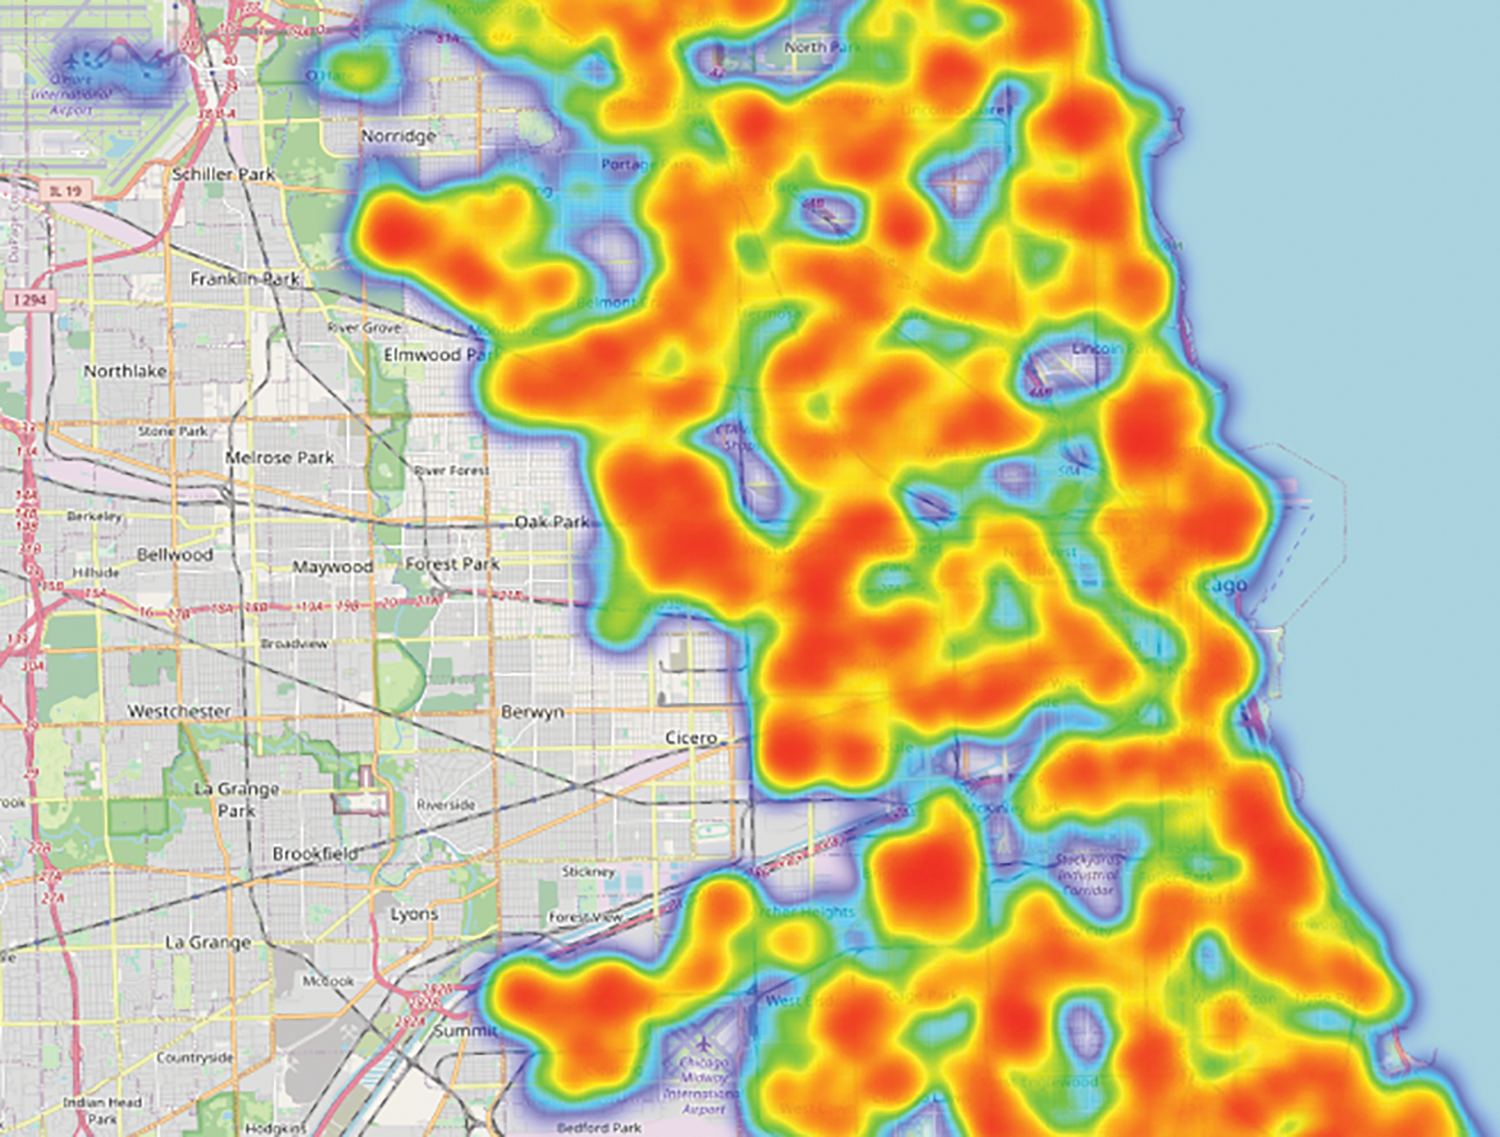
Figure 11: Heat map–AAC in Chicago
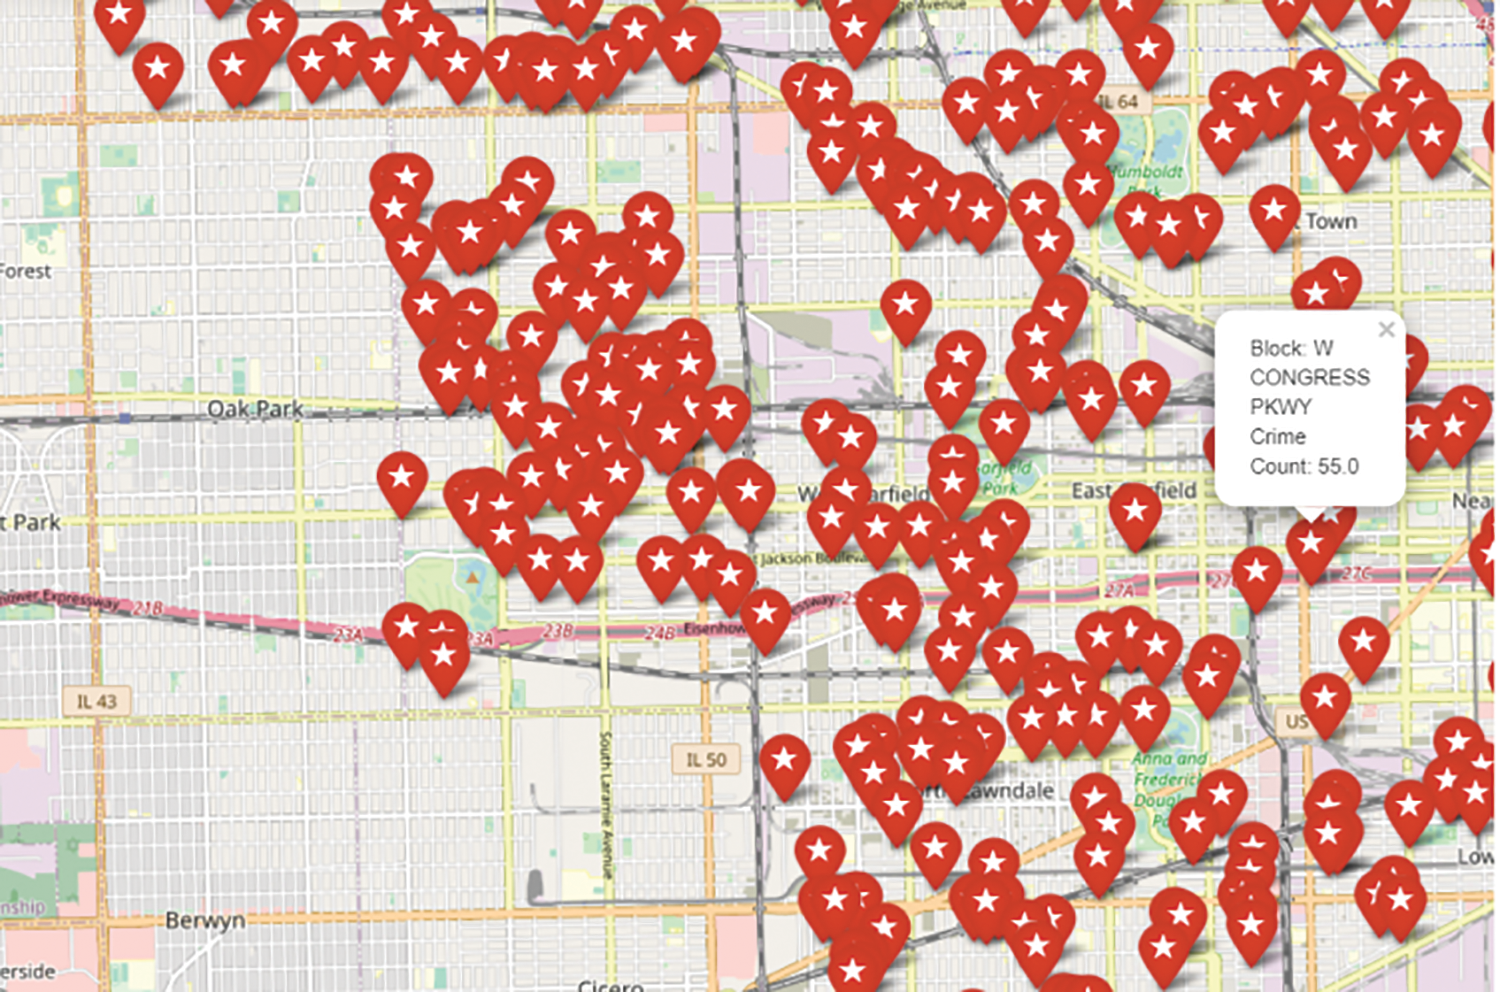
Figure 12: Incident map–AAC in Chicago
The most common types of crimes against children in Chicago are child pornography (4.7%), sexual assault of a child by a family member (6%), criminal sexual abuse by a family member (8.4%), aggravated sexual assault of a child by a family member (12.7%), aggravated criminal sexual abuse by a family member (14.9%), and child abuse (53.3%) (Refer to Fig. 13). According to Figs. 14 and 15, domestic violence (54%) is more common than non-domestic offences (46%), and such heinous crimes resulted in far fewer arrests (22.4%). Child abuse could have been committed by an unknown individual, resulting in fewer arrests (Refer to Fig. 16). However, the proportion of family members arrested for sexual crimes against children is also low.
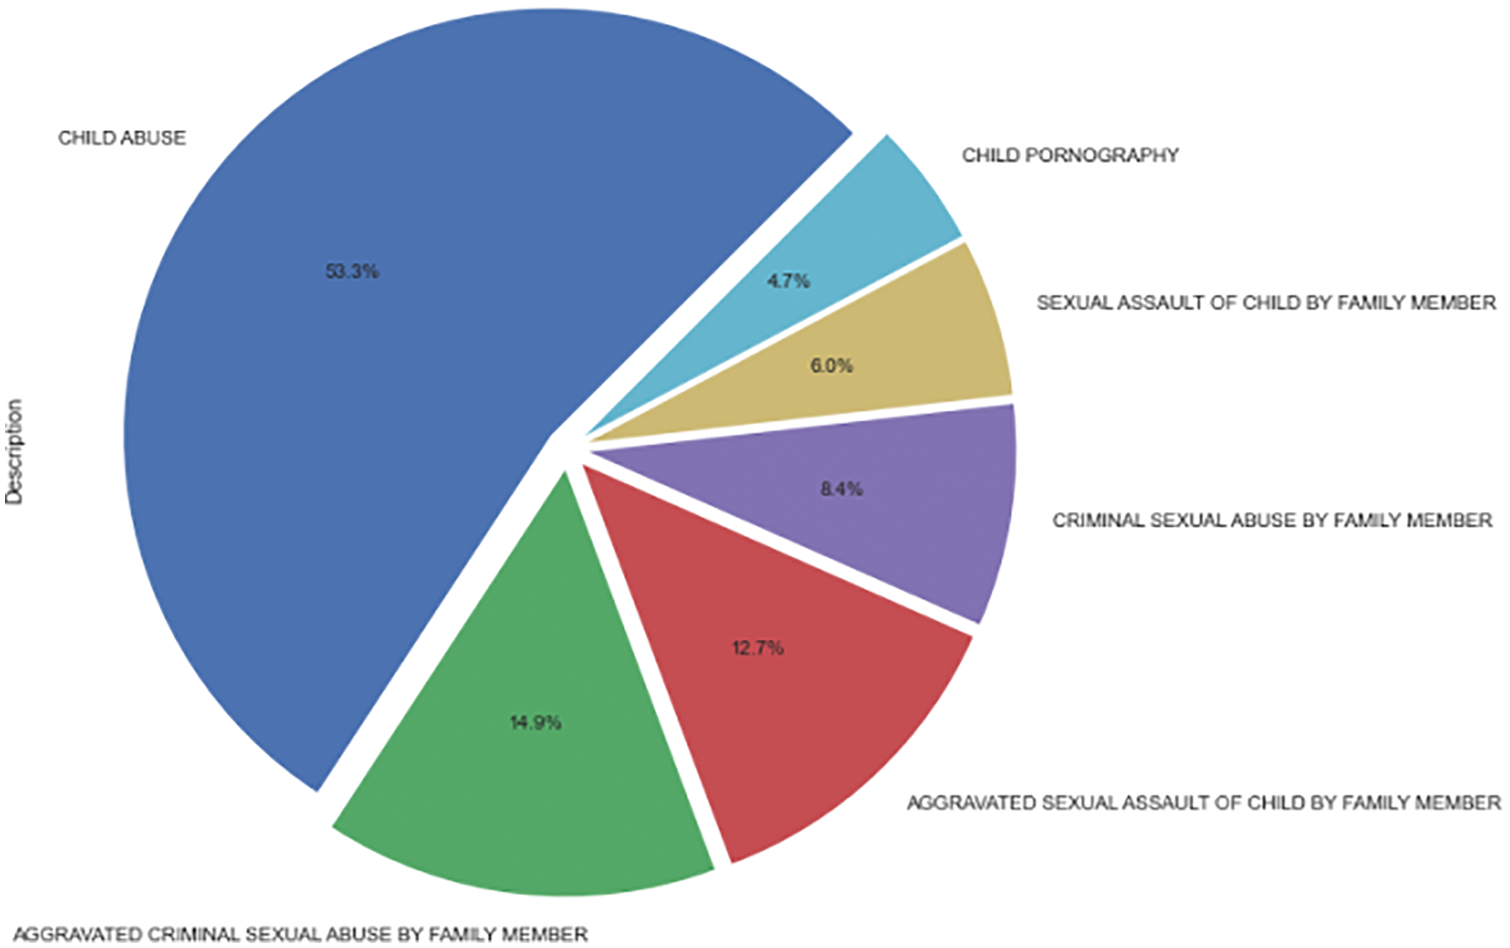
Figure 13: AAC–types of crimes
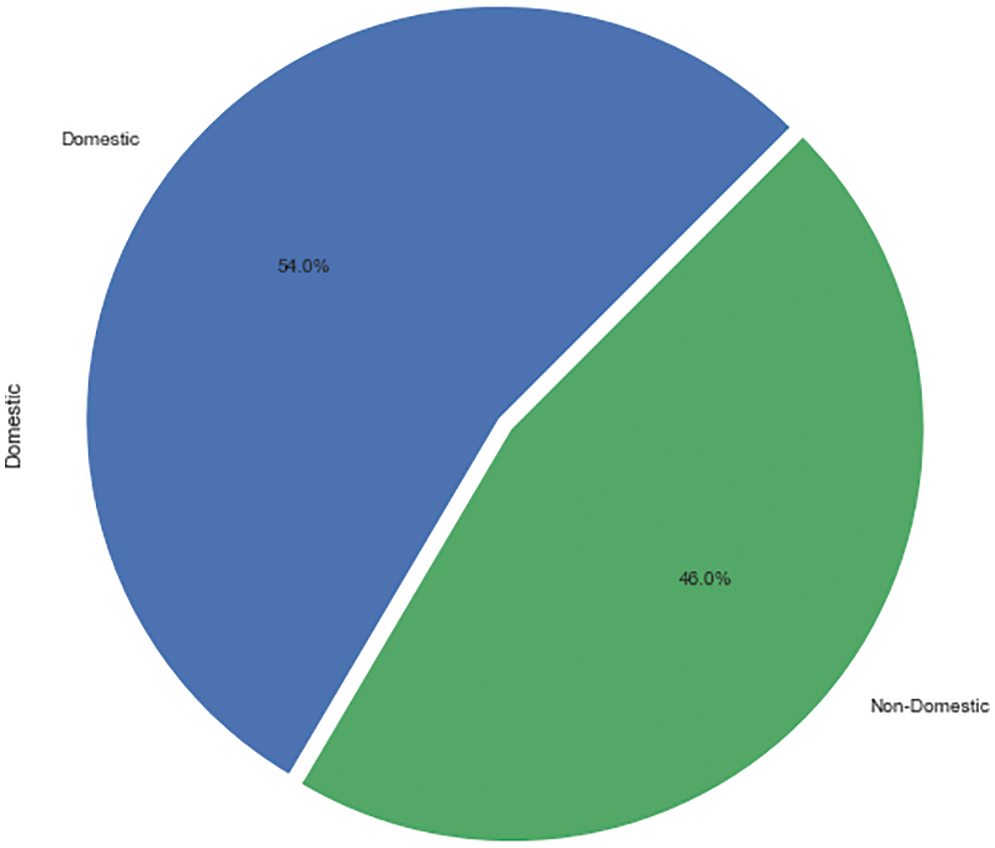
Figure 14: AAC–domestic vs. non-domestic
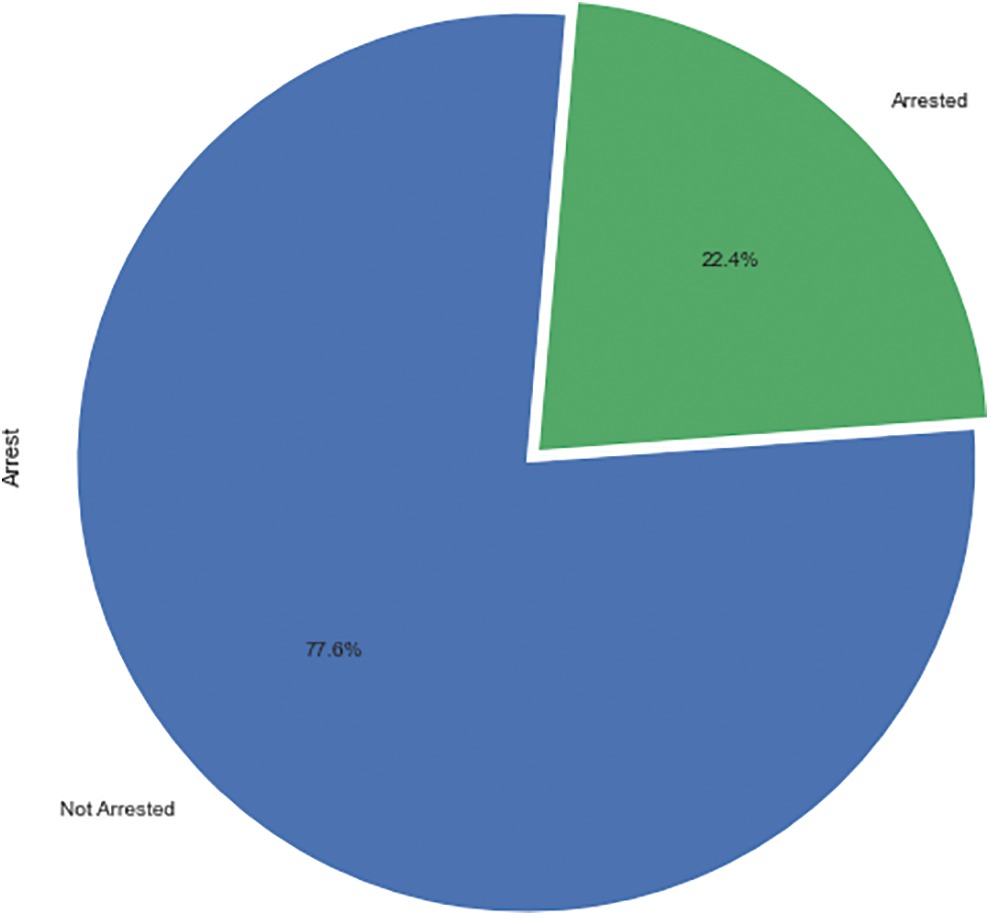
Figure 15: AAC–arrest status
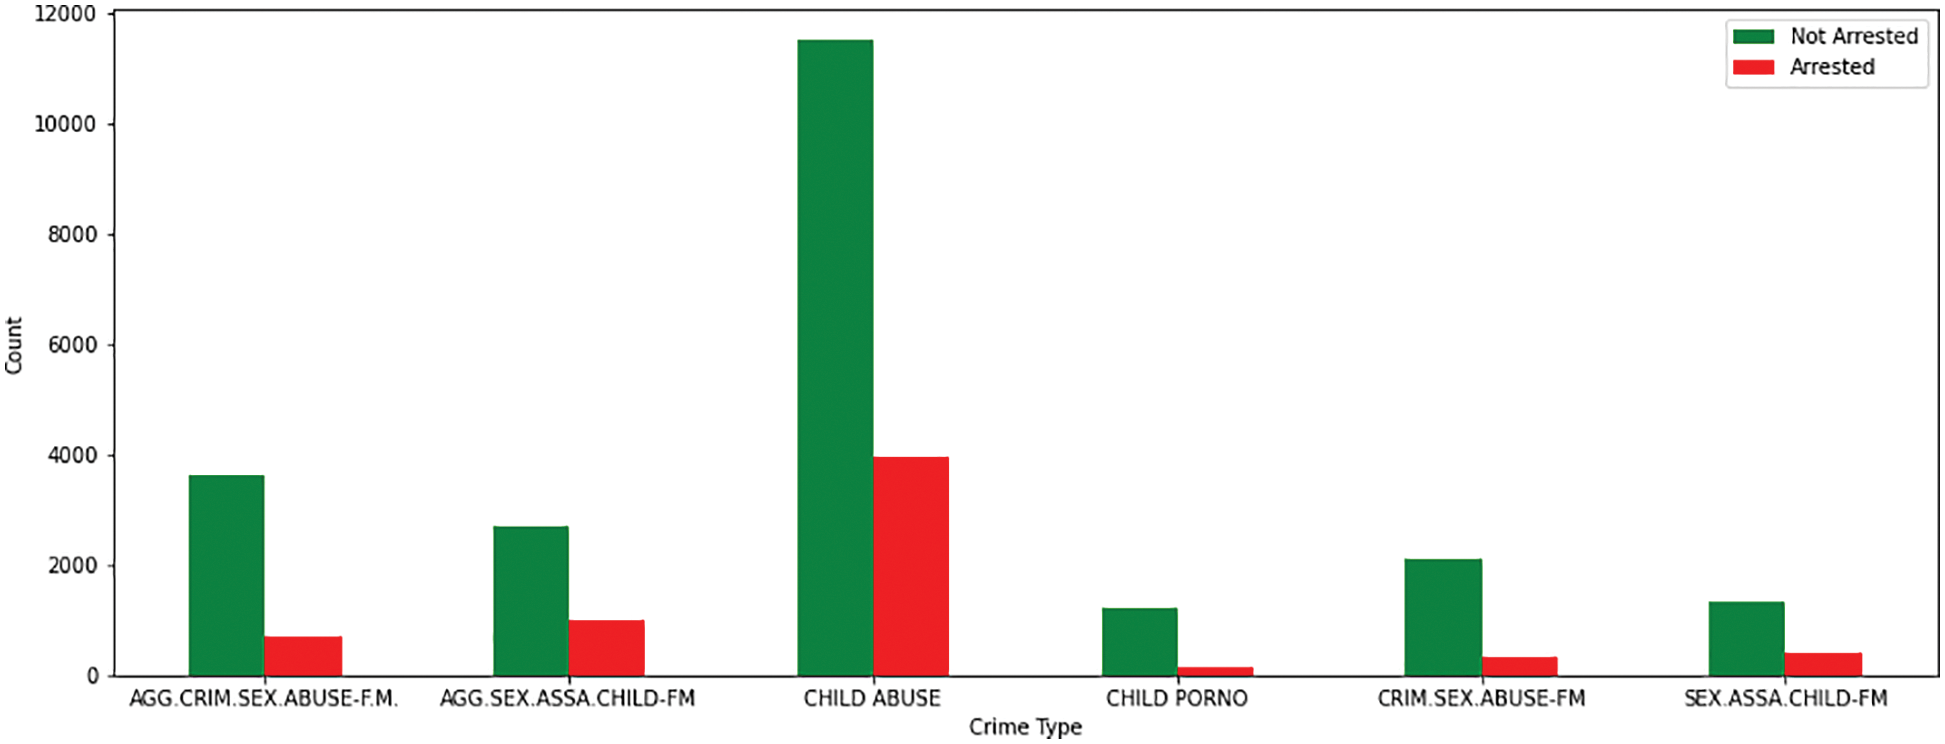
Figure 16: AAC–types of crimes vs. arrest
5 Proposed Approach and Results
Fig. 17 depicted the visual representation of the proposed methodology. The AAC-DP Crime Data set contains the following features: location, block, beat, district, latitude, longitude, year, month, day, time, and IUCR. The categorized IUCR column was designated as a dependent variable, while the first ten attributes were classified as independent variables. Because the features contain a wide range of information, they were standardized by the Pandas library. In this method, each data point was subtracted from the mean and then divided by the standard deviation, yielding the standardized data set (Refer to Eq. (1)). By standardizing the data set, the features are transformed into a similar scale which reduced the prediction bios.
xnew–> Standardized value
x–> observed value
μ–> mean of the sample
σ–> standard deviation of the sample
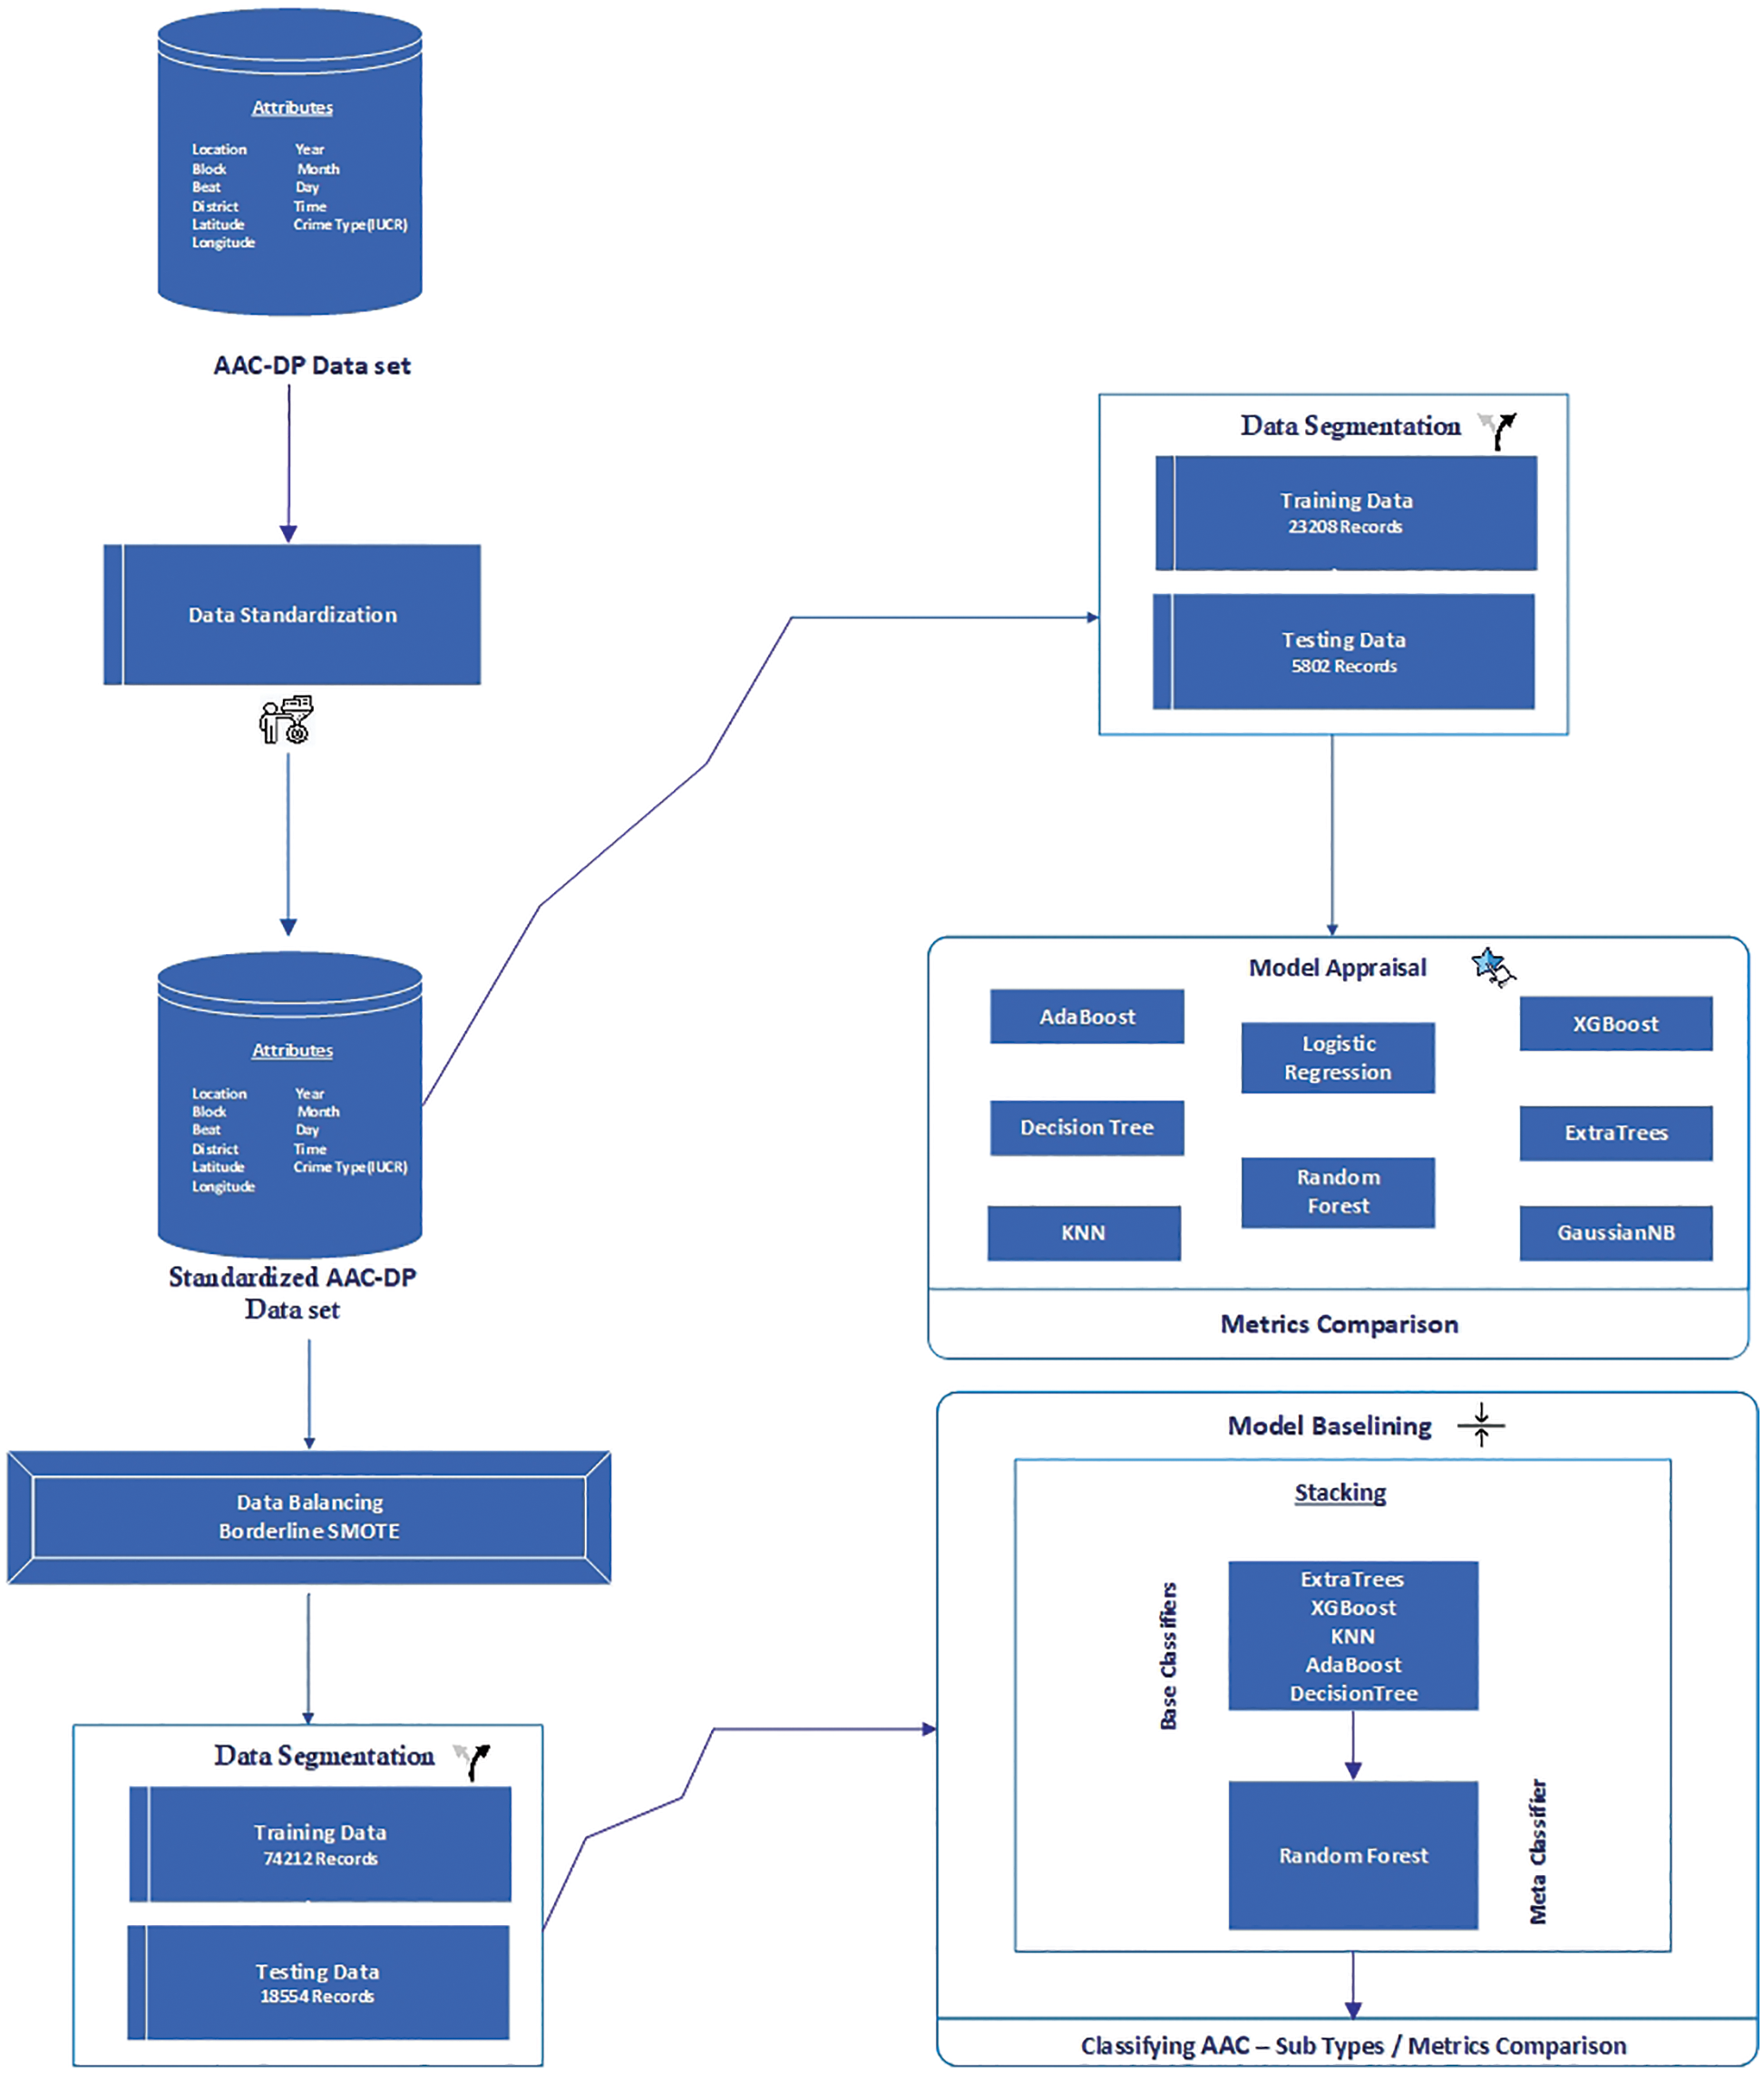
Figure 17: Phase II–flow diagram of proposed approach
The data set was then split into two sections: training and testing, with the former accounting for 80% of the total. At the end, it had 23208 rows of training data and 5802 rows of testing data. In this paper, well-known state-of-the-art models were used to predict AAC subtypes [45,46]. These models include Naive Bayes, Logistic regression, Random Forest, KNN, Decision Tree, Adaboost, XGBoost, and Extra Trees. Particularly, tree-based models were utilized because they could accommodate multidimensional attributes and observations. They also perform exceptionally well when the data contains both quantitative and categorical variables [47,48].
Accuracy (ACC), Precision, Recall, F1-score, and Area Under the Curve (AUC) are commonly used metrics for classification problems [49]. The accuracy of the model depicts its ability to perform the entire classification task. Precision is defined as the proportion of correctly predicted positive observations to all predicted positive observations. The ratio of accurately predicted positive observations to all observations in the actual class is referred to as recall. The F1-Score is calculated as the weighted average of Precision and Recall. The Area Under the Curve (AUC) is a measure of a classifier’s ability to distinguish between classes. Elapsed time was also considered to determine the model’s responsiveness. These metrics are listed in Eqs. (2) to (7).
Where
Table 3 depicts the outcomes of the appraised models. XGBoost model outperformed the others, by achieving 59% accuracy, 41% of precision, 31% of recall, and 31% of F1-Score. It also resulted in a higher AUC (0.6986) and a longer run time (10.43 s) when compared to others. Even though the Extra Trees and Random Forest models produced similar results, Extra Trees is much faster than Random Forest. Adaboost, Logistic Regression, GaussianNB, and KNN models predicted crime subtypes moderately. The Decision Tree model underperformed, with a lower accuracy (44%). GaussianNB was the fastest model in terms of runtime (0.01 s). When compared to the performance of prediction models proposed by other researchers [50,51], the XGBoost model performed mediocrely. The data set is referred to as an imbalanced data set since the number of observations in the target classes varies significantly. The algorithms would assign biased weightage to the same because one class outnumbers the other in terms of quantity. It would influence the algorithms’ performance, resulting in poor outcomes [52,53].
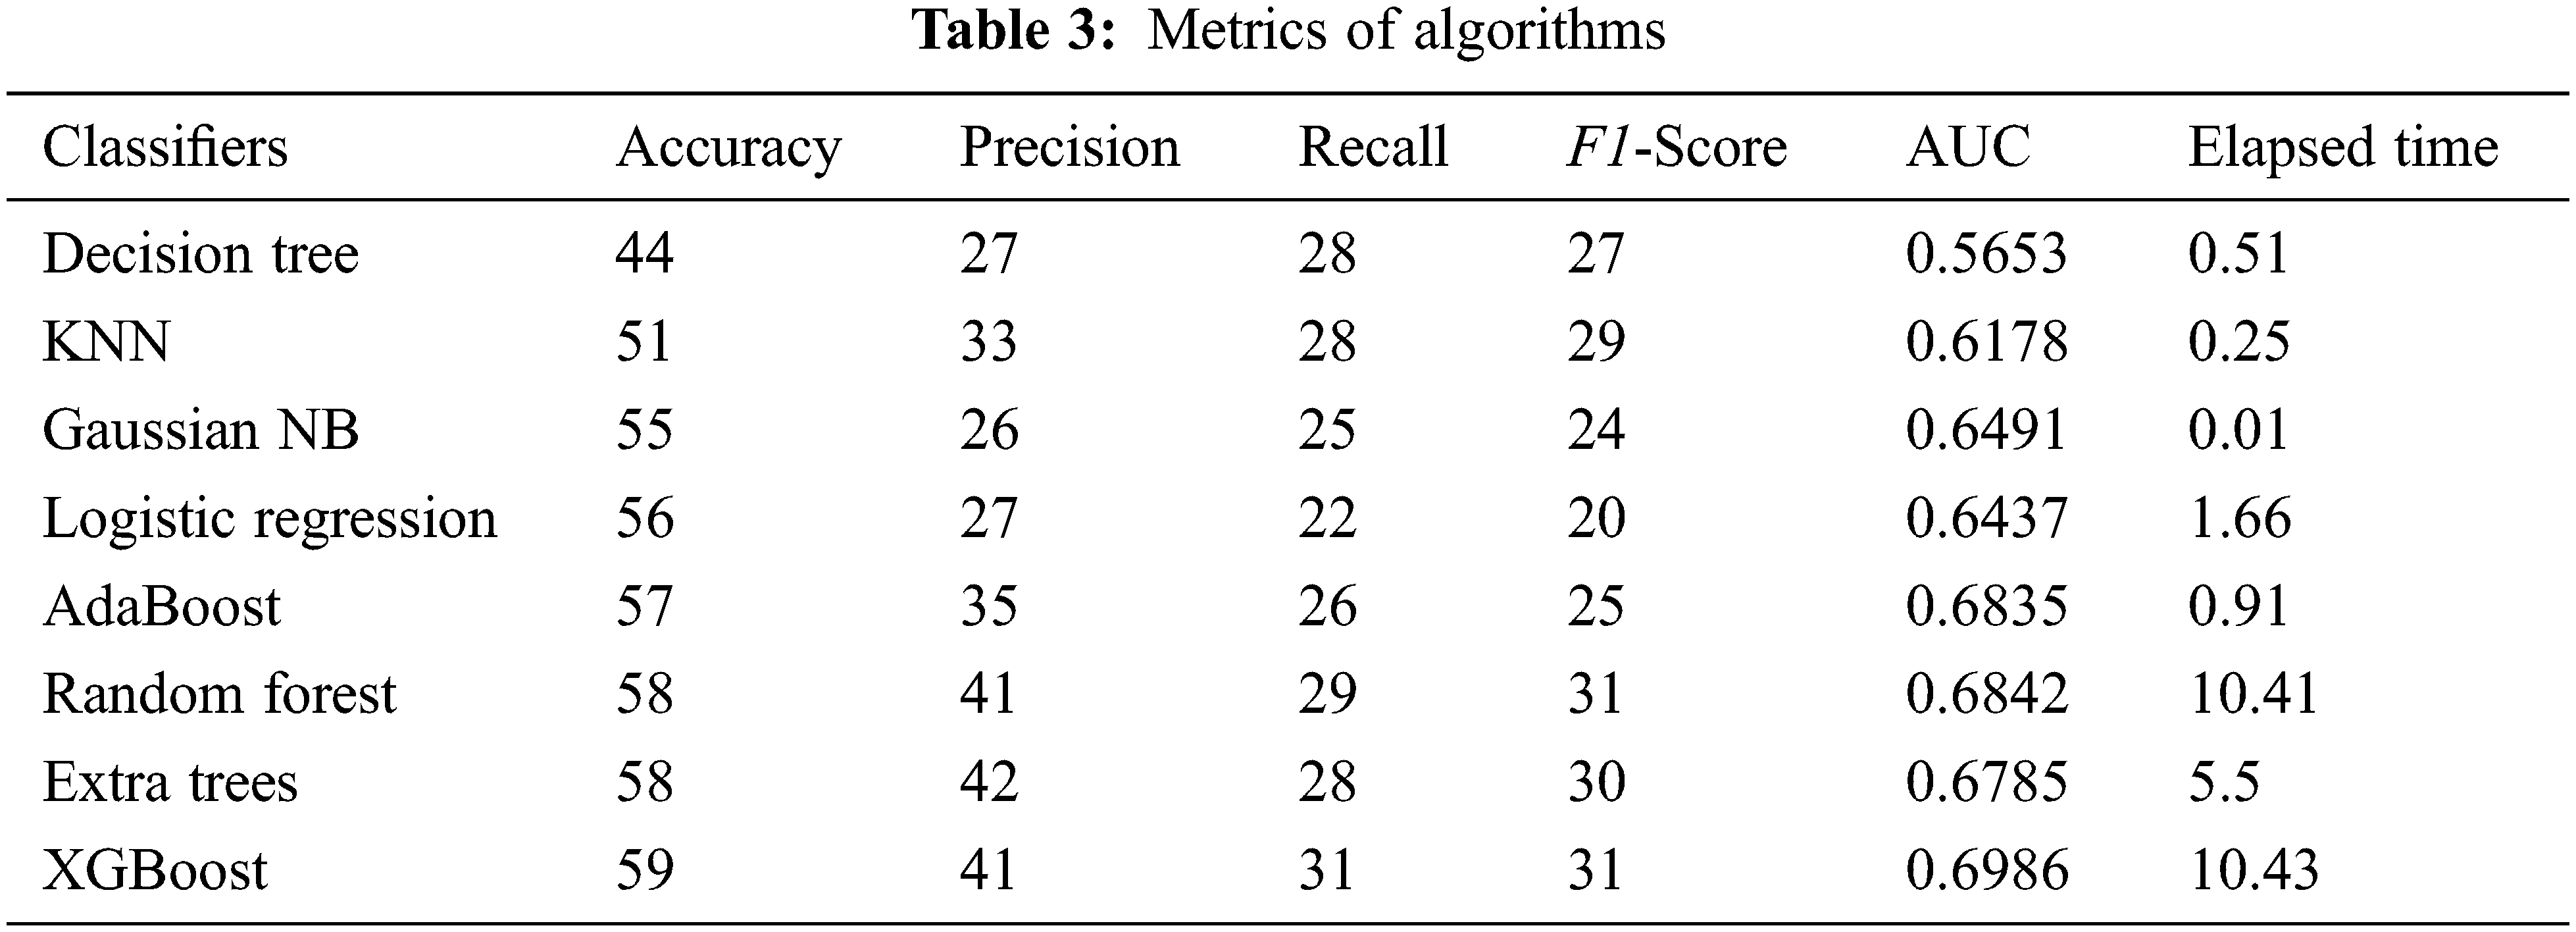
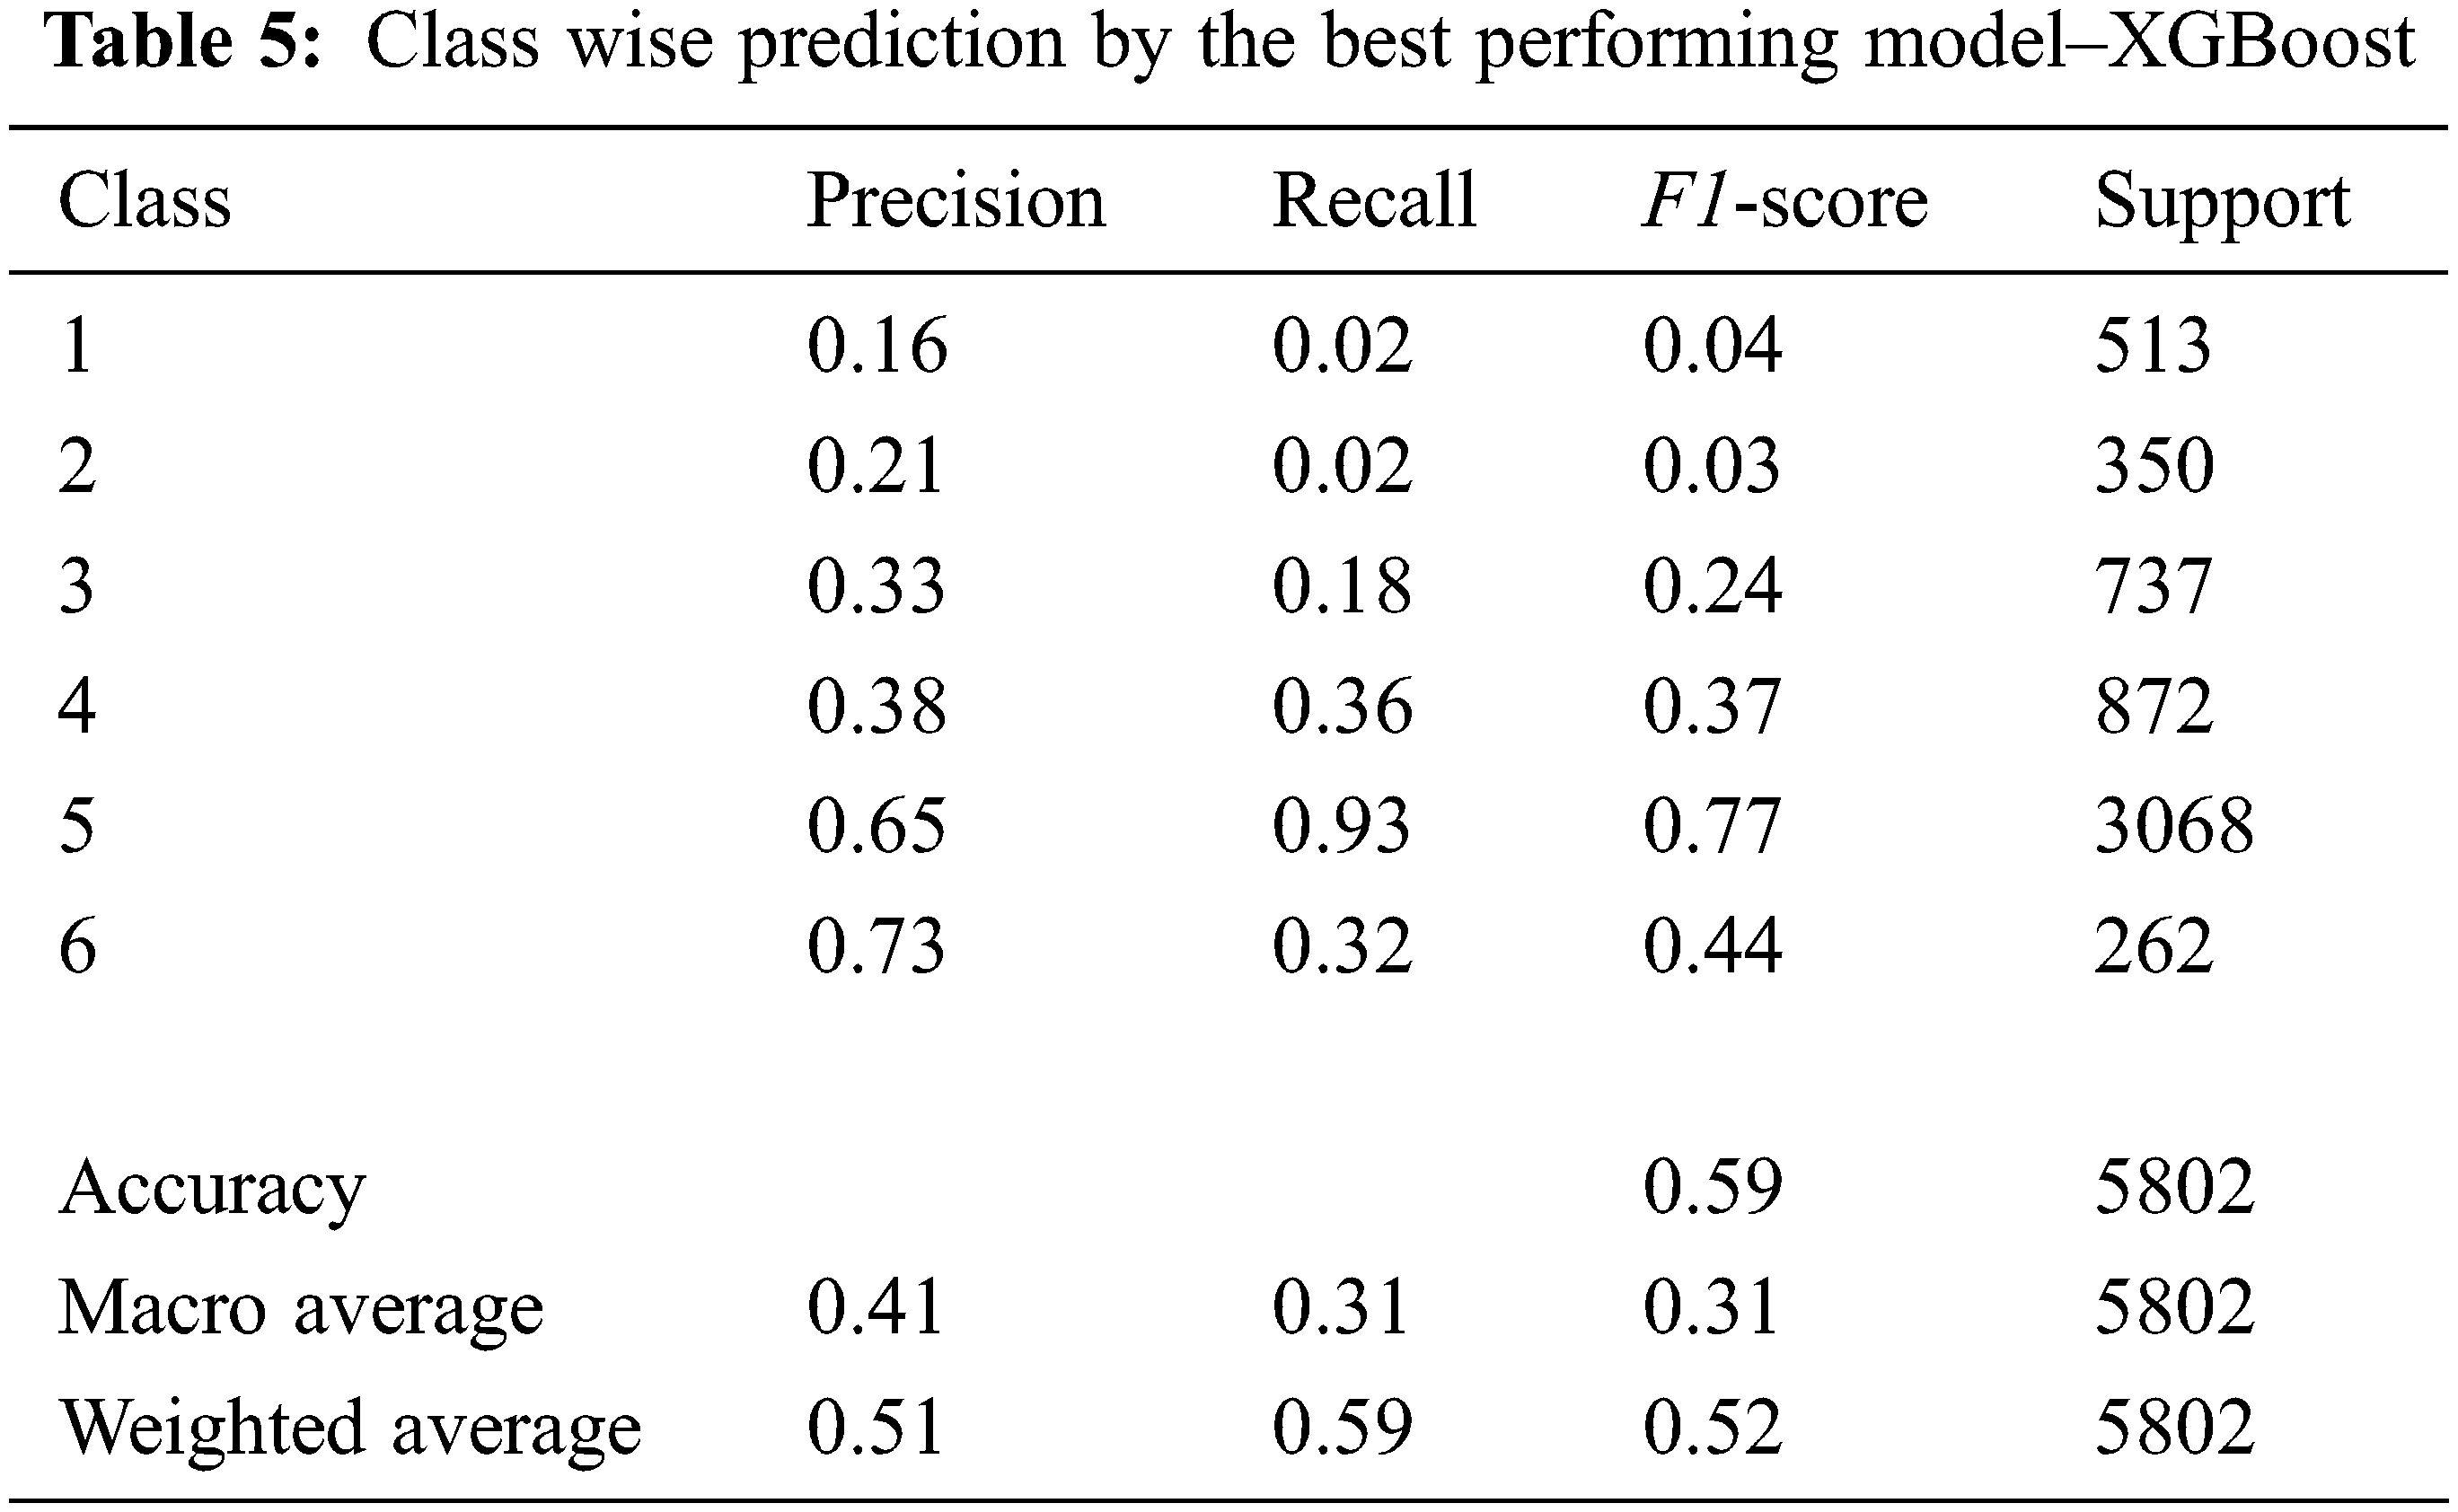
Table 4 depicts a stark disparity between the target variable classes, indicating that the incidence of child abuse is disproportionately high in comparison to other categories. Table 5 shows that the XGBoost model accurately predicted the majority class, but it underperformed when predicting the minority classes. The use of sampling techniques could be a way to solve this problem. Under-sampling would remove a large portion of the original data, which could never be a good solution for sensitive issues like crime prediction. As a result, we addressed the issue using the Borderline Synthetic Minority Oversampling Technique (Borderline SMOTE).
5.1 Borderline Synthetic Minority Oversampling Technique (Borderline SMOTE)
SMOTE is used to balance the data set by upsampling minority classes. It separates data points into minority classes and identifies their nearest neighbors. Then a random number called ‘R’ was generated, ranging from 0 to 1. The distance between the nearest points is multiplied by the ‘R’ value and added to the primary point. The newly calculated point would be added as a synthetic observation to the existing data set [54].
Example:
(x1obs, y1obs) and (x2obs, y2obs) are the two observations from minority class. The value of R ranges from 0 to 1. The synthetic values would be:
Outliers in minority classes may result in overlapping with the majority class in this approach. Borderline-SMOTE, on the other hand, ignores outliers and normal data points and only considers the border points of majority and minority classes. It would generate synthetic observations using those points as a reference. At the end of the process, the number of minority data points matched the number of majority data points [55]. It would address the issue of data imbalance and enhance the performance of Machine Learning models [56,57]. In this study, Borderline SMOTE increased the quantity of minority classes and matched them with the count of the majority class. As a result, the data set size has been increased to 92766, which is three times larger than the original data set.
Stacking, also known as stacked generalization, is an ensemble algorithm with two prediction levels. A bunch of classification models at the base level, or Level 0, and Level 1 contains a meta classifier. At the basic level, the models predict the target classes in the test data set. The output of the base classifiers would be fed into the meta classifier as an input. The meta classifier considers the bios of the base models and addresses them while predicting. It obviously reduces the error rate and improves prediction accuracy [58,59].
In the data set, X represents the independent variables and Y represents the target class. The data set was divided into two parts: training (DSTraining) and testing (DSTesting). The target classes were predicted by ‘N’ number of classifiers at Level ‘0.’ Each model’s prediction cluster would be:
As input, the above predictions would be fed into a Level ‘1’ meta classifier (AMETA). The meta classifier predicts the target classes and provides the following results:
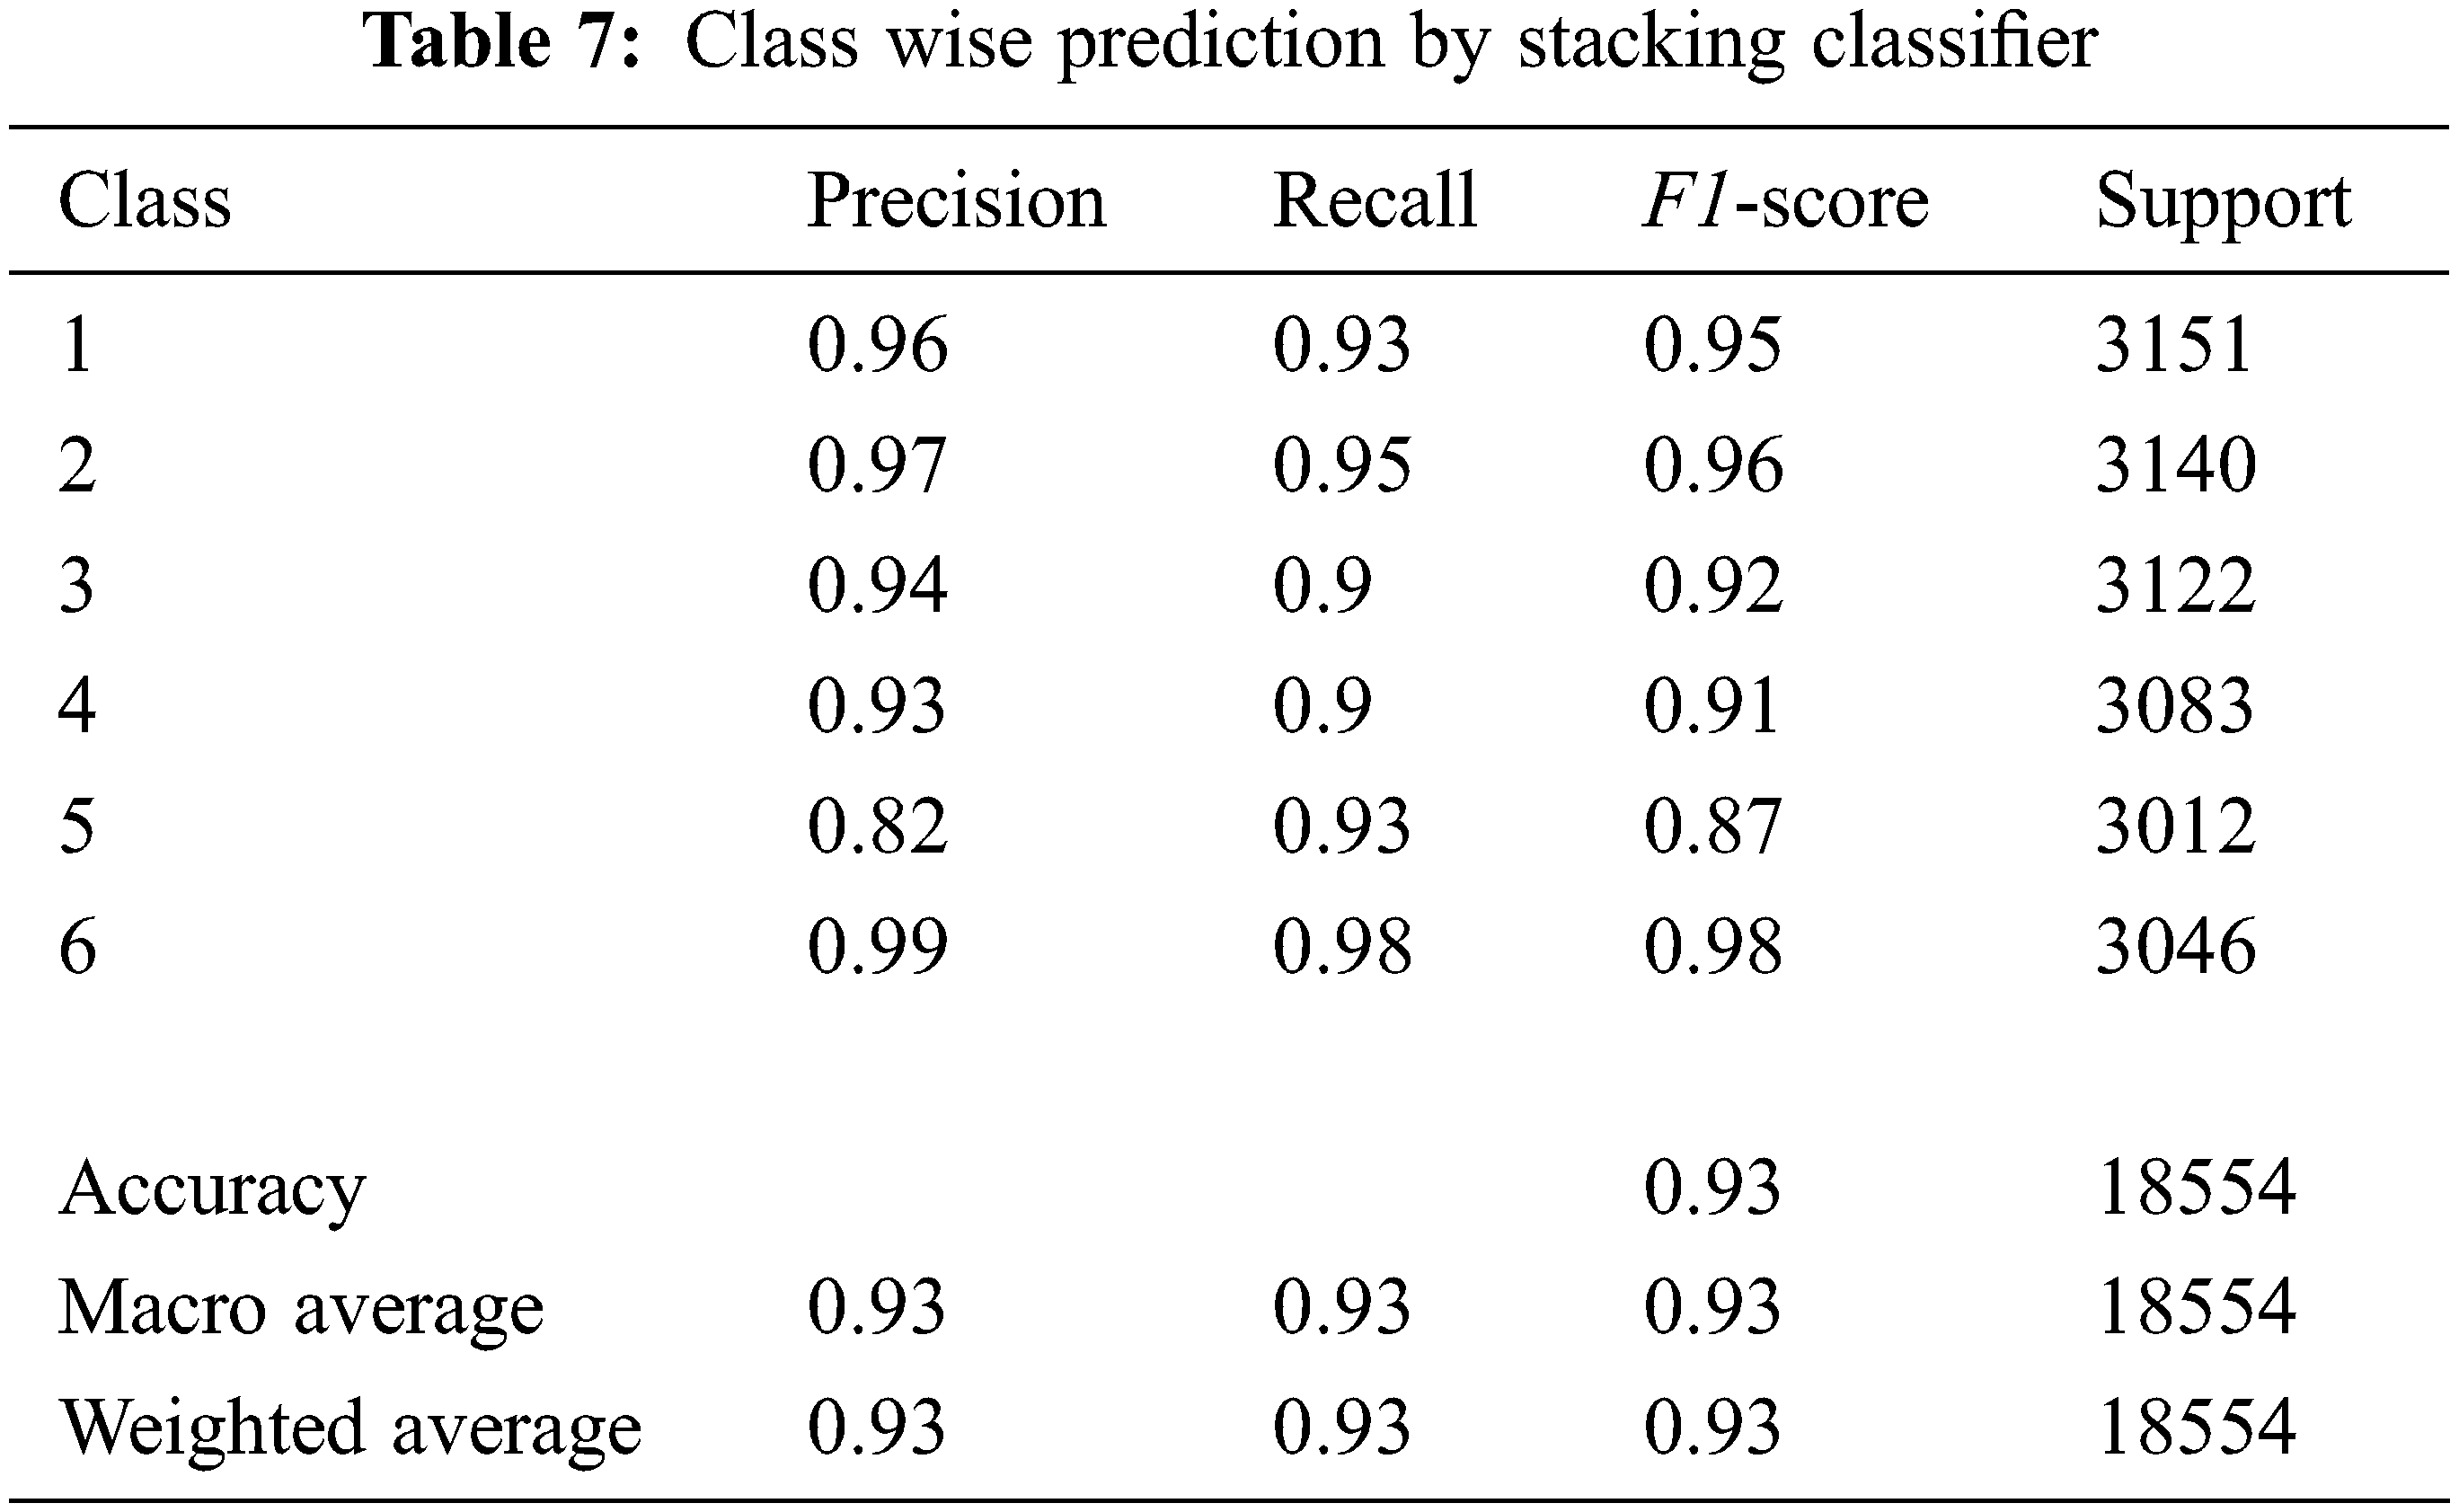
The Borderline-SMOTE balanced data set was divided into training and testing blocks in an 80:20 ratio for this study. The training set had 74212 samples, while the testing set had 18554 instances. Then, as Level ‘0’ classifiers, KNN, Decision Tree, AdaBoost, Extra Trees, and XGBoost were allocated, and Random Forest was assigned as the meta classifier. Because the prediction needed to be more reliable, the cross-validation score was set to five, and the model was evaluated. In addition, the other cutting-edge algorithms were evaluated with the same to make comparisons. Table 6 displays the results of the models that were evaluated, while Table 7 depicts the performance of the proposed model.
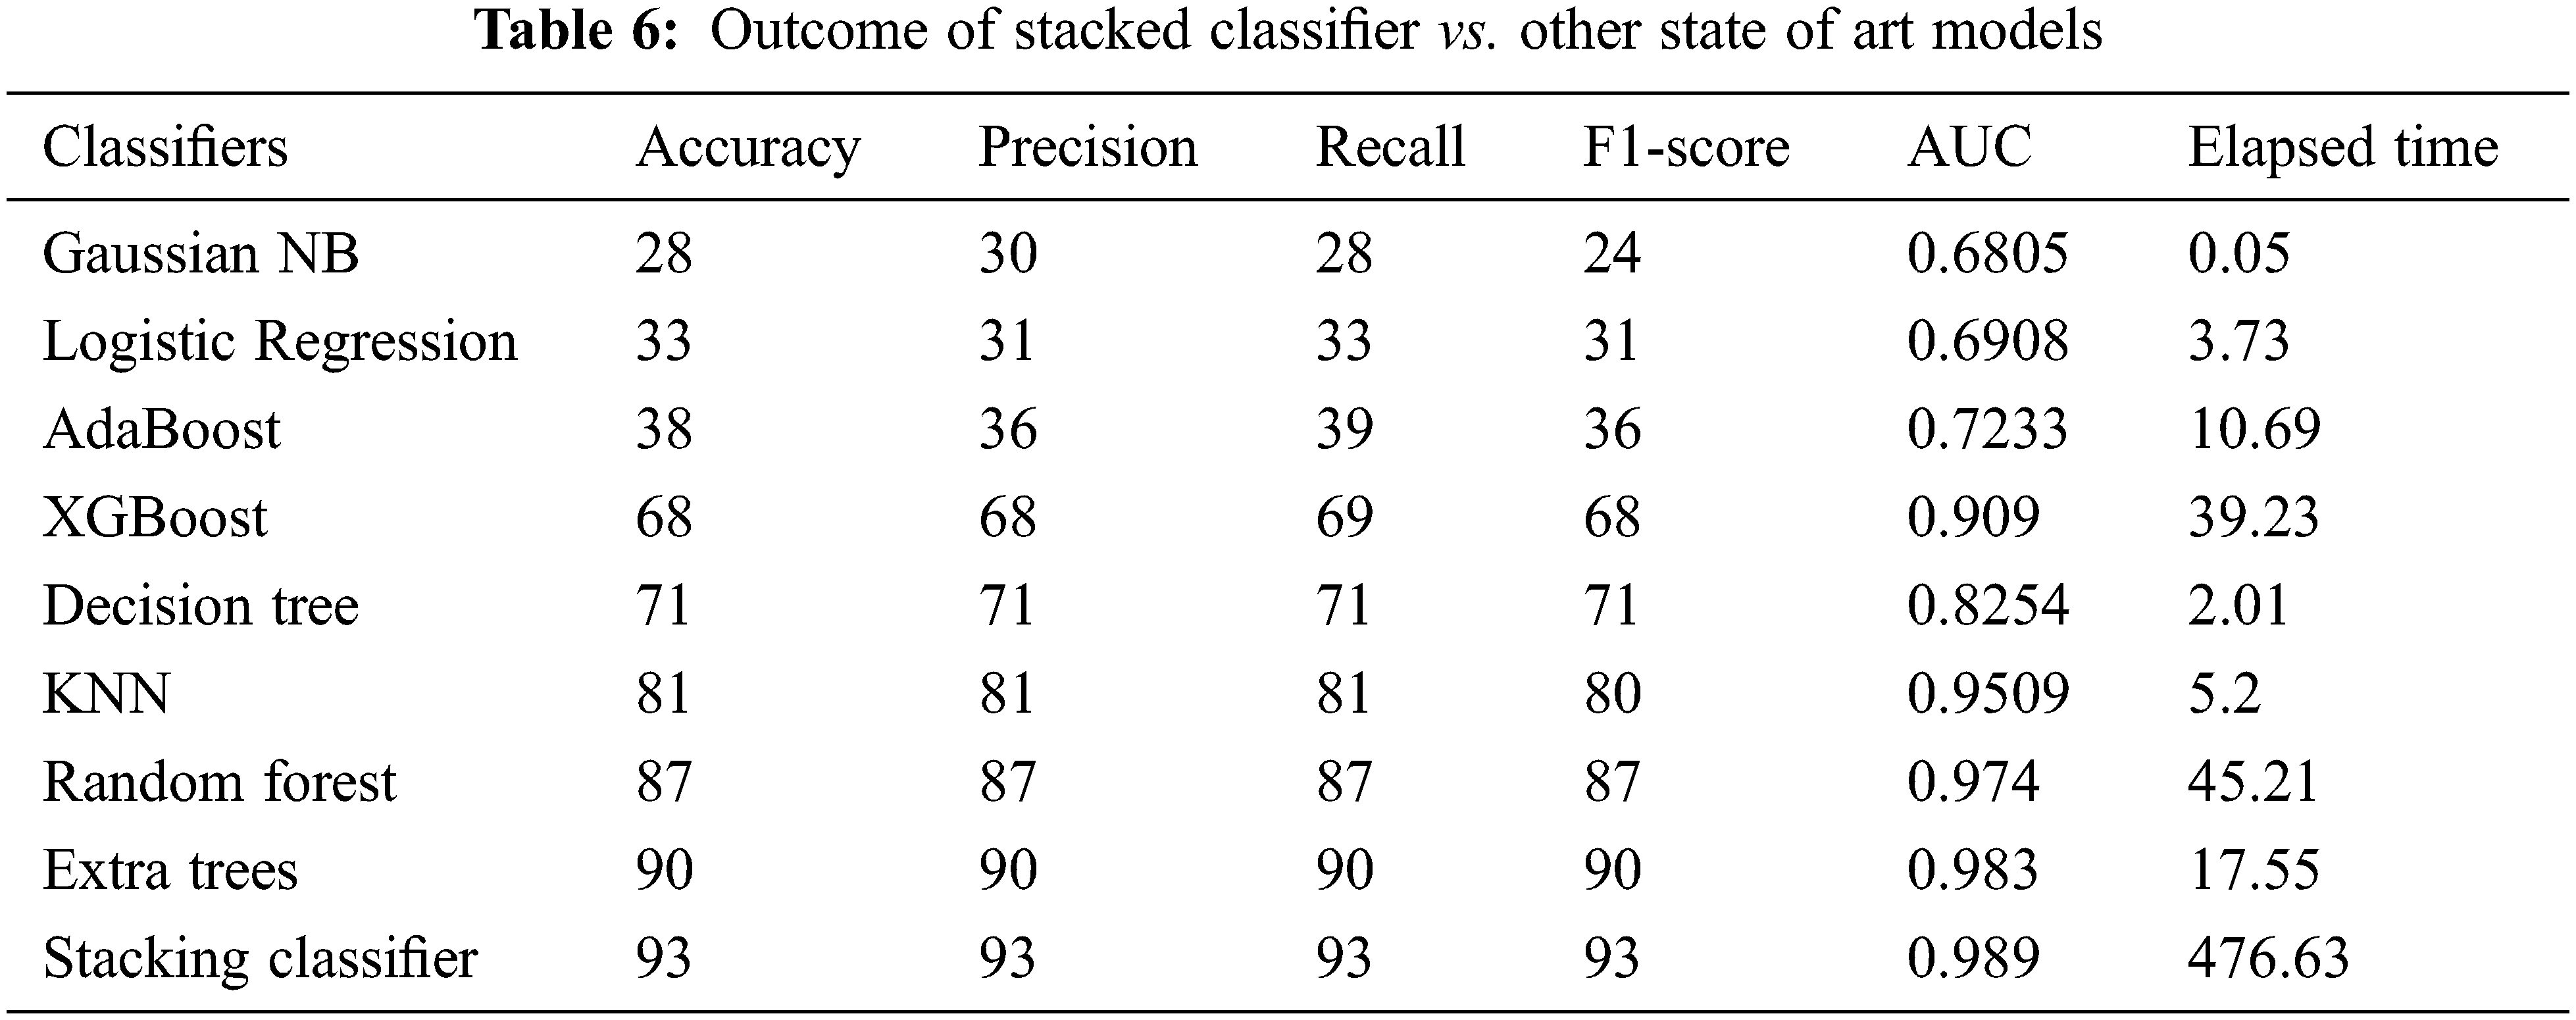
The data balancing had a negative impact on the Gaussian NB, Logistic Regression, and AdaBoost models, as shown in Fig. 18. When the accuracy of the Gaussian NB, Logistic Regression, and AdaBoost models was compared to the performance on the imbalanced data set, a significant droppage was observed. Although the precision, recall, and AUC of the Gaussian NB model improved, the F1-Score remained unchanged. Though the Logistic Regression model’s recall and F1-Score were significantly improved, precision was only slightly improved. The AdaBoost model’s recall was increased, although there was only a slight improvement in precision, which influenced the F1-Score. The remaining models’ metrics revealed that the over-sampling approach had a positive impact. Poor performers of the imbalanced data set, such as Decision Tree and KNN, performed better, with the accuracy of 71% and 81%, respectively. Along with Precision, Recall, and F1-Score, the models’ AUC values were significantly increased (Refer to Fig. 19). XGBoost, the best performer in the imbalanced data set, delivered moderate accuracy (68%). However, the AUC value (0.909) of the same was higher than the Decision Tree (0.8254). The Random Forest outperforms the other models in terms of Accuracy, Precision, Recall, F1-Score, and AUC (0.974). The Extra Trees model delivered 90% Accuracy, Precision, Recall, F1-Score, and AUC value (0.983), making it the second-best model among all.
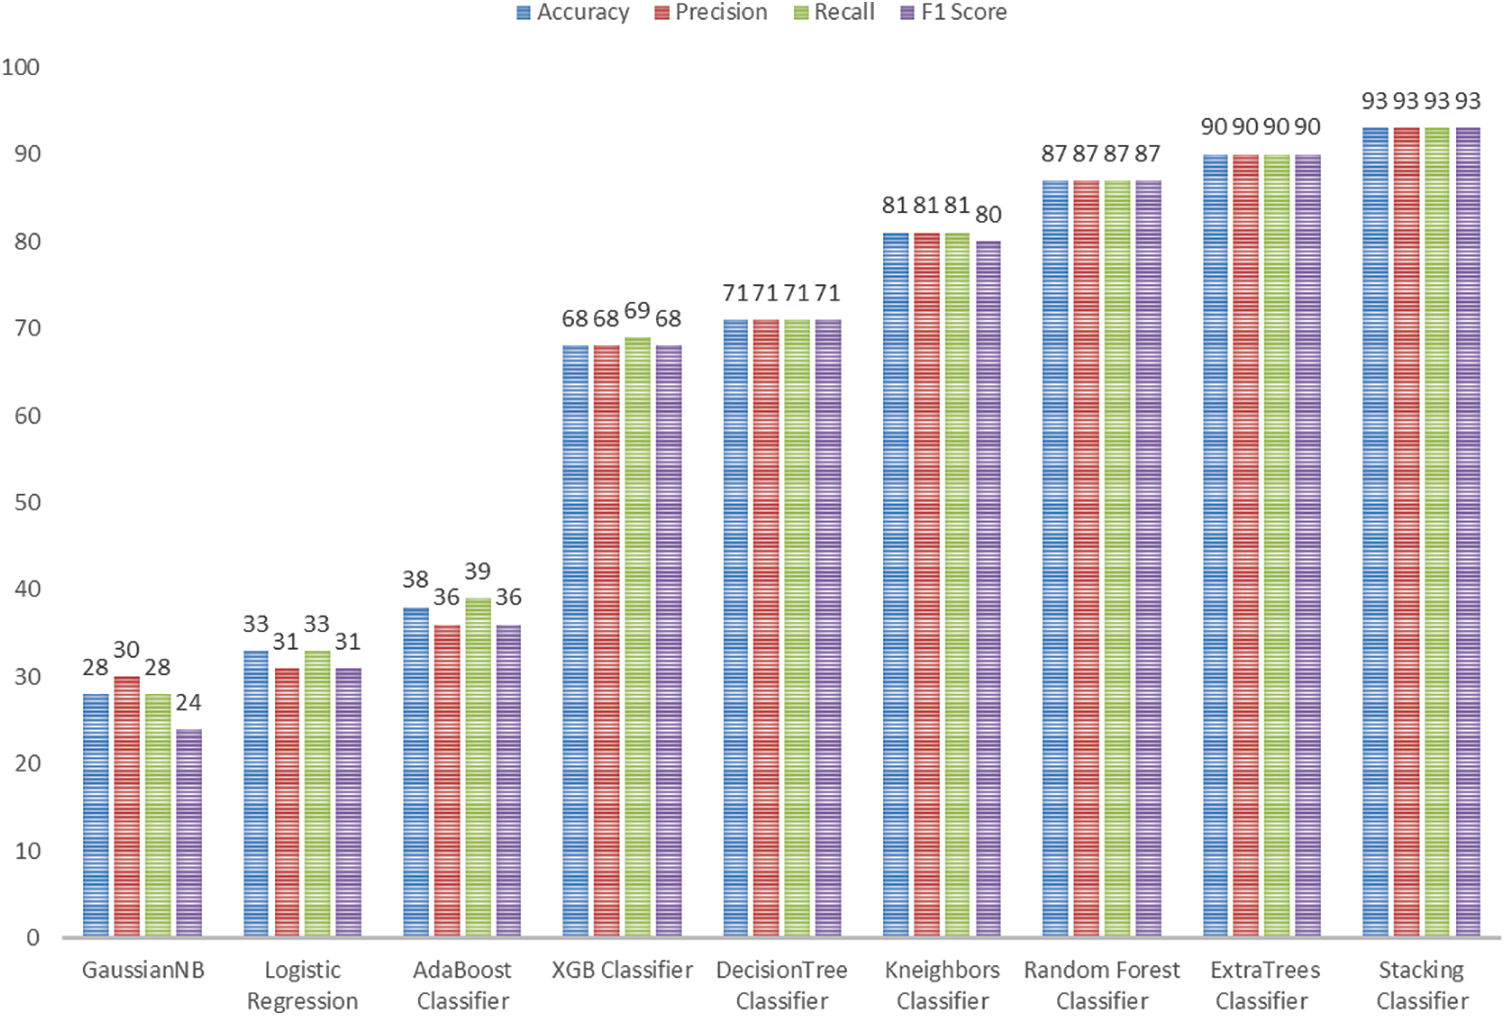
Figure 18: Accuracy, precision, recall, F1-score of state of art models
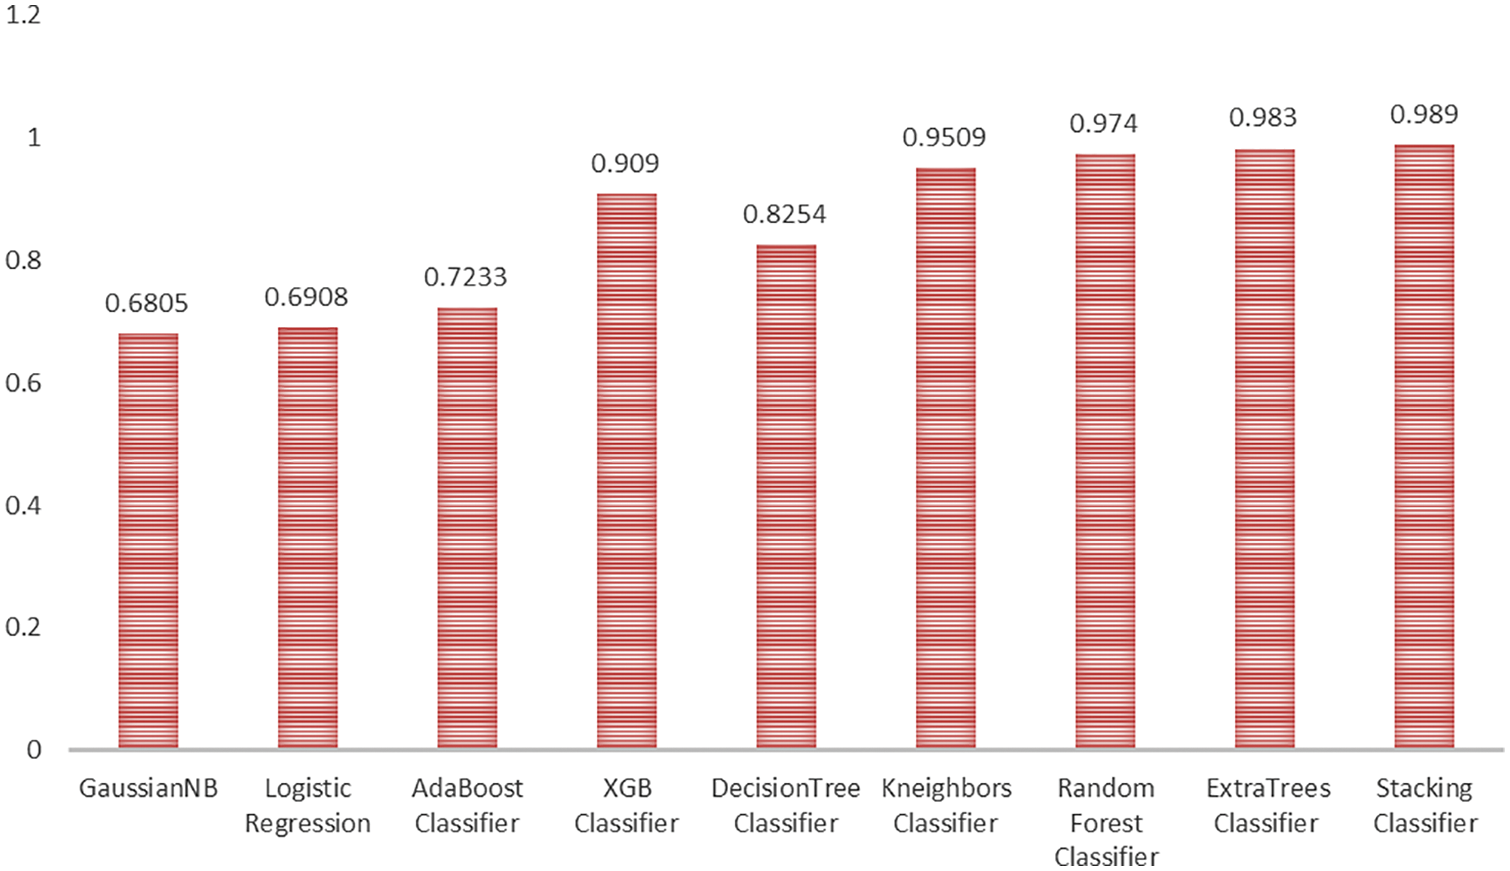
Figure 19: AUC of state of art models
To detect Child Abuses by over-sampling minority classes with Borderline-SMOTE, the maximum detection performance was attained by the stacking model. It outperformed the others by yielding 93% of Accuracy, Precision, Recall, F1-Score, and a better AUC value (0.989). However, the elapsed time was on the longer side (476.63), which would be a challenge in real-time as we appraised a large data set (Refer to Fig. 20).
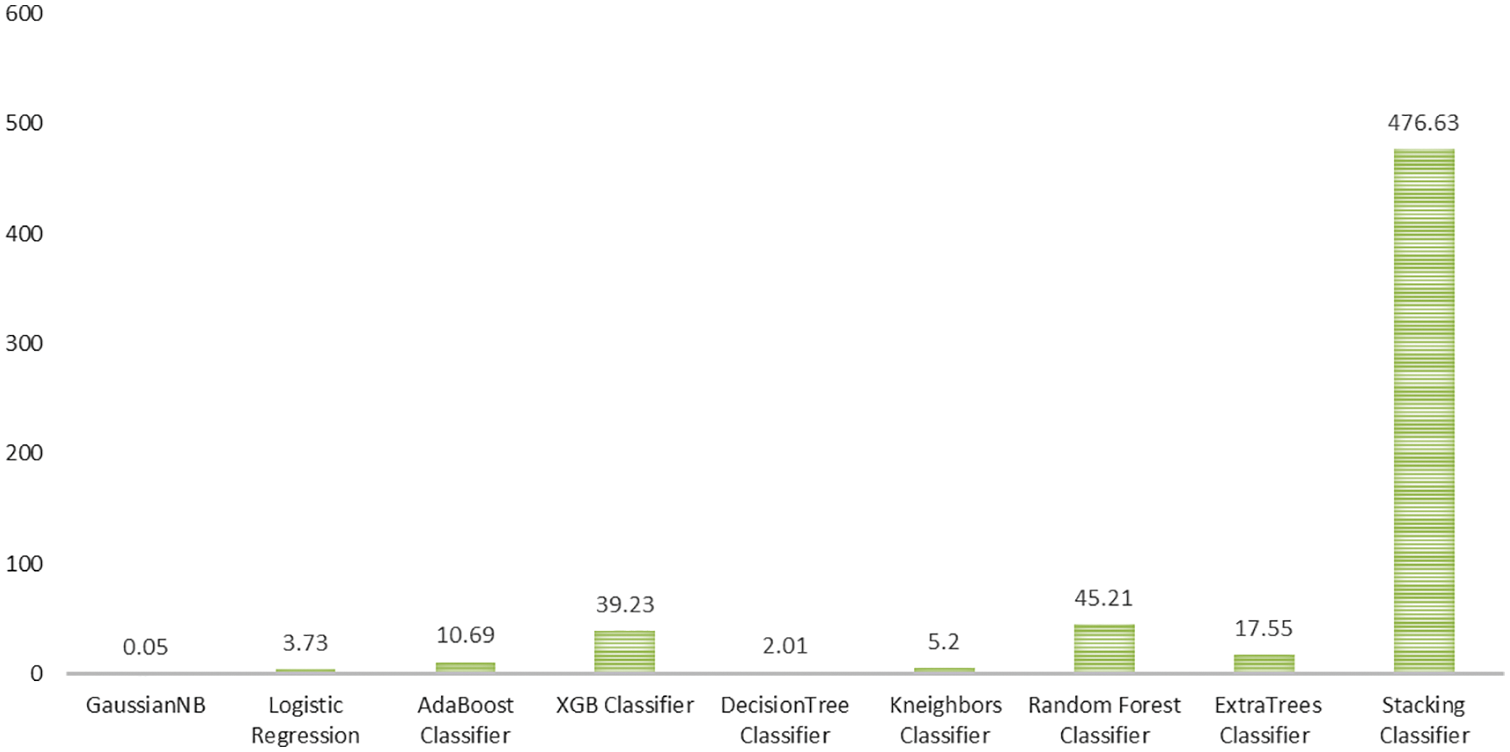
Figure 20: Elapsed time of state of art models
Artificial intelligence-based crime prediction is an effective instrument for forecasting child maltreatment. Because child abuse is a major issue around the world, researchers are working to develop effective techniques to support detection performance. We extracted child maltreatment incidents from the Chicago crime database for this study. To predict child abuse, we used machine learning algorithms such as Decision Tree, KNN, Gaussian NB, Logistic Regression, AdaBoost, Random Forest, Extra Trees, and XGBoost. The results revealed that the algorithms performed mediocrely due to unbalanced data. As a result, we used Borderline-SMOTE to balance the data set, and the findings demonstrate that the performance of the XGBoost, Decision Tree, KNN, Random Forest, and Extra Trees classifiers improved. Furthermore, the stacking model was developed using AdaBoost, XGBoost, Decision Tree, KNN, and Extra Trees in Level ‘0’, as well as Random Forest as the meta classifier. It outscored the competition in terms of accuracy (93%), precision (93%), recall (93%), F1-Score (93%), and AUC value (0.983). The proposed Borderline-SMOTE enabled Stacking Classifier model (BS-SC Model) could be used to effectively predict child maltreatment. In the future, we endeavor to use feature selection methodologies and dimensionality reduction techniques to minimize the model fitting time.
Funding Statement: We have received no specific funding for this study.
Conflicts of Interest: The authors declare that they have no conflicts of interest to report regarding the present study.
References
1. WHO, Child maltreatment, 2022. [Online]. Available: https://www.who.int/news-room/fact-sheets/detail/child-maltreatment. [Google Scholar]
2. ACF, Child maltreatment report 2020, Administration for Children and Families, 2022. [Online]. Available: https://www.acf.hhs.gov/cb/data-research/child-maltreatment. [Google Scholar]
3. J. P. Ryan, B. A. Jacob, M. Gross, B. E. Perron, A. Moore et al., “Early exposure to child maltreatment and academic outcomes,” Child Maltreatment, vol. 23, no. 4, pp. 365–375, 2018. [Google Scholar]
4. K. A. Davis and R. A. Knight, “The relation of childhood abuse experiences to problematic sexual behaviors in male youths who have sexually offended,” Archives of Sexual Behavior, vol. 48, no. 7, pp. 2149–2169, 2019. [Google Scholar]
5. K. Orrigio, R. B. Pierre, D. Gordon-Harrison, K. Lewis-O’Connor, G. Gordon-Strachan et al., “Sexual abuse and sexually-transmitted HIV/AIDS in Jamaican children and adolescents aged 6–19 years,” The Journal of Infection in Developing Countries, vol. 15, no. 7, pp. 989–996, 2021. [Google Scholar]
6. A. E. Austin, M. E. Shanahan and B. J. Zvara, “Association of childhood abuse and prescription opioid use in early adulthood,” Addictive Behaviors, vol. 76, pp. 265–269, 2018. [Google Scholar]
7. E. Kapoor, M. Okuno, V. M. Miller, L. G. Rocca, W. A. Rocca et al., “Association of adverse childhood experiences with menopausal symptoms: Results from the data registry on experiences of aging, menopause and sexuality (DREAMS),” Maturitas, vol. 143, pp. 209–215, 2021. [Google Scholar]
8. A. B. Halpin, R. K. MacAulay, A. R. Boeve, L. M. D’Errico and S. Michaud, “Are adverse childhood experiences associated with worse cognitive function in older adults?” Journal of the International Neuropsychological Society, vol. 28, no. 10, pp. 1029–1038, 2021. [Google Scholar]
9. A. Talmon, A. Uysal and J. J. Gross, “Childhood maltreatment and mid-life adult sexuality: A 10-year longitudinal study,” Archives of Sexual Behavior, vol. 51, no. 2, pp. 781–795, 2022. [Google Scholar]
10. J. M. Moreno-Manso, M. E. García-Baamonde, M. de la Rosa Murillo, M. Blázquez-Alonso, E. Guerrero-Barona et al., “Differences in executive functions in minors suffering physical abuse and neglect,” Journal of Interpersonal Violence, vol. 37, no. 5, pp. NP2588–NP2604, 2022. [Google Scholar]
11. A. J. Drury, M. J. Elbert and M. DeLisi, “Childhood sexual abuse is significantly associated with subsequent sexual offending: New evidence among federal correctional clients,” Child Abuse & Neglect, vol. 95, pp. 104035, 2019. [Google Scholar]
12. K. V. Açar, “Framework for a single global repository of child abuse materials,” Global Policy, vol. 11, no. 1, pp. 178–190, 2020. [Google Scholar]
13. T. Gash and R. Hobbs, Policing 4.0—Deciding the future of policing in the UK, Deloitte, 2018. [Online]. Available: https://www2.deloitte.com/content/dam/Deloitte/ie/Documents/PublicSector/deloitte-uk-future-of-policing.pdf. [Google Scholar]
14. CBSNEWS, Why are Suspects in Repeated Sexual Abuse of 10-Year-Old Girl Free, While She was Locked Up in A Psychiatric Facility? Chicago, IL, USA: CBS News Chicago, 2021. [Online]. Available: https://www.cbsnews.com/chicago/news/10-year-old-girl-sexual-abuse-dcfs-psychiatric-2-investigators/. [Google Scholar]
15. V. Paul, V. K. Rathaur, N. K. Bhat, R. Sananganba, A. L. Ittoop et al., “Child abuse: A social evil in Indian perspective,” Journal of Family Medicine and Primary Care, vol. 10, no. 1, pp. 110–115, 2021. [Google Scholar]
16. R. D’OVIDIO, T. Mitman, I. J. El-Burki and W. Shumar, “Adult–child sex advocacy websites as learning environments for crime,” in Cyber Criminology: Exploring Internet Crimes and Criminal Behavior, 1st ed., vol. 1. Boca Raton, FL, USA: CRC Press, pp. 103–126, 2011. [Google Scholar]
17. P. Gillingham, “Can predictive algorithms assist decision-making in social work with children and families?,” Child Abuse Review, vol. 28, no. 2, pp. 114–126, 2019. [Google Scholar]
18. J. Russell, “Predictive analytics and child protection: Constraints and opportunities,” Child Abuse & Neglect, vol. 46, pp. 182–189, 2015. [Google Scholar]
19. P. Gillingham, “Predictive risk modelling to prevent child maltreatment and other adverse outcomes for service users: Inside the ‘black box’ of machine learning,” The British Journal of Social Work, vol. 46, no. 4, pp. 1044–1058, 2016. [Google Scholar]
20. R. Vaithianathan, T. Maloney, E. Putnam-Hornstein and N. Jiang, “Children in the public benefit system at risk of maltreatment: Identification via predictive modeling,” American Journal of Preventive Medicine, vol. 45, no. 3, pp. 354–359, 2013. [Google Scholar]
21. J. Cherian and M. Dawson, “RoboCop: Crime classification and prediction in San Francisco,” Forest, vol. 15, pp. 70–69, 2015. [Google Scholar]
22. M. L. Wilson, S. Tumen, R. Ota and A. G. Simmers, “Predictive modeling: Potential application in prevention services,” American Journal of Preventive Medicine, vol. 48, no. 5, pp. 509–519, 2015. [Google Scholar]
23. R. Vaithianathan, E. Putnam-Hornstein, N. Jiang, P. Nand and T. Maloney, Developing predictive models to support child maltreatment hotline screening decisions: Allegheny County methodology and implementation, Center for Social data Analytics, 2017. [Online]. Available: https://www.alleghenycountyanalytics.us/wp-content/uploads/2019/05/Methodology-V1-from-16-ACDHS-26_PredictiveRisk_Package_050119_FINAL.pdf. [Google Scholar]
24. H. Horikawa, S. P. Suguimoto, P. M. Musumari, T. Techasrivichien, M. Ono-Kihara et al., “Development of a prediction model for child maltreatment recurrence in Japan: A historical cohort study using data from a child guidance center,” Child Abuse & Neglect, vol. 59, pp. 55–65, 2016. [Google Scholar]
25. R. Vaithianathan, E. Putnam-Hornstein, A. Chouldechova, D. Benavides-Prado and R. Berger, “Hospital injury encounters of children identified by a predictive risk model for screening child maltreatment referrals: Evidence from the allegheny family screening tool,” JAMA Pediatrics, vol. 174, no. 11, pp. e202770–e202770, 2020. [Google Scholar]
26. C. Su, R. Aseltine, R. Doshi, K. Chen, S. C. Rogers et al., “Machine learning for suicide risk prediction in children and adolescents with electronic health records,” Translational Psychiatry, vol. 10, no. 1, pp. 1–10, 2020. [Google Scholar]
27. M. C. Walsh, S. Joyce, T. Maloney and R. Vaithianathan, “Exploring the protective factors of children and families identified at highest risk of adverse childhood experiences by a predictive risk model: An analysis of the growing up in New Zealand cohort,” Children and Youth Services Review, vol. 108, pp. 104556, 2020. [Google Scholar]
28. J. Wongcharoenwatana, J. Tarugsa, K. Kaewpornsawan, P. Eamsobhana, C. Chotigavanichaya et al., “Identifying children at high risk for recurrence child abuse,” Journal of Orthopaedic Surgery, vol. 29, no. 1, pp. 1–7, 2021. [Google Scholar]
29. E. Putnam-Hornstein, J. Prindle, R. Rebbe, J. Huang, C. Kuelbs et al., Using hospital data to predict child maltreatment risk, Administration for Children and Families, 2021. [Online]. Available: https://www.acf.hhs.gov/sites/default/files/documents/opre/OPRE-Using-Hospital-Data-Predict-Child-Maltreatment-Risk-Dec2021.pdf. [Google Scholar]
30. X. Yin, D. Ma, K. Zhu and D. Li, “Identifying intentional injuries among children and adolescents based on machine learning,” PLoS One, vol. 16, no. 1, pp. e0245437, 2021. [Google Scholar]
31. L. Kissos, L. Goldner, M. Butman, N. Eliyahu and R. Lev-Wiesel, “Can artificial intelligence achieve human-level performance? A pilot study of childhood sexual abuse detection in self-figure drawings,” Child Abuse & Neglect, vol. 109, pp. 104755, 2020. [Google Scholar]
32. A. Tsai and P. K. Kleinman, “Machine learning to identify distal tibial classic metaphyseal lesions of infant abuse: A pilot study,” Pediatric Radiology, vol. 52, no. 6, pp. 1095–1103, 2022. [Google Scholar]
33. K. Kim, J. Choi, H. Jang, H. J. Lee and H. Jang, “Predictive model for intra-familial child maltreatment re-reports and recurrence in South Korea: Analysis of national child protection services case records,” Child Abuse & Neglect, vol. 125, pp. 105487, 2022. [Google Scholar]
34. R. Edwards, V. Gillies and S. Gorin, “Problem-solving for problem-solving: Data analytics to identify families for service intervention,” Critical Social Policy, vol. 42, no. 2, pp. 265–284, 2022. [Google Scholar]
35. J. D. Fluke, L. Tonmyr, J. Gray, L. B. Rodrigues, F. Bolter et al., “Child maltreatment data: A summary of progress, prospects and challenges,” Child Abuse & Neglect, vol. 119, pp. 104650, 2021. [Google Scholar]
36. A. Y. Landau, S. Ferrarello, A. Blanchard, K. Cato, N. Atkins et al., “Developing machine learning-based models to help identify child abuse and neglect: Key ethical challenges and recommended solutions,” Journal of the American Medical Informatics Association, vol. 29, no. 3, pp. 576–580, 2022. [Google Scholar]
37. A. Chouldechova, D. Benavides-Prado, O. Fialko and R. Vaithianathan, “A case study of algorithm-assisted decision making in child maltreatment hotline screening decisions,” in Proc. of 1st Conf. on Fairness, Accountability and Transparency, New York, NY, USA, pp. 134–148, 2018. [Google Scholar]
38. M. Waller and P. Waller, “Why predictive algorithms are so risky for public sector bodies,” Social Science Research Network, SSRN 3716166, 2020. https://dx.doi.org/10.2139/ssrn.3716166. [Google Scholar]
39. B. Drake, M. Jonson-Reid, M. G. Ocampo, M. Morrison and D. Dvalishvili, “A practical framework for considering the use of predictive risk modeling in child welfare,” The ANNALS of the American Academy of Political and Social Science, vol. 692, no. 1, pp. 162–181, 2020. [Google Scholar]
40. P. Lanier, M. Rodriguez, S. Verbiest, K. Bryant, T. Guan et al., “Preventing infant maltreatment with predictive analytics: Applying ethical principles to evidence-based child welfare policy,” Journal of Family Violence, vol. 35, no. 1, pp. 1–13, 2020. [Google Scholar]
41. R. Vaithianathan, D. Benavides-Prado, E. Dalton, A. Chouldechova and E. Putnam-Hornstein, “Using a machine learning tool to support high-stakes decisions in child protection,” AI Magazine, vol. 42, no. 1, pp. 53–60, 2021. [Google Scholar]
42. W. Safat, S. Asghar and S. A. Gillani, “Empirical analysis for crime prediction and forecasting using machine learning and deep learning techniques,” IEEE Access, vol. 9, pp. 70080–70094, 2021. [Google Scholar]
43. M. S. Baek, W. Park, J. Park, K. H. Jang and Y. T. Lee, “Smart policing technique with crime type and risk score prediction based on machine learning for early awareness of risk situation,” IEEE Access, vol. 9, pp. 131906–131915, 2021. [Google Scholar]
44. Chicago Data Portal, Crimes—2001 to Present, Chicago, IL, USA: Chicago Data Portal, 2022. [Online]. Available: https://data.cityofchicago.org/Public-Safety/Crimes-2001-to-Present/ijzp-q8t2, Date: 28/01/2022. [Google Scholar]
45. C. C. Sun, C. Yao, X. Li and K. Lee, “Detecting crime types using classification algorithms,” Journal of Digital Information Management, vol. 12, no. 5, pp. 321–327, 2014. [Google Scholar]
46. A. F. M. Nasir and K. A. M. Sukri, “Machine learning approach on cyberstalking detection in social media using naive Bayes and decision tree,” Journal of Soft Computing and Data Mining, vol. 3, no. 1, pp. 19–27, 2022. [Google Scholar]
47. G. Hajela, M. Chawla and A. Rasool, “A multi-dimensional crime spatial pattern analysis and prediction model based on classification,” ETRI Journal, vol. 43, no. 2, pp. 272–287, 2021. [Google Scholar]
48. S. S. May, O. E. Isafiade and O. O. Ajayi, “Hybridizing extremely randomized trees with bootstrap aggregation for crime prediction,” in Proc. of 4th Int. Conf. on Artificial Intelligence and Pattern Recognition, Xiamen, China, pp. 536–541, 2021. [Google Scholar]
49. W. Jiang, Z. Chen, Y. Xiang, D. Shao, L. Ma et al., “SSEM: A novel self-adaptive stacking ensemble model for classification,” IEEE Access, vol. 7, pp. 120337–120349, 2019. [Google Scholar]
50. J. A. Reid and E. Beauregard, “Exploring a machine learning approach: Predicting death in sexual assault,” Journal of Criminal Justice, vol. 71, pp. 101741, 2020. [Google Scholar]
51. Y. Han, M. Modaresnezhad and H. Nemati, “An adaptive machine learning system for predicting recurrence of child maltreatment: A routine activity theory perspective,” Knowledge-Based Systems, vol. 227, pp. 107164, 2021. [Google Scholar]
52. A. Luque, A. Carrasco, A. Martín and A. de Las Heras, “The impact of class imbalance in classification performance metrics based on the binary confusion matrix,” Pattern Recognition, vol. 91, pp. 216–231, 2019. [Google Scholar]
53. P. Vuttipittayamongkol, E. Elyan and A. Petrovski, “On the class overlap problem in imbalanced data classification,” Knowledge-Based Systems, vol. 212, pp. 106631, 2021. [Google Scholar]
54. A. Fernández, S. Garcia, F. Herrera and N. V. Chawla, “SMOTE for learning from imbalanced data: Progress and challenges, marking the 15-year anniversary,” Journal of Artificial Intelligence Research, vol. 61, pp. 863–905, 2018. [Google Scholar]
55. H. Han, W. Y. Wang and B. H. Mao, “Borderline-SMOTE: A new over-sampling method in imbalanced data sets learning,” in Proc. of Int. Conf. on Intelligent Computing, Berlin, Heidelberg, Springer, pp. 878–887, 2005. [Google Scholar]
56. Y. Chen, R. Chang and J. Guo, “Effects of data augmentation method borderline-SMOTE on emotion recognition of EEG signals based on convolutional neural network,” IEEE Access, vol. 9, pp. 47491–47502, 2021. [Google Scholar]
57. K. L. Li, B. Ren, T. Guan, J. Wang, J. Yu et al., “A hybrid cluster-borderline SMOTE method for imbalanced data of rock groutability classification,” Bulletin of Engineering Geology and the Environment, vol. 81, no. 1, pp. 1–15, 2022. [Google Scholar]
58. D. H. Wolpert, “Stacked generalization,” Neural Networks, vol. 5, no. 2, pp. 241–259, 1992. [Google Scholar]
59. J. Yan and S. Han, “Classifying imbalanced data sets by a novel re-sample and cost-sensitive stacked generalization method,” Mathematical Problems in Engineering, vol. 2018, Article ID. 5036710, 2018. https://doi.org/10.1155/2018/5036710. [Google Scholar]
Cite This Article
 Copyright © 2023 The Author(s). Published by Tech Science Press.
This work is licensed under a Creative Commons Attribution 4.0 International License , which permits unrestricted use, distribution, and reproduction in any medium, provided the original work is properly cited.
 Downloads
 Citation Tools