
 Submit a Paper
 Propose a Special lssue
 Open Access
ARTICLE

Designing Adaptive Multiple Dependent State Sampling Plan for Accelerated Life Tests
1 Division of Mathematics, Department of Mathematics and Computer Science, Faculty of Science and Technology, Rajamangala University of Technology Krungthep, Bangkok, 10120, Thailand
2 Division of Applied Statistics, Department of Mathematics and Computer Science, Faculty of Science and Technology, Rajamangala University of Technology Thanyaburi, Pathum Thani, 12110, Thailand
3 Center of Excellence in Theoretical and Computational Science (TaCS-CoE) & KMUTT Fixed Point Research Laboratory, Room SCL 802 Fixed Point Laboratory, Science Laboratory Building, Departments of Mathematics, Faculty of Science, King Mongkut’s University of Technology Thonburi (KMUTT), Bangkok, 10140, Thailand
* Corresponding Author: Wimonmas Bamrungsetthapong. Email:
Computer Systems Science and Engineering 2023, 46(2), 1631-1651. https://doi.org/10.32604/csse.2023.036179
Received 20 September 2022; Accepted 23 November 2022; Issue published 09 February 2023
 View Full Text
 Download PDF
Abstract
A novel adaptive multiple dependent state sampling plan (AMDSSP) was designed to inspect products from a continuous manufacturing process under the accelerated life test (ALT) using both double sampling plan (DSP) and multiple dependent state sampling plan (MDSSP) concepts. Under accelerated conditions, the lifetime of a product follows the Weibull distribution with a known shape parameter, while the scale parameter can be determined using the acceleration factor (AF). The Arrhenius model is used to estimate AF when the damaging process is temperature-sensitive. An economic design of the proposed sampling plan was also considered for the ALT. A genetic algorithm with nonlinear optimization was used to estimate optimal plan parameters to minimize the average sample number (ASN) and total cost of inspection (TC) under both producer’s and consumer’s risks. Numerical results are presented to support the AMDSSP for the ALT, while performance comparisons between the AMDSSP, the MDSSP and a single sampling plan (SSP) for the ALT are discussed. Results indicated that the AMDSSP was more flexible and efficient for ASN and TC than the MDSSP and SSP plans under accelerated conditions. The AMDSSP also had a higher operating characteristic (OC) curve than both the existing sampling plans. Two real datasets of electronic devices for the ALT at high temperatures demonstrated the practicality and usefulness of the proposed sampling plan.Keywords
An acceptance sampling plan (ASP) is essential to ensure that product quality conforms to standards. Generally, producers decide to accept or reject lot sentencing which depends on a single sampling plan (SSP) that is often used in various industries. An SSP is easy to use but usually results in a larger sample size than other sampling plans [1]. Sometimes, an SSP cannot decide whether a lot will be accepted or rejected. Moreover, when using an SSP, the producer is often at a psychological disadvantage because the rejected lots are not given a second chance [2]. In these cases, the producer should apply a double sampling plan (DSP) for the inspection process. If the results of the first sample are not definitive for acceptance or rejection, a second sample is taken, which then leads to a decision on the disposition of the lot. For this reason, a DSP is more economical and reliable than an SSP for lots with very low or very high proportions of defects because a decision can be made after taking the first sample [3]. Producers can also apply more effective sampling plans, such as the multiple dependent state sampling plan (MDSSP), to assist in lot acceptance decisions. Wortham et al. [4] introduced the MDSSP to deliver lots for serial inspection in a continuous production process. Sample size can be reduced by implementing the MDSSP since the decision regarding the disposition of the current lot is made using the results of samples drawn from both current and previous lots. The MDSSP has been used by numerous researchers in a variety of situations. Govindaraju et al. [5] proposed an MDSSP design to minimize the sum of producer and consumer risks within the acceptable quality level limits, while Balamurali et al. [6] investigated the MDSSP under normal distribution using a variable sampling plan. The Bayesian approach was employed by Balamurali et al. [7] to analyze the MDSSP. Some studies [8–12] applied MDSSP concepts to design control charts. Rao et al. [13] presented a generalization of the MDSSP called the GMDSSP and discovered that this was more efficient in lowering sample size. The mean lifetime of products using a GMDSSP was investigated by Aslam et al. [14] for the gamma, Burr type XII and Birnbaum-Saunders distributions, while Aslam et al. [15] developed the MMDSSP, a modified version of the MDSSP that they claimed was more adaptable and effective than the existing MDSSP in terms of sample size and inspection cost over time truncated life. Charongrattanasakul et al. [16] proposed a novel adaptive version of the MDSSP that accepted the current lot if the quality of the product was excellent, good or moderate, while existing sampling plans only operated at two levels. They claimed that their proposed sampling plan was more flexible and efficient in terms of average sample number than the MDSSP and MMDSP. Other studies [17–19] applied the Bayesian approach to design a group chain sampling plan that considered inspection based on preceding and succeeding lots.
Nowadays, many products, including electronic devices and electrical appliances, are highly reliable and testing each item does not ensure the mean lifetime of the product. Therefore, life testing is used to determine product lifetime under specified conditions. Several studies presented an ASP for the truncated life test under various lifetime distributions. Tripathi et al. [20] presented an SSP for generalized half-normal distribution, where the lifetime experiment was truncated at a specified time, while Rao et al. [21] presented an MDSSP that decreased the life of the product under exponentiated half-logistic distribution. A novel ASP for length-biased weighted Lomax distribution was created by Al-Omari et al. [22] based on a truncated life test, while an attribute-modified chain sample inspection plan was created by Tripathi et al. [23] based on a time-truncated life test under the Darna distribution. Abushal et al. [24] developed an ASP for the power-inverted Topp-Leone distribution, which is a truncated life test that takes advantage of the median life of products. Life testing analyzes failure times of test units under normal operating conditions.
Generally, products are manufactured using high-quality processes to ensure long lifetimes. Therefore, collecting failure statistics for these products under use conditions is very difficult. As a result, the accelerated life test (ALT) is becoming more popular as this gives information on a highly reliable product lifetime in a short time. The ALT analyzes a product under conditions that are more extreme than general use (temperature, strain, stress, etc.), thus forcing the product to fail faster. These tests speed up the detection of various product defects and failure types. Producers now realize that the ALT plays an essential role in rapidly inspecting finished products. Several authors have proposed sampling plans under the ALT. Kim et al. [25] suggested an SSP for ALT under the Weibull distribution. They considered the case where the life test was hybrid censored, while Gao et al. [26] discussed the design of an ALT sampling plan for an exponential distribution using time-censoring. Some studies suggested other sampling plans. Aslam et al. [27] developed an SkSP-V sampling plan for ALT when product lifetime followed the Weibull distribution, while Aslam et al. [28] proposed a group skip-lot sampling plan using ALT resampling when the product lifetime followed the Weibull distribution. Statistical inference for ALTs under various types of stress (constant-stress, step-stress and progressive-stress) has also been proposed for censoring data under various lifetime distributions. For more details, see [29–33].
The economic design of the inspection process should consider all costs associated with implementing the plan such as inspection costs, internal failure costs and outgoing failure costs. Changes in these cost parameters will affect the total cost of the inspection. Several authors studied the economic designs of various ASPs using different approaches. Hsu et al. [2] proposed an economic model for an SSP to determine the minimum appropriated cost for both producer and consumer, while Aslam et al. [34] proposed an economic design of a group ASP to ensure the lifetime of products following the Weibull distribution using a Bayesian approach. Fallahnezhad et al. [35] proposed repeating group ASPs that included give-away cost per unit of extra sold material and inspection error, while Balamurali et al. [36] presented an economic design of a quick switching sampling system to minimize total cost while meeting the risk requirements of both producers and consumers. Finally, Hakamipour [37] compared constant-stress and step-stress predictors under a cost constraint for progressive Type I censoring.
This study focused on designing sampling plans for ALT based on continuous production processes and delivering lots for serial inspection. To the best of our knowledge, an ASP design for the ALT using the MDSSP has not been previously presented. Many ALT studies used only a single sample to decide whether to accept or reject a lot. In some situations, producers cannot decide to accept or reject a lot based on a single sampling plan because the quality level of the first sample can be both good and bad. Therefore, here, a novel adaptive version of the MDSSP (AMDSSP) for the ALT was used to decrease sample size when the mean lifetime followed the Weibull distribution. This novel sampling plan was designed based on the concept of the DSP together with the existing MDSSP. An economic model of the AMDSSP for ALT was also developed. The proposed sampling plan was compared with existing sampling plans in terms of average sample number, probability of current lot acceptance and total cost of inspection.
The remainder of this paper is arranged as follows. A brief explanation of the ALT and the Weibull distribution is provided in Section 2, with the proposed operating method and design of the AMDSSP for the ALT given in Section 3. An economic design of the AMDSSP for the ALT is presented in Section 4, with a numerical illustration and application of two real datasets in Section 5. A discussion and conclusions drawn are provided in Section 6.
2 Accelerated Life Test and Weibull Distribution
The accelerated life test (ALT) is a technique for testing and analyzing systems and components that are predominantly electrical, electromechanical and mechanical to determine or improve their quality. A manufacturer can collect failure data by increasing the stress levels on a component to induce failure more rapidly. In practice, the ALT often mimics the real-world environments a product is likely to experience such as thermal changes, humidity and power cycling.
This study considered the Arrhenius model for temperature stress of an electronic device. This model is used when the damaging mechanism is temperature-sensitive (especially for integrating circuits, LEDs, dielectrics, semiconductors, battery cells and insulating tapes) [38]. The Arrhenius reaction rate equation is typically used to describe whether temperature affects the device as follows:
where Ea is the activation energy and a low value denotes a small temperature dependency, k is Boltmann’s constant 8.6171 × 10⁻⁵ eV/K, A is a nonthermal constant and T is temperature in degrees Kelvin. Assuming that device life (L) is proportional to the inverse reaction rate of the process, then Eq. (1) can be rewritten as L = Ae Ea/kT. The acceleration factor (AF) is the ratio between product life under use conditions (LU) and life under accelerated conditions (LA). The thermal acceleration factor can be expressed as [38]:
where TU is the use condition temperature (°C + 273) and TA is the accelerated temperature (°C + 273). Thus, AF is greater than 1 in the case where TA is greater than TU.
The ALT of products has been the subject of several engineering studies where the lifetime is based on the Weibull distribution. This study presented a novel adaptive sampling plan for the ALT in the case of a Weibull distributed product lifetime. Let tU be the lifetime of a product under use condition following the Weibull distribution with shape parameter δ and scale parameter λU. The cumulative distribution function under the use condition can be defined by:
Kim et al. [25] suggested tA as the lifetime of a product under accelerated conditions following the Weibull distribution, with shape parameter δ and scale parameter λA. Suppose λA = λU/AF, where AF is the acceleration factor. Then, the cumulative distribution function and mean lifetime under the accelerated condition can be defined by:
and
From Eq. (4), the failure probability of a product at censoring time τA when λA = λU/AF under the accelerated condition is shown by Eq. (6):
Suppose τA × AF is equivalent to the censoring time at the use condition [25]. The value of censoring time under the accelerated condition τA can be written in terms of the specified mean lifetime µ0, e.g., τA = aµ0 for an experiment termination ratio (a). From Eq. (6), the failure probability of the product at the censoring time τA can be rewritten as:
Eq. (7) shows the failure probability in terms of the experiment termination ratio, shape parameter, acceleration factor and mean lifetime based on the Weibull distribution.
3 Design of an Adaptive Multiple Dependent State Sampling Plan for Accelerated Life Test
Wortham et al. [4] presented the multiple dependent state sampling plan (MDSSP) as an attribute of the inspection process. This sampling plan requires continuous sampling from both the current and previous lots and decides whether to accept or reject the current lot. This approach results in reduced sample size and is often used when manufacturing is continuous with multiple lots, and each lot is submitted sequentially for inspection. However, the MDSSP considers data from previous lots using a minimum sample size to eliminate a current lot of moderate quality. The existing MDSSP will accept or reject the current lot under a single sampling but in some cases, a single sampling may not be sufficient to accept or reject the current lot. Therefore, this presents an opportunity to increase the producer’s risk and reduce the consumer’s risk.
This study put the MDSSP and the DSP concepts into practice using a novel adaptation of the MDSSP called the AMDSSP. If the quality of the first sample is undecided, the second sample must be inspected before deciding whether to accept the model. This proposed sampling plan can reduce the sample size of the MDSSP by recognizing that it will accept the current lot if it is of good or moderate quality. Therefore, the proposed sampling plan is more flexible than the existing MDSSP, with reduced sample size. Suppose the AMDSSP operates under the same conditions and procedures as the existing MDSSP by considering the following conditions. The product inspected consists of serial lots produced by continuous processes. Every lot inspected should be of the same quality. A certain number of samples are taken from each lot. The current lot will be of the same quality as the previous lot, and customers trust that the manufacturer is being honest.
This research used the AMDSSP to design an optimal sampling plan for the ALT when the lifetime of the product followed the Weibull distribution. This proposed plan consisted of five parameters including n1, n2, c1, c2 and m. The AMDSSP for ALT has the following operational steps:
Step 1. Choose the first random sample size n1 for the known AF under accelerated conditions at time 0 from the current lot. Sample items should be put through the life test under accelerated conditions. Count the nonconforming items before the censoring time τA, which is denoted by d1.
Step 2. The current lot is accepted as being of good quality if d1 ≤ c1, and it is rejected if d1 > c2 or when the censoring time τA is reached, whichever comes first. Otherwise, go to Step 3.
Step 3. Choose the second sample size n2 if c1 < d1 ≤ c2. Sample items should be put through the life test under accelerated conditions. Count the nonconforming items which expire before the censoring time τA and denote as d2. If d1 + d2 ≤ c2 and the remaining m previous lots are of good quality, consider the current lot to be of moderate quality. Otherwise, reject the current lot.
Let c1 be the maximum acceptable number of nonconforming items for unconditional acceptance c1 ≥ 0 and c2 be the maximum acceptable number of additional nonconforming items for conditional acceptance c2 > c1. We can summarize the above steps in a flow chart, as presented in Fig. 1.

Figure 1: Operating procedure of the AMDSSP for ALT
The probability of current lot acceptance when it is of good quality without considering the quality of m previous lots is denoted by PI (p) and given as follows:
The probability of current lot acceptance when it is of moderate quality provided previous lots are of good quality (d1 ≤ c1) is denoted by PII (p) and obtained as follows:
As a result, the operating characteristic (OC) function is described by
The binomial distribution can be used to derive the OC function from Eq. (11) as follows:
Another important point to note is that we can switch AMDSSPs to SSPs and DSPs by considering m → ∞, the AMDSSP is reduced to SSP with an acceptance number c1, while at m → 0, the AMDSSP is reduced to DSP with acceptance numbers c1 and c2. The average sample number (ASN) of the AMDSSP is derived by:
Sample size and costs are necessary for the inspection process to provide good quality electronic products. Effective economic sampling plans can reduce the sample size and cost of the inspection process. The AMDSSP for the ALT is designed to obtain a lower ASN and total cost of the inspection process than existing sampling plans. This proposed sampling plan ensures that the mean lifetime (µ) and the ratio between true mean lifetime and specified mean lifetime (µ0) or mean ratio are essential. It was observed that µ/µ0 ≥ 1. If µ/µ0 is increased, then the true mean lifetime is longer than the specified mean lifetime.
In quality control studies, there is no explicit guarantee when using a sampling method that all products will be of good quality. Two types of risks can occur. The producer’s risk (α) denotes the probability that a good lot will be rejected as performing unsatisfactorily, while the consumer’s risk (β) denotes the probability of accepting a lot of poor quality. The producer’s risk can be controlled directly, while the consumer’s risk depends on the sample size used in the test. A larger sample size gives a more negligible consumer’s risk. The consumer’s risk is often difficult to control because of the lack of flexibility in choosing the sample size.
The mean ratio, which affects the quality level of the product, is related to failure probability. The acceptable quality level (AQL or p1) and the limiting quality level (LQL or p2) are taken into consideration when determining the requirements for producer’s risks (alpha) and consumer’s risks (beta). The AMDSSP for the ALT is practical for two points (AQL, 1−α) and (LQL, β) and is considered for changes in the OC curve. A producer expects that the probability of current lot acceptance should be greater than 1−α at p1. On the other hand, a customer expects that the probability of current lot acceptance should be less than β at p2. The nonlinear optimization technique is used to determine the optimal parameters resulting in reduced size of the ASN and total cost at p1 under the ALT.
4 Economic Design of an AMDSSP for the Accelerated Life Test
This section presents an economic design of an AMDSSP for the ALT following the concepts of Hsu et al. [2] and Hakamipour [37]. Performance indicators of the proposed sampling plan, such as PI(p), PII(p) and Pa(p) are given in Eqs. (8)–(10) and average total inspection (ATI) values are used, where ATI is defined as [39]:
Three cost components are considered in the AMDSSP for ALT under the current lot inspection as the cost of the accelerated life test, the expected cost of internal failure per lot and the expected cost of external failure per lot.
First component: Let CA be the cost of the accelerated life test for each lot of products, as shown in Eq. (14).
where Cs represents the fixed cost for setting up an accelerated life test experiment for the time interval [0, τA], Cu represents the sampling cost per unit and Co represents the operating cost of conducting an accelerated life test per unit time.
Second component: Let CI be the cost of internal failure for each lot of products, as shown in Eq. (15).
where Cd represents the cost of replacement per unit, N represents the lot size and ATI · p + (1−PA(p))(N − ATI) p represents the expected number of nonconforming items detected per lot.
Third component: Let CE be the cost of external failure for each lot of products, as shown in Eq. (16).
where Cnd represents the cost of an outgoing nonconforming per unit and (N − ATI) p · Pa(p) represents the expected number of nonconforming items not detected per lot. Therefore, the total cost for inspection of the products per lot under the AMDSS plan for ALT is given by:
In this research, the nonlinear optimization technique was used to determine the optimal parameters for reduced size of the ASN and total cost at p1 under the ALT. The genetic algorithm (GA) method with nonlinear optimization was applied using the MATLAB program. The procedure for applying the GA method to determine the optimal parameters is shown as a flow chart in Fig. 2.

Figure 2: Flow chart of the GA method to determine the optimal parameters based on the AMDSS plan for the ALT
5.1 Numerical Illustration of the AMDSS Plan for the ALT
In this section, plan parameters of the AMDSSP for ALT were determined by supposing that the mean ratio of the producer’s risk is µ/µ0 = 2, 4, 6, 8. By contrast, consumers expect to receive good products. The mean ratio µ/µ0 = 1 was assumed as the consumer’s risk. Under the Weibull distribution, values of p1 and p2 were calculated using Eq. (7) for different values of µ/µ0. The optimal parameters (n1, n2, c1, c2, m) of the AMDSSP for ALT under the Weibull distribution were determined and selected to simultaneously satisfy both the producer’s and consumer’s risks with the minimum ASN. The producer’s risk was set at α = 0.05 with different consumer’s risk values at β = 0.10 and 0.05. Two values of shape parameters under the Weibull distribution were considered as δ = 2.5 and 3. In the ALT process, spending minimum censoring time under accelerated conditions is necessary. Thus, for τA = aµ0, a should be closer to 0, resulting in a lower τA. Then, a was defined as 0.1, 0.2 and 0.5. The Arrhenius model was used for temperature stress to compute the thermal AF. In the used condition, temperature TU was 50°C with different values for the accelerated temperature TA = (120, 125, 130, 135) °C. From Eq. (2), the AF values are 6.80, 7.60, 8.47 and 9.41. The optimal plan parameter of the AMDSSP for ALT to minimize ASN can be determined using the nonlinear optimization problem as follows:
Subject to:
Results in Tables 1–3 show that for fixed values of a, AF and µ/µ0 the ASN decreased with either an increment in β or a decrement in δ. For fixed values of δ, β, a and µ/µ0 the ASN increased with an increment in AF. For instance, δ = 3, β = 0.05, a = 0.1 and µ/µ0 = 2, as shown in Table 1. The ASN increased from 17.6808 to 26.0128 when AF changed from 6.80 to 9.41, while ASN increased when δ increased for fixed values of β, a, µ/µ0 and AF. Also, ASN decreased if either the value of a or µ/µ0 increased.


The OC curves present the effect of various m values based on the probability of current lot acceptance with the same values n1, n2, c1 and c2. The optimal plan parameters were considered for fixed a = 0.1, δ = 3, µ/µ0 = 2, AF = 6.8, α = 0.05 and β = 0.05. Results in Table 1 show that the optimal plan parameters were (n1, n2, c1, c2, m) = (17, 10, 1, 2, 1) and the OC function for the AMDSSP with m = 1, 2, 3 and 4 is shown in Fig. 3. For m = 2, 3 and 4, the probability of current lot acceptance was lower than m = 1. As a result, high probability of accepting the current lot depended only on accepting the previous lot. In addition, if the proportion of nonconformity increased, the value of m did not significantly affect the probability of current lot acceptance.

Figure 3: OC curves of the AMDSSP for ALT with different m values
Example: To apply the AMDSSP for the ALT, we used results in Tables 1–3. Suppose that the producer intends to apply the AMDSSP in the inspection process where the lifetime is based on the Weibull distribution with δ = 2.5. Let µ0 = 1,000 and τA = 100; then, a = 0.1. Also, we assumed that α = 0.05, β = 0.05, AF = 7.60 and µ/µ0 = 2. Table 1 gives the optimal plan parameters for the AMDSSP as n1 = 18, n2 = 4, c1 = 2, c2 = 3 and m = 1, with the probability of current lot acceptance 0.9565 and
Step 1: Choose an initial random sample of 18 items at time 0 under accelerated conditions. Conduct the ALT on each sampled item and count the number of nonconforming items (d1) before τA = 100 h.
Step 2: If d1 ≤ 2, the current lot will be accepted regardless of the quality of the previous lot, and called good quality. If d1 > 3, the current lot will be rejected. Otherwise, go to step 3.
Step 3: If 2 < d1 ≤ 3, choose a second sample size of 4 items. Conduct the ALT on each of the 4 items and count the number of nonconforming items (d2) before τA = 100 h. Accept the current lot if d1 + d2 ≤ 3 and the previous lot is of good quality, which is called moderate quality. Otherwise, reject the current lot.
5.2 Numerical Illustration of the Economic Design of an AMDSSP for the ALT
Optimal plan parameters of the AMDSSP for ALT to minimize the total cost of inspection are determined using the nonlinear optimization problem as follows:
Objective function: Minimize
Subject to:
Let Pa(p1) and Pa(p2) be the probabilities for lot acceptance at p1 and p2 obtained using Eqs. (19) and (20).
The optimal parameters of an economic AMDSSP for the ALT along with corresponding Pa(p), ATI and TC are reported in Tables 4 and 5. Suppose the input parameters are δ = 3, N = 1,000, Cs = 10, Cu = 0.1, Co = 1, Cd = 2 and Cnd = 10. The fixed values of producer’s risk and consumer’s risks are assumed to be (α, β) = (0.05, 0.05). The failure probability of product (p) corresponding to the mean ratios µ/µ0 = 2, 4, 6, 8 are considered as p1 and the probability of failure at the ratio µ/µ0 = 1 is taken as p2. Considering different values of a = 0.1 and 0.2, AF = 6.80, 7.6, 8.47 and 9.41, while τA = 250 and 500 h, respectively.

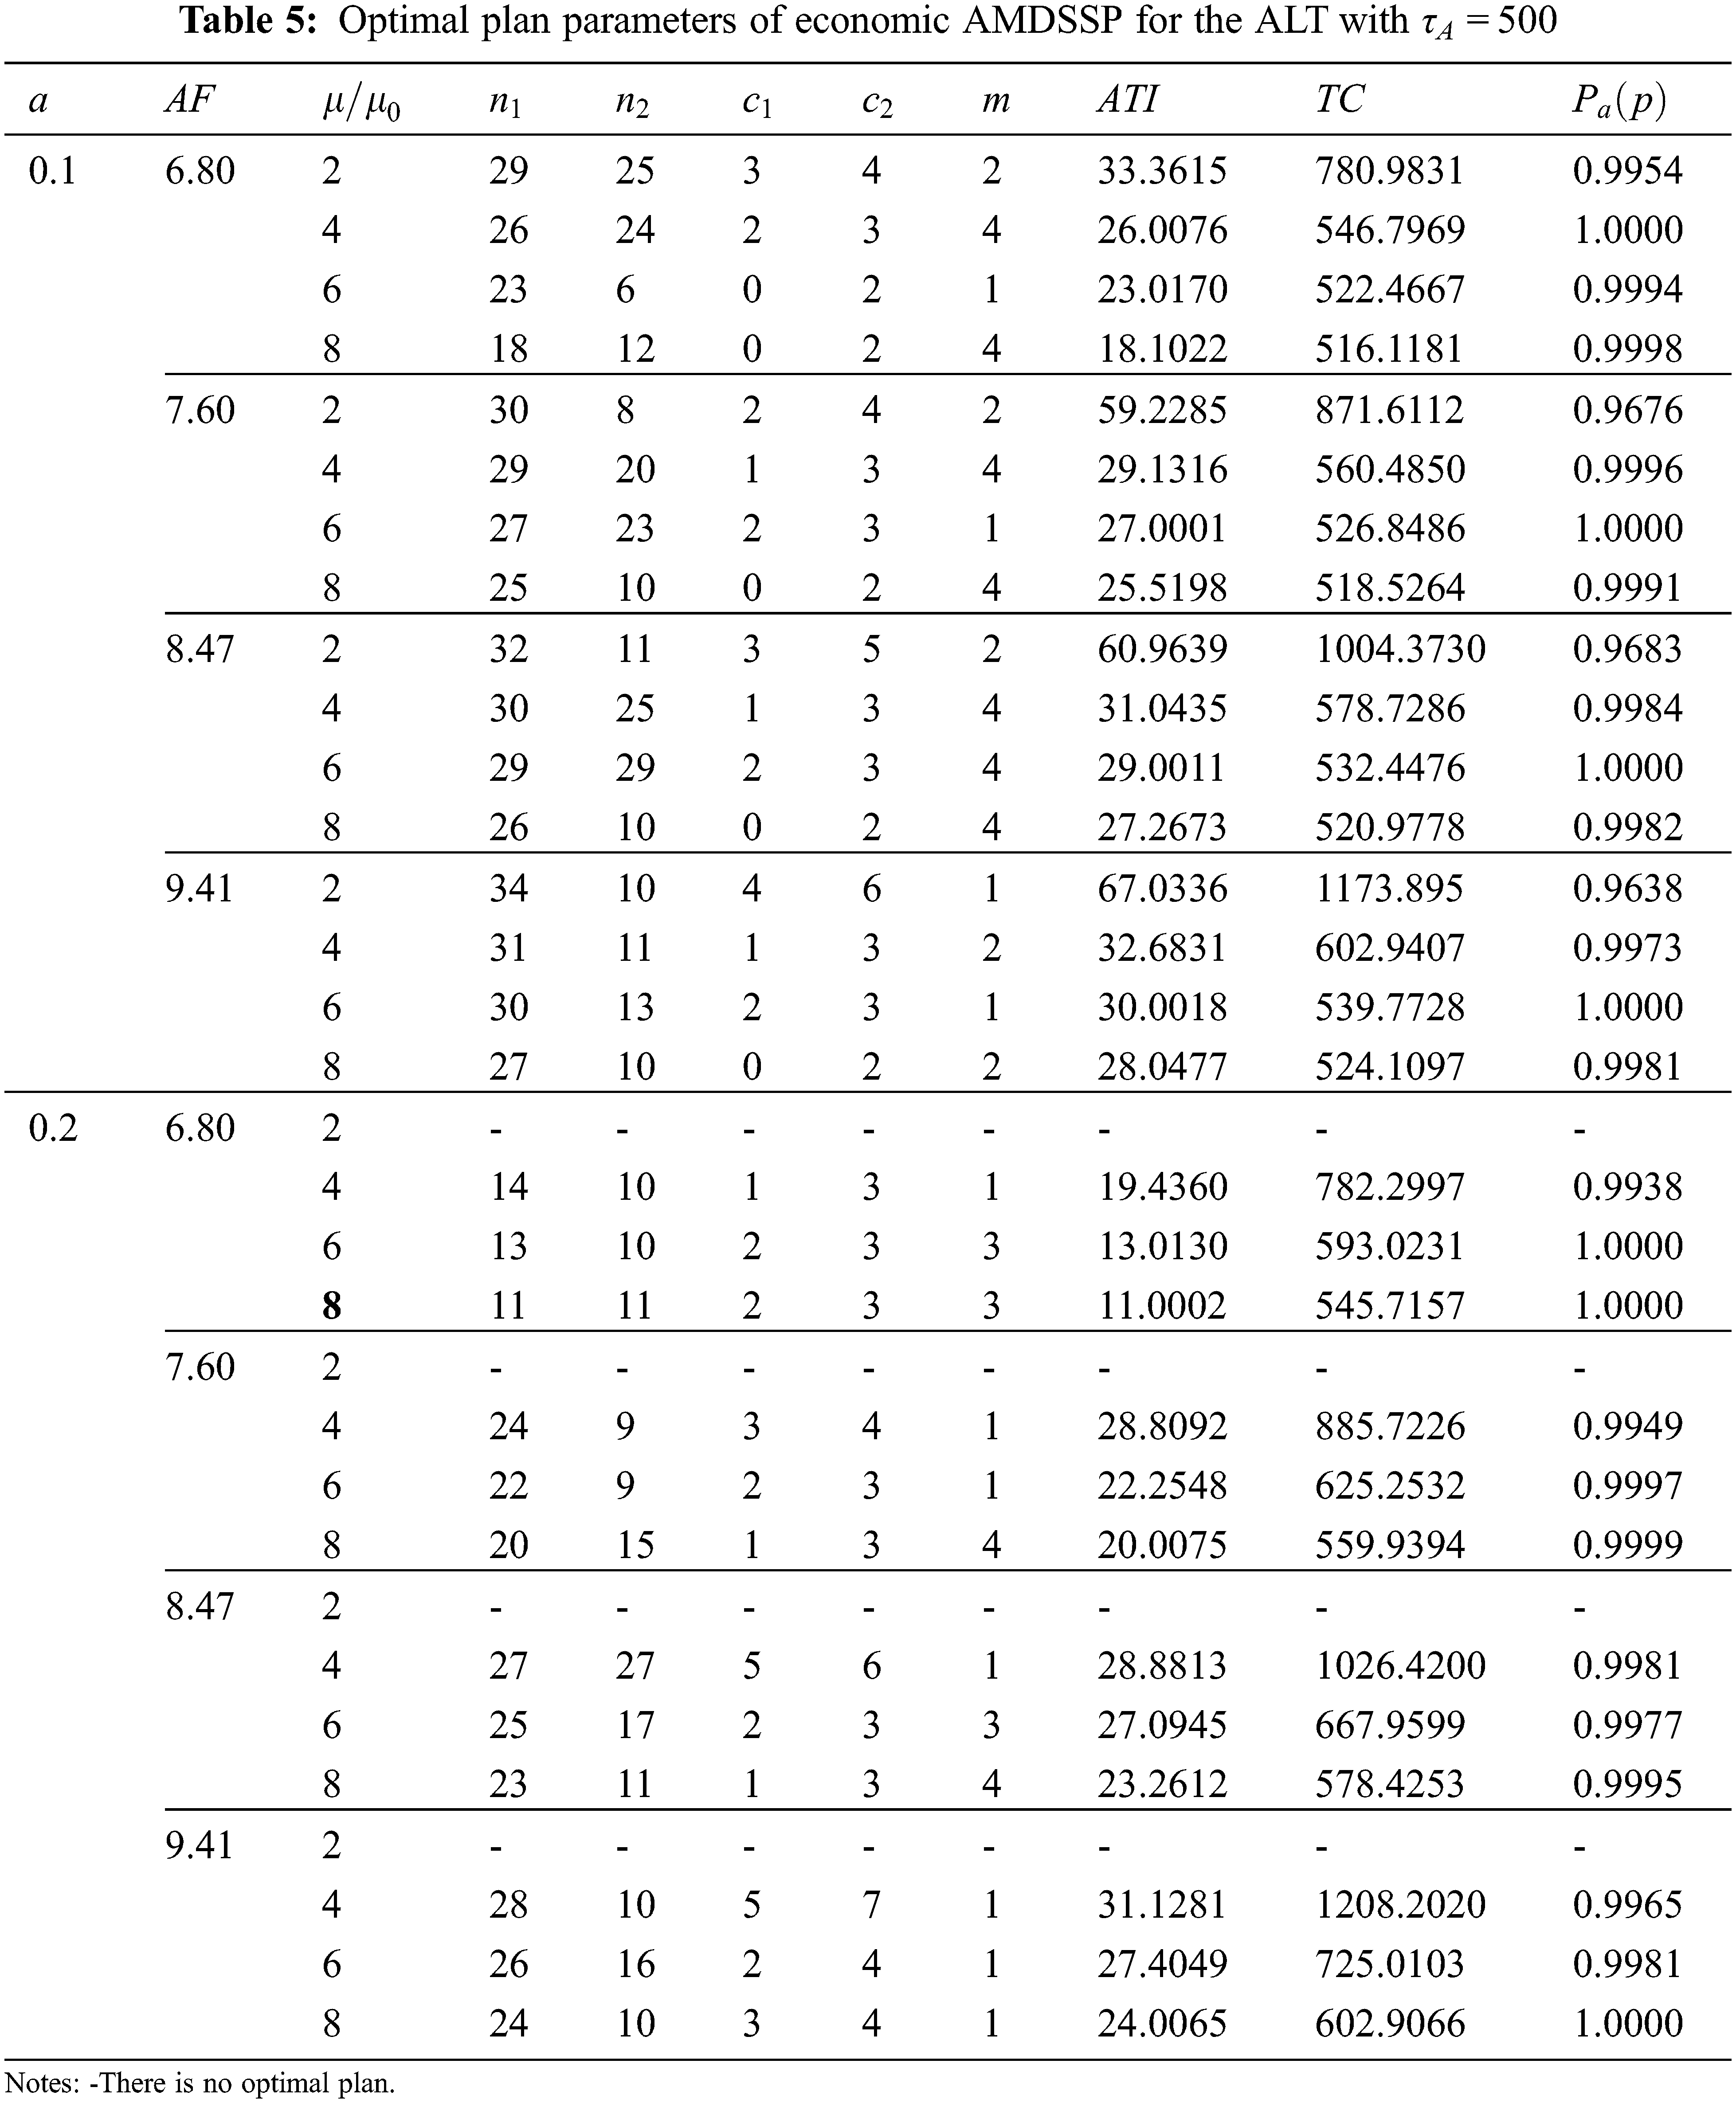
ATI and TC increased if AF increased and τA decreased for fixed value of a and µ/µ0, as shown in Tables 4 and 5. For fixed values of a, AF and τA, ATI and TC decreased when µ/µ0 increased. ATI and TC increased when a increased for fixed values of µ/µ0, AF and τA. From Eq. (17), ATI was correlated in the same direction as TC; if ATI decreased, TC also decreased. From results in Table 4, τA = 250, a = 0.1 and µ/µ0 = 4, TC increased from 296.8704 to 353.1590 when AF changed from 6.80 to 9.41. This means that TC also increased if the manufacturer increased the AF or τA in the ALT.
A comparative study was undertaken between the proposed AMDSSP, MDSSP and an SSP for the ALT when lifetime followed the Weibull distribution. A literature review determined no previous research regarding an MDSSP for the ALT. An SSP for the ALT was proposed by Kim et al. [25]. The performances of AMDSSP, MDSSP and SSP were compared in terms of OC curve, ASN and TC for the same values of specified parameters. All three plans were considered based on the ALT for the Weibull distribution, where δ = 2.5, a = 0.1, AF = 7.60, µ/µ0 = 6, α = 0.05 and β = 0.05. The parameters considered were n1 = 15, n2 = 3, c1 = 0, c2 = 2 and m = 1 for AMDSSP; n = 18, c1 = 0, c2 = 2 and m = 1 for MDSSP and n = 18 and c = 0 for SSP. The OC curve displayed the performance of the three plans as the difference in probabilities of accepting the lot under the same parameters. Fig. 4 shows that the AMDSSP had a higher OC curve compared to MDSSP and SSP for ALT. Moreover, the OC curve of the AMDSSP was consistent with the OC curve of the other two sampling plans when product failure probability increased.

Figure 4: OC curves for AMDSSP, MDSSP and SSP
Results in Table 6 show that performances of AMDSSP, MDSSP and SSP for the ALT followed the Weibull distribution considered under the mean ratio µ/µ0 = 2, 4, 6, 8, α = 0.05 and β = 0.05. To illustrate the effectiveness of the AMDSSP for the ALT, we compared the values of ASN and TC of AMDSSP with MDSSP and SSP. The existing MDSSP and SSP used a single sample to inspect a current lot. Therefore, the value of ATI used in Eq. (17) differed from the proposed plan, that is, ATI = n + (1 − Pa(p))(N − n) [39]. Results showed that both ASN and TC of the AMDSSP were smaller than the MDSSP and SSP for several set parameters. For instance, when AF = 9.41 and µ/µ0 = 2, the ASN of the AMDSSP was 23.0565, while ASN values of MDSSP and SSP were 47 and 62, respectively. In the same way, the TC of the AMDSSP was 933.0939, while the TC of MDSSP and SSP were 935.0012 and 940.0031, respectively. Therefore, the ASN and the total cost for inspection under the accelerated condition decreased when implementing AMDSSP rather than MDSSP and SSP.

5.4 Application of Real Data (Electronic Device)
Two real datasets were used to investigate the performance of the AMDSSP for the ALT under the Weibull distribution. First, the Weibull distribution fit was checked for both datasets. Unknown parameters were estimated using the maximum likelihood method, while the goodness of fit test value was judged using the Kolmogorov-Smirnov (K-S) test. Model-fitting results for two real datasets are shown in Table 7.

Dataset 1. As demonstrated by Pham [38], silicon carbide (SiC) can be used in place of silicon for semiconductor devices, particularly those that operate at high temperatures and electric fields. Temperatures as high as 145°C are used to conduct thorough accelerated life experiments on 6H-SiC metal-oxide-silicon (MOS) capacitors. The following data were recorded for 30 failure time (hours) observations:
From Eq. (2), for use condition temperature (TU) 50°C and accelerated temperature (TA) 145°C, AF = 11.54. Results in Table 7 show that the K-S test result was 0.0946 with a p-value of 0.9279. Therefore, this dataset fitted to the Weibull distribution. The maximum likelihood estimate of shape parameter
From the 11 items, two failures (d1 = 2) were recorded before the censoring time under accelerated condition τA = 928.73 h. Results showed d1 < 4 (d1 < c1). The current lot was accepted as good quality.
Dataset 2. In MOS devices, gate oxide is frequently the cause of device failure, particularly in high-density arrays that require thin gate oxides. For more details, see Pham [38]. A manufacturer ran a 150°C stress test on 25 devices, and the following failure time observations were made:
Suppose TU = 50°C and TA = 145°C. By substituting in Eq. (2), the thermal acceleration factor AF = 12.73. Results in Table 7 show that the K-S test result was 0.1147 with a p-value of 0.8603. Therefore, this dataset fitted the Weibull distribution. The maximum likelihood estimate of shape parameter
Step 1: Select 8 items from the dataset for the first random sample, then put each sample item on the ALT and count the number of nonconforming items (d1) before τA = 463.66 h.
Step 2: If d1 < 2, the current lot will be accepted as good quality. If d1 > 4, the current lot will be rejected. Otherwise, go to step 3.
Step 3: If 2 < d1 < 4, select 4 items from the dataset for the second random sample. Put each sample item on the ALT and count the number of nonconforming items (d2) before τA = 463.66 h. Accept the current lot as moderate quality if d1 + d2 < 4 and the previous lot is good quality. Otherwise, reject the current lot.
This paper proposed an adaptive multiple dependent state sampling plan (AMDSSP) for ALT when the lifetime of the product followed the Weibull distribution. We developed the proposed sample plan using the DSP concept together with the existing MDSSP. Under the accelerated condition, the effect of temperature on the electronic device was considered using the acceleration factor (AF) of the Arrhenius model. The nonlinear optimization technique determined the optimal plan parameters to satisfy consumer’s risk and producer’s risk simultaneously. Tables for optimal plan parameters are presented for values of δ, β, a, AF, µ/µ0 and τA. The ASN value was used to judge the performance of the AMDSSP for ALT. Studies showed that the scale parameters were associated with the AF under accelerated conditions. Higher AF as higher temperature tests, increased the ASN. The illustrative example showed operational process for the AMDSSP for ALTs. An economic design of AMDSSP for ALT was also proposed under three costs for the current lot inspection as cost of the accelerated life test, the expected cost of internal failure per lot and the expected cost of external failure per lot. Optimal proposed plan parameters to achieve the lowest total cost of inspection gave values of a, AF, µ/µ0 and τA. The ATI and TC for inspection determined the effectiveness of the proposed economic model. As AF increased and τA decreased, the ATI and the TC for inspection also increased. Efficacy studies of AMDSSP, MDSSP and SSP for ALT were compared when the lifetime of the product followed the Weibull distribution. Results showed that ASN and TC reduced under accelerated conditions using the AMDSSP rather than MDSSP and SSP. The application considered two real datasets on failure time of electronic devices under temperature stress. These datasets were applied to demonstrate the usability and utility of the proposed sampling plan for ALT. We concluded that the AMDSSP was more flexible, efficient and economical than MDSSP and SSP for ALT following the Weibull distribution. Future studies will consider the AMDSSP under various types of stress for accelerated testing techniques.
Acknowledgement: The authors are highly grateful to the reviewers and editors for taking the time to make their comments and suggestions very helpful to the paper.
Funding Statement: This research was supported by The Science, Research and Innovation Promotion Funding (TSRI) (Grant No. FRB650070/0168). This research block grants was managed under Rajamangala University of Technology Thanyaburi (FRB65E0634M.3).
Conflicts of Interest: The authors declare that they have no conflicts of interest to report regarding the present study.
References
1. E. G. Schilling and D. V. Neubauer, “Single sampling by attributes,” in Acceptance Sampling in Quality Control, New York, USA: Taylor & Francis, pp. 89–90, 2009. [Google Scholar]
2. L. -F. Hsu and J. -T. Hsu, “Economic design of acceptance sampling plans in a two-stage supply chain,” Advances in Decision Sciences, vol. 2012, pp. 1–14, 2012. [Google Scholar]
3. M. Amitava, “Advantages and disadvantages of sampling plan,” in Fundamentals of Quality Control and Improvement, New Jorsey, USA: John Wiley & Sons, pp. 510–511, 2016. [Google Scholar]
4. A. W. Wortham and R. C. Baker, “Multiple deferred state sampling inspection,” International Journal of Production Research, vol. 14, pp. 719–731, 1976. [Google Scholar]
5. K. Govindaraju and K. Subramani, “Selection of multiple deferred (dependent) state sampling plans for given acceptable quality level and limiting quality level,” Journal of Applied Statistics, vol. 20, pp. 423–428, 1993. [Google Scholar]
6. S. Balamurali and C. H. Jun, “Multiple dependent state sampling plans for lot acceptance based on measurement data,” European Journal of Operational Research, vol. 180, no. 3, pp. 1221–1230, 2007. [Google Scholar]
7. S. Balamurali, P. Jeyadurga and M. Usha, “Designing of Bayesian multiple deferred state sampling plan based on gamma-poisson distribution,” American Journal of Mathematical and Management Sciences, vol. 35, no. 1, pp. 77–90, 2016. [Google Scholar]
8. M. Aslam, A. Nazir and C. H. Jun, “A new attribute control chart using multiple dependent state sampling,” Transactions of the Institute of Measurement and Control, vol. 37, no. 4, pp. 569–576, 2017. [Google Scholar]
9. W. Zhou, Q. Wan, Y. Zheng and Y. W. Zhou, “A joint-adaptive np control chart with multiple dependent state sampling scheme,” Communications in Statistics-Theory and Methods, vol. 46, no. 14, pp. 6967–6979, 2017. [Google Scholar]
10. N. Khan and M. Aslam, “Design of an EWMA adaptive control chart using MDS sampling,” Journal of Statistics and Management Systems, vol. 22, no. 3, pp. 535–555, 2019. [Google Scholar]
11. N. Khan, L. Ahmad, G. S. Rao, M. Aslam and A. H. Al-Marshadi, “A new X-bar control chart for multiple dependent state sampling using neutrosophic exponentially weighted moving average statistics with application to monitoring road accidents and road injuries,” International Journal of Computational Intelligence, vol. 14, Article ID 182, pp. 1–11, 2021. [Google Scholar]
12. N. Khan and M. Aslam, “Monitoring road accident and injury using indeterminacy based shewhart control chart usingmultiple dependent state repetitive sampling,” International Journal of Injury Control and Safety Promotion, vol. 29, no. 3, pp. 331–339, 2022. [Google Scholar]
13. G. S. Rao, M. Aslam and C. -H. Jun, “A variable sampling plan using generalized multiple dependent state based on a one-sided process capability index,” Communications in Statistics-Simulation and Computation, vol. 50, no. 9, pp. 2666–2677, 2021. [Google Scholar]
14. M. Aslam, G. S. Rao and M. Albassam, “Time truncated life tests using the generalized multiple dependent state sampling plans for various life distributions,” in Statistical Quality Technologies. ICSA Book Series in Statistics, Cham, Switzerland: Springer, pp. 153–182, 2019. [Google Scholar]
15. M. Aslam, P. Jeyadurga, S. Balamurali, M. Azam and A. Al-Marshadi, “Economic determination of modified multiple dependent state sampling plan under some lifetime distributions,” Journal of Mathematics, vol. 2021, Article ID 7470196, pp. 1–13, 2021. [Google Scholar]
16. P. Charongrattanasakul, W. Bamrungsetthapong and P. Kumam, “A novel multiple dependent state sampling plan based on time truncated life tests using mean lifetime,” Computers, Materials & Continua, vol. 73, no. 3, pp. 4611–4626, 2022. [Google Scholar]
17. W. Hafeez and N. Aziz, “Bayesian group chain sampling plan based on beta binomial distribution through quality region,” International Journal of Supply Chain Management, vol. 8, no. 6, pp. 1175–1180, 2019. [Google Scholar]
18. W. Hafeez and N. Aziz, “Bayesian group chain sampling plan for poisson distribution with gamma prior,” Computers, Materials & Continua, vol. 67, no. 3, pp. 165–174, 2021. [Google Scholar]
19. W. Hafeez and N. Aziz, “Designing Bayesian two-sided group chain sampling plan for gamma prior distribution,” Computer Systems Science and Engineering, vol. 44, no. 2, pp. 1069–1079, 2023. [Google Scholar]
20. H. Tripathi, M. Saha and V. Alha, “An application of time truncated single acceptance sampling inspection plan based on generalized half-normal distribution,” Annals of Data Science, pp. 1–13, 2020. https://doi.org/10.1007/s40745-020-00267-z. [Google Scholar]
21. G. S. Rao, K. Rosaiah and C. R. Naidu, “Design of multiple-deferred state sampling plans for exponentiated half logistic distribution,” Cogent Mathematics & Statistics, vol. 7, no. 1, pp. 1–14, 2020. [Google Scholar]
22. A. I. Al-Omari, I. M. Almanjahie and O. Kravchuk, “Acceptance sampling plans with truncated life tests for the length-biased weighted lomax distribution,” Computers, Materials & Continua, vol. 67, no. 1, pp. 285–300, 2021. [Google Scholar]
23. H. Tripathi, A. I. Al-Omari, M. Saha and A. R. A. Alanzi, “Improved attribute chain sampling plan for darna distribution,” Computer Systems Science and Engineering, vol. 38, no. 3, pp. 381–392, 2021. [Google Scholar]
24. T. A. Abushal, A. S. Hassan, A. R. El-Saeed and S. G. Nassr, “Power inverted topp–leone distribution in acceptance sampling plans,” Computers, Materials & Continua, vol. 67, no. 1, pp. 991–1011, 2021. [Google Scholar]
25. M. Kim and B. -J. Yum, “Life test sampling plans for weibull distributed lifetimes under accelerated hybrid censoring,” Statistical Papers, vol. 52, no. 2, pp. 327–342, 2011. [Google Scholar]
26. P. Gao and X. Li, “Acceptance sampling plan of accelerated life testing for exponential distribution under time-censoring,” in 2014 Reliability and Maintainability Symp., Colorado Springs, CO, USA, pp. 1–6, 2014. [Google Scholar]
27. M. Aslam, C. -H. Jun and A. Arshad, “SkSP-V sampling plan for accelerated life tests,” Journal of Risk and Reliability, vol. 229, no. 3, pp. 193–199, 2015. [Google Scholar]
28. M. Aslam, N. Khan and C. -H. Jun, “Group SkSP-R sampling plan for accelerated life tests,” Sadhana, vol. 42, pp. 1783–1791, 2017. [Google Scholar]
29. M. M. Mohie El-Din, S. E. Abu-Youssef, N. S. Ali and A. M. Abd El-Raheem, “Estimation in constant-stress accelerated life tests for extension of the exponential distribution under progressive censoring,” Metron, vol. 74, no. 2, pp. 253–273, 2016. [Google Scholar]
30. M. M. Mohie El-Din, M. M. Amein, A. M. Abd El-Raheem, E. H. Hafez and F. H. Riad, “Bayesian inference on progressive-stress accelerated life testing for the exponentiated weibull distribution under progressive type-II censoring,” Journal of Statistics Applications & Probability Letters, vol. 7, no. 3, pp. 109–126, 2020. [Google Scholar]
31. A. M. Abd El-Raheem, E. M. Almetwally, M. S. Mohamed and E. H. Hafez, “Accelerated life tests for modified kies exponential lifetime distribution: Binomial removal, transformers turn insulation application and numerical results,” AIMS Mathematics, vol. 6, no. 5, pp. 5222–5255, 2021. [Google Scholar]
32. T. A. Abushal and A. H. Abdel-Hamid, “Inference on a new distribution under progressive-stress accelerated life tests and progressive type-II censoring based on a series-parallel system,” AIMS Mathematics, vol. 7, no. 1, pp. 425–454, 2022. [Google Scholar]
33. S. Qin, B. X. Wang, W. Wu and C. Ma, “The prediction intervals of remaining useful life based on constant stress accelerated life test data,” European Journal of Operational Research, vol. 301, no. 2, pp. 747–755, 2022. [Google Scholar]
34. M. Aslam, M. Azam, S. Balamurali and C. H. Jun, “An economic design of a group sampling plan for a weibull distribution using a Bayesian approach,” Journal of Testing and Evaluation, vol. 43, no. 6, pp. 497–1503, 2014. [Google Scholar]
35. M. S. Fallahnezhad, T. JafariNodoushan, M. S. Owlia and M. H. Abooie, “Designing an economic repetitive sampling plan in the presence of two markets,” IJE Transactions A: Basics, vol. 30, no. 7, pp. 1017–1028, 2017. [Google Scholar]
36. S. Balamurali, P. Jeyadurga and M. Usha, “Economic design of quick switching sampling system for assuring weibull distributed mean life,” Communications in Statistics-Theory and Methods, vol. 47, pp. 385–398, 2018. [Google Scholar]
37. N. Hakamipour, “Comparison between constant-stress and step-stress accelerated life tests under a cost constraint for progressive type I censoring,” Sequential Analysis, vol. 40, no. 1, pp. 17–31, 2021. [Google Scholar]
38. H. Pham, “The Arrhenius model, dataset of acceleration model,” in Handbook of Reliability Engineering, England, UK: Springer London Limited, pp. 419–423, 2003. [Google Scholar]
39. D. C. Montgomery, “The average total inspection of double sapling plan,” in Introduction to Statistical Quality Control, 7th ed, New York, USA: John Wiley & Sons, pp. 669, 2012. [Google Scholar]
Cite This Article
 Copyright © 2023 The Author(s). Published by Tech Science Press.
This work is licensed under a Creative Commons Attribution 4.0 International License , which permits unrestricted use, distribution, and reproduction in any medium, provided the original work is properly cited.
 Downloads
 Citation Tools