
 Submit a Paper
 Propose a Special lssue
 Open Access
ARTICLE

Machine-Learning-Enabled Obesity Level Prediction Through Electronic Health Records
1 Department of Surgery, College of Medicine, Najran University, Najran, 61441, Saudi Arabia
2 Department of Computer Science, Edge Hill University, St Helens Rd, Ormskirk, L39 4QP, UK
3 Electrical Engineering Department, College of Engineering, Najran University, Najran, 61441, Saudi Arabia
4 Department of Computer Science, Aston University, Birmingham, B4 7ET, UK
* Corresponding Author: Muhammad Awais. Email:
Computer Systems Science and Engineering 2023, 46(3), 3715-3728. https://doi.org/10.32604/csse.2023.035687
Received 31 August 2022; Accepted 02 February 2023; Issue published 03 April 2023
 View Full Text
 Download PDF
Abstract
Obesity is a critical health condition that severely affects an individual’s quality of life and well-being. The occurrence of obesity is strongly associated with extreme health conditions, such as cardiac diseases, diabetes, hypertension, and some types of cancer. Therefore, it is vital to avoid obesity and or reverse its occurrence. Incorporating healthy food habits and an active lifestyle can help to prevent obesity. In this regard, artificial intelligence (AI) can play an important role in estimating health conditions and detecting obesity and its types. This study aims to see obesity levels in adults by implementing AI-enabled machine learning on a real-life dataset. This dataset is in the form of electronic health records (EHR) containing data on several aspects of daily living, such as dietary habits, physical conditions, and lifestyle variables for various participants with different health conditions (underweight, normal, overweight, and obesity type I, II and III), expressed in terms of a variety of features or parameters, such as physical condition, food intake, lifestyle and mode of transportation. Three classifiers, i.e., eXtreme gradient boosting classifier (XGB), support vector machine (SVM), and artificial neural network (ANN), are implemented to detect the status of several conditions, including obesity types. The findings indicate that the proposed XGB-based system outperforms the existing obesity level estimation methods, achieving overall performance rates of 98.5% and 99.6% in the scenarios explored.Keywords
Obesity is the leading cause of a variety of health issues, both alone and in conjunction with other conditions [1,2]. Obesity is directly linked to several diseases, including respiratory problems, diabetes, heart issues, some cancer types, cholesterol, and osteoarthritis [3,4]. The adverse effects of excess weight can take ten years or more. Increased weight is also a strong indicator of shorter longevity.
Different methods are used to determine the appropriate weight and identify instances of obesity and overweight. Excess fat in the body is the main reason for obesity. Body fat is evaluated with ease using a relationship considering both the height and weight of a person. In evaluation, it is assumed that the importance of individuals of the same size is primarily changed depending on body fat. One of the most commonly used fat quantification mechanisms is the body mass index (BMI), whereas other techniques, such as waist circumference, skinfold thickness, and bioimpedance, are also considered. Among different classification grades for obesity, BMI readings provide essential information regarding increasing fat in the body and the classification of body mass/weight [3]. It enables effective weight comparisons among different groups and identifies individuals at higher risk. It also helps in determining intervention priorities in individuals and within the community. BMI, in some cases, also serves as a measure to evaluate the impact of weight control interventions. Though BMI is widely accepted, it is worth mentioning that variances in body fat and muscle proportions restrict BMI’s application as an effective measure in all cases. It also does not consider the vast differences like obesity among people. Therefore, BMI is not ideal for diagnosing obesity, as exceptionally muscular people might have a higher BMI while having significantly less fat. However, in most cases, it is a good indicator of a healthy weight. Waist size, another measure to indicate extra fat, is also used to evaluate those carrying excess weight (25 < BMI < 29.9) or those who are obese (30 < BMI < 34.9) [3].
As stated above, obesity is a well-documented cause of significant health risks, including type 2 diabetes, coronary heart disease, stroke, etc. [3,5]. Obesity also results in psychological issues. Therefore, it is vital to minimize such risks by implementing weight control.
Obesity results from consuming more calories—especially those found in high-sugar and high-fat foods—than one burns with activity/exercise. The additional calories an individual consumes are stored in the body as fat. Adopting a modern lifestyle with working office environments and easy access to low-cost and high-calorie food is one of the leading causes of obesity. While a poor diet and a sedentary lifestyle are primary factors contributing to obesity, underactive thyroid glands could also result in health issues and weight gain. However, if managed effectively with suitable medication, these health issues could be addressed before they manifest.
Obesity can be effectively countered by maintaining a low-calorie, nutritious diet and engaging in physical activity and sports. Help can be sought from doctors or weight-loss specialists to determine dietary plans. Using low-fat and low-calorie food allows for maintaining a healthy balance between calorie intake and consumption. A suitable exercise routine is also recommended to be adopted to manage weight more effectively. Joining a local weight-loss club and committing to 30 to 60 min of activity daily, such as rapid walking, running, swimming, or tennis helps maintain healthy living. Eating carefully and avoiding circumstances that could lead to overeating should also be considered.
Along with these, sometimes, it is worth considering psychological counseling to improve long-standing poor eating habits. Sometimes, lifestyle changes are insufficient, and orlistat can be prescribed. It works by lowering the fat absorbed while digesting food, thus reducing the overall fat accumulation within the body due to dietary intake. Weight loss surgery may be suggested in specific instances. Some techniques used to lose weight are shown in Fig. 1. These include healthy eating, exercise, surgery, and counseling-based interventions.
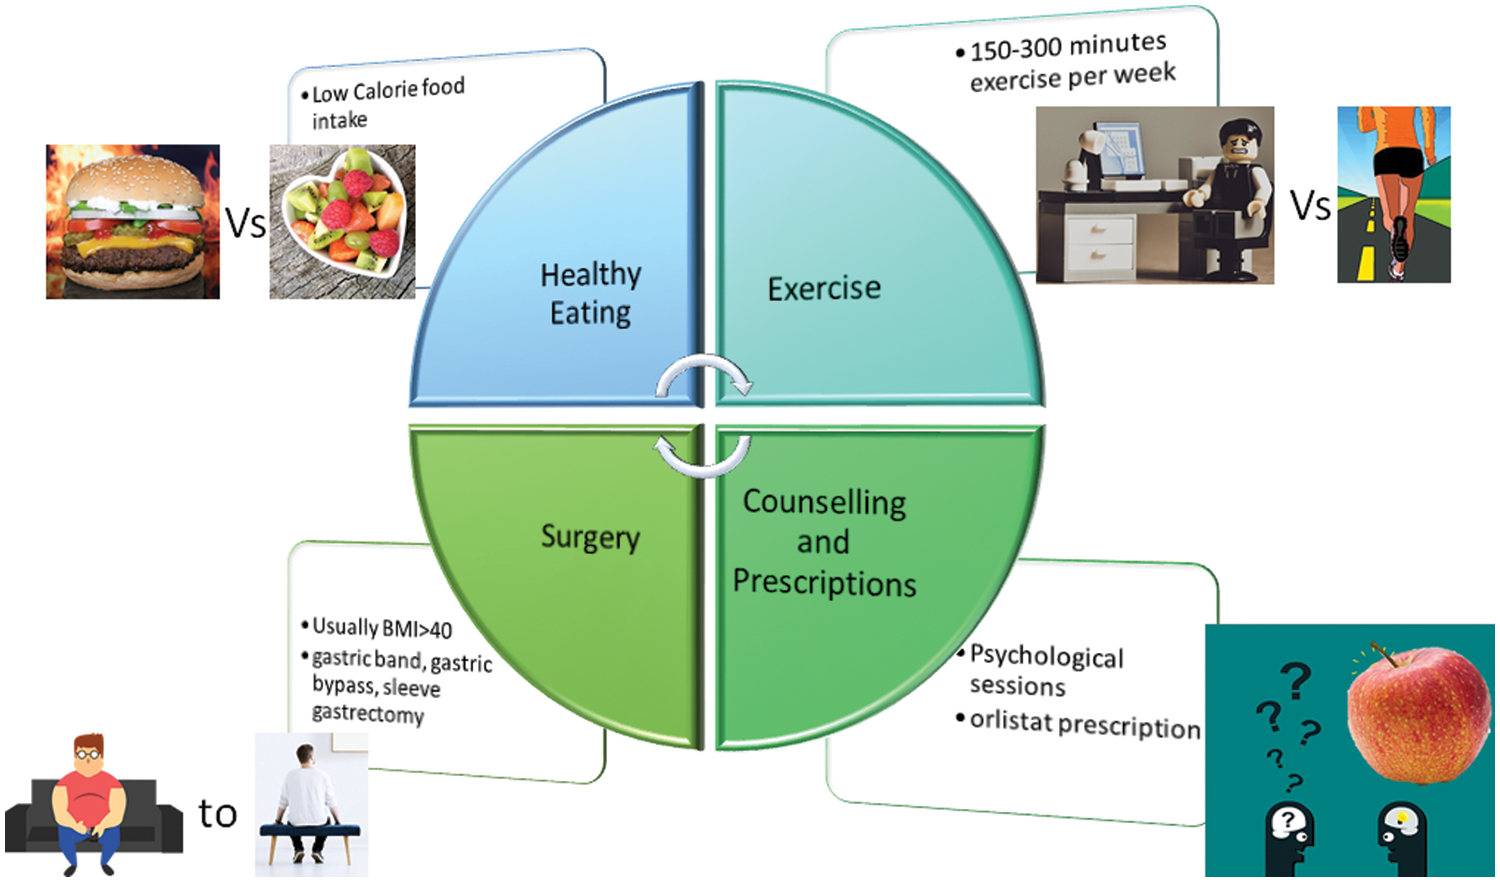
Figure 1: Obesity challenges and treatments
All the presented measures to counter obesity and lose weight have a notable impact and can be chosen if the need arises. However, exercise and food intake play a central role in maintaining a healthy weight. While exercise is as important as diet, this paper focuses on dietary intake and how it can help lose weight. Diet plays a significant role in healthy living, and it is, therefore, necessary to understand the body’s dietary needs to introduce suitable interventions.
Food is a source of energy to enable the body’s internal functions (blood circulation, body heat generation, respiration, etc.) and actions (walking, running, moving limbs, etc.). A healthy weight can be maintained with suitable food intake and the incorporation of regular exercise. On average, a male with moderate physical activity requires 2500 calories per day, whereas a female with moderate physical activity requires 2,000 calories per day. These calorie requirements might seem plentiful; however, a large meal with fries, a burger, and a cold drink could amount to 1,400 calories. Another issue is the lack of physical activity in individuals to balance the overconsumption of calories. Thus, the additional calories consumed will contribute to body fat. Obesity does not appear spontaneously. It develops with time and, in most cases, due to poor dietary choices, which may include eating processed food, fast food, and takeaways; the consumption of food with a high fat and sugar content; drinking alcohol and other beverages; eating out regularly; eating large portions; and eating more than required.
It is evident that diet plays a very important role in controlling weight in the majority of cases. A well-planned diet can make a significant difference. However, it is not always easy to follow diet plans alone. Tracking one’s calorie intake and balancing one’s intake against one’s consumption is a major challenge. To assist in such circumstances, it is very important to leverage technology-driven state-of-the-art solutions for improved outcomes. As stated earlier, obesity does not occur overnight; rather, it takes time to develop. Therefore, any eating habits adopted in the present and their impact in the future cannot be realized using conventional techniques. Thus, it is important to introduce state-of-the-art machine learning techniques to evaluate eating habits and life choices and predict their impact in the future. Such technology-driven interventions will not only allow the visualization of slips in following dietary plans but also provide predictions of negative events if a trend continues over an extended period of time. The contributions of the work are as follows:
• To develop a machine-learning-based obesity level prediction system using a variety of features, such as dietary habits, lifestyle, health conditions, and mode of transportation.
• To compare the performance of the proposed machine-learning-based system with the state-of-the-art method to predict obesity levels.
The rest of the paper is organized as follows. The literature review is presented in Section 2. Section 3 discusses the methodology, including the dataset, data processing, machine-learning-based classification algorithm, and experimental setup for obesity analysis. The results and discussion are presented in Section 4, whereas the concluding remarks are presented in Section 5.
Predictive models have recently shown much promise in predicting future health outcomes in a variety of biomedical applications. This trend has also been witnessed in a number of non-biomedical areas [5,6]. Due to the fast expansion of big data in the medical domain, clinical prediction models have become more common and widely used. The majority of prediction models developed in the past were based on regression and statistical analysis [7]. However, recently, deep learning techniques have been widely adopted to develop predictive models [8].
Obesity presents a great risk to one’s health and is a cause of several other diseases [4]. Due to its significance, numerous studies have proposed the use of machine learning to predict obesity and obesity-related issues [5].
Linear regression is a widely used modeling tool in obesity research [9,10]. The 3,500-calorie rule (where 3500 kcal = 1 lb) was derived using regression [10]. Regression was also used to evaluate the resting metabolic rate of individuals [10]. Similarly, the use of logistic regression was adopted to evaluate the overall impact of diet [11].
Recurrent Neural Networks (RNNs) have been used in a variety of clinical prediction models to predict health issues such as high blood pressure [12], heart failure [13], diabetes [14], and readmission to hospital [15]. To mention a few instances, an RNN with long short-term memory (LSTM) was employed by [14,15] to predict readmission to the hospital for diabetic mental health patients. Despite the urgent need, little work has been accomplished in obesity prediction modeling using large-scale datasets and advanced machine-learning approaches. Most of the available research is based on classical machine-learning techniques. Random forest [16] and logistic/linear regression [17–19] are two examples of research that has employed chosen perinatal parameters, including BMI and birth weight. In [20], the authors evaluated several multivariate regression approaches and multi-layer perceptron (MLP) feed-forward neural network models to predict teenaged BMI from prior BMI values. Around 90% accuracy was achieved in this work.
A method was developed to classify the cardiovascular disease by [21]. The classifiers were developed using autosklearn, which is a widely used autonomous machine learning toolkit. This machine learning toolkit was tested on the cardiac University of California Irvine (UCI) dataset, as well as a cardiovascular disease dataset with 70 K patient records. The results showed that the proposed method achieved better performance than the conventional machine learning techniques.
In [22], the authors used machine learning techniques to predict weight from food intake and exercise routines. The study advocated for a support vector machine (SVM) based on its performance.
In [23], the authors proposed ensemble classifiers to predict obesity using major characteristics such as age, height, weight, and BMI. The ensemble classifier used a generalized linear model, partial least squares, and a random forest. Over 89% percent accuracy was achieved.
In another study presented in [24], the authors evaluated a number of machine learning techniques to predict obesity-related risks in high school students. The work implemented decision trees, regression, artificial neural networks, and weighted k-nearest neighbors. The results showed good accuracy; however, the best performance was observed in the case of weighted k-nearest neighbors, where an accuracy rate of over 88% was achieved.
Although there are numerous machine learning techniques used to predict obesity and closely related health issues, there is still very limited work exploring the variety of parameters or variables that can predict obesity. These parameters are related to eating habits, lifestyle, physical conditions, and modes of transportation. It is evident that all these parameters can play a crucial role in predicting obesity. Moreover, it is vital to not only detect obesity itself but also to classify the different obesity levels, i.e., type I, II, and III. Therefore, this paper implements a state-of-the-art machine learning algorithm to detect a variety of health conditions (underweight, normal, overweight, obesity type I, II, III) in different scenarios. The findings of the proposed work are also compared with the state-of-the-art method in the domain.
The dataset used in this study is publicly available [25] in the form of electronic health records (EHR). A total of 2111 participants took part in this study. The participants were aged between 14 and 61 years. The EHR dataset comprised a variety of variables ranging from food intake, physical condition, lifestyle, eating habits, and body measures. The total number of variables or features collected through the survey was 17, as shown in Table 1.
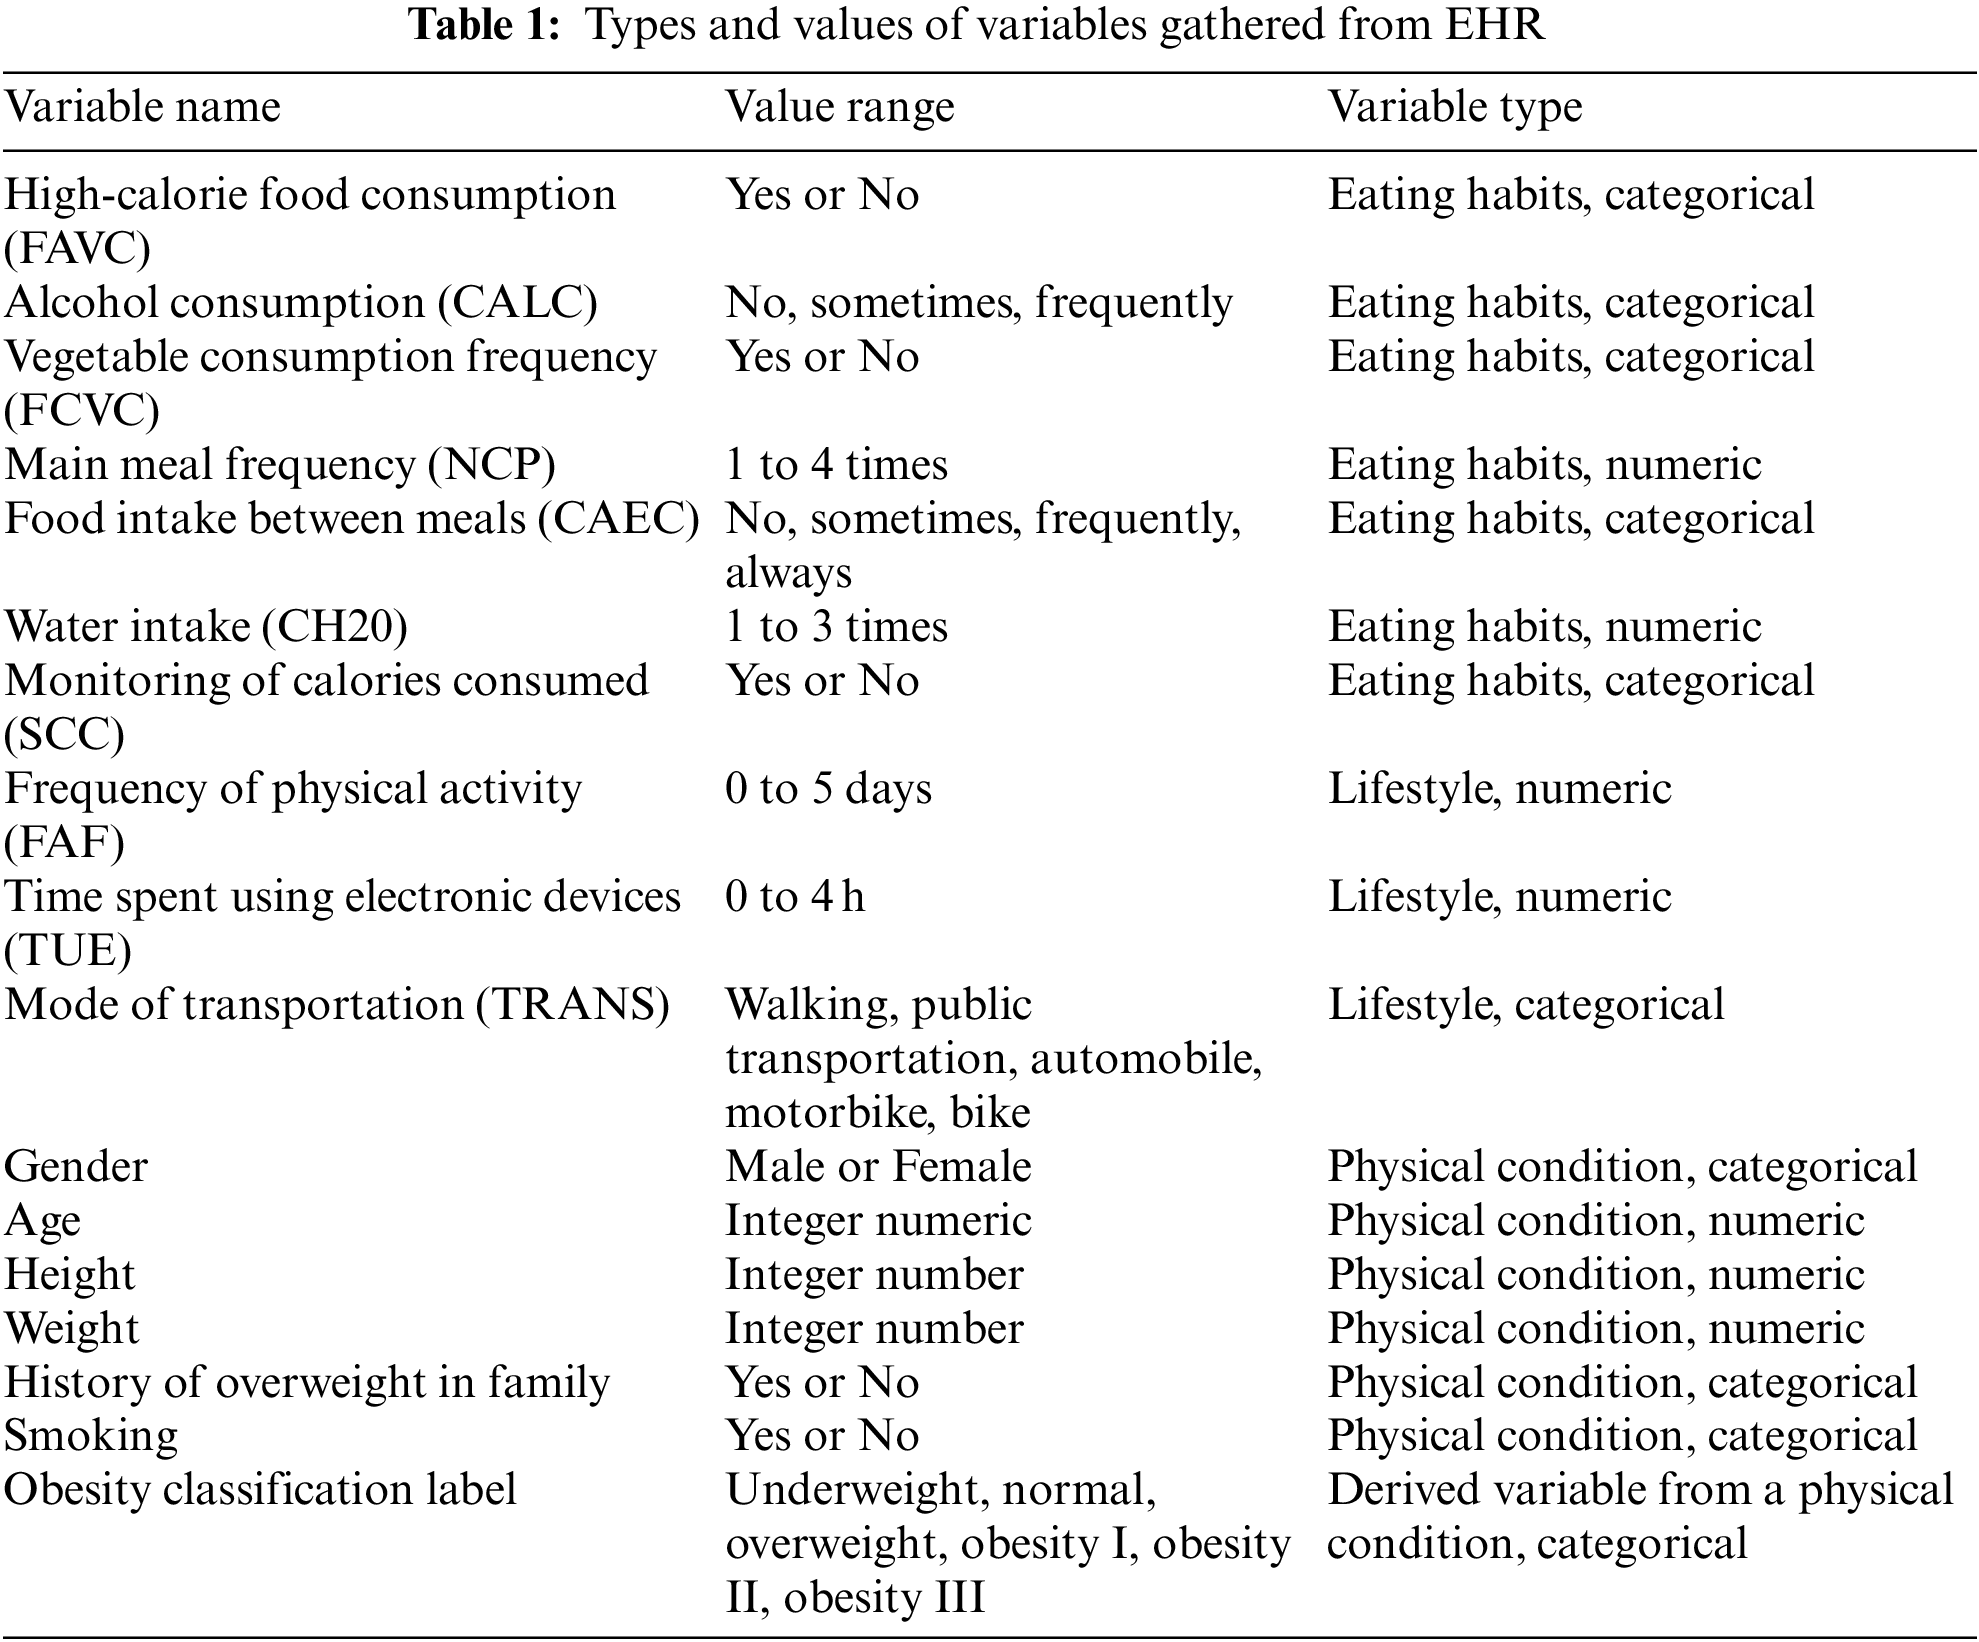
Table 1 reports 17 variables collected in the data collection stage. The variable “Obesity Classification Label” is used as the target variable, while others are used as feature variables or features of the obesity classification system. This variable is predicted using by feeding the rest of the variables (16) in Table 1 into the machine learning algorithm. The machine learning algorithm is described in the next section. It is evident from Table 1 that the collected variables are a combination of categorical and numeric variables, where 9 out of 16 are categorical, and the rest are numerical. Therefore, all the categorical variables were converted into numerical form to ensure uniformity in the feature space with respect to the type of variables. For this purpose, the built-in label encoder of Python’s pre-processing sklearn library [26] was utilized.
The ground truth variable or target variable is very important in supervised machine learning to achieve the underlying objectives. The obesity classification problem is a supervised problem where the sample is categorized into different body compositions. The dataset used body mass index (BMI) as a categorization variable to divide the collected data samples into six body conditions [27], i.e., underweight (BMI < 18.5), normal (18.5 < BMI < 24.9), overweight (25 < BMI < 29.9), Obesity Type I (30 < BMI < 34.9), Obesity Type II (35 < BMI < 39.9) and Obesity Type III (BMI > 40).
3.4 Obesity Classification Using Machine Learning
The numerical variables obtained in the data processing stage were fed into the machine learning model. The choice of machine learning classifiers is very important and plays an important role in classifying the output classes. Three well-known machine learning classifiers are implemented in the work to compare the performance and to investigate which classifier performs the best in classifying the different obesity levels. Three classifiers are used, i.e., eXtreme gradient boosting (XGB), support vector machine (SVM), and artificial neural network (ANN). SVM is known for the maximum separation between the hyperplanes, ensemble classifier XGB is very helpful when dealing with a combination of categorical and numerical variables and ANN is useful due to the hidden layers providing in-depth feature computations. The ANN model used here is the basic multi-layer perceptron (MLP). All the classifiers are implemented in Python to distinguish obesity-related classes (Obesity Type I, Obesity Type II and Obesity Type III) from non-obesity classes (underweight, normal, overweight). The block diagram of the proposed machine learning-based methods used to predict different obesity levels is presented in Fig. 2.
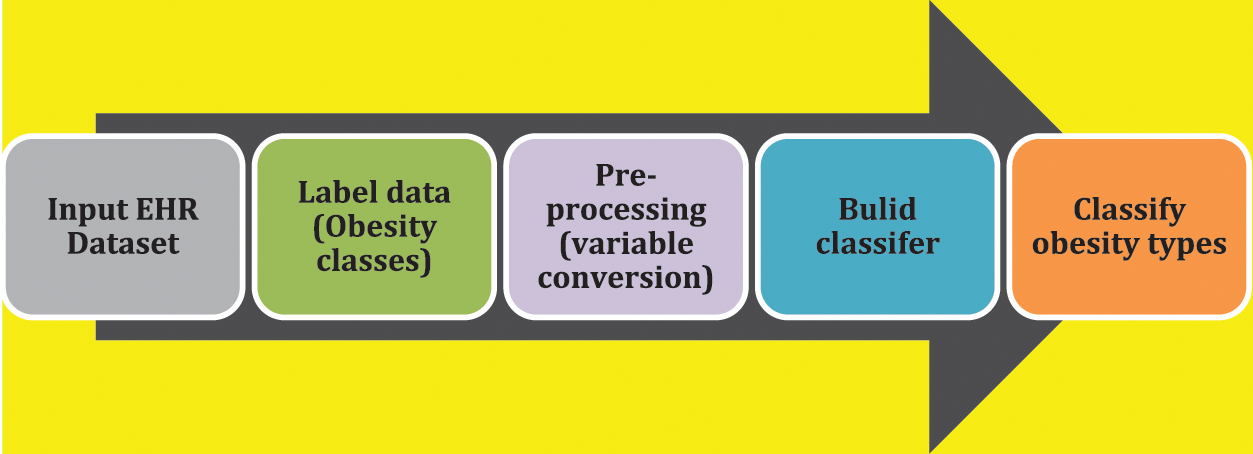
Figure 2: Data processing pipeline of proposed machine learning-based obesity level prediction method
The XGB classifier was recently introduced and has been extensively used in machine learning techniques due to its prediction power, achieved by combining a variety of different weak estimators [28,29]. The reason behind its high performance is that combining the performance of many estimators can improve the overall accuracy, which otherwise can be low if they are implemented separately. Moreover, the XGB performs better than the standard gradient-boosting classifiers due to the utilization of efficient and improved approximation methods and their optimal execution.
The optimization objective function used for regularization in XGB [30–32] is presented in Eq. (1).
L^((t)) describes the objective function, n ← training examples, t ← the tree iteration, I ← instances of the training sample, x_i ← input data parameters, y_i ← the actual values, y_i ← predicted values, f_t ← the tree iteration function, Ω(f_t) ← model complexity.
The experimentation parameters for each classifier are as follows. For the ANN, the hidden layer size is 10; the activation function is ‘relu,’ solver is ‘adam’, and the maximum iteration of 1500. For SVM, the linear kernel is used with a complexity of 1. For XGB, gbtree is used as boosting tree; maximum depth is 6, and minimum child weight is 1.
3.5 Experimentation Scenarios for Obesity Classification
There are two scenarios created to test the performance of the proposed XGB-based machine learning classifier, as shown in Table 2. Scenario 1 contains the original dataset with the original number of samples (2117), and the ground truth variable contains all the original classes (underweight, normal, overweight, Obesity Type I, Obesity Type II, Obesity Type III). Scenario 2 focuses only on obese adults and normal-weight adults and does not consider the underweight or overweight classes for analysis purposes. Scenario 2 considers a dataset of 1259 adults. A 70/30 train/test split is used to divide the dataset samples into training and testing sets. The rationale behind using this train/test split is due to the fact this is the more commonly used train/test split in machine learning. Moreover, Scenario 1 in this work is similar to the original work of the authors [27] who built the dataset; therefore, it would be more appropriate and fair to compare the performance of both works.
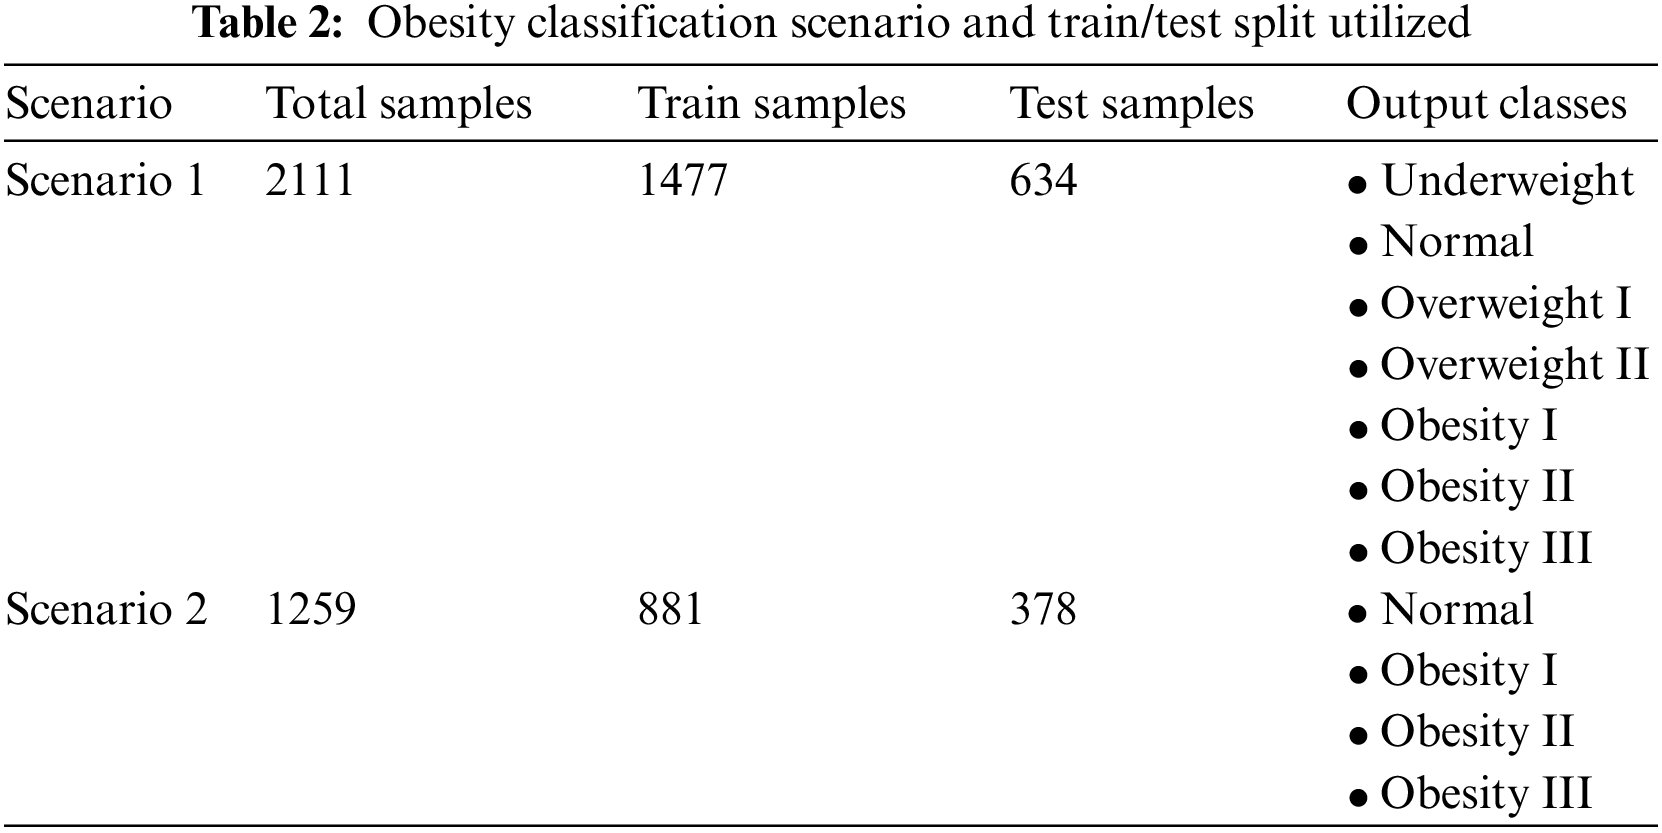
Scenario 2 is also very important since it aims to distinguish between normal adults and adults with different levels of obesity, i.e., Obesity Type I, Obesity Type II, and Obesity Type III.
The study utilized the F-score to measure the performance of the machine-learning-based obesity classification system. The F-measure is more reliable than accuracy when the dataset is imbalanced or skewed, as it provides detailed insights into the detection capabilities of each class. The macro average of the F-measure is used in this study, where the F-score by class is computed for each category (please see output classes column in Table 2.) using the expression in Eq. (2) and then averaged across the total number of classes to obtain an overall F-score. The F-score and performance will be used interchangeably throughout the rest of the paper.
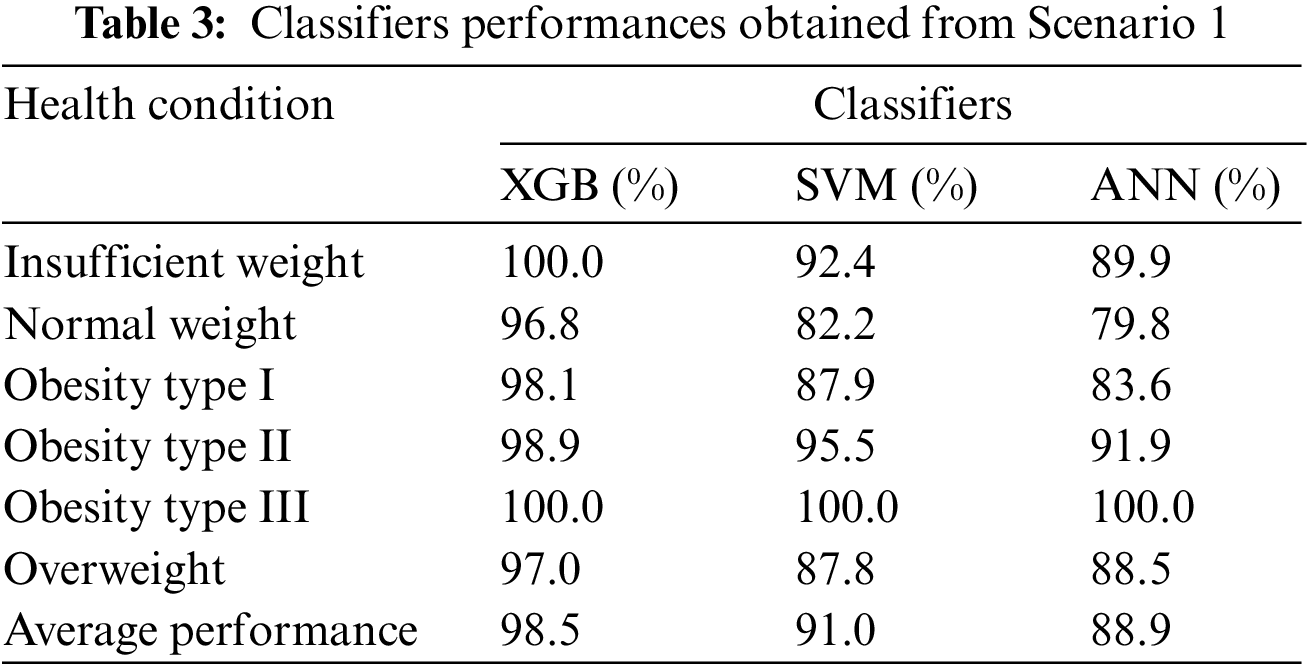
The performance analysis of the XGB-based classifier in scenario 1 to detect the six health conditions or output classes in the scenarios is presented in Table 3. The highest performer is XGB, with an overall performance of 98.5, followed by SVM, with an overall performance of 91%, and the worst performance is achieved by ANN. The XGB-based method performed the best among all classifiers, and the possible rationale behind this could be due to the fact that XGB is better designed for the scenario where the features are a combination of numerical and categorical variables obtaining high performance.
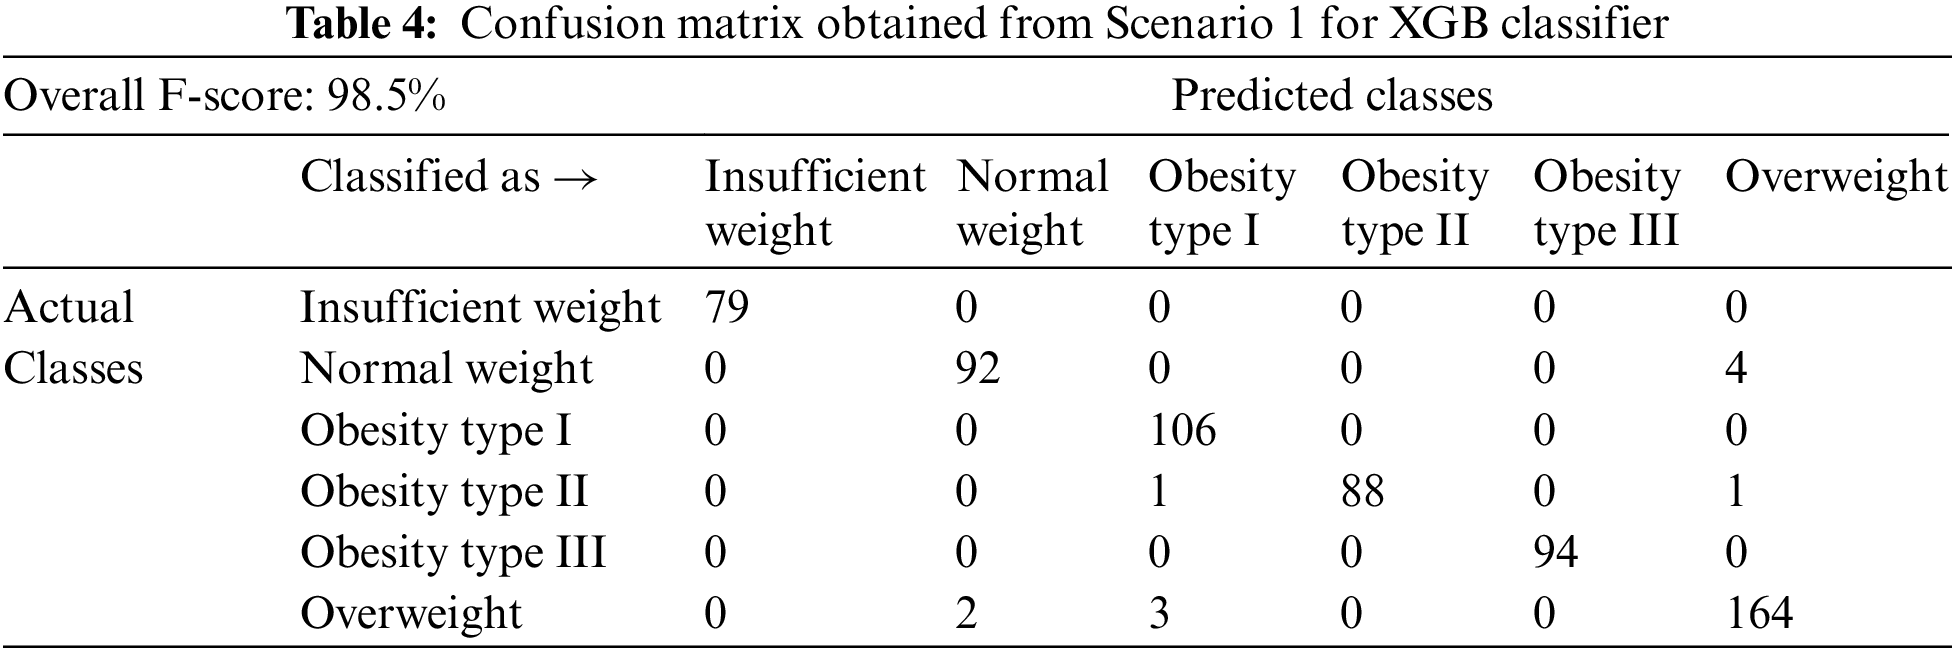
The remainder of the scenario 1 discussion will present only the result of the best-performing classifier, i.e., XGB. It is quite evident that the proposed XGB-based method system can classify the obesity classes (Obesity Type I, Obesity Type II, Obesity Type III) and non-obesity classes (underweight, normal, overweight) with very high performance above 96%, as reported in Fig. 3. This is very promising and shows the strength of the proposed system in classifying obese adults and non-obese adults. The overall performance rate of 98.6% is achieved, as reported in Table 2. These findings suggest that the proposed system is able to detect health conditions, including the three types of obesity, with very good performance. The findings also highlight that the combination of different types of features, including food intake (calories consumed, number of meals), physical condition (weight, height, age), family history of obesity, lifestyle (physical activity duration), and mode of transportation, are key factors in discriminating between non-obese adults and obese adults. The confusion matrix of the proposed XGB classifier for Scenario 1 is presented in Table 4.
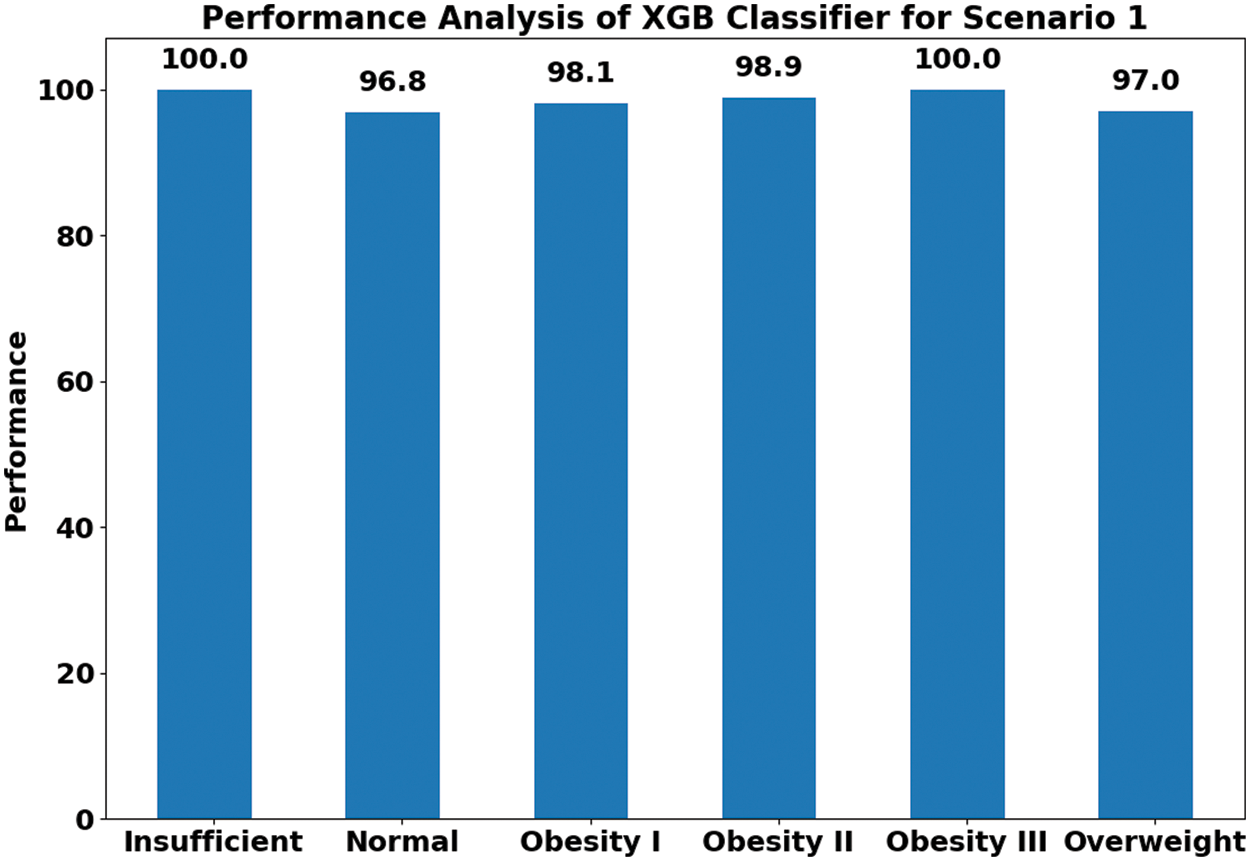
Figure 3: XGB-based obesity type and non-obesity classification for Scenario 1
It is worth mentioning that the proposed XGB system also outperformed the previous work of the authors [27], who created the dataset and developed a machine-learning-based obesity level estimation system using Scenario 1. They used a decision tree classifier to estimate obesity levels and achieved an overall performance rate of 97.4% [27], while our work achieved an overall performance rate of 98.5% (see Table 3). A possible reason behind the increase in the performance of the proposed method to estimate obesity levels could be due to the fact that gradient boosting classifiers—and, more specifically, the XGB classifier—are built to operate more successfully when the transformed features include a mixture of categorical and numerical variables, which might not be the case when using the decision tree classifiers. Another factor could be the feature transformation applied in this work, as a combination of features (numerical, categorical) might not be able to perform well when directly fed into the classifier, while transformed features with one type of value (numeric in the proposed work) can perform better and the classifier can learn more successfully.
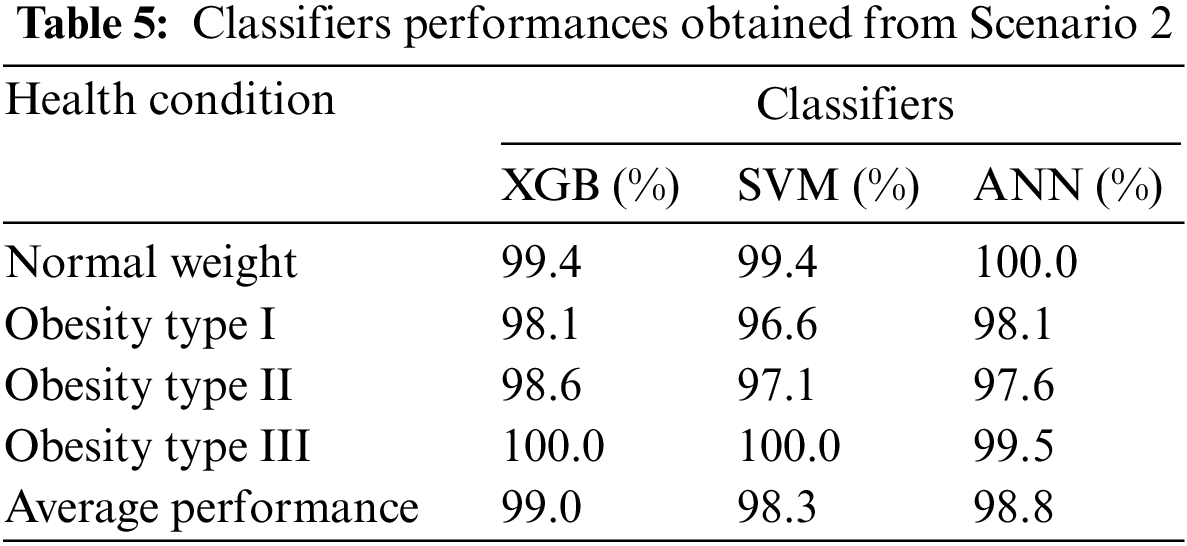
The performance analysis of all three classifiers (XGB, SVM, ANN) classifier for Scenario 2 is presented in Table 5. The results suggest that all the classifiers performed very well in classifying the four different obesity-related health conditions (Normal Weight, Obesity Type I, Obesity Type II, and Obesity Type III). The best performance of 99% is achieved by XGB, followed by ANN and SVM, with a slight degradation in performance (less than 1%). This suggests that all the proposed obesity level prediction methods performed well in scenario 2.
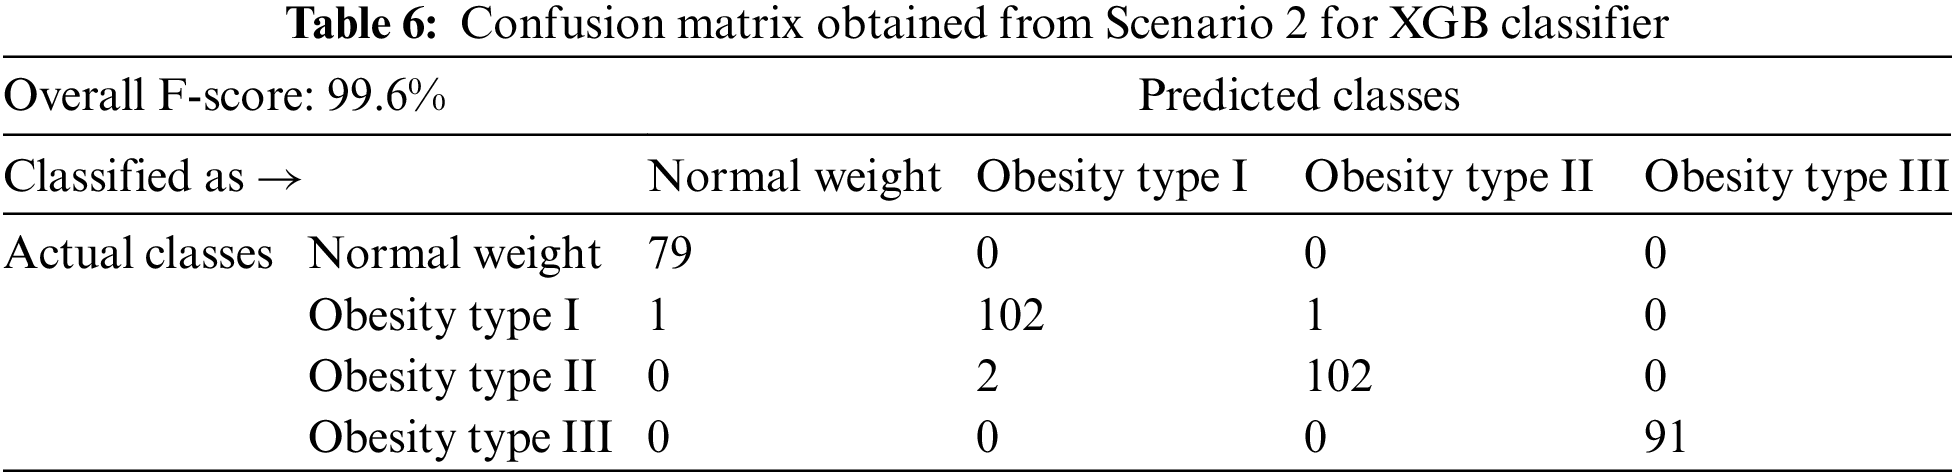
The remainder of the scenario 2 discussion will present only the result of the best-performing classifier, i.e., XGB. The performances by class for the XGB classifier in scenario 2 are presented in Fig. 4. It is quite evident from these findings that all the classes achieved very high performance by class, with a value above 99%. The overall performance achieved in Scenario 2 is 99.6%, and the confusion matrix for Scenario 2 is presented in Table 6. This is very interesting and promising since Scenario 2 was carefully developed in this work to analyze and classify the obesity levels when the population includes only healthy adults and obese adults with different levels (Obesity Type I, II, and III). The performance obtained in Scenario 2 indicates that the system is highly capable of distinguishing between healthy adults and obese adults with different levels of obesity.
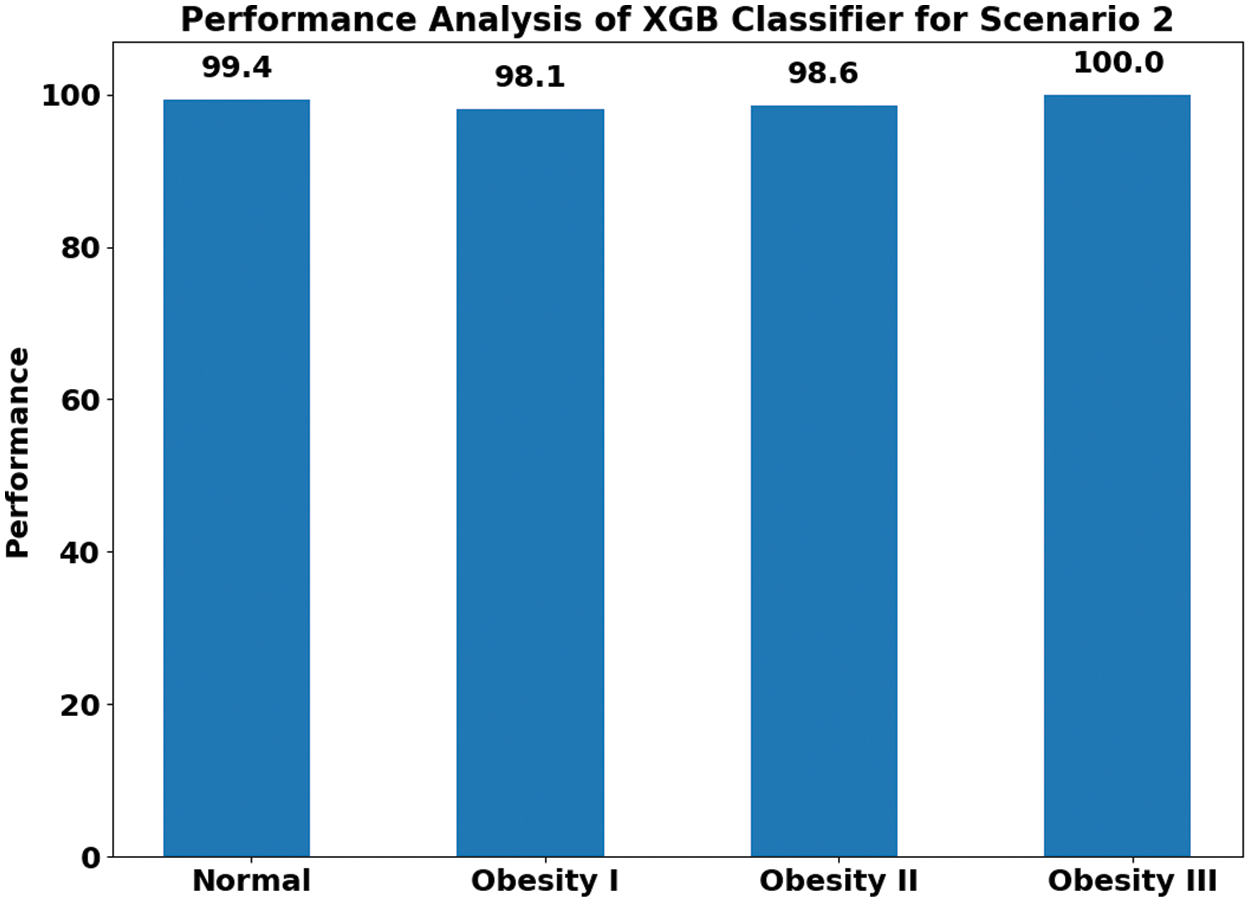
Figure 4: XGB-based obesity type and non-obesity classification for Scenario 2
The findings also emphasized the fact that the proposed system can be easily applied to real-world conditions to improve the well-being of society and can be utilized not only by medical professionals (general physicians, clinical staff, nurses) but also by the general public, encouraging them to adopt a healthy lifestyle and to avoid obesity. This is because obesity is a health condition that takes time to develop, and, in the modern era, in which life is busy, and it is very difficult to keep a record of one’s eating habits and lifestyle manually, the proposed machine learning system can offer a suitable and automated choice to evaluate one’s eating habits, lifestyle and physical condition to predict the body’s tendency towards obesity. Moreover, by adopting such automated machine-learning-based obesity level estimation methods, one can also avoid obesity and improve one’s well-being by adopting an active lifestyle and healthy eating habits. Therefore, future work will focus on transforming the proposed machine learning system into a mobile app from which the general public can obtain benefits, such as the ability to log their daily routines and track their health condition so as to avoid obesity.
Obesity is a serious health condition and can have severe consequences for health. Therefore, it is vital to track the dietary habits and activity profiles of obese individuals to improve their quality of life and well-being. This study utilized a real-life dataset comprising various features related to dietary habits, physical conditions, activity profiles, and lifestyles. The main contribution of the work is that a novel machine-learning-based obesity classification system is proposed to a real-life dataset and utilizes various parameters (eating habits, physical condition, physical activity profile, and lifestyle measures). Three different methods are developed in this study using XGB, SVM, and ANN classifiers to predict obesity levels. The XGB-based methods outperformed the other two methods. The findings suggest that different stages of obesity can be classified with a very high performance of above 98% in different experimental scenarios using the XGB-based method. It is also worth mentioning that the proposed XGB method outperformed the state-of-the-art methods by improving the prediction performance. These findings are very encouraging and suggest the strength of the proposed novel solution in classifying different obesity classes, in addition to normal-weight and underweight individuals.
There are limitations to the proposed work. The number of participants was relatively small and should be increased in the future for better generalization. Moreover, more dietary measures and physical activity measures, such as activity trackers and wearable monitors, can be added for the more precise profiling of daily life activities.
Acknowledgement: The authors would like to acknowledge the support of the Deputy for Research and Innovation, Ministry of Education, Kingdom of Saudi Arabia, for this research through a grant (NU/IFC/ENT/01/020) under the Institutional Funding Committee at Najran University, Kingdom of Saudi Arabia.
Funding Statement: The authors would like to acknowledge the support of the Deputy for Research and Innovation-Ministry of Education, Kingdom of Saudi Arabia, for this research through a grant (NU/IFC/ENT/01/020) under the Institutional Funding Committee at Najran University, Kingdom of Saudi Arabia.
Conflicts of Interest: The authors declare that they have no conflicts of interest to report regarding the present study.
References
1. R. R. Roy and G. S. Mala, “Early detection of pancreatic cancer using jaundiced eye images,” Computer Systems Science and Engineering, vol. 41, no. 2, pp. 677–688, 2022. [Google Scholar]
2. V. D. A. Kumar, C. Swarup, I. Murugan, A. Kumar, K. Singh et al., “Prediction of cardiovascular disease using machine learning technique a modern approach,” Computers, Materials and Continua, vol. 71, no. 1, pp. 855–869, 2022. [Google Scholar]
3. A. Hruby, J. E. Manson, L. Qi, V. S. Malik, E. B. Rimm et al., “Determinants and consequences of obesity,” American Journal of Public Health, vol. 106, no. 9, pp. 1656–1662, 2016. [Google Scholar] [PubMed]
4. A. Chatterjee, M. W. Gerdes, and S. G. Martinez, “Identification of risk factors associated with obesity and overweight—a machine learning overview,” Sensors, vol. 20, no. 9, pp. 2734–2750, 2020. [Google Scholar] [PubMed]
5. M. Gupta, T. L. T. Phan, H. T. Bunnell, and R. Beheshti, “Obesity prediction with EHR data: A deep learning approach with interpretable elements,” ACM Transactions on Computing for Healthcare, vol. 3, no. 3, pp. 1–19, 2022. [Google Scholar]
6. D. R. Edla, D. Tripathi, R. Cheruku and V. Kuppili, “An efficient multi-layer ensemble framework with BPSOGSA-based feature selection for credit scoring data analysis,” Arabian Journal for Science and Engineering, vol. 43, no. 12, pp. 6909–6928, 2018. [Google Scholar]
7. N. Ziauddeen, P. J. Roderick, N. S. Macklon and N. A. Alwan, “Predicting childhood overweight and obesity using maternal and early life risk factors: A systematic review,” Obesity Reviews, vol. 19, no. 3, pp. 302–312, 2018. [Google Scholar] [PubMed]
8. B. Shickel, P. J. Tighe, A. Bihorac and P. Rashidi, “Deep EHR: A survey of recent advances in deep learning techniques for electronic health record (EHR) analysis,” IEEE Journal of Biomedical and Health Informatics, vol. 22, no. 5, pp. 1589–1604, 2017. [Google Scholar] [PubMed]
9. C. Trattner, D. Parra and D. Elsweiler, “Monitoring obesity prevalence in the United States through bookmarking activities in online food portals,” PLoS One, vol. 12, no. 6, pp. 0179144–0179160, 2017. [Google Scholar]
10. K. W. DeGregory, P. Kuiper, T. DeSilvio, J. D. Pleuss, R. Miller et al., “A review of machine learning in obesity,” Obesity Reviews, vol. 19, no. 5, pp. 668–685, 2018. [Google Scholar] [PubMed]
11. D. M. Thomas, A. E. Ivanescu, C. K. Martin, S. B. Heymsfield, K. Marshall et al., “Predicting successful long-term weight loss from short-term weight-loss outcomes: New insights from a dynamic energy balance model (the POUNDS lost study),” The American Journal of Clinical Nutrition, vol. 101, no. 3, pp. 449–454, 2015. [Google Scholar] [PubMed]
12. Z. Liang, G. Zhang, J. X. Huang, and Q. V. Hu, “Deep learning for healthcare decision making with EMRs,” in IEEE Int. Conf. on Bioinformatics and Biomedicine, Belfast, UK, pp. 556–559, 2014. [Google Scholar]
13. G. Zhang, J. Yin, Z. Li, X. Su, G. Li et al., “Automated skin biopsy histopathological image annotation using multi-instance representation and learning,” BMC Med Genomics, vol. 6, no. 3, pp. 25–35, 2013. [Google Scholar]
14. T. Pham, T. Tran, D. Phung, and S. Venkatesh, “Deepcare: A deep dynamic memory model for predictive medicine,” in Pacific Asia Conf. on Knowledge Discovery and Data Mining, Auckland, New Zealand, pp. 30–41, 2016. [Google Scholar]
15. P. Nguyen, T. Tran, N. Wickramasinghe, and S. Venkatesh, “A convolutional net for medical records,” Engineering in medicine and biology society, IEEE Journal of Biomedical and Health Informatics, vol. 21, no. 1, pp. 1–9, 2017. [Google Scholar]
16. R. Hammond, R. Athanasiadou, S. Curado, Y. Aphinyanaphongs, C. Abrams et al., “Predicting childhood obesity using electronic health records and publicly available data,” PLoS One, vol. 14, no. 4, pp. 0215571–0215585, 2019. [Google Scholar]
17. S. F. Weng, S. A. Redsell, D. Nathan, J. A. Swift, M. Yang et al., “Estimating overweight risk in childhood from predictors during infancy,” Pediatrics, vol. 132, no. 2, pp. 414–421, 2013. [Google Scholar]
18. L. Graversen, T. I. A. Sørensen, T. A. Gerds, L. Petersen, U. Sovio et al., “Prediction of adolescent and adult adiposity outcomes from early life anthropometrics,” Obesity, vol. 23, no. 1, pp. 162–169, 2015. [Google Scholar] [PubMed]
19. S. A. Redsell, S. Weng, J. A. Swift, D. Nathan, and C. Glazebrook, “Validation, optimal threshold determination, and clinical utility of the infant risk of overweight checklist for early prevention of child overweight,” Childhood Obesity, vol. 12, no. 3, pp. 202–209, 2016. [Google Scholar] [PubMed]
20. B. Singh and H. Tawfik, “A machine learning approach for predicting weight gain risks in young adults,” in 10th Int. Conf. on Dependable Systems, Services and Technologies, Leeds, UK, pp. 231–234, 2019. [Google Scholar]
21. M. Padmanabhan, P. Yuan, G. Chada, and H. V. Nguyen, “Physician friendly machine learning: A case study with cardiovascular disease risk prediction,” Journal of Clinical Medicine, vol. 8, no. 7, pp. 1050–1065, 2019. [Google Scholar] [PubMed]
22. A. S. Selya and D. Anshutz, “Machine learning for the classification of obesity from dietary and physical activity patterns,” in Advanced Data Analytics in Health, 1st ed., vol. 93, Springer, Berlin, Germany, pp. 77–97, 2018. [Google Scholar]
23. K. Jindal, N. Baliyan and P. S. Rana, “Obesity prediction using ensemble machine learning approaches,” in Recent Findings in Intelligent Computing Techniques, 1st ed., vol. 708, Springer, Berlin, Germany, pp. 355–362, 2018. [Google Scholar]
24. Z. Zheng and K. Ruggiero, “Using machine learning to predict obesity in high school students,” in IEEE Int. Conf. on Bioinformatics and Biomedicine, Kansas City, MO, USA, pp. 2132–2138, 2017. [Google Scholar]
25. F. M. Palechor and A. D. L. H. Manotas, “Dataset for estimation of obesity levels based on eating habits and physical condition in individuals from Colombia, Peru, and Mexico,” Data in Brief, vol. 25, pp. 104344–104355, 2019. [Google Scholar] [PubMed]
26. F. Pedregosa, O. Grisel, M. Blondel, P. Prettenhoferet, R. Weiss et al., “Scikit-learn: Machine learning in python,” The Journal of Machine Learning Research, vol. 12, no. 1, pp. 2825–2830, 2011. [Google Scholar]
27. E. De-La-Hoz-Correa, F. Mendoza Palechor, A. De-La-Hoz-Manotas, R. Morales Ortega and A. B. Sánchez Hernández, “Obesity level estimation software based on decision trees,” Journal of Computer Science, vol. 15, no. 1, pp. 45–65, 2019. [Google Scholar]
28. K. M. Ghori, M. Awais, A. S. Khattak, M. Imran, and L. Szathmary, “Treating class imbalance in non-technical loss detection: An exploratory analysis of a real dataset,” IEEE Access, vol. 9, no. 10, pp. 98928–98938, 2021. [Google Scholar]
29. S. A. Alsareii, M. Raza, A. M. Alamri, M. Y. AlAsmari, M. Irfan et al., “Machine learning and internet of things enabled monitoring of post-surgery patients: A pilot study,” Sensors, vol. 22, no. 4, pp. 1420–1435, 2022. [Google Scholar] [PubMed]
30. T. Chen and C. Guestrin, “Xgboost: A scalable tree boosting system,” in Proc. of the 22nd ACM SIGKDD Int. Conf. on Knowledge Discovery and Data Mining, San Francisco, California USA, pp. 785–794, 2016. [Google Scholar]
31. P. N. Srinivasu, G. Jaya Lakshmi, R. H. Jhaveri, S. P. Praveen, and J. Machaj, “Ambient assistive living for monitoring the physical activity of diabetic adults through body area networks,” Mobile Information Systems, vol. 1, no. 1, pp. 65–75, 2022. [Google Scholar]
32. O. Bardhi and B. G. Zapirain, “Machine learning techniques applied to electronic healthcare records to predict cancer patient survivability,” CMC-Computers Materials & Continua, vol. 68, no. 2, pp. 1595–1613, 2021. [Google Scholar]
Cite This Article
 Copyright © 2023 The Author(s). Published by Tech Science Press.
This work is licensed under a Creative Commons Attribution 4.0 International License , which permits unrestricted use, distribution, and reproduction in any medium, provided the original work is properly cited.
 Downloads
 Citation Tools