
 Submit a Paper
 Propose a Special lssue
 Open Access
ARTICLE

Fuzzy Logic-Based System for Liver Fibrosis Disease
1 Department of Computer, College of Science and Arts in Ar Rass, Qassim University, Ar Rass, Qassim, 52571, Saudi Arabia
2 Department of Computer Science and Engineering, Lovely Professional University, Phagwara 144001, India
* Corresponding Author: Tamim Alkhalifah. Email:
Computer Systems Science and Engineering 2023, 46(3), 3559-3582. https://doi.org/10.32604/csse.2023.036534
Received 03 October 2022; Accepted 13 January 2023; Issue published 03 April 2023
 View Full Text
 Download PDF
Abstract
The diagnosis of liver fibrosis (LF) is crucial as it is a deadly and life-threatening disease. Artificial intelligence techniques aid doctors by using the previous data on health and making a diagnostic system, which helps to take decisions about patients’ health as experts can. The historical data of a patient’s health can have vagueness, inaccurate, and can also have missing values. The fuzzy logic theory can deal with these issues in the dataset. In this paper, a multilayer fuzzy expert system is developed to diagnose LF. The model is created by using multiple layers of the fuzzy logic approach. This system aids in classifying the health of patients into different classes. The proposed method has two layers, i.e., layer 1 and layer 2. The input variables used in layer 1 for diagnosing liver fibrosis are Appetite, Jaundice, Ascites, Age, and Fatigue. Similarly, in layer 2, the input variables are Platelet count, White blood cell count, spleen, SGPT ALT (Serum Glutamic Pyruvic Transaminase Alanine Aminotransferase), SGOT ALT (Serum Glutamic-oxalacetic Transaminase Alanine Aminotransferase), Serum bilirubin, and Serum albumin. The output variables for this developed system are no damage, minimal damage, significant damage, severe damage, and cirrhosis. This research work also presents the examination of results based on performance parameters. The proposed system achieves a classification accuracy of 95%. Moreover, other performance parameters such as sensitivity, specificity, and precision are calculated as 97.14%, 92%, and 94.44%, respectively.Keywords
The popular, prevalent, and universal chronic kidney disorder is liver fibrosis. When the liver is continuously damaged for various reasons, then it develops fibrosis. Fibrosis is the formation of scar tissues in the liver in a massive amount abnormally. It arises when the broken cells or cells that are not working are either replaced by the liver or repaired by the liver [1]. The detection of liver fibrosis disease at the initial stage is very vital as it leads to damage in the liver chronically. The end-stage of this illness is known as cirrhosis which leads to the death of the patient [2]. Liver fibrosis disease has five stages such as no damage, minimal damage, significant damage, severe damage, and cirrhosis. These stages can be represented by F0, F1, F2, F3, and F4, respectively [3].
Industrialized countries have more impact on liver fibrosis disease as there is more smoke that destroys the proteins in the human body [4]. Additionally, chronic liver disease is also an important cause of liver fibrosis [5]. The cost of hospitalization for the end stage of this disease, i.e., for cirrhosis, is very high. The normal person cannot afford that much money for the diagnosis. Hence, the detection of this disease at the introductory stage is needed for the sake of better health of patients [6].
When it comes to intelligent healthcare systems as well as patient care, artificial intelligence can help experts or doctors [7–11]. Machine learning approaches are becoming an emerging tool for the diagnosis of disease [12–15]. There are many methods used in the literature for the diagnosis of liver fibrosis disease. Among them, image processing is a widely and universally utilized approach that assists in the detection by using images [16–19]. The method of image processing, i.e., segmentation, was used for the detection of this illness in the early phase [20–23]. The images of the liver were carried out, and various algorithms such as k-means were applied for the detection of the disease [24,25]. The image was acquired by the ultrasound scan, and the needed features are extracted from that ultrasound image or computed tomography images of the liver and texture into the grayscale image [26–28]. The echo signals generated by the ultrasound scan were also used for diagnosis. These signals help to make the probability density function. This function further helps to generate the Rayleigh distribution that evaluates liver fibrosis [29–31]. Digital image analysis is also used to carry out the image of the liver, and various phases of liver fibrosis according to the Collagen Proportional area of an image [32]. Moreover, data mining is also a powerful tool to diagnose any kind of disease [33] and is also helpful in liver fibrosis diagnosis.
Machine learning methodologies like decision trees, particle swarm optimization, as well as genetic algorithms were utilized to diagnose liver fibrosis [34–36]. A decision tree approach is utilized to classify the five stages of LF and also predicts the degree of LF of an individual patient with an accuracy of 93.7% [37]. The various input parameters are taken out by lab tests or by an image of the liver, and after that, these algorithms are applied to propose a system that can detect liver fibrosis disease. The mechanical properties of liver fibrosis are changed repeatedly and frequently. The proposed tool, named Shear wave elastography, tracks these changes and also measures the stage of this disease by evaluating the mean values [38]. The deep learning method on the images also helps to enhance the performance of models that detects liver fibrosis [39].
The adaptive neuro-fuzzy inference system (ANFIS) was developed in which the UCI (University of California, Irvine) dataset was utilized. The classification of various stages of liver fibrosis has been done by using the multilayer ANFIS [40]. The classification of these stages is done by using naïve Bayes classifiers, logistic regression, and neural networks. Among these three classifiers, the naïve Bayes classifier and logistic regression are identified as the exact classifier as these classifiers classify the stages in the correct class accurately [41,42]. The support vector machine classifier is utilized in classifying the phases of LF from the magnetic resonance images of the liver [43]. The hybrid system, by merging the case-based reasoning as well as an artificial neural network, is applied to introduce an intelligent diagnostic system for the identification of this illness [44].
There are many methods applied for the diagnosis of LF disease in the medical domain, such as imaging tests, classification and clustering techniques, genetic studies, and so on. However, these techniques make the diagnosis more difficult and complex as the dataset used in these methods is not accurate. As every patient has a history of his/her health, that historical data had vagueness. The results of the tests taken in the lab can also have an error of some degree [45,46].
This vagueness and missing values are handled by the fuzzy set theory [47]. There are several medical problems whose diagnosis is pending because it has fuzzy data and also has missing values in the dataset [48]. This kind of problem can be predicted and diagnosed by using the intelligent systems of artificial intelligence [49]. The fuzzy set theory handles the ambiguity and vagueness that makes it a powerful tool that provides a solution to these sorts of problems [50]. Fuzzy logic helps to develop an expert system for a particular complex problem by using fuzzy data. This proposed expert system can make the decisions as a human expert can do corresponding to the given inputs to that particular system. At present, almost 70% of medical problems get their solutions from an expert system developed by using fuzzy logic [51].
An expert system or the fuzzy logic-based system has 4 fundamental elements which play an essential role in yielding the final output from the system by giving the inputs of a particular problem. Each block of the fuzzy expert system has equal importance in producing the output. None of them is optional for the development of a medical expert system. These elements are as follows:
a) Fuzzification Module: The first module of a fuzzy expert system is the fuzzification module. The input is given to this module of the system in a crisp form. This module covers the crisp form of inputs into fuzzy values.
b) Knowledge Base: The second element of a fuzzy expert system is the knowledge base. The knowledge base is the module in which all the rules are generated and stored. The stored rules are in the IF-THEN manner. The rules are generated by acquiring information and knowledge from the human expert.
c) Inference Engine: The facts are saved in the inference engine of an expert system. It helps to map the rules and the input given to the system. It has an essential role to play as it mimics the reasoning of a human.
d) Defuzzification Module: The last element of the medical expert system is the defuzzification module. The output generated by the system until now is formulated in fuzzy values. This module transforms the fuzzy sets into crisp numbers. The final output generated by the system is produced by the defuzzification module.
2 Contribution of the Research
The main motivation of the respective work is to develop a multilayer fuzzy expert system that assists in the detection of LF disease at its early stage. The novelty of the research study which makes it unique from other previous work related to the detection of liver fibrosis is given by:
• The developed expert system is developed by using two layers of fuzzy logic, and each layer ensures the correct detection of liver fibrosis.
• The developed model can handle the imprecise and ambiguity in the inputs or fuzzy valued inputs.
• The utilization of multiple layers of the fuzzy layer is a new concept, and it also filters out the persons having no chance of liver fibrosis in its first stage by evaluating the inputs of clinical symptoms.
• This medical expert system can help the doctor as a supporting tool in the diagnosis of LF at an introductory phase.
This section describes the developed medical diagnostic system. This system is proposed by utilizing the multi-layered Mamdani Fuzzy inference system. Fig. 1 demonstrates the flow of the process of development.
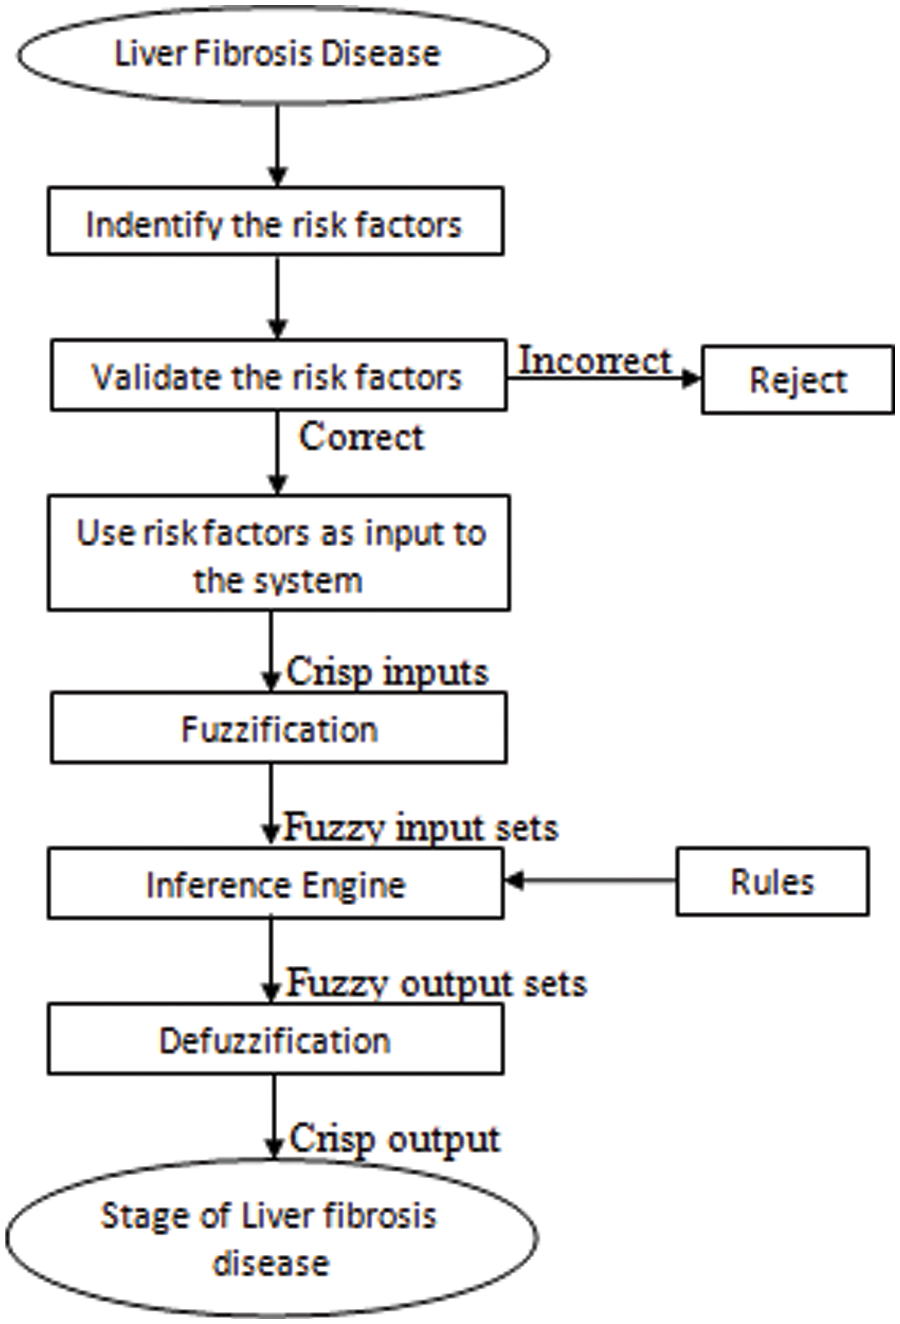
Figure 1: Flowchart for the development of a multilayered automated medical expert system for the diagnosis of LF disease
The machine learning methodology used in this research work is fuzzy logic. However, the model has been developed by using multiple layers of fuzzy logic approach. The automated medical diagnostic system has 2 layers, presented in Fig. 2. For layer 1, there are five different input variables, i.e., appetite, jaundice, ascites, age, and fatigue. This layer identified whether the patient of given inputs has liver fibrosis disease or not. Hence, the output of this layer is either yes or no.
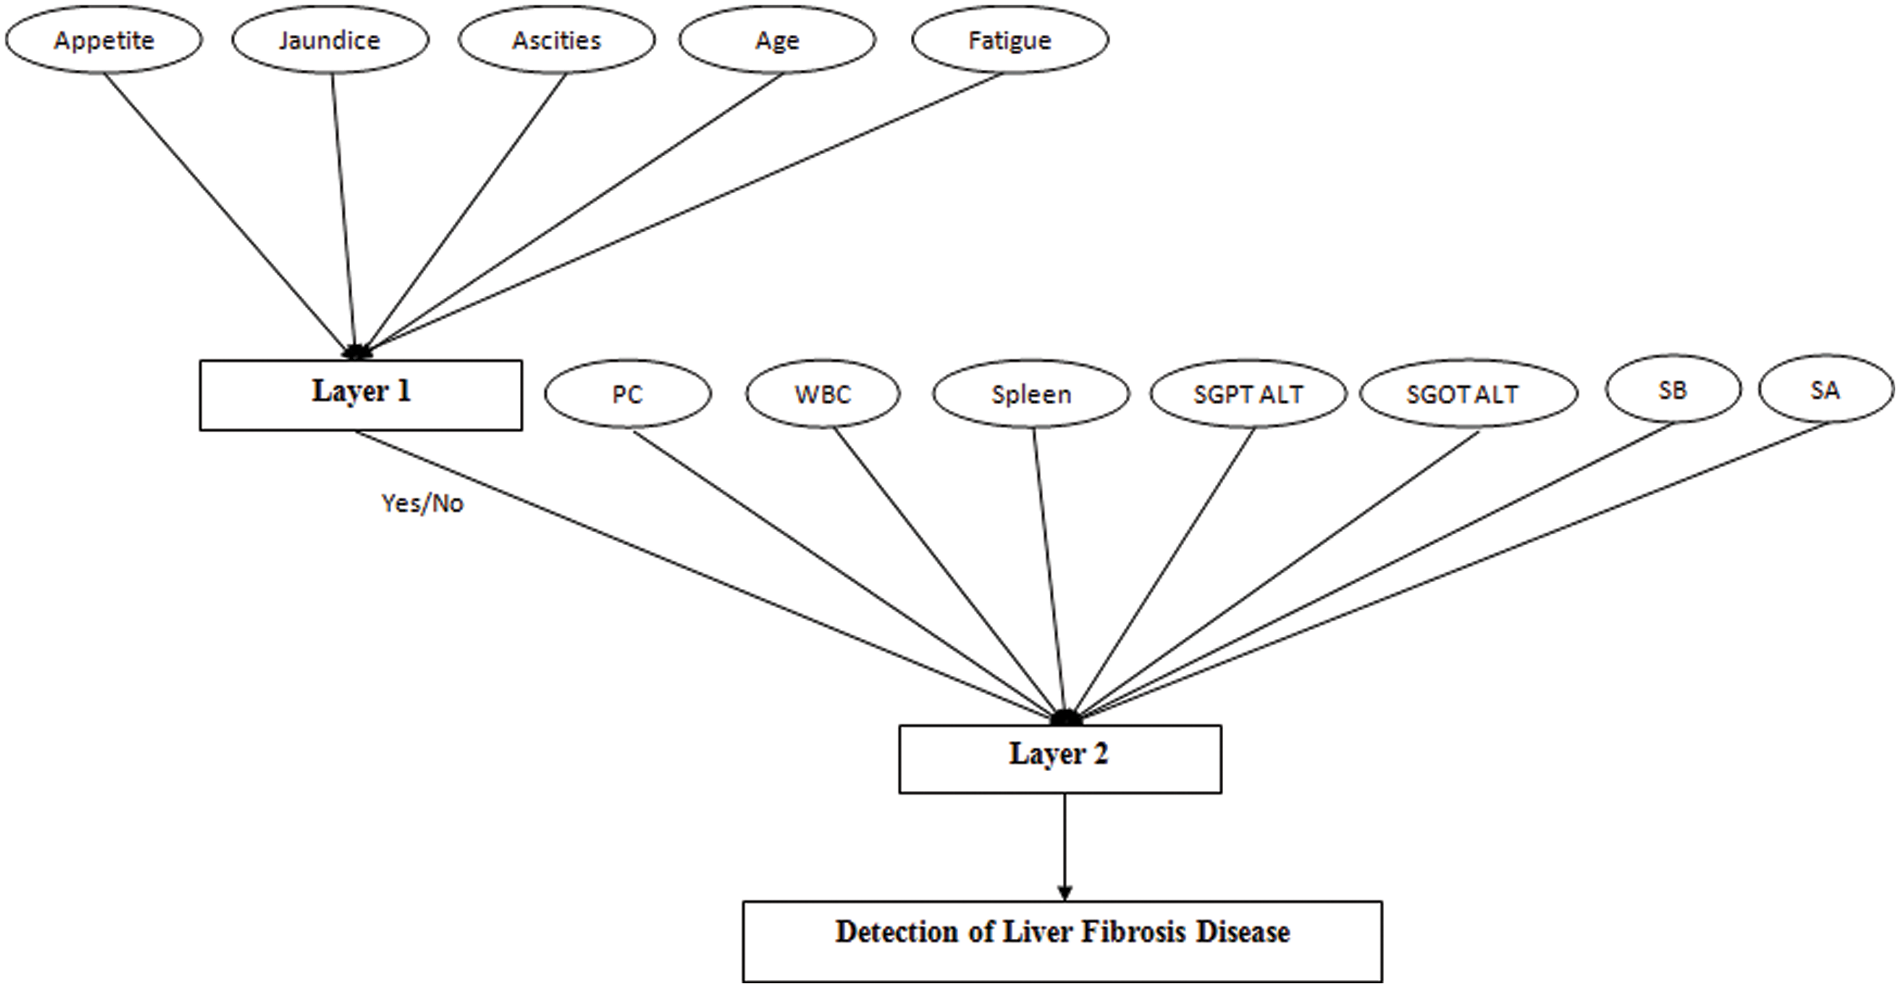
Figure 2: Developed an automated diagnosis of liver fibrosis using a multi-layered Mamdani fuzzy inference system (ADLF-ML-MFIS)
If outcome layer 1 is no, that means the patient is healthy. But if the outcome is equal to yes, then layer 2 helps to identify the stage of the liver fibrosis disease of a particular patient. For layer 2, there are seven input variables. This layer also includes the output of the first layer as the input to yield the final output. The output for this layer is the stages of liver fibrosis disease considered as No damage, minimal damage, significant damage, severe damage, and cirrhosis.
The algorithm for the developed multi-layered Mamdani fuzzy inference system is stated below:
• Step 1: Illustrate the linguistic variable and terms, i.e., input variables and output variables for layer 1 and layer 2 of the proposed medical diagnostic system.
• Step 2: Create the membership functions of each input variable as well as output variables for both layers.
• Step 3: Design a knowledge base for both layers that contain rules corresponding to the inputs and output variables.
Layer 1
Inputs: appetite, jaundice, ascites, age, and fatigue
Outputs: yes or no.
• Step 4: Covert the inputs in the crisp form given to layer 1 into the fuzzy values.
• Step 5: According to the provided inputs, map the rules of layer 1.
• Step 6: Merge the outcome given by each rule that is valid, corresponding to the input.
• Step 7: Transform the fuzzy outputs into crisp outputs.
Layer 2:
Inputs: platelet count (PC), white blood cell count (WBC), spleen. SGPT ALT, SGOT ALT, serum bilirubin (SB), and serum albumin (AB).
Outputs: no damage, minimal damage, significant damage, severe damage, and cirrhosis
• Step 8: The input variables for layer 2 are considered as the final output produced by layer 1 + input variables already selected for layer 2.
• Step 9: By using the membership functions (MF) of input variables of layer 2, transform the crisp inputs into fuzzy input.
• Step 10: Find out the rule that is valid for the given input to the developed system from the knowledge base and evaluate the result.
• Step 11: Combine the outcomes provided by the rules and evaluate the final fuzzy output set.
• Step 12: Transform the fuzzy outputs into crisp outputs.
The layer of the developed medical diagnostic system can be described in the mathematical form as given:
μLFD,layer1 = MFIS[μappetite, μJaundice, μAscities, μage, μfatigue]
where:
LFD = Liver fibrosis disease
MFIS = multi-layered fuzzy inference system.
Layer 2 of the proposed system can also be illustrated in the mathematical form as shown below:
μLFD,layer2 = MFIS[μLFD,layer1, μPC, μWBC, μspleen, μSGPT ALT, μSGOT ALT, μSB, μSA]
where:
LFD = Liver fibrosis disease
MFIS = Multi-layered fuzzy inference system
PC = Platelet count
WBC = White blood cell
SB = Serum Bilirubin
SA = Serum Albumin
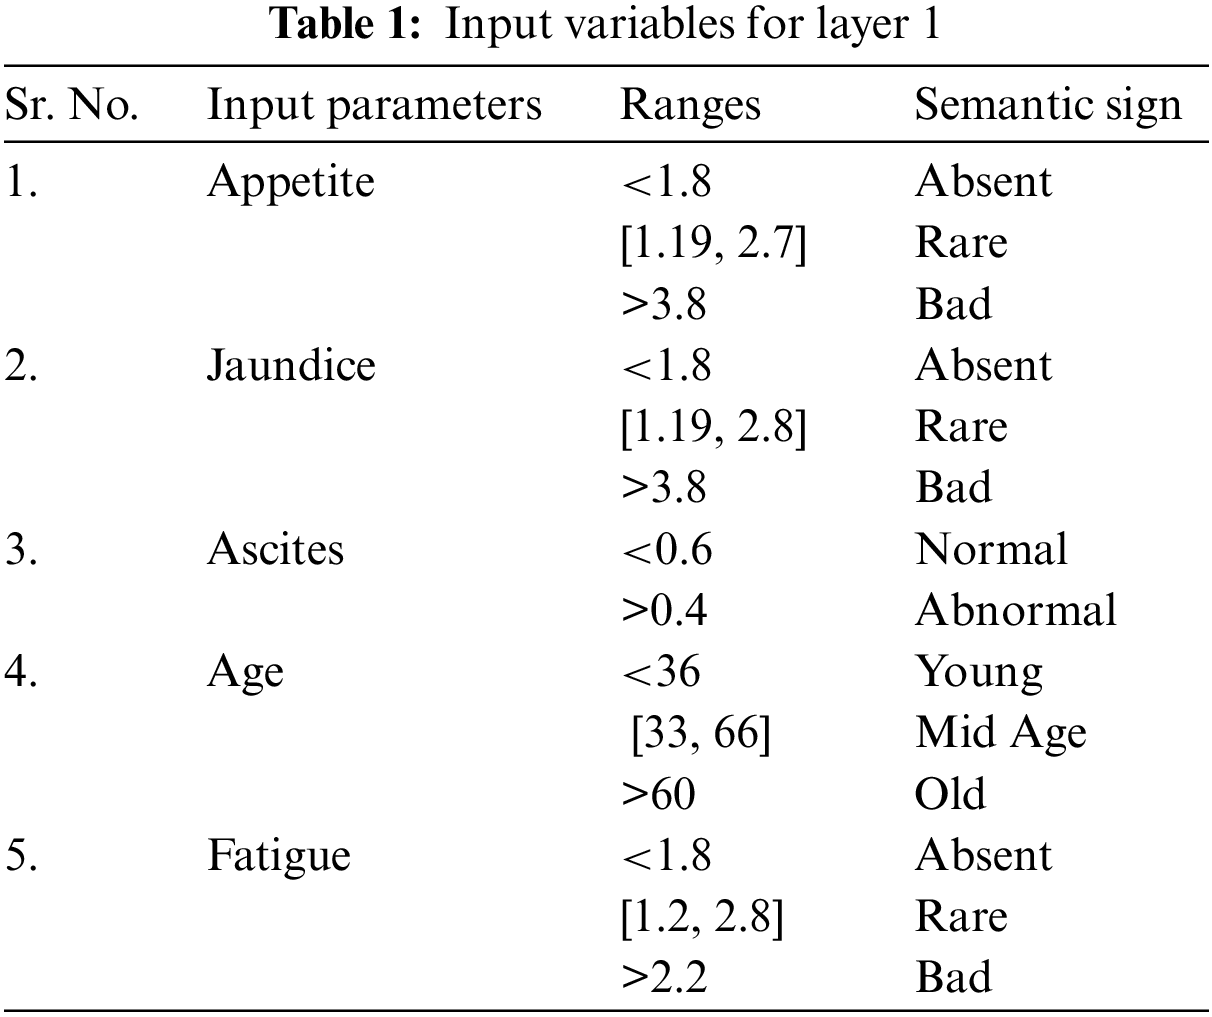
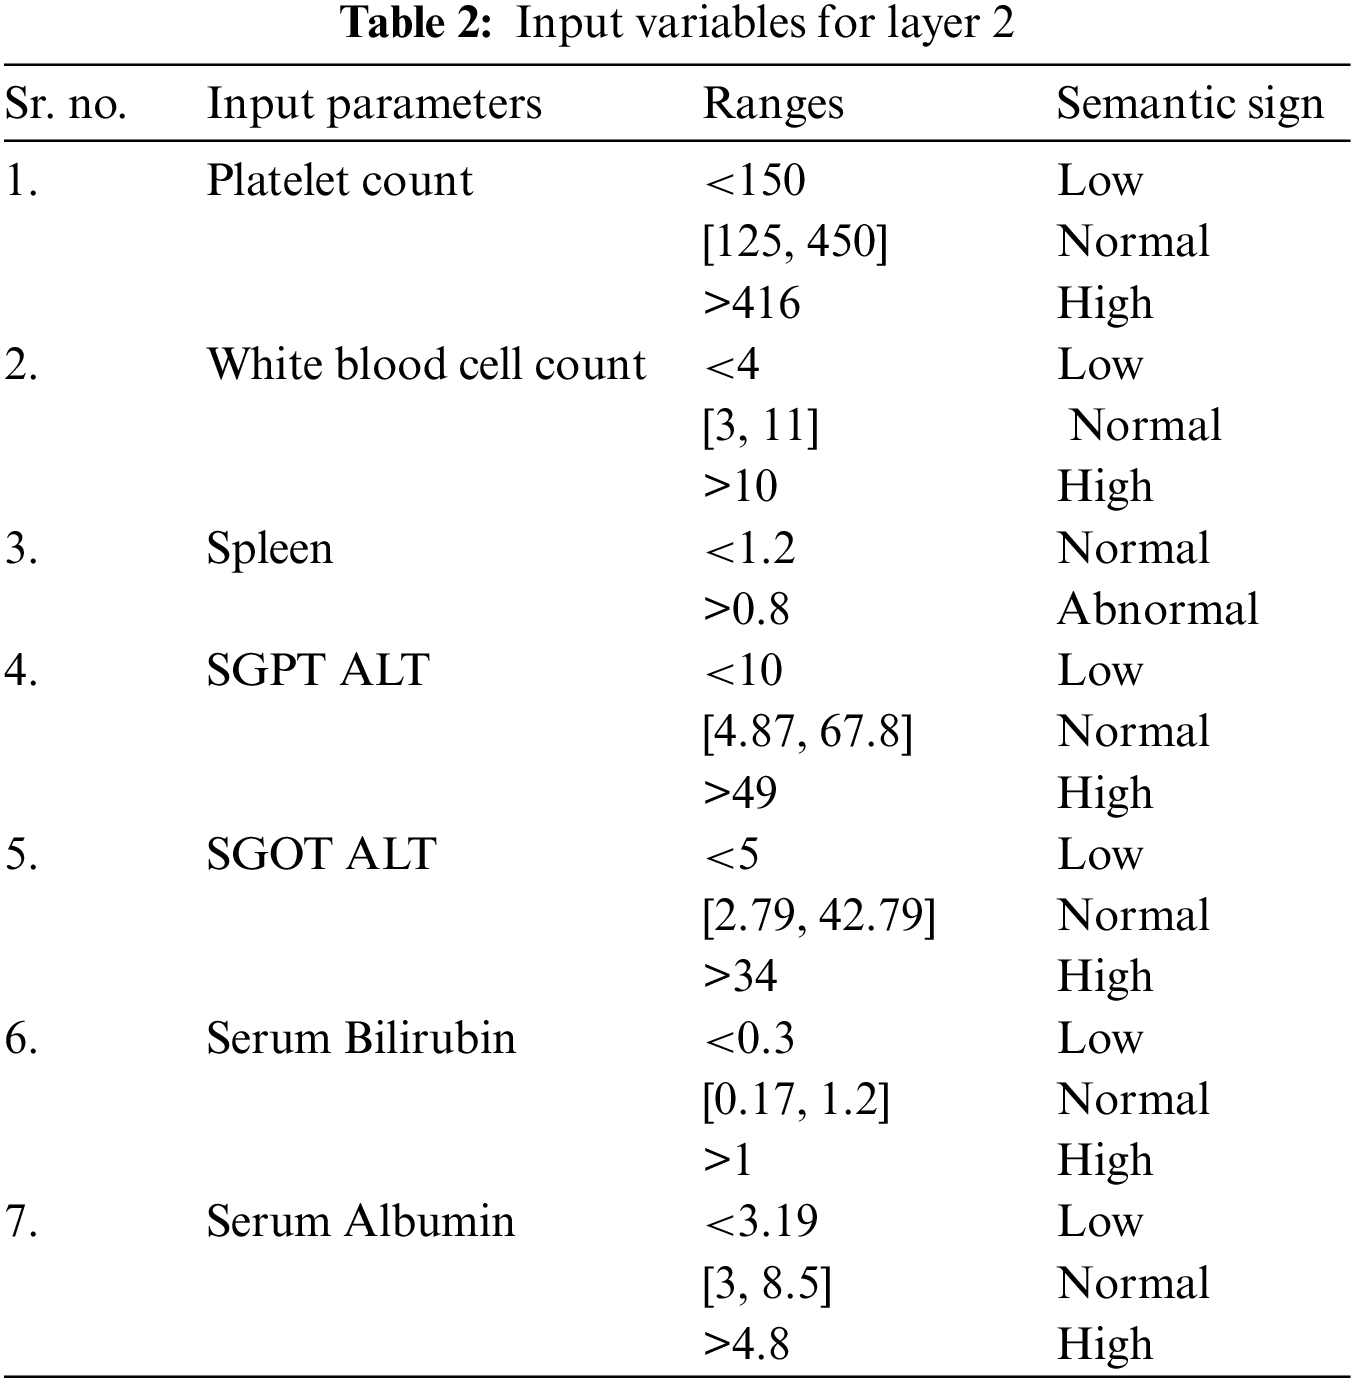
The input variables used in the implementation of this model are the analytical values. In this work, the total number of input variables for layer 1 and layer 2 is twelve. All twelve input variables are different from each other. These twelve input variables are divided into two parts as five input variables are used for the first layer and 7 inputs are used for 2nd layer of the proposed model, respectively. The appropriate information for these input variables is illustrated in Tables 1 and 2.
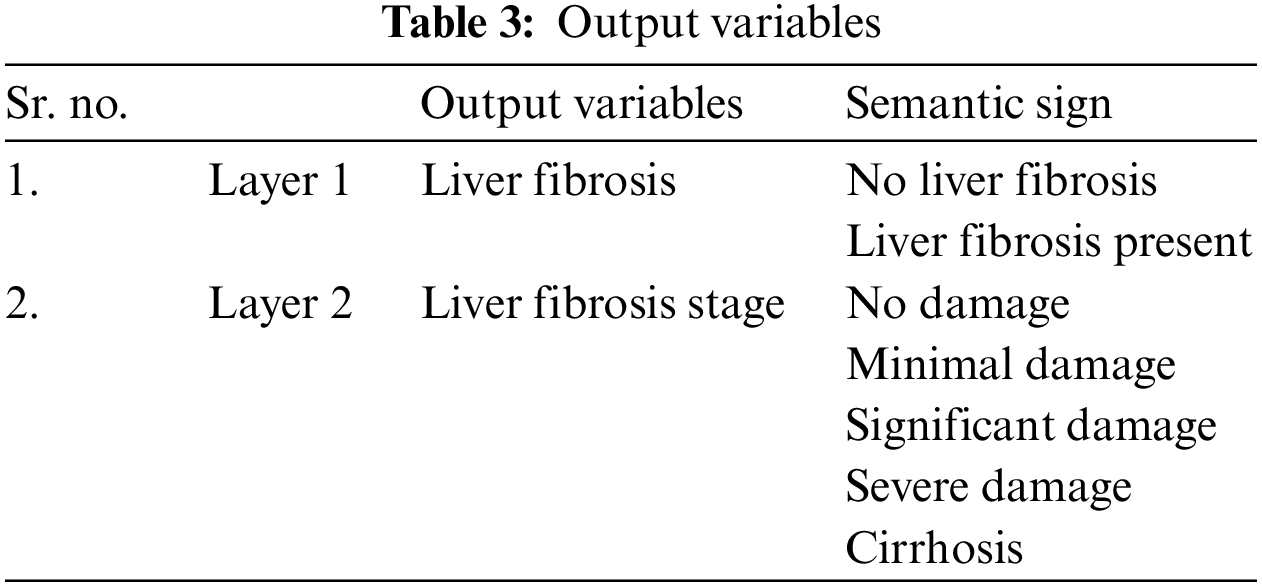
As there are two layers in the proposed medical diagnostic system, hence there are two outputs of the developed model, i.e., 1st layer output and 2nd layer output. Layer 1 finds out whether the patient has this disease or not. The output variables used for this layer are yes or no. Similarly, layer 2 identifies the stage of LF disease, and the output variables are considered as no damage, minimal damage, significant damage, severe damage, and cirrhosis. Table 3 has the description of these output variables of 1st and 2nd layers:
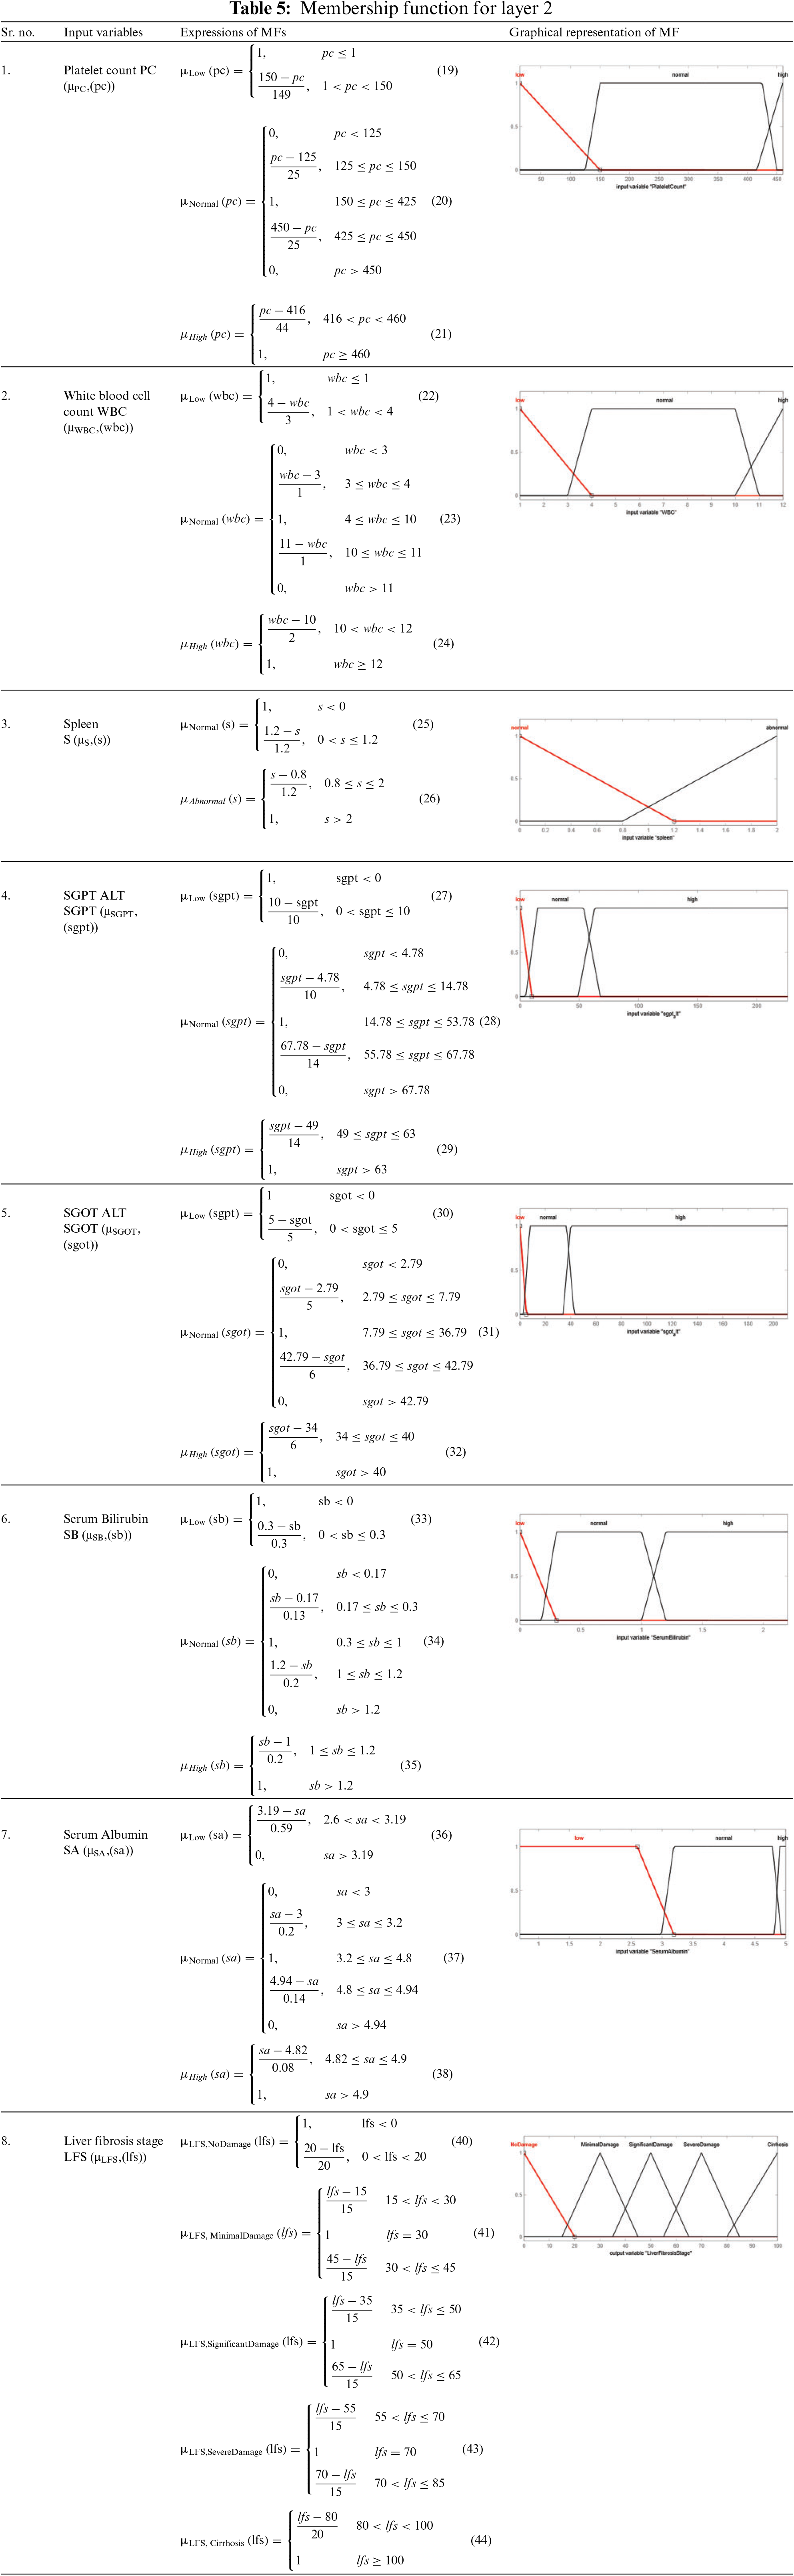
The statistical ranges of input as well as output variables given in the proposed medical diagnostic system are the membership functions. It represents the degree of truth. The ranges and linguistic variables used in this developed model are taken from the literature on liver fibrosis disease [52]. The used MFs are triangular as well as trapezoidal MF for all the input variables as well as the output variables. Tables 4 and 5 present the mathematical and graphical representation of MFs of input as well as output variables of layer 1 and layer 2, respectively. The triangular and trapezoidal MF expressions are used to make the equations in Tables 4 and 5. The general form of these equations is [53]:
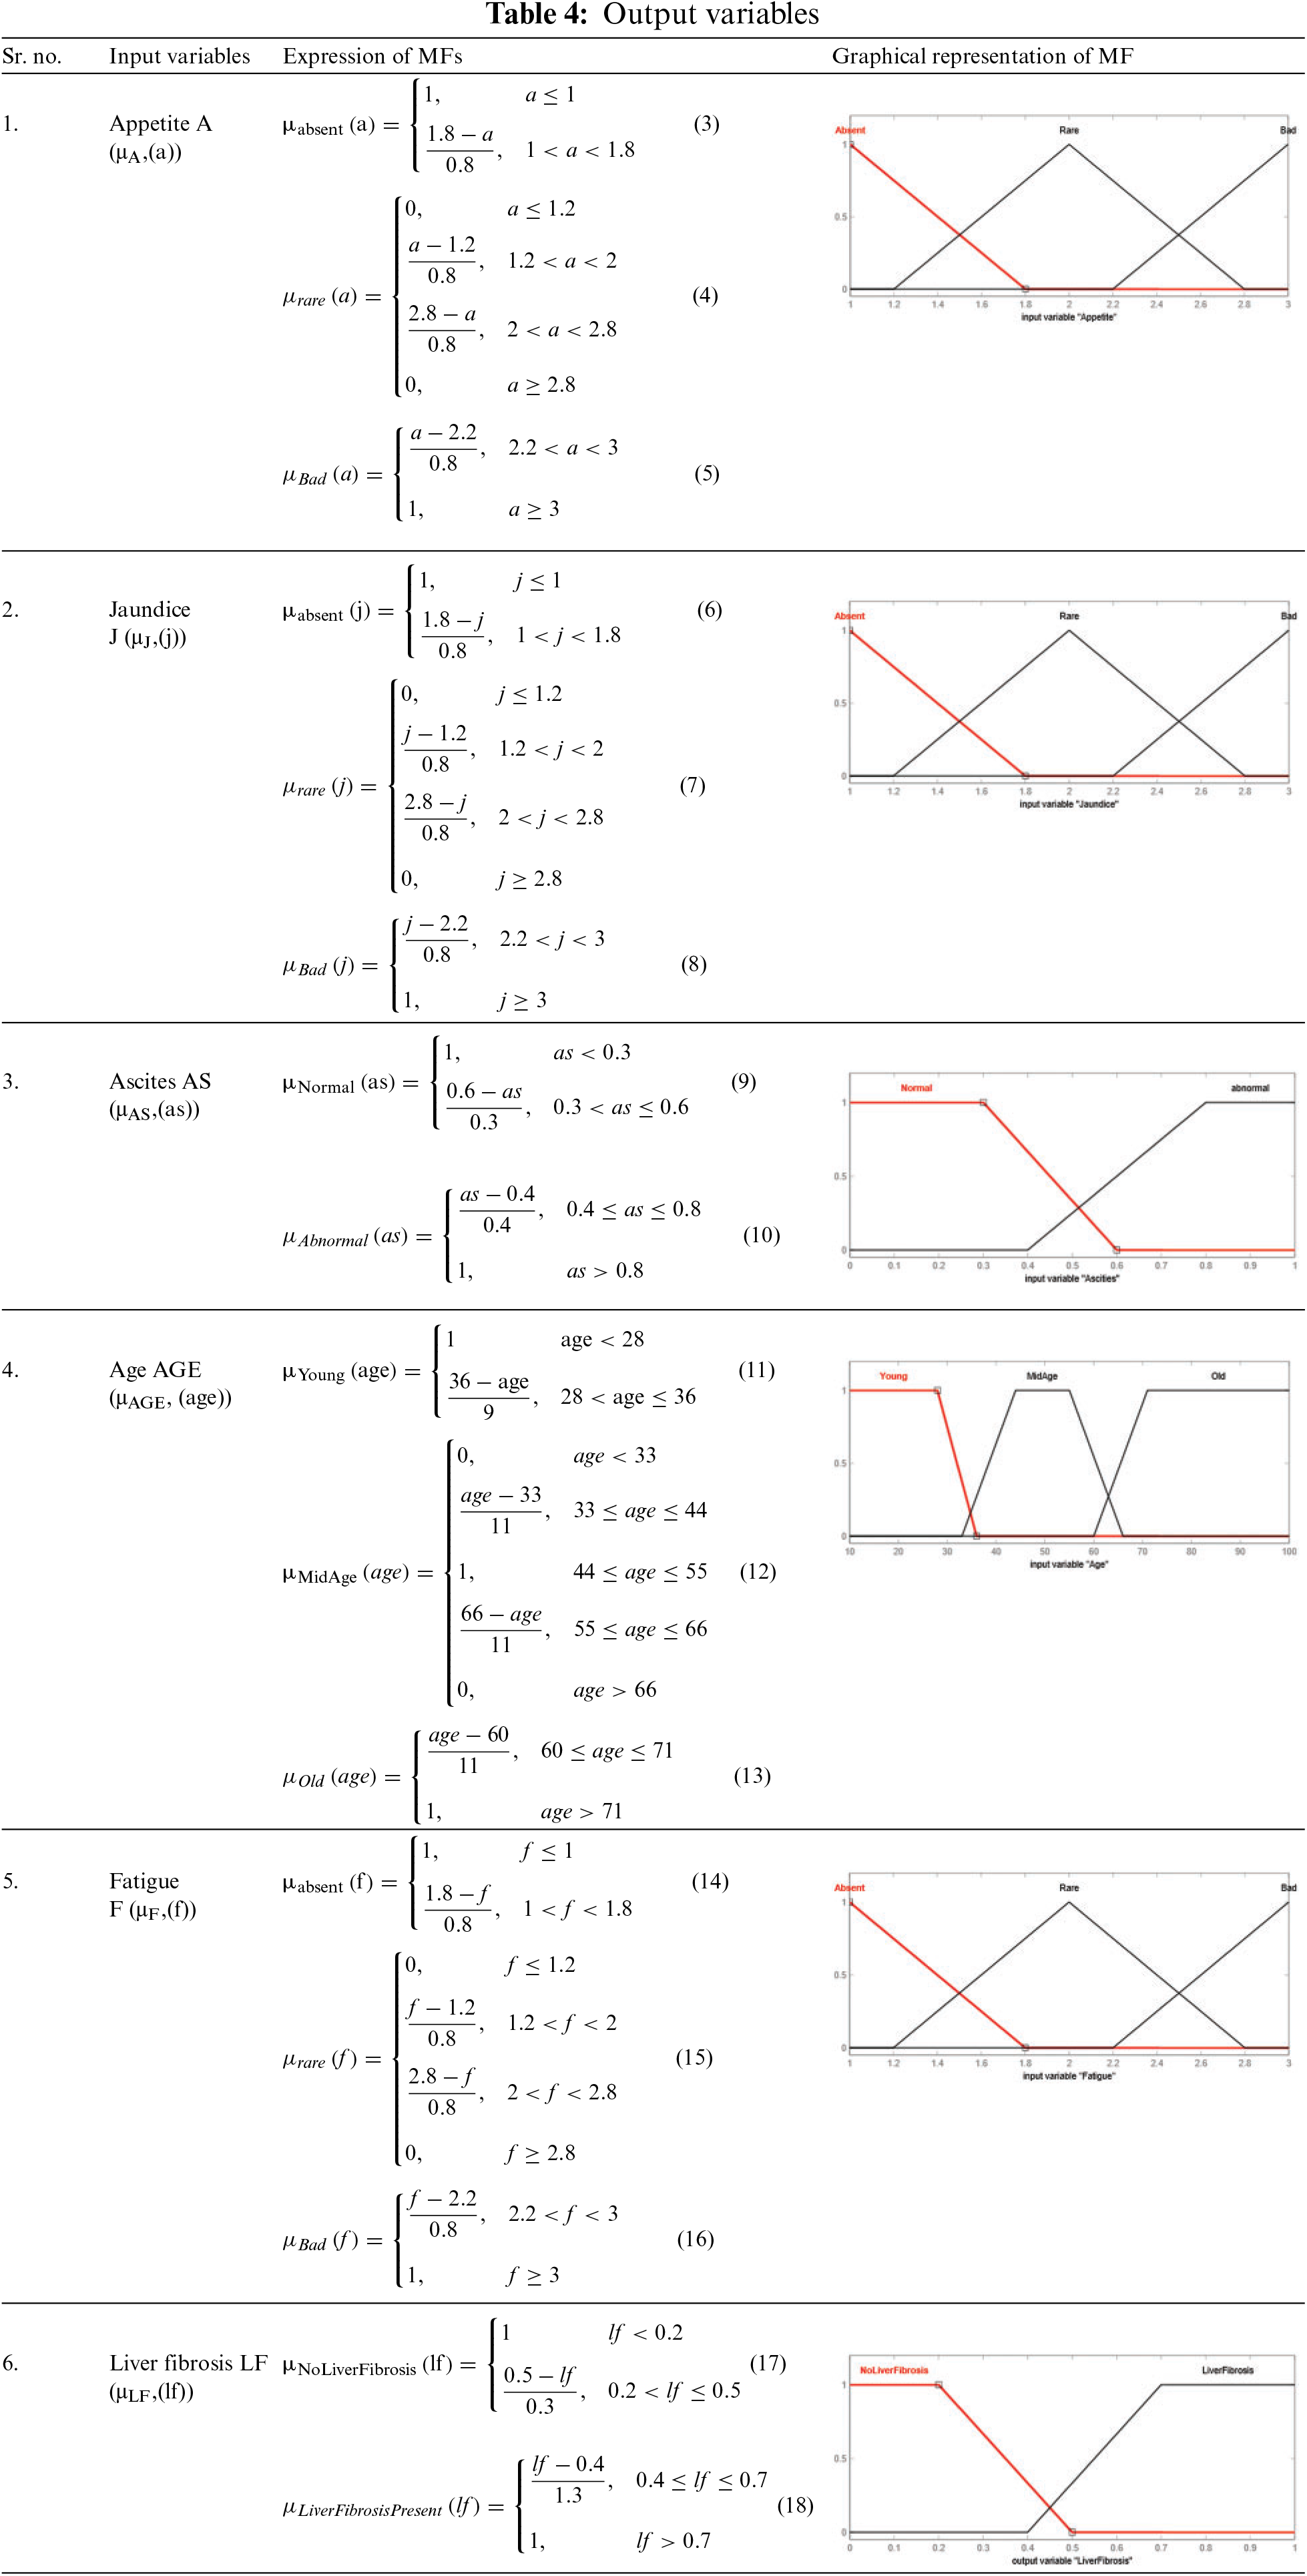
For triangular MF:
where a, b and c are the parameters (b refers to the triangle’s height, and c indicates the base of the triangle) and x is the given input.
For Trapezoidal MF:
where a, b, c add d are the parameters and x is the given input.
The rules stored in the knowledge base play an essential role in producing the output from the multi-layered Mamdani fuzzy inference engine, and also performance is evaluated from these rules.
The rules for layer 1 are shown in Fig. 3, and the total rules can be calculated as given below.
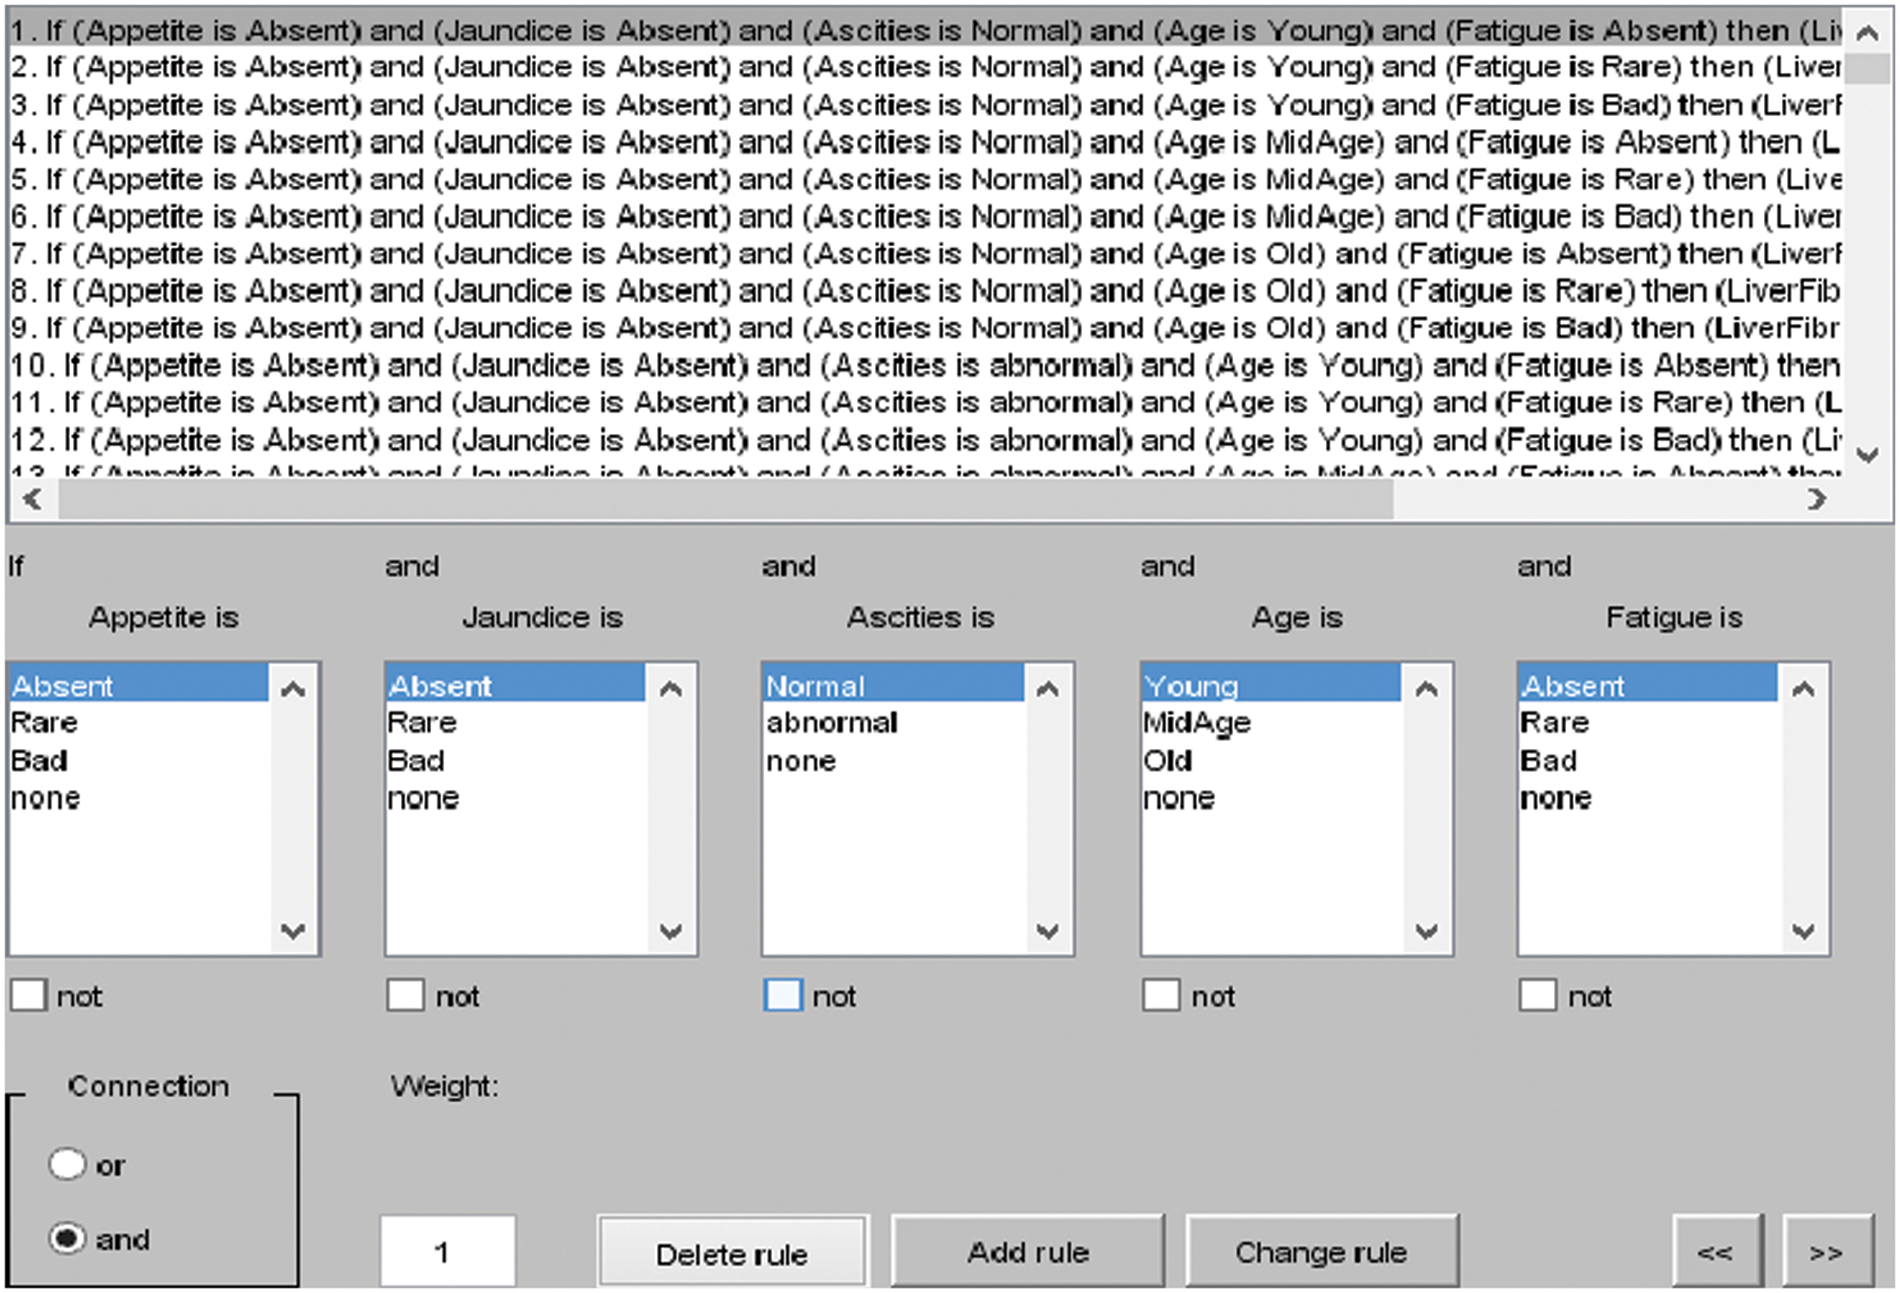
Figure 3: I/O rules for layer 1
Total rules for layer 1: membership functions of appetite × membership functions of Jaundice × membership functions of ascites × membership functions of Age × membership functions of Fatigue.
= 3 × 3 × 2 × 3 × 3 = 162 rules
The rules for layer 2 are shown in Fig. 4, and the total rules can be calculated as given below.
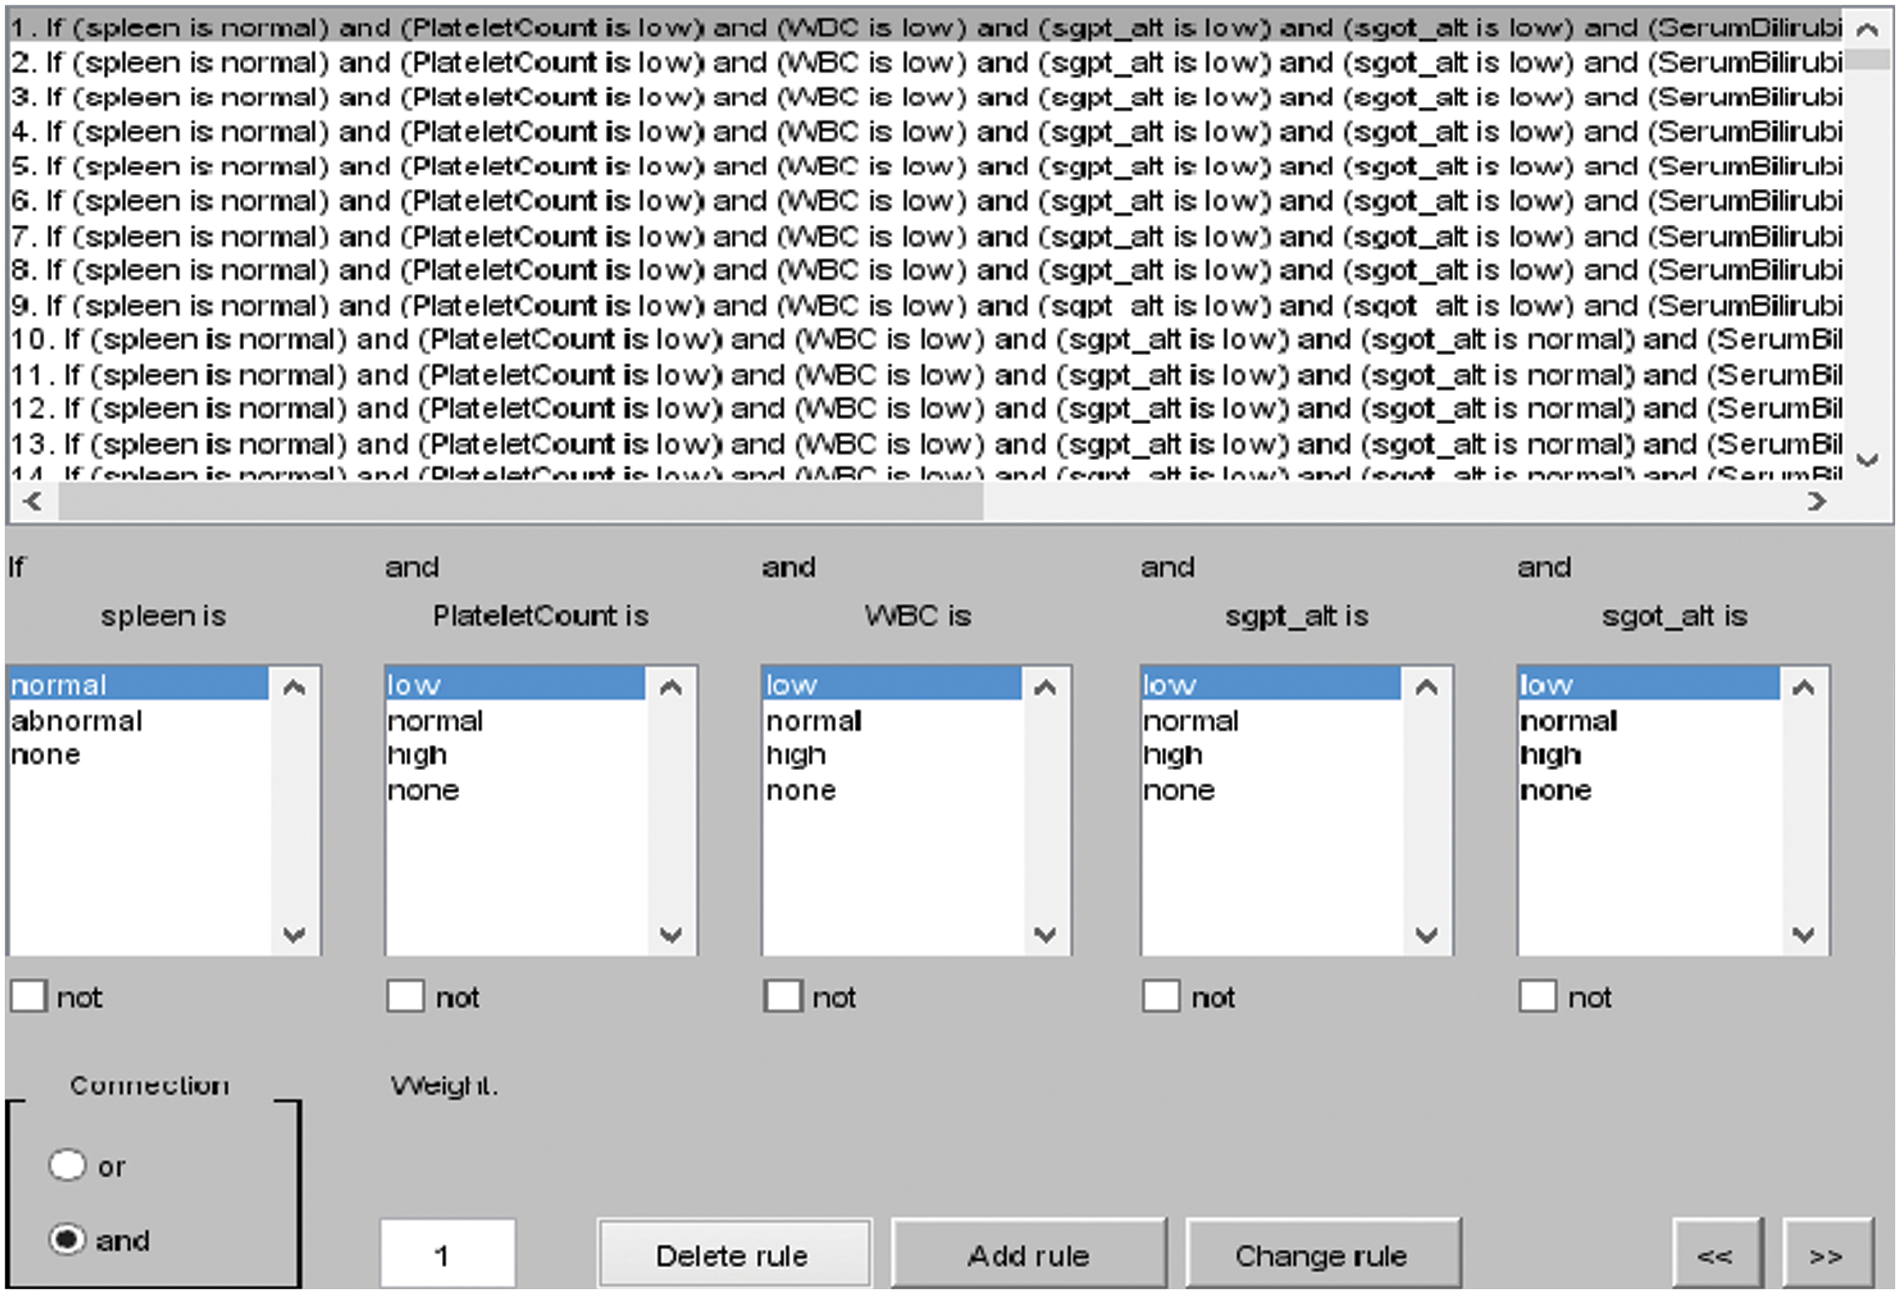
Figure 4: I/O rules for layer 2
Total rules for layer 2: membership functions of Platelet Count (PC) × membership functions of White Blood Cell Count (WBC) × membership functions of Spleen × membership functions of SGOT ALT × membership functions of SGPT ALT × membership functions of Serum Bilirubin × membership functions of Serum Albumin.
= 3 × 3 × 2 × 3 × 3 × 3 × 3 = 1458 rules.
The core module of an expert system is the inference engine. In the developed automated diagnosis of liver fibrosis by utilizing the multilayered fuzzy inference system, the Mamdani inference engine has been utilized in the entire methodology.
In the defuzzification module, the Defuzzifier is used. It is also an important module for an expert system and also has its different types. From the different kinds of Defuzzifier, the centroid method has been used in the developed model. Fig. 5 describes the surface area of the input variables of layer 1, and from Figs. 6a to 6c, the surface areas of the input variables of layer 2 are shown.
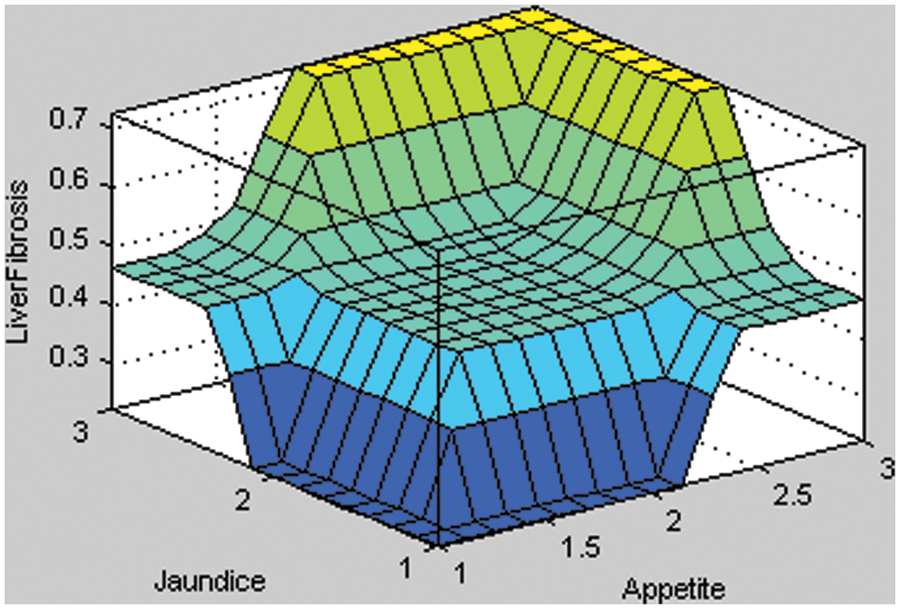
Figure 5: Surface area of appetite with Jaundice of layer 1
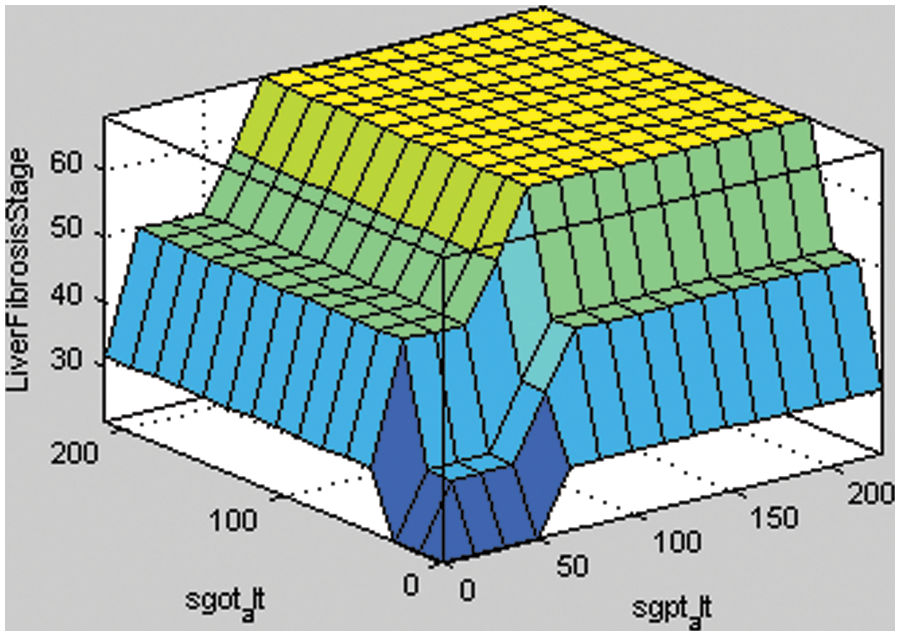
Figure 6: Surface areas of rules for SGPT ALT and SGOT ALT
In Fig. 5, the two input variables of layer 1, i.e., appetite and jaundice, are taken to form the surface area. If the given input of the appetite is less than the input value of jaundice, then the result is no liver fibrosis disease. Therefore, it implies that the probability of having liver fibrosis disease is less if the input value of appetite and jaundice is less. Similarly, the patient can be suffering from liver fibrosis disease if the given input value of the input variables is more.
Fig. 6a shows the stage of liver fibrosis based on two input variables, i.e., SGPT ALT with SGOT ALT. The different shades of colors represent the stages of liver fibrosis disease. If the given input value of SGPT ALT is higher, then the probability of having liver fibrosis disease in a particular patient is also increased. If there is a little increase in the value of input variables, then the color of the surface area is a light blue that presents minimal damage to the liver. Similarly, the rest of the colors of the surface area, such as cyan, light green, and yellow, describe the significant damage, severe damage, and cirrhosis, respectively.
The tool used for the whole process of development of a diagnostic system for liver fibrosis is MATLAB R2014a. This tool is very powerful in such cases as making a prototype, developing medical or any expert system, proposing algorithms, and so on. MATLAB is also a robust tool to visualize the data in various forms, analyze the given data, and for programming purposes [54,55]. In the developed medical diagnostic system for the diagnosis of LF, there are two layers. The output of layer 1 reveals if an individual has LF or not. Similarly, layer 2 depicts the stage or damage of the liver due to liver fibrosis disease of a particular patient, such as no damage, minimal damage, significant damage, severe damage, and cirrhosis. Hence, the developed system in this research work is also helpful for detecting the damage to the liver due to liver fibrosis disease of an individual.
The multi-layered fuzzy inference system is tested by taking different test cases to measure the correctness of the system. A confusion matrix is made up of these correct and incorrect tests, in Table 6, for the evaluation of performance parameters. As there are 160 tests captured to inspect the medical expert system, these 160 tests are completely different from each other. The first column of Table 6 is considered as no damage. There are 36 different tests with their result as no damage. When the inputs are given to the developed model, then it classifies them into the perfect class. The 2nd column is taken as the minimal damage to the liver. There are also 36 different test cases with the result of minimal damage. When these inputs are delivered to the system, out of 36, only 33 tests have the correct result and are classified into exact classes. However, the 3 tests from them are classified into the incorrect class. Similarly, column 3rd is considered significant damage to the liver. There are also 36 diverse tests given to the system with output significant damage. Out of those 36 tests, 2 are misclassified into the severe damage class, and 34 are classified into the true class. The 4th column of the confusion matrix is considered severe damage to the liver. The total number of tests for this class is 36, and all those tests are categorized into the exact classes. Likewise, the 5th column of the Table of a confusion matrix is taken as the cirrhosis, and also 36 tests are captured to analyze the system for this stage. Out of 36, 32 are classified correctly, and 4 are misclassified into the severe damage class of the model.
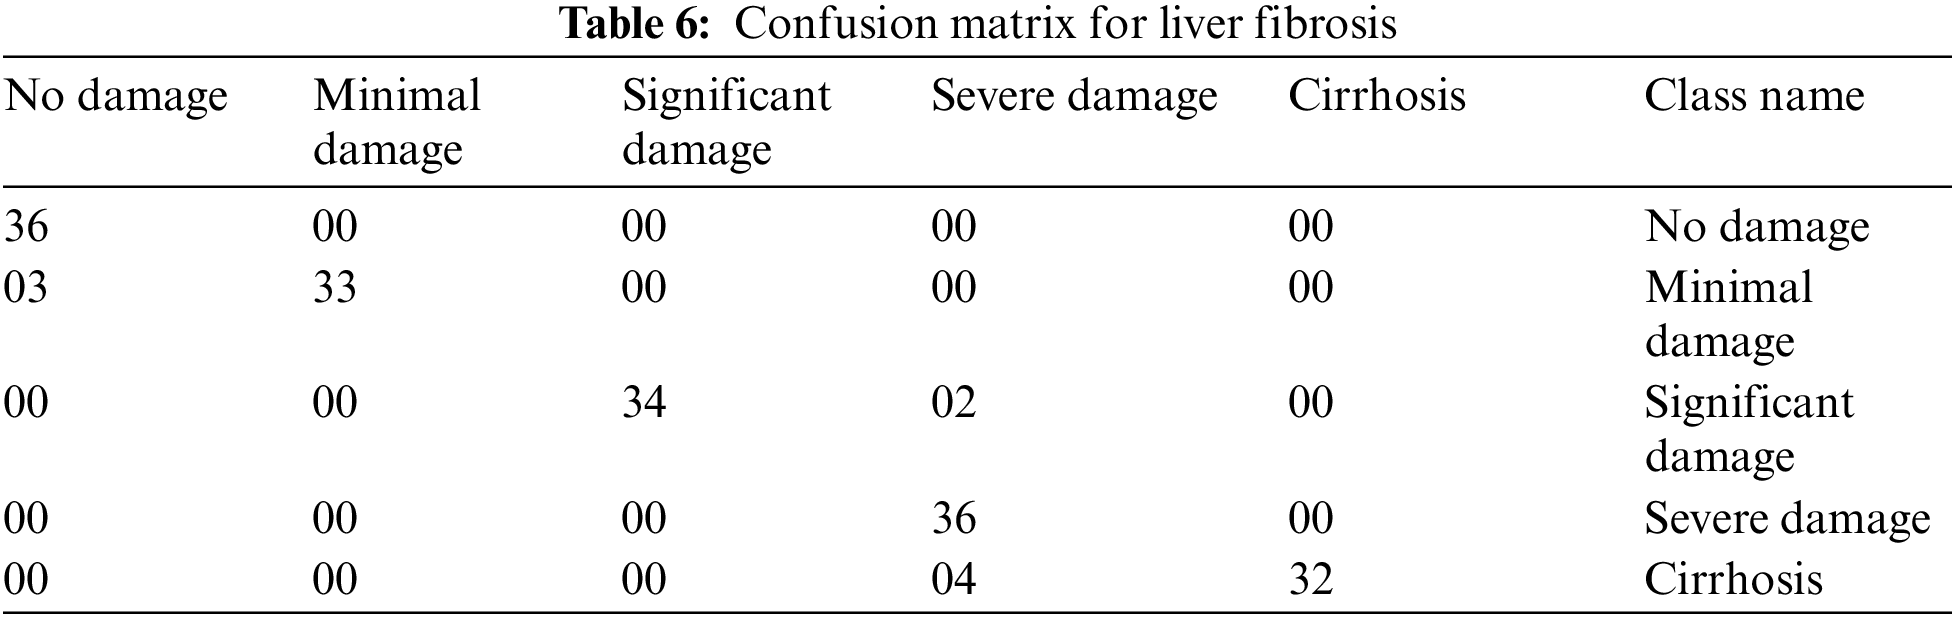
The confusion matrix has been reduced by taking the first two classes, i.e., no damage and minimal damage as “NO” and similarly, the rest of the three classes of model i.e., significant damage, severe damage, and cirrhosis as “YES”. Therefore, the dimensions of the confusion matrix for liver fibrosis are reduced from 5 * 5 to a 2 * 2 matrix. Table 7 shows this reduced dimensionality.
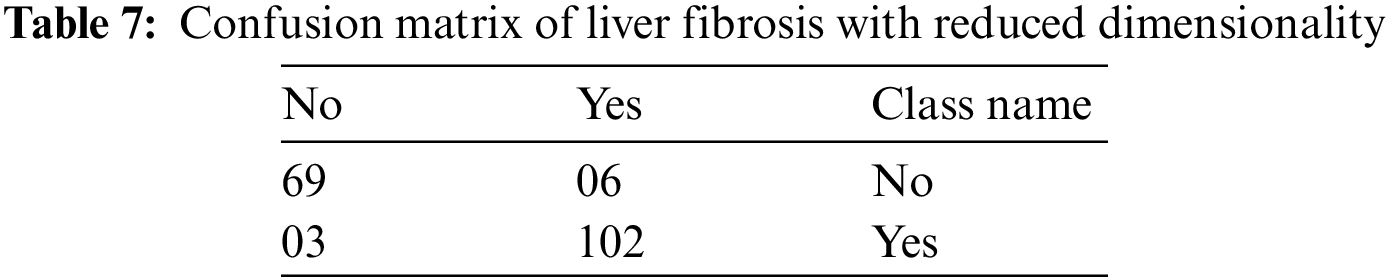
By using Table 7, the various performance parameters of the developed model have been calculated. These parameters are classification accuracy, precision, specificity, and sensitivity [56]. For the evaluation of these four performance parameters, the values of true positive (TP), false negative (FN), false positive (FP), and true negative (TN) are evaluated as 102, 03, 06, and 69, respectively, from Table 7. The mathematical expressions and calculations of these matrices are given by [57]:
The calculated values of performance parameters are represented in the graphical form in Fig. 7.
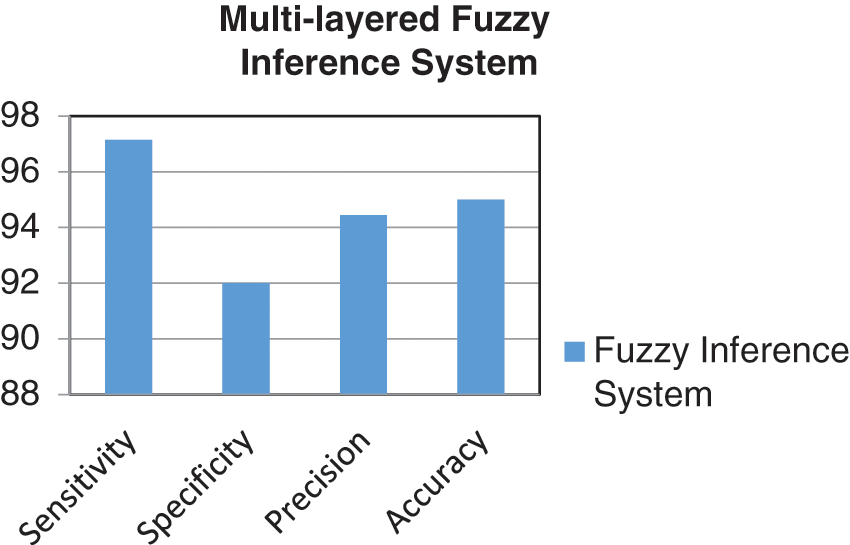
Figure 7: Graph of performance parameters
Figs. 8a and 8b display one of the samples of output generated by 1st and 2nd layers of the proposed multilayered fuzzy inference system for the diagnosis of liver fibrosis disease, respectively.
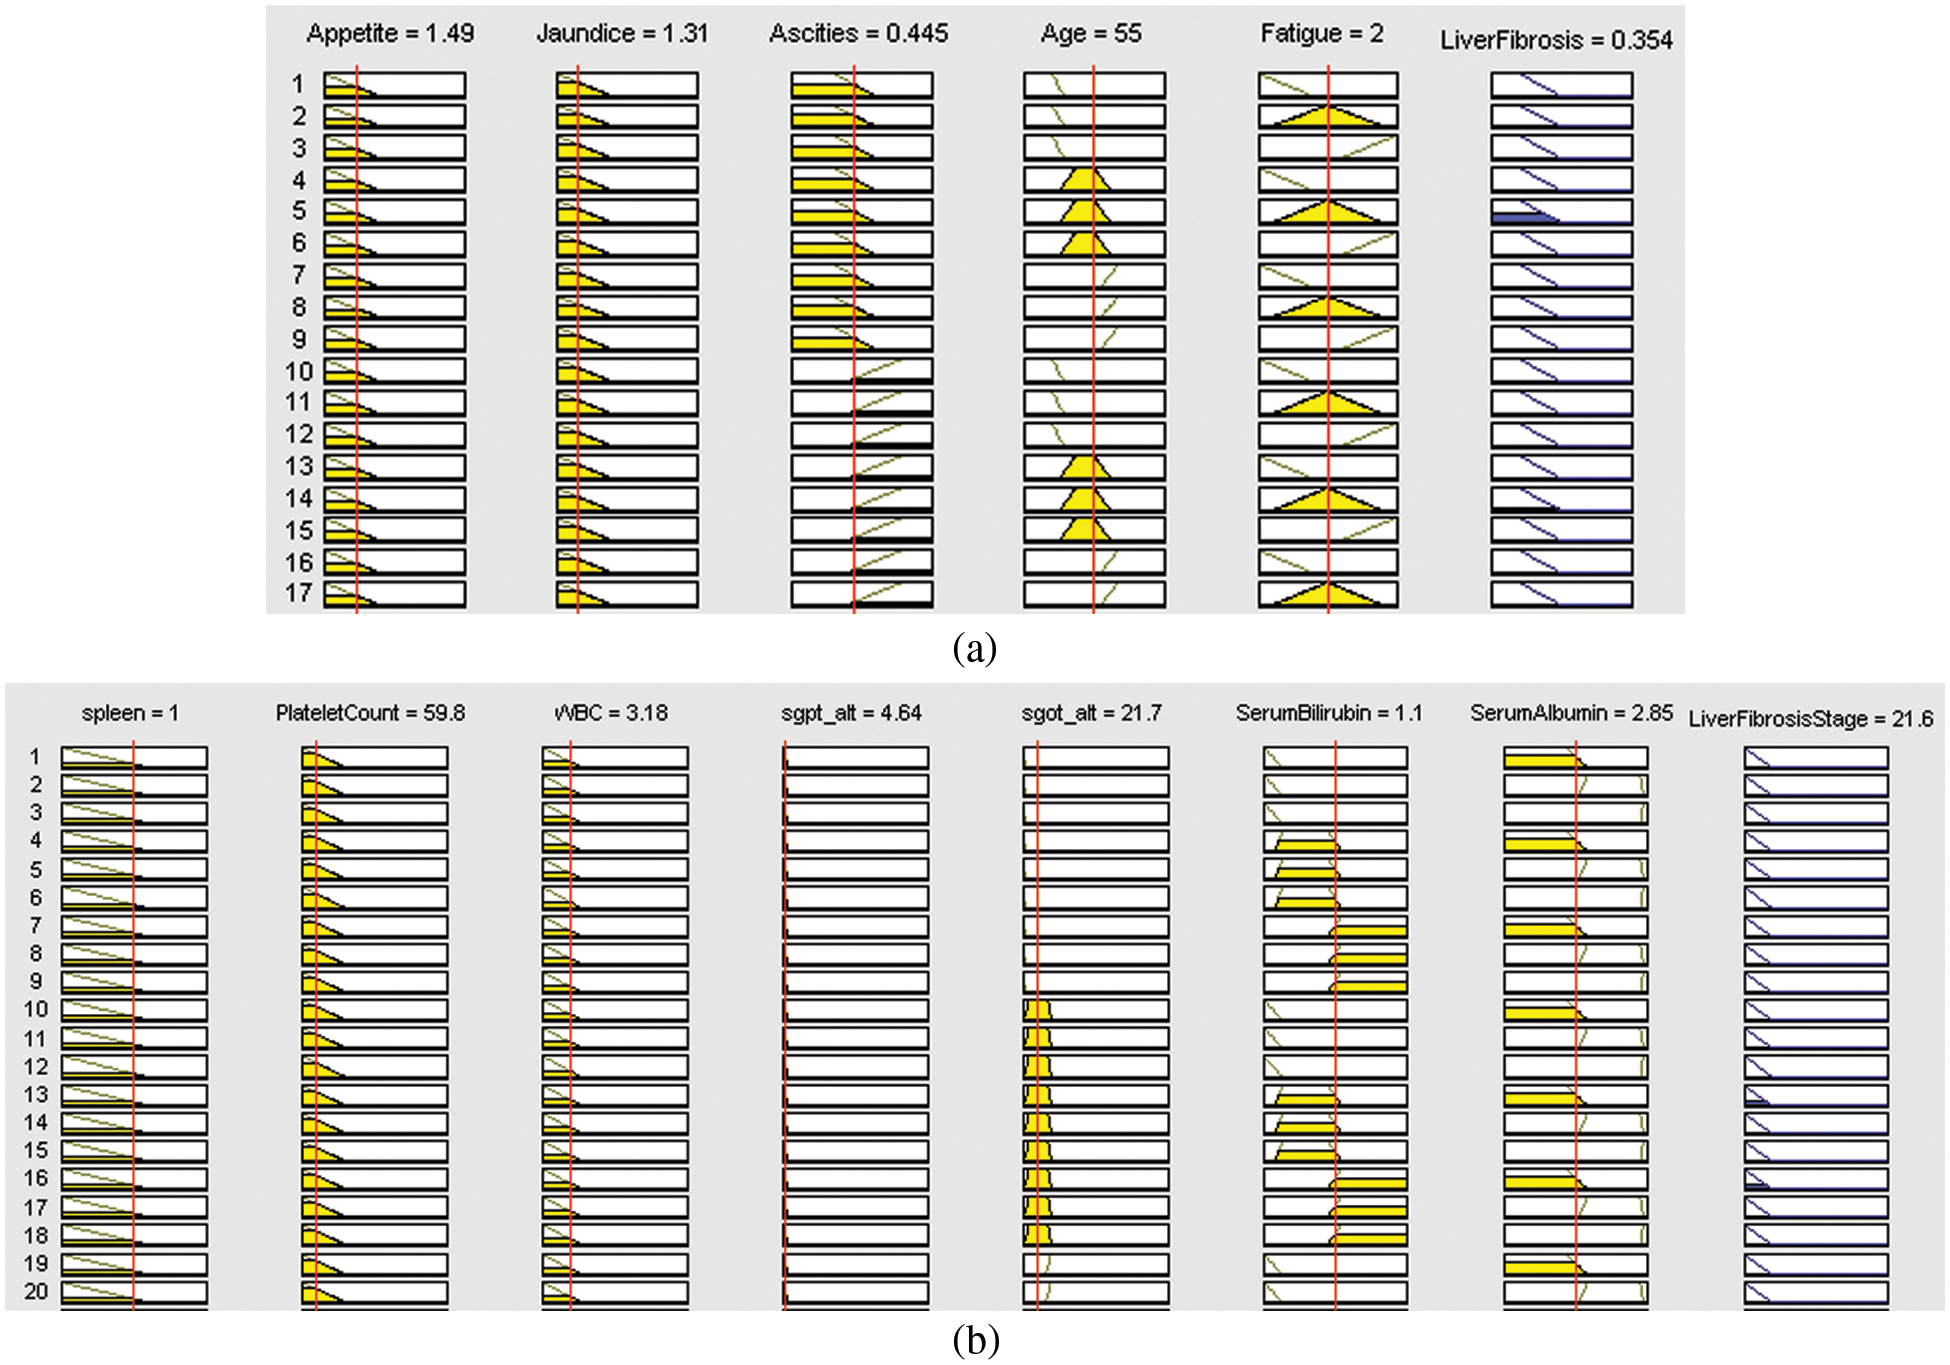
Figure 8: Rule view of (a) layer 1 of the developed system, (b) layer 2 of the developed system
The proposed methodology is tested by using 160 different test samples. The various performance measures are taken under consideration to measure the performance of the developed model. Additionally, a comparative study is conducted in which different methodologies, which mainly concentrate on the detection of liver fibrosis, utilized by the authors in the previous year or literature are compared with the proposed system is given in Table 8 and Fig. 9.
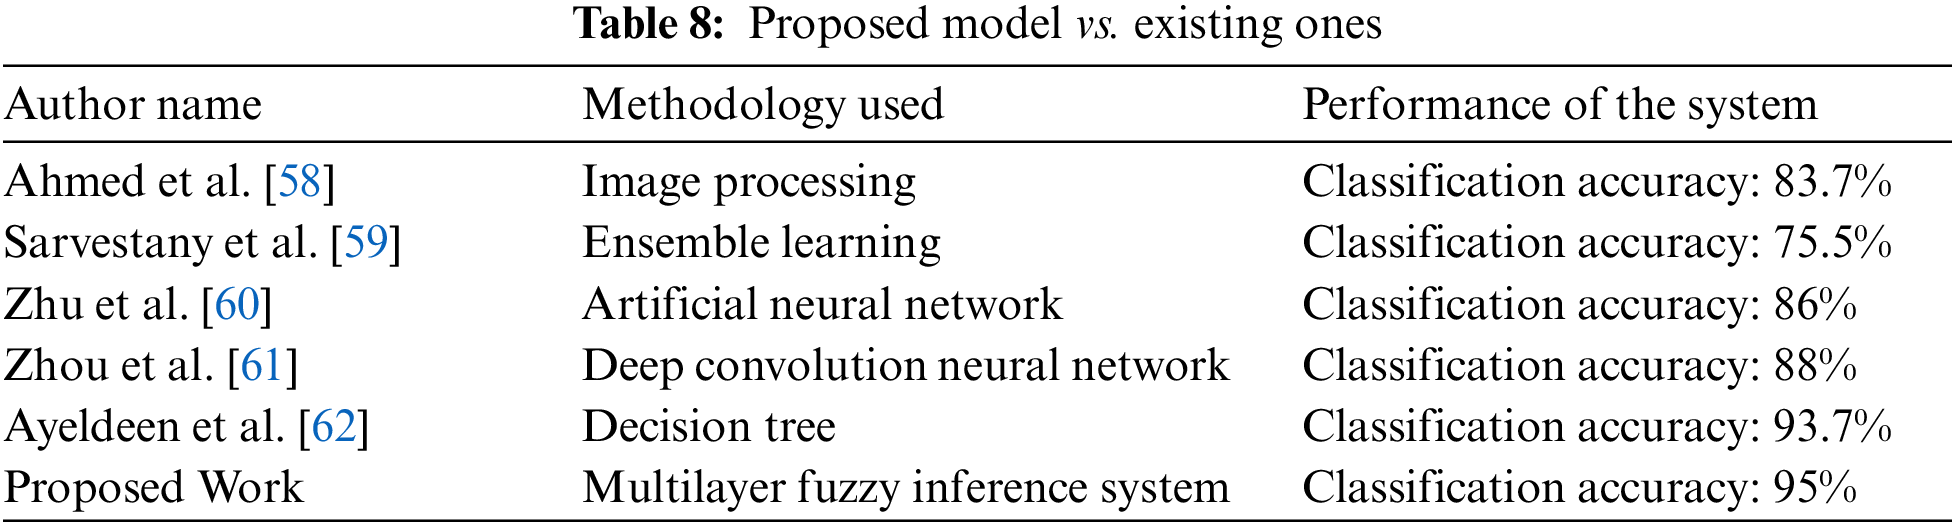
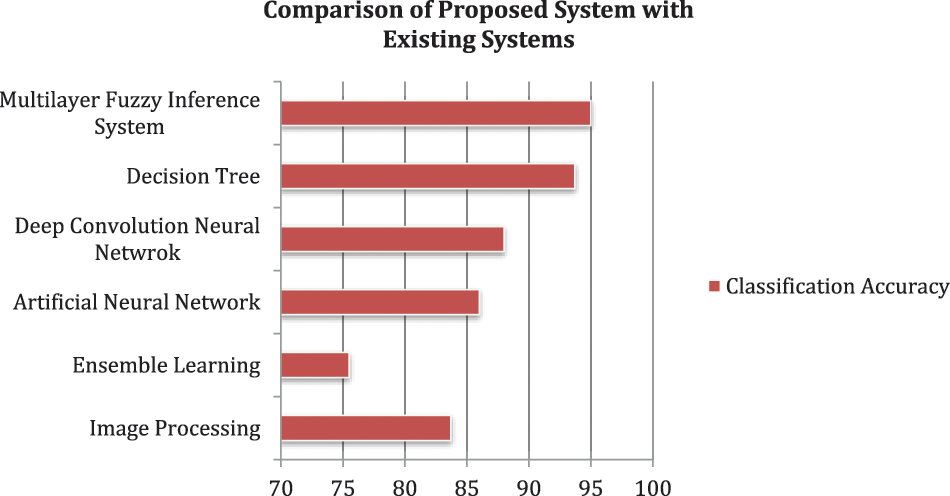
Figure 9: Comparison of proposed systems with existing systems
Rather than the classification accuracy, the developed system also takes less computational time as compared to the considered papers. This is because, in the methodology part, the inputs are divided into two layers; as a result of it, the rules of the system are also divided into two parts, i.e., 162 rules for layer 1 and 1458 rules for layer 2. However, if a single-layer fuzzy layer is utilized, then these rules are integrated, and the complexity of the model will also be increased. As a result, the computational time will also enhance. But, the methodology of using a multilayer fuzzy inference system overcomes this limitation and provides less complexity and time of computation as compared to other ML methodologies. Hence, the most crucial benefits of the developed model are that the methodology used is easy and simple as compared to the approaches cataloged in Table 8. Additionally, these approaches can only work with numeric data sets. However, fuzzy logic can handle the fuzzy set of inputs.
The experimental results of the research work depict that the proposed system based on fuzzy logic has 95% accuracy for classifying patients having liver fibrosis in their correct stages. The testing of the system suggests that the methodology used can differentiate the liver as having no damage, minimal damage, significant damage, severe damage, and cirrhosis. Additionally, the most widely used approach in this disease diagnosis is image processing [63–66]. But, this approach fails to detect it until or unless any physical symptoms have appeared in the liver. Therefore, the comparative study also showed a positive result as the introduced model acquired the maximum classification accuracy among all the considered methodologies, which were used by other authors for the same purpose.
In this work, an expert system has been developed by utilizing the Mamdani fuzzy inference system, which is capable of detecting liver fibrosis by giving certain inputs related to a patient. The work done can fulfill the main objective of the research. A supportive tool has been developed, which is quite easy and uncomplicated to use for medical professionals as well as for inexperienced doctors. The system can also be used by doctors who are in their training phase. Hence, this developed system can detect and diagnose LF and can be used in real-life applications. The accuracy is evaluated of the developed system is 95%. Similarly, the performance parameters like sensitivity, specificity, and precision are calculated as 97.14%, 92%, and 94.44%, respectively. The limitation of this paper is that it used only a few input variables, as with the increase of inputs, it is challenging to make an adequate decision for the membership function. Moreover, the number of rules is also directly proportional to the number of MFs for each input. Therefore, with the increasing number of inputs and their corresponding membership function, the number of rules will also increase, which are complex to handle, and also it will take more computational time if the rules are huge in number. However, the comparative study also showed a positive result as the introduced model acquired the maximum classification accuracy among all the considered methodologies, which were used by other authors for the same purpose.
In future work, the system’s performance can be increased. The productivity of the developed model can also be enhanced. Other techniques of soft computing, such as neural networks, genetic algorithms, and ANFIS can also be applied to enhance these parameters. The risk factors or causes such as type 2 diabetes, obesity, heavy alcohol use, nonalcoholic steatohepatitis (NASH), and chronic HCV infection, which are used as the input variables in the developed system for the diagnosis of LF disease, can also be increased to enhance the productivity of the particular system.
Funding Statement: The authors extend their appreciation to the Deputyship for Research& Innovation, Ministry of Education, Saudi Arabia, for funding this research work through the project number (QU-IF-4-4-4--26466). The authors also thank Qassim University for its technical support.
Conflicts of Interest: The authors declare that they have no conflicts of interest to report regarding the present study.
References
1. V. Hernandez-gea and S. L. Friedman, “Pathogenesis of liver fibrosis,” Annual Review of Pathology: Mechanisms of Disease, vol. 6, no. 1, pp. 425–456, 2011. [Google Scholar]
2. P. Schlichting, E. Christensen, L. Fauerholdt, H. Poulsen, E. Juhl et al., “Main causes of death in cirrhosis,” Scandinavian Journal of Gastroenterology, vol. 18, no. 7, pp. 881–888, 1983. [Google Scholar] [PubMed]
3. F. Badria and S. Gabr, “Prediction of liver fibrosis and cirrhosis among Egyptians using a noninvasive index,” J. Pure Appl. Microbiol, vol. 1, no. April, pp. 45–50, 2007. [Google Scholar]
4. R. Bataller and D. A. Brenner, “Science in medicine liver fibrosis,” The Journal of Clinical Investigation, vol. 115, no. 2, pp. 1203–1208, 2005. [Google Scholar]
5. W. M. C. Rosenberg, M. Voelker, R. Thiel, M. Becka, A. Burt et al., “Serum markers detect the presence of liver fibrosis: A cohort study,” Gastroenterology, vol. 127, no. 6, pp. 1704–1713, 2004. [Google Scholar] [PubMed]
6. M. A. Konerman, D. Lu, Y. Zhang, M. Thomson, J. Zhu et al., “Assessing risk of fibrosis progression and liver-related clinical outcomes among patients with both early stage and advanced chronic hepatitis c,” PLoS One, vol. 12, no. 11, pp. 1109–1122, 2017. [Google Scholar]
7. Y. Kumar, A. Koul, R. Singla and M. F. Ijaz, “Artificial intelligence in disease diagnosis: A systematic literature review, synthesizing framework and future research agenda,” Journal of Ambient Intelligence and Humanized Computing, vol. 13, pp. 1–28, 2022. [Google Scholar]
8. S. Dash, S. Verma, Kavita, S. Bevinakoppa, M. Wozniak et al., “Guidance image-based enhanced matched filter with modified thresholding for blood vessel extraction,” Symmetry, vol. 14, no. 2, pp. 1–19, 2022. [Google Scholar]
9. M. Mandal, P. K. Singh, M. F. Ijaz, J. Shafi, and R. Sarkar, “A Tri-stage wrapper-filter feature selection framework for disease classification,” Sensors, vol. 21, no. 16, pp. 5571–5594, 2021. [Google Scholar] [PubMed]
10. Z. Zeeshan, Q. ul Ain, U. A. Bhatti, W. H. Memon, S. Ali et al., “Feature-based multi-criteria recommendation system using a weighted approach with ranking correlation,” Intelligent Data Analysis, vol. 25, no. 4, pp. 1013–1029, 2021. [Google Scholar]
11. U. A. Bhatti, M. Huang, D. Wu, Y. Zhang, A. Mehmood et al., “Recommendation system using feature extraction and pattern recognition in clinical care systems,” Enterprise Information Systems, vol. 13, no. 3, pp. 329–351, 2018. [Google Scholar]
12. A. Vulli, P. N. Srinivasu, M. S. Sashank, J. Shafi, J. Choi et al., “Fine-tuned densent-169 for breast cancer metastasis prediction using FastAI and 1-cycle policy,” Sensors, vol. 22, no. 8, pp. 1–24, 2022. [Google Scholar]
13. T. Hussain, B. Yang, H. U. Rahman, A. Iqbal, F. Ali et al., “Improving source location privacy in social internet of things using a hybrid phantom routing technique,” Computers & Security, vol. 123, pp. 125–135, 2022. [Google Scholar]
14. S. El-Sappagh, F. Ali, T. Abuhmed, J. Singh and J. M. Alonso, “Automatic detection of Alzheimer’s disease progression: An efficient information fusion approach with heterogeneous ensemble classifiers,” Neurocomputing, vol. 512, pp. 203–224, 2022. [Google Scholar]
15. S. Ali, S. El-Sappagh, F. Ali, M. Imran and T. Abuhmed, “Multitask deep learning for cost-effective prediction of patient’s length of stay and readmission state using multimodal physical activity sensory data,” IEEE Journal of Biomedical and Health Informatics, vol. 26, pp. 5793–5804, 2022. [Google Scholar]
16. C. Zeng, J. Liu, J. Li, J. Cheng, J. Zhou et al., “Multi-watermarking algorithm for medical image based on kaze-DCT,” Journal of Ambient Intelligence and Humanized Computing, vol. 9, pp. 1–9, 2022. [Google Scholar]
17. W. Liu, J. Li, C. Shao, J. Ma, M. Huang et al., “Robust zero watermarking algorithm for medical images using local binary pattern and discrete cosine transform,” Advances in Artificial Intelligence and Security, vol. 1588, pp. 350–362, 2022. [Google Scholar]
18. Y. Li, J. Li, C. Shao, U. A. Bhatti and J. Ma, “Robust multi-watermarking algorithm for medical images using patchwork-DCT,” Lecture Notes in Computer Science, vol. 13340, pp. 386–399, 2022. [Google Scholar]
19. U. A. Bhatti, M. M. Nizamani and H. Mengxing, “Climate change threatens Pakistan’s snow leopards,” Science, vol. 377, no. 6606, pp. 585–586, 2022. [Google Scholar] [PubMed]
20. P. Naga Srinivasu, S. Ahmed, A. Alhumam, A. Bhoi Kumar and M. Fazal Ijaz, “An AW-haris based automated segmentation of human liver using CT images,” Computers, Materials & Continua, vol. 69, no. 3, pp. 3303–3319, 2021. [Google Scholar]
21. Z. Lu, E. Song, Q. Wang and X. Wang, “The liver fibrosis identification based on color 2D wavelet transform for the medical image,” in The Proc. of Int. Conf. on Wavelet Analysis and Pattern Recognition, Hong Kong, vol. 1, pp. 30–31, 2008. [Google Scholar]
22. T. Li, J. Li, J. Liu, M. Huang, Y. -W. Chen et al., “Robust watermarking algorithm for medical images based on log-polar transform,” EURASIP Journal on Wireless Communications and Networking, vol. 2022, no. 1, pp. 2602–2608, 2022. [Google Scholar]
23. U. A. Bhatti, Z. Ming-Quan, Q. Huo, S. Ali, A. Hussain et al., “Advanced color edge detection using Clifford algebra in satellite images,” IEEE Photonics Journal, vol. 13, no. 2, pp. 1–20, 2021. [Google Scholar]
24. P. Bhattacharya, D. Dutta, A. Roy and A. Halder, “Image segmentation for detecting fibrosis from rat liver images,” in The Proc. of Int. Conf. on Communication and Signal Processing (ICCSP), Chennai, India, pp. 873–877, 2018. [Google Scholar]
25. C. Vicas and S. Nedevschi, “Performance evaluation of the textural analysis algorithms in liver fibrosis detection using ultrasound software phantoms,” in The Proc. of the 6th Int. Conf. on Intelligent Computer Communication and Processing, Romania, pp. 155–162, 2010. [Google Scholar]
26. L. Dandan, M. Ruixiang, W. Yan, Z. Xianli and J. Qiao, “Multi-scale GLCM based quantitative assessment method for ultrasound liver fibrosis images,” in The Proc. of 13th Int. Conf. on Signal Processing (ICSP), China, pp. 677–680, 2016. [Google Scholar]
27. P. Lamb, D. V. Sahani, J. M. Fuentes-orrego, M. Patino, A. Ghosh et al., “Stratification of patients with liver fibrosis using dual-energy CT,” IEEE Transactions on Medical Imaging, vol. 0062, no. c, pp. 807–815, 2014. [Google Scholar]
28. N. Lu, C. Kuo and H. Ding, “Automatic ROI segmentation in B-mode ultrasound image for liver fibrosis classification,” in Int. Symp. on Biometrics and Security Technologies, Chengdu, Sichuan, China, pp. 10–13, 2013. [Google Scholar]
29. S. Mori, S. Hirata and H. Hachiya, “Comparison of modeling accuracy of amplitude distribution models for ultrasonic tissue characterization of liver fibrosis,” in 2016 IEEE Int. Ultrasonic Symp. (IUS), Kobe, Japan, pp. 8–11, 2016. [Google Scholar]
30. T. Higuchi, “Quantitative evaluation method of liver fibrosis using a multi-Rayleigh model with three echo envelope components,” in 2013 IEEE Int. Ultrasonic Symp. (IUS), Kobe, Japan, pp. 405–408, 2013. [Google Scholar]
31. S. Mori, S. Hirata, T. Yamaguchi and H. Hachiya, “Quantitative evaluation method for liver fibrosis in clinical ultrasound B-mode image based on optimized a Multi-Rayleigh model,” in 2018 IEEE Int. Ultrasonics Symp. (IUS), Japan, vol. 2, no. 1, pp. 1–4, 2018. [Google Scholar]
32. N. Giannakeas, M. G. Tsipouras, A. T. Tzallas, K. Kyriakidi, Z. E. Tsianou et al., “A Clustering-based method for collagen proportional area extraction in liver biopsy images,” in 2015 37th Annual Int. Conf. of the IEEE Engineering in Medicine and Biology Society (EMBC), Milan, Italy, 2015. [Google Scholar]
33. U. A. Bhatti, M. Huang, H. Wang, Y. Zhang, A. Mehmood et al., “Recommendation system for immunization coverage and monitoring,” Human Vaccines & Immunotherapeutics, vol. 14, no. 1, pp. 165–171, 2017. [Google Scholar]
34. S. Hashem, G. Esmat, W. Elakel, S. Habashy, S. A. Raouf et al., “Comparison of machine learning approaches for prediction of advanced liver fibrosis in chronic hepatitis C patients,” IEEE/ACM Transactions on Computational Biology and Bioinformatics, vol. 5963, no. c, pp. 1–13, USA, 2017. [Google Scholar]
35. P. Thong-on and U. Watchareeruetai, “Detection of fibrosis in liver biopsy images using multi-objective genetic programming,” in The Proc. of 9th Int. Conf. on Information Technology and Electrical Engineering (ICITEE), Phuket, Thailand, pp. 1–6, 2017. [Google Scholar]
36. J. Lara, “Hepatitis C virus genetic association to rate of liver fibrosis progression,” in The Proc. of 3rd Int. Conf. on Computational Advances in Bio and Medical Science (ICCABS), China, pp. 4673, 2013. [Google Scholar]
37. H. Ayeldeen, O. Shaker, G. Ayeldeen and K. M. Anwar, “Prediction of liver fibrosis stages by machine learning model: A decision tree approach,” in Third World Conf. on Complex System (WCCS), Marrakech, Morocco, pp. 1–6, 2015. [Google Scholar]
38. Yeh, B. Chen, L. Tseng, P. Jao, T. Su et al., “Shear wave elastography of a liver fibrosis mouse model using a high-frequency ultrasound system with mechanical scanning,” in IEEE Int. Ultrasonics Symp., Chicago, pp. 1140–1143, 2014. [Google Scholar]
39. Y. Li, Q. He and J. Luo, “A deep learning trial on transient elastography for assessment of liver fibrosis,” in 2018 IEEE Int. Ultrasonics Symp. (IUS), Dallas-Fortworth, TX, USA, no. 1, pp. 1–4, 2018. [Google Scholar]
40. P. Tavakkoli, D. M. Souran, S. Tavakkoli, M. Hatamian, A. Mehrabian et al., “Classification of the liver disorders data using multilayer adaptive neuro-fuzzy inference system,” in The Proc. of 6th Int. Conf. on Computing, Communication and Networking Technologies (ICCCNT), NW Washington, DC, United States, pp. 13–16, 2015. [Google Scholar]
41. B. Keltch, Y. Lin and C. Bayrak, “Comparison of AI techniques for prediction of liver fibrosis in hepatitis patients,” Journal of the Medical System, vol. 38, pp. 60, 2014. [Google Scholar]
42. M. Hashem, M. E. M. Rasmy, K. M. Wahba and O. G. Shaker, “Single stage and multistage classification models for the prediction of liver fibrosis degree in patients with chronic hepatitis C infection,” Computer Methods and Programs in Biomedicine, vol. 105, no. 3, pp. 194–209, 2011. [Google Scholar] [PubMed]
43. Y. Sela, M. Freiman, E. Dery, Y. Edrei, R. Safadi et al., “FMRI-Based hierarchical SVM model for the classification and grading of liver fibrosis,” IEEE Transactions on Biomedical Engineering, vol. 58, no. 9, pp. 2574–2581, 2011. [Google Scholar] [PubMed]
44. R. Lin and C. Chuang, “A hybrid diagnosis model for determining the types of the liver disease,” Computers in Biology and Medicine, vol. 40, no. 7, pp. 665–670, 2010. [Google Scholar] [PubMed]
45. T. Padma and P. Balasubramanie, “Expert systems with applications a fuzzy analytic hierarchy processing decision support system to analyze occupational menace forecasting the spawning of shoulder and neck pain,” Expert Systems with Applications, vol. 38, no. 12, pp. 15303–15309, 2011. [Google Scholar]
46. U. A. Bhatti, Z. Yu, J. Chanussot, Z. Zeeshan, L. Yuan et al., “Local similarity-based spatial-spectral fusion hyperspectral image classification with deep CNN and gabor filtering,” IEEE Transactions on Geoscience and Remote Sensing, vol. 60, pp. 1–15, 2022. [Google Scholar]
47. O. A. Arqub, “Adaptation of reproducing kernel algorithm for solving fuzzy Fredholm–Volterra integrodifferential equations,” Neural Computing and Applications, vol. 28, pp. 1591–1610, 2015. [Google Scholar]
48. E. Grossi, “How artificial intelligence tools can be used to assess individual patient risk in cardiovascular disease: Problems with the current methods,” BMC Cardiovascular Disorders, vol. 6, pp. 1–6, 2006. [Google Scholar]
49. M. A. Khan, S. Abbas, A. Athar, B. S. Khan and M. S. Aslam “Automated diagnosis of hepatitis B using multilayer Mamdani fuzzy inference system,” Journal of Healthcare Engineering, vol. 2019, no. 1, pp. 1–11, 2019. [Google Scholar]
50. V. Novák, “Which logic is the real fuzzy logic?” Fuzzy Sets and Systems, vol. 157, pp. 635–641, 2006. [Google Scholar]
51. E. Roventa and G. Rosu, “The diagnosis of some kidney diseases in a small prolog expert system,” in Proc.-2009 3rd Int. Workshop on Soft Computing Applications, SOFA 2009, Szeged-Arad, Romania, vol. 620, pp. 219–224, 2009. [Google Scholar]
52. S. El-sappagh, F. Ali, A. Ali, A. Hendawi, F. A. Badria et al., “Clinical decision support system for liver fibrosis prediction in hepatitis patients: A case comparison of two soft computing techniques,” IEEE Access, vol. 0, pp. 52911–52929, 2018. [Google Scholar]
53. J. Deng and Y. Deng, “Information Volume of Fuzzy Membership Function,” International Journal of Computers Communications & Control, vol. 16, no. 1, pp. 1–14, 2021. [Google Scholar]
54. L. Zhang, M. M. Bhatti, E. E. Michaelides, M. Marin and R. Ellahi, “Hybrid nanofluid flow towards an elastic surface with tantalum and nickel nanoparticles, under the influence of an induced magnetic field,” The European Physical Journal Special Topics, vol. 231, no. 3, pp. 521–533, 2021. [Google Scholar]
55. A. E. Abouelregal and M. Marin, “The size-dependent thermoelastic vibrations of nanobeams subjected to harmonic excitation and rectified sine wave heating,” Mathematics, vol. 8, no. 7, pp. 1128, 2020. [Google Scholar]
56. U. A. Bhatti, Y. Yan, M. Zhou, S. Ali, A. Hussain et al., “Time series analysis and forecasting of air pollution particulate matter (PM2.5An SARIMA and factor analysis approach,” IEEE Access, vol. 9, pp. 41019–41031, 2021. [Google Scholar]
57. S. Dash, S. Verma, Kavita, Md. S. Khan, M. Wozniak et al., “A hybrid method to enhance thick and thin vessels for blood vessel segmentation,” Diagnostics, vol. 11, no. 11, pp. 1–19, 2021. [Google Scholar]
58. Y. Ahmed, R. S. Hussein, T. A. Basha, A. M. Khalifa, A. S. Ibrahim et al., “Detecting liver fibrosis using a machine learning-based approach to the quantification of the heart-induced deformation in tagged MR images,” NMR in Biomedicine, vol. 33, no. 1, pp. 1–13, 2019. [Google Scholar]
59. S. S. Sarvestany, J. C. Kwong, A. Azhie, V. Dong, O. Cerocchi et al., “Development and validation of an ensemble machine learning framework for detection of all-cause advanced hepatic fibrosis: A retrospective cohort study,” The Lancet Digital Health, vol. 4, no. 3, pp. 188–199, 2022. [Google Scholar]
60. Z. Zhu, D. Lv, X. Zhang, S. -H. Wang and G. Zhu, “Deep learning in the classification of the stage of liver fibrosis in chronic hepatitis B with magnetic resonance ADC images,” Contrast Media & Molecular Imaging, vol. 2021, pp. 1–9, 2021. [Google Scholar]
61. Z. Zho, Z. Zhang, A. Gao, D. -I. Tai, S. Wu et al., “Liver fibrosis assessment using radiomics of ultrasound homodyned-K imaging based on the artificial neural network estimator,” Ultrasonic Imaging, vol. 44, no. 5–6, pp. 229–241, 2022. [Google Scholar]
62. H. Ayeldeen, O. Shaker, G. Ayeldeen and K. M. Anwar, “Prediction of liver fibrosis stages by machine learning model: A decision tree approach,” in 2015 Third World Conf. on Complex Systems (WCCS), Marrakech, Morocco, 2015, pp. 1–6. [Google Scholar]
63. U. A. Bhatti, L. Yuan, Z. Yu, J. B. Li, S. A. Nawaz et al., “New watermarking algorithm utilizing quaternion fourier transform with advanced scrambling and secure encryption,” Multimedia Tools and Applications, vol. 80, no. 9, pp. 13367–13387, 2021. [Google Scholar]
64. D. Yi, J. Li, Y. Fang, W. Cui, X. Xiao et al., “A robust zero-watermarking algorithm based on PHTs-DCT for medical images in the encrypted domain,” Innovation in Medicine and Healthcare, vol. 2021, pp. 101–113, 2021. [Google Scholar]
65. X. Xiao, J. Li, D. Yi, Y. Fang, W. Cui et al., “Robust zero watermarking algorithm for encrypted medical images based on DWT-Gabor,” Innovation in Medicine and Healthcare, vol. 242, pp. 75–86, 2021. [Google Scholar]
66. Y. Fang, J. Liu, J. Li, D. Yi, W. Cui et al., “A novel robust watermarking algorithm for encrypted medical image based on bandelet-DCT,” Innovation in Medicine and Healthcare, vol. 242, pp. 61–73, 2021. [Google Scholar]
Cite This Article
 Copyright © 2023 The Author(s). Published by Tech Science Press.
This work is licensed under a Creative Commons Attribution 4.0 International License , which permits unrestricted use, distribution, and reproduction in any medium, provided the original work is properly cited.
 Downloads
 Citation Tools