
 Submit a Paper
 Propose a Special lssue
 Open Access
ARTICLE

Quantum Cat Swarm Optimization Based Clustering with Intrusion Detection Technique for Future Internet of Things Environment
Information Technology Department, Faculty of Computing and Information Technology, King Abdulaziz University, Jeddah 21589, Saudi Arabia
* Corresponding Author: Mahmoud Ragab. Email:
Computer Systems Science and Engineering 2023, 46(3), 3783-3798. https://doi.org/10.32604/csse.2023.037130
Received 25 October 2022; Accepted 02 February 2023; Issue published 03 April 2023
 View Full Text
 Download PDF
Abstract
The Internet of Things (IoT) is one of the emergent technologies with advanced developments in several applications like creating smart environments, enabling Industry 4.0, etc. As IoT devices operate via an inbuilt and limited power supply, the effective utilization of available energy plays a vital role in designing the IoT environment. At the same time, the communication of IoT devices in wireless mediums poses security as a challenging issue. Recently, intrusion detection systems (IDS) have paved the way to detect the presence of intrusions in the IoT environment. With this motivation, this article introduces a novel Quantum Cat Swarm Optimization based Clustering with Intrusion Detection Technique (QCSOBC-IDT) for IoT environment. The QCSOBC-IDT model aims to achieve energy efficiency by clustering the nodes and security by intrusion detection. Primarily, the QCSOBC-IDT model presents a new QCSO algorithm for effectively choosing cluster heads (CHs) and organizing a set of clusters in the IoT environment. Besides, the QCSO algorithm computes a fitness function involving four parameters, namely energy efficiency, inter-cluster distance, intra-cluster distance, and node density. A harmony search algorithm (HSA) with a cascaded recurrent neural network (CRNN) model can be used for an effective intrusion detection process. The design of HSA assists in the optimal selection of hyperparameters related to the CRNN model. A detailed experimental analysis of the QCSOBC-IDT model ensured its promising efficiency compared to existing models.Keywords
The Internet of Things (IoT) realizes the connection of network topologies and sensing devices and adds new energy to advances in next-generation information technology [1]. The IoT comprises the sensing layer, application layer, and network layer. The application layer offers resource scheduling for the network layer and the precondition for the real-time task [2]. It consistently transmits the data attained by the sensors and, lastly, processes and analyses the data based on the requirement of the application [3]. The fundamental components are the sensors that organize themselves and interact with others in Wireless Sensor Network (WSN). Considering IoT as a networking model that interconnects a wide-ranging device to the internet, from wearable gadgets that take information from the body to sensor and device that interacts with the environment in a smart home and surveillance system in the smart city [4]. Optimum energy utilization at battery-powered nodes is always an exciting topic for researchers. The fast development of hardware technology has enabled devices to become smaller that possess new energy challenge that needs to be tackled. This single limitation imposes many others concerning selections of longevity, routing protocol, and network coverage [5].
A popular network topology management technique utilized for tackling the problem is named the clustering technique, whereby the node is grouped into various clusters, and cluster heads (CHs) are chosen [6]. During the earlier model, the distributed cluster was presented where; each sensor node (SN) determines function and transmission [7]. Several clustering techniques were introduced in the context of Wireless Sensor Networks (WSN) and homogeneous IoT [8]. But many of these algorithms have ignored the variety of energy profiles, considering that nodes have been provided with a similar energy level, and it causes faster energy depletion in nodes with weaker power. The traditional cluster analysis method cannot meet the requirement of IoT processing tasks based on real-time applications [9]. Thus, several researchers have suggested a density-based data stream clustering approach and presented the technique of predecessor that might enhance the efficiency and quality of the clustering technique. Because the sensors cannot replace with batteries, thus, energy preservation remains a challenge for WSN [10]. To resolve this problem, several clustering techniques were introduced and improved simultaneously.
Reference [11] presented an IDSS-based clustering routing method called GAPSO-SVM for IoT, employing an SVM-based technique for assessing the node places and a hybrid GA-PSO-based process to optimize clustering. In [12], a deep reinforcement learning (DRL) based smart routing model was presented to IoT-enabled WSN, enhancing network lifespan and considerably decreasing delay. The presented algorithm splits the entire networks into various unequal clusters dependent upon the present data load existing from the SNs that considerably prevents immature death of networks. Qaddoura et al. [13] present the technique of 3 phases, assuming a clustering with a reduction phase, oversampling phase, and a classifier by SLFN.
In [14], CL-IoT technology presented an effective and scalable protocol for decision-making and remote monitoring of farms from rural regions. The CL-based optimum CH selection solution was presented for overcoming the energy asymmetry problems from WSN. Goswami et al. [15] examine a new approach to executing Distributed Artificial Intelligence (DAI) with NNs for fast response and energy-effectual routing to the intra-cluster transmission of nodes to overcome the challenge of ITS. The presented method shows an optimum solution concerning the entire ECM by networks, together with the computational challenge. In [16], a layered structural design for IoT-cloud broadcast is presented, which approves the enhancement of latency, network lifespan, and energy efficacy. Besides, an Opposition-based Competitive Swarm Optimization oriented clustering method called OCSO-CA is presented for obtaining an optimum group of clusters from the IoT [17–19].
This article introduces a novel Quantum Cat Swarm Optimization based Clustering with Intrusion Detection Technique (QCSOBC-IDT) for IoT environment. The QCSOBC-IDT model presents a new QCSO algorithm for effectively choosing cluster heads (CHs) and organizing a set of clusters in the IoT environment. Besides, the QCSO algorithm computers a fitness function (FF) involving four parameters: energy efficiency, inter-cluster distance, intra-cluster distance, and node density. A harmony search algorithm (HSA) with a cascaded recurrent neural network (CRNN) is utilized for effective intrusion detection. A detailed experimental analysis of the QCSOBC-IDT model ensured its promising efficiency compared to existing models.
This work has developed a novel QCSOBC-IDT method to attain security and energy efficiency in the IoT network. The projected method follows a two-stage process: clustering and intrusion detection. The QCSOBC-IDT model derives a QCSO algorithm with FF for the clustering process. Besides, HSA with CRNN model is utilized to identify and categorize intrusions in the IoT environment. The design of HSA assists in the optimal selection of hyperparameters related to the CRNN model. Fig. 1 shows the workflow of the QCSOBC-IDT model.
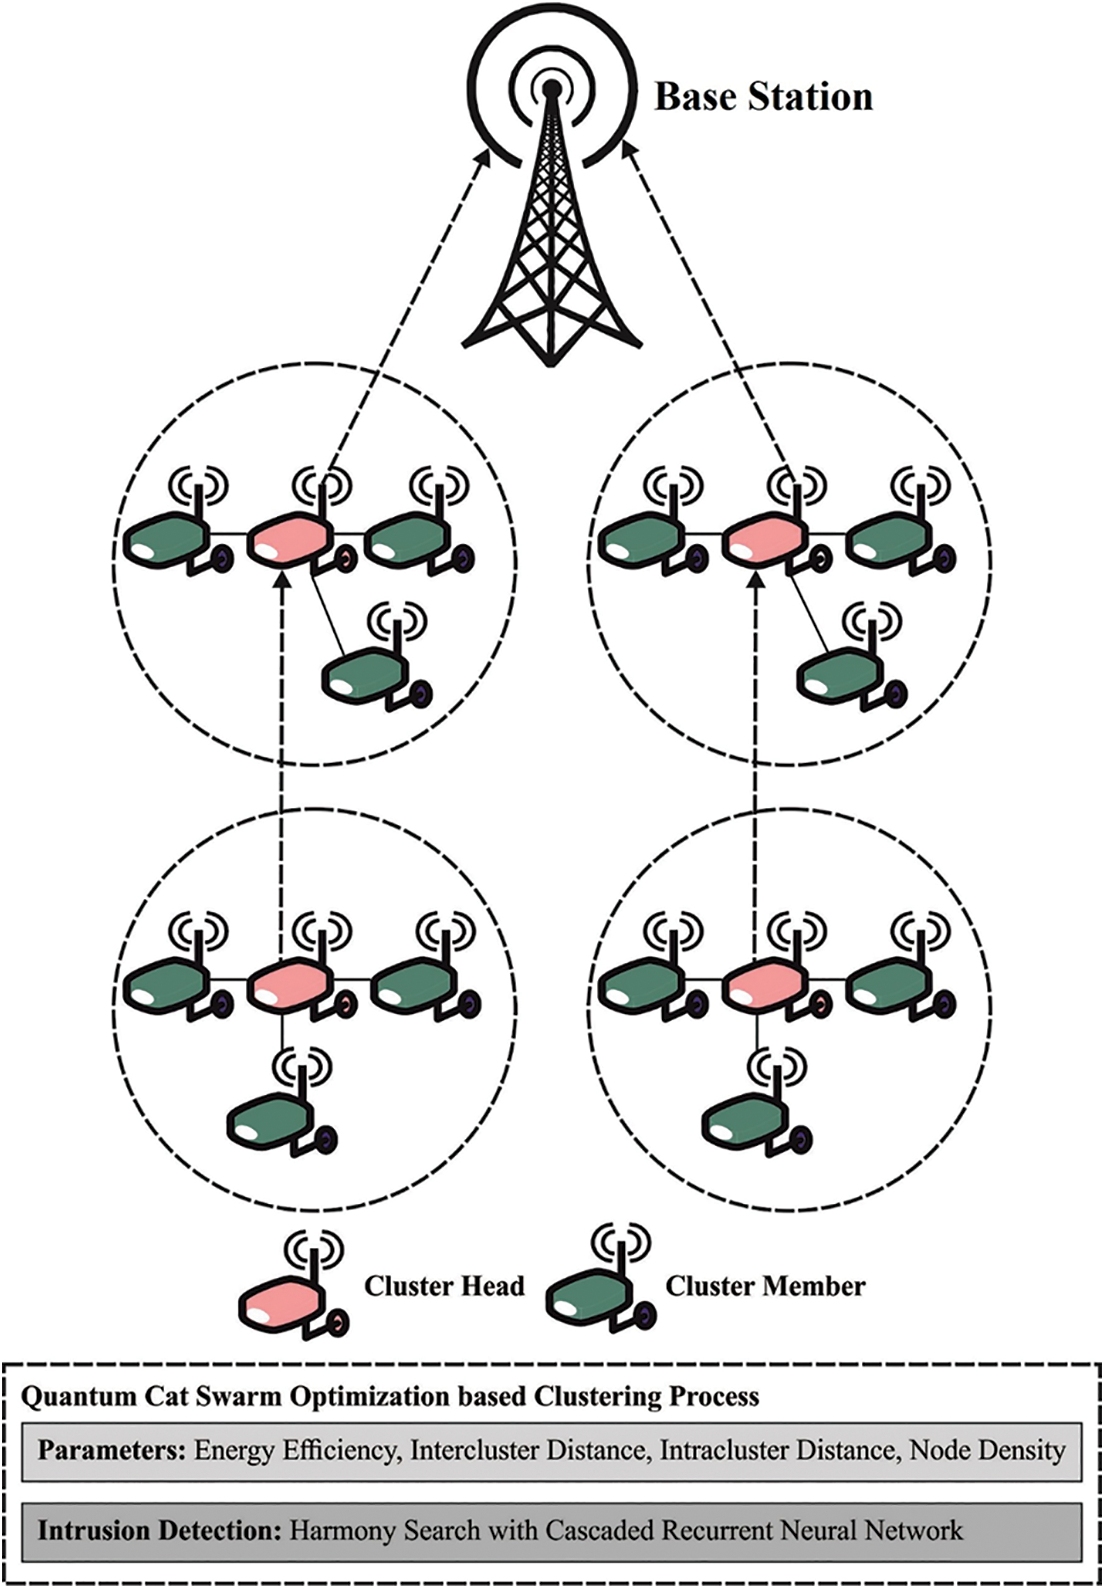
Figure 1: Workflow of QCSOBC-IDT model
2.1 Algorithmic Design of QCSO Algorithm
The CSO approach is inspired by two features of cats, such as the Tracking Mode (TM) and the Seeking Model (SM). In the presented approach, the cat possesses the D-dimension location, the dimension velocity, the fitness value representing the cat into the FF, and the flag to distinguish the existence of TM or SM. The optimum location of the cat can define the concluding solution and sustain the optimum one until the process is ended [20].
For modelling the features of a cat in the duration of the alert and resting states, SM is utilized. It comprises four main parameters: SPC, SMP, SRD, and CDC. The process included in SM is shown below:
Stepl: Generate
Step 2: For each copy based on CDC, randomly subtract the present value of the SRD percentage and substitute it with the initial value.
Step 3: Define the Fitness Value for all the candidate points.
Step 4: Once each FS is non-identical, define the selection probability of every candidate point, then assume the selection probability of candidate point as ′1′.
Step 5: Define the FF for all the cats. Once the FF for all the cats remains the same, then the possibility of selecting a cat becomes 1; the possibility
In which Fi represents the fitness values of cats,
TM is the next mode of the CSO approach, where the cat aims at tracking the food and target. The procedure is given in the following [21]:
Step 1: Upgrade the velocity of each dimension.
Step 2: Guarantee the velocity falls inside the range of the highest velocity. Once the new velocity is higher than the range, it is assumed as equivalent to limits:
Step3: Upgrade the location of
The quantum gates were appropriate for adjusting the form of qubits, namely the Hadamard gate, rotation gate, NOT gate, and so on. At first, the Rotation gate was established as a mutation operator to make a productive quanta method and recognize the global optimum solution. It can be demonstrated in the following expression:
2.2 Process Involved in QCSO-Based Clustering Algorithm
The QCSOBC-IDT model derives a QCSO algorithm with FF for the clustering process. Here, the QCSO-based clustering method is developed by including cluster node density, energy efficacy of the IoT device node, distance from CH to sink, and an average distance of IoT devices to the CH surrounded by the sensing series. Information on fitness parameters is shown in the following.
Energy efficiency: The CH executes many events, namely data communication gathering, sensing, aggregation, etc.; thus, CH intake highest energy than others. Next, it is important to define a FF that shares the load amongst every IoT device.
Cluster node density: cost is a significant variable for raising the energy efficiency of the network. A larger amount of nodes from the sequence of CHs used in preserving the energy from the network:
where
Intra-cluster distance: IoT devices transport information to the CH. Once CH is distant from CM, the IoT device depletes energy; once CH is closer to the member IoT device, it employs minimal energy.
Whereas
Intercluster distance: When implementing CH, the distance between the BS and CHs plays a major function as the CH is distant in the sink and employs energy faster that is calculated in the following:
Now,
Whereas
2.3 Intrusion Detection Process
In this work, to identify and categorize intrusions in the IoT environment, the HSA with CRNN is utilized. Compared to the LSTM unit, GRU requires fewer parameters highly relevant to the classifier and a constrained amount of trained samples. Hence, the GRU was elected as an essential component of RNN [22]:
Whereas
In which
whereas
Particularly,
Moreover, all the sub-sequences can be the initial layer of RNN that is the same structure and distributing parameter to minimize the parameter. The feature representations to
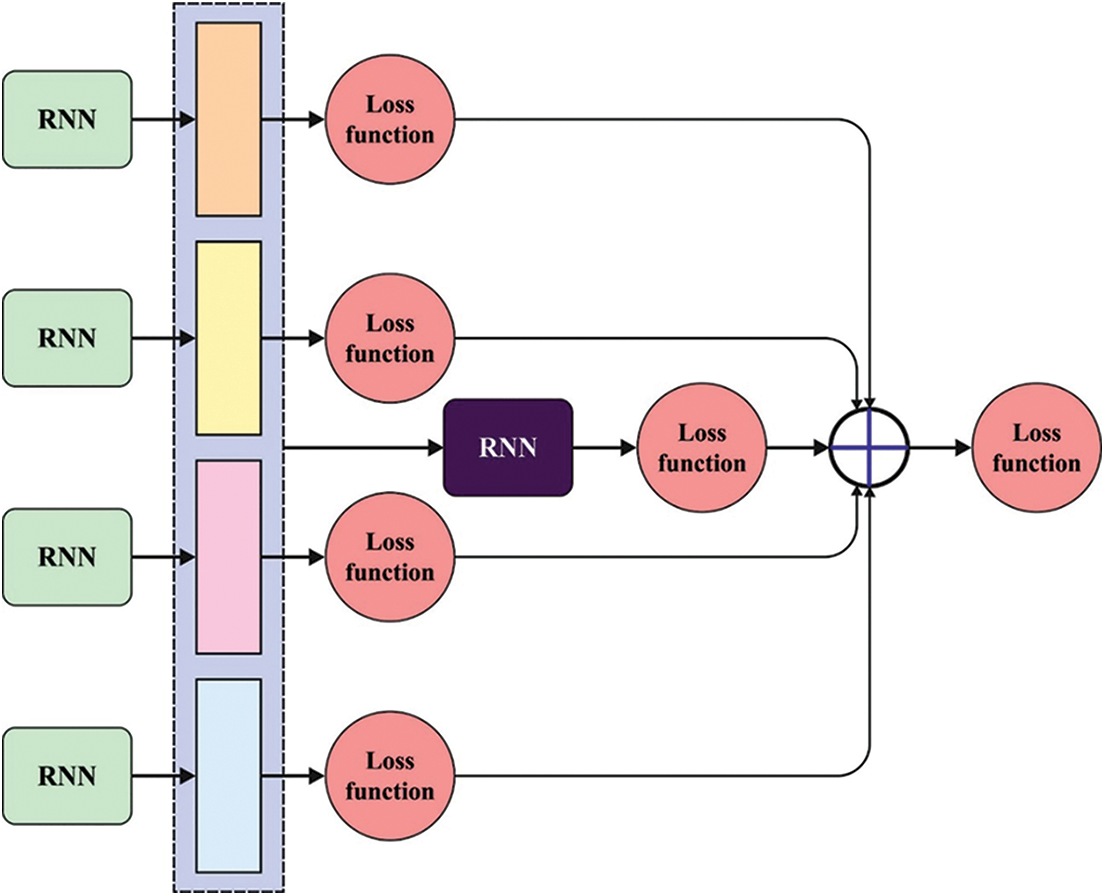
Figure 2: Structure of CRNN model
To optimally modify the hyperparameter in the CRNN model, the HSA is utilized. For improving the classifier outcomes of the CRNN, the HSA is employed to alter the parameter. HSA is a metaheuristic search on optimization issues that creates a precise state of harmony by creating a search process [23]. The natural musical technique is improvised to produce an optimum state of harmony. It can be an optimization method like local and global search approaches to determine optimum solutions. HS is a group of solution vectors called harmony memory (HM). In contrast, all individuals (harmony or vector) are similar to the DE or GA chromosome and particles in PSO. Optimization with the harmony search technique is listed in the following.
Step1: Initializing the Control Parameter.
Step 2: Initialization of the Harmony memory.
Step 3: Evaluate the efficacy of current harmony.
Step 4: Evaluate the efficacy of newly developed harmony and improvise harmony.
Step5: Check end criteria.
The HSA algorithm primarily defines a fitness value by accomplishing maximum classifier outcomes. It calculates a positive integer to illustrate better outcomes on the candidate solution. Now, the classifier error rate reduction is processed as the FF. The optimal solution holds a minimum error rate, and a poorly accomplished solution provides a higher error rate.
This section inspects the experimental outcome of the QCSOBC-IDT model, and the results are investigated in several aspects. This study, the KDD99 dataset is used (available at http://kdd.ics.uci.edu/databases/kddcup99/kddcup99.html). KDD99 can be easily used in machine learning datasets; therefore, it is much more used in IDS and general research than the DARPA dataset. It has two weeks of attacks-free instances and five weeks of attack instances, making it suitable for anomaly detection. Output classes are divided into 5 main categories. The sample distribution of the dataset under five classes is given below
• Normal (training samples: 972781/testing samples: 60593)
• DOS (training samples: 3883390/testing samples: 231455)
• Probe (training samples: 341102/testing samples: 4166)
• U2R (training samples: 245/testing samples: 52)
• R2L (training samples: 14570/testing samples: 1160)
Table 1 provides a brief ECM and NLT examination of the QCSOBC-IDT with recent models under different IoT nodes [24]. Fig. 3 inspects the ECM assessment of the QCSOBC-IDT method with existing models under various IoT nodes. The figure indicated that the QCSOBC-IDT technique had reached maximum performance with the least ECM under all IoT nodes. For example, on 100 IoT nodes, the QCSOBC-IDT technique has gained the least ECM of 26.83 mJ. In contrast, the EAANFC technique, FEEC model, MOBFO approach, FRLDG system, and TCBDGA algorithm have attained maximum ECM of 26.83, 33.08, 45.56, 59.19, and 64.30mJ correspondingly. Additionally, on 500 IoT nodes, the QCSOBC-IDT method has provided a lower ECM of 94.38 mJ. In contrast, the EAANFC technique, FEEC technique, MOBFO approach, FRLDG system, and TCBDGA algorithm demonstrated higher ECM of 119.36, 134.68mJ, respectively 163.06, 181.23, and 231.18 mJ correspondingly.
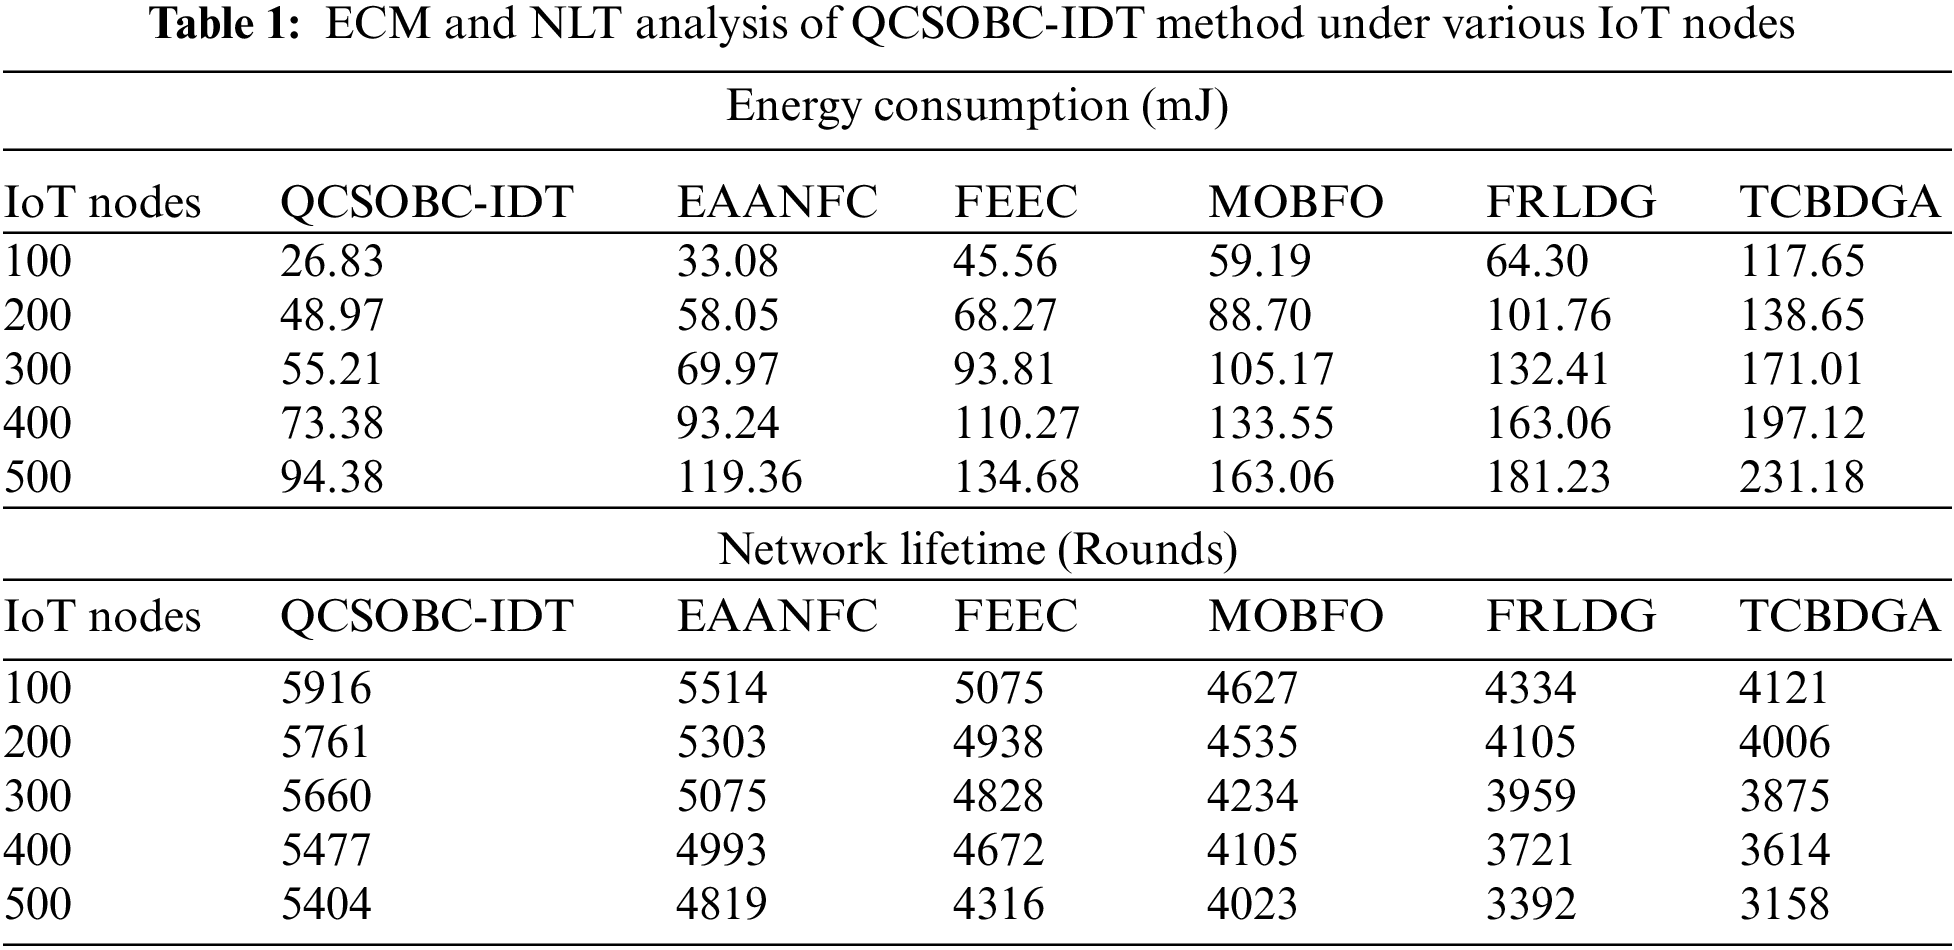
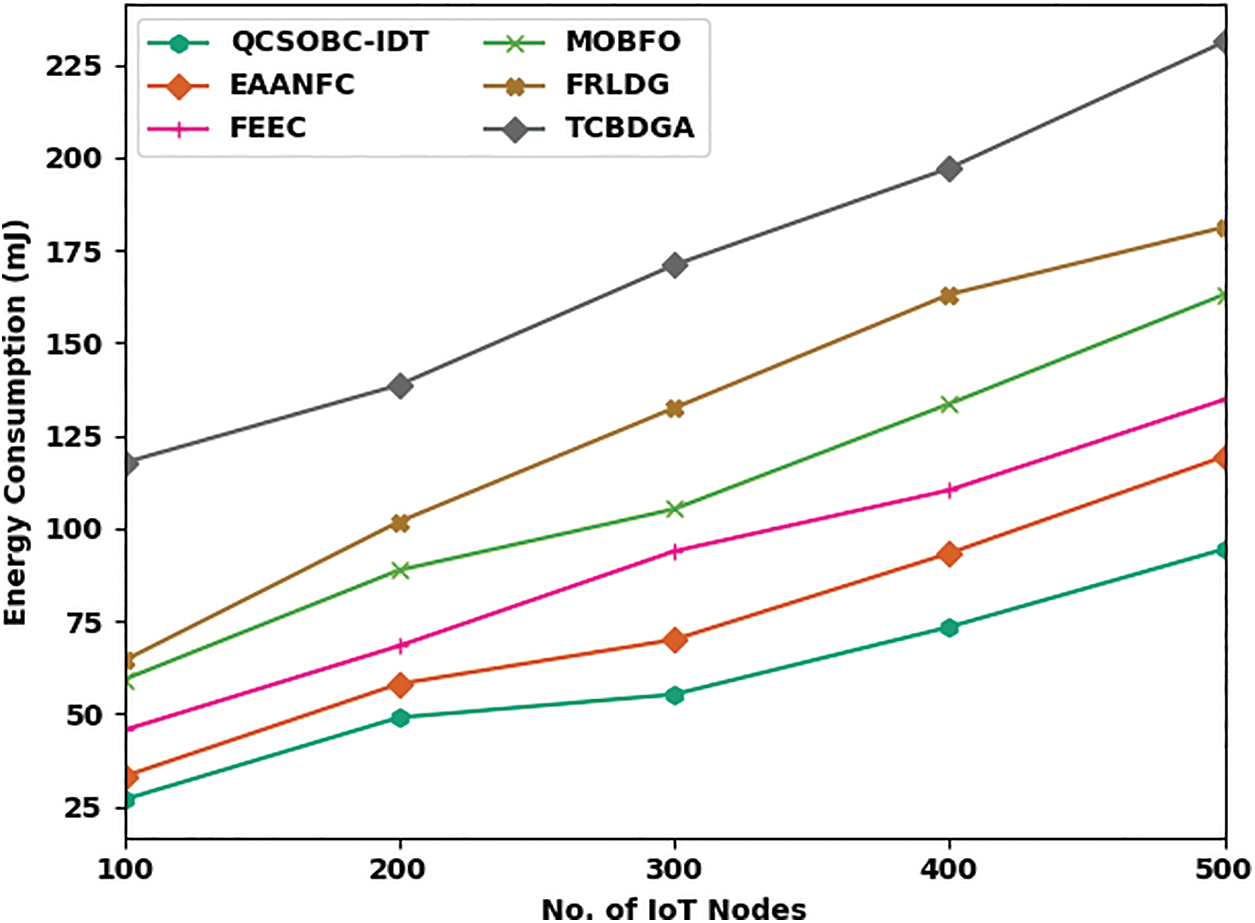
Figure 3: ECM analysis of QCSOBC-IDT approach under various IoT nodes
Detailed comparative NLT outcomes of the QCSOBC-IDT model with recent approaches are made in Fig. 4. The obtained results implied the betterment of the QCSOBC-IDT model over the other models under all IoT nodes. For example, on 100 IoT nodes, the QCSOBC-IDT method has reached a higher NLT of 5916 rounds. In contrast, the EAANFC technique, FEEC model, MOBFO approach, FRLDG system, and TCBDGA algorithm have provided lower NLT of 5514, 5075, 4627, 4334, and 4121 rounds correspondingly. Moreover, on 500 IoT nodes, the QCSOBC-IDT model has gotten a greater NLT of 5404 rounds. In contrast, the EAANFC technique, FEEC model, MOBFO approach, FRLDG system, and TCBDGA algorithm have provided lesser NLT of 4819, 4316, 4023, 3392, and 3158 rounds correspondingly.
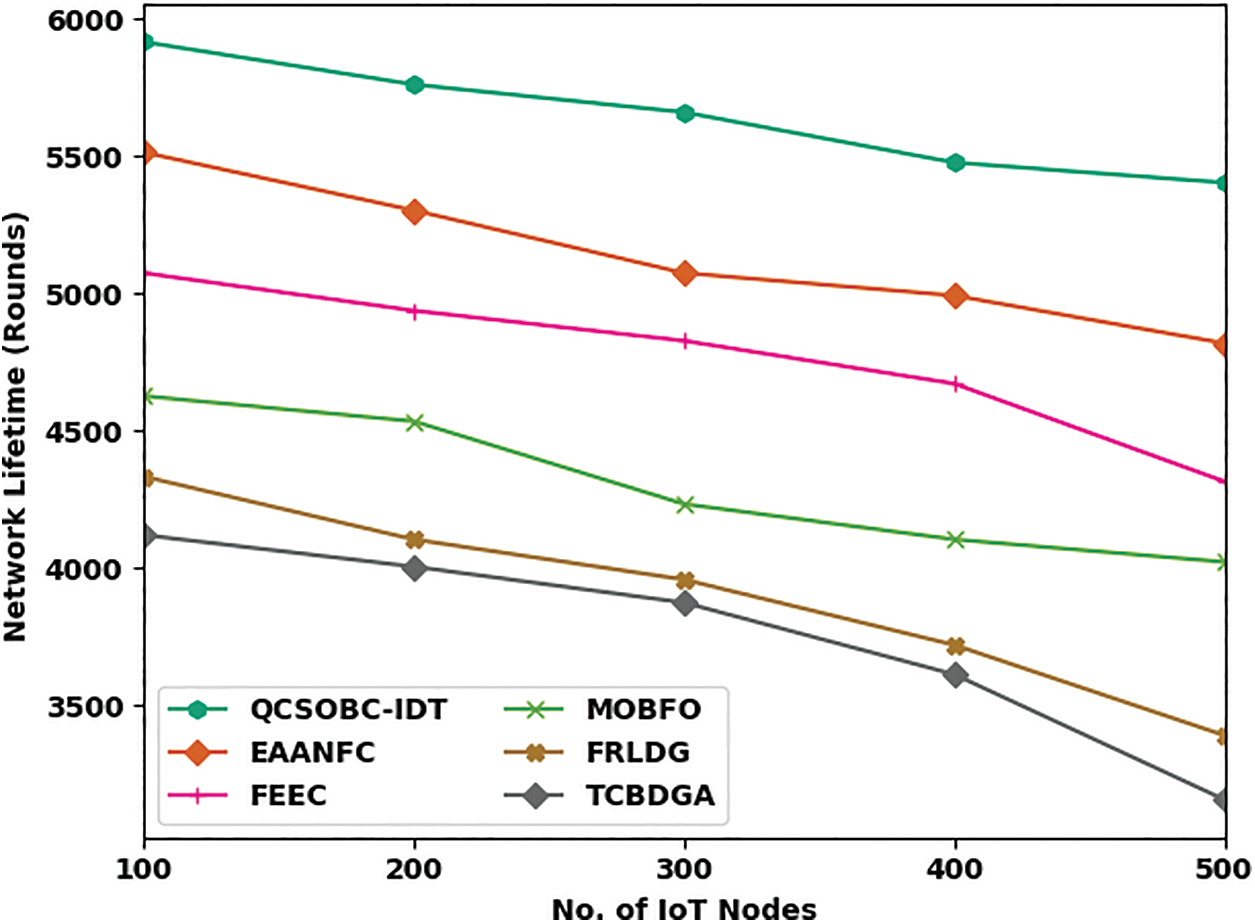
Figure 4: NLT analysis of QCSOBC-IDT technique under various IoT nodes
Table 2 offers a brief PDR and PLR examination of the QCSOBC-IDT model with current models under different IoT nodes. Comparative PDR outcomes of the QCSOBC-IDT model with current methods are made in Fig. 5. The attained outcomes implied the improvement of the QCSOBC-IDT model over the other models under all IoT nodes. For example, on 100 IoT nodes, the QCSOBC-IDT model has reached a high PDR of 99.27% while the EAANFC technique, FEEC model, MOBFO approach, FRLDG system, and TCBDGA algorithm provide a low PDR of 98.16%, 97.69%, 96.66%, 94.70%, and 91.35% correspondingly. Furthermore, on 500 IoT nodes, the QCSOBC-IDT model has gotten a great PDR of 98.58% while the EAANFC technique, FEEC model, MOBFO approach, FRLDG system, and TCBDGA algorithm have provided less PDR of 95.68%, 94.01%, 92.05%, 89.96%, and 85.17% correspondingly.
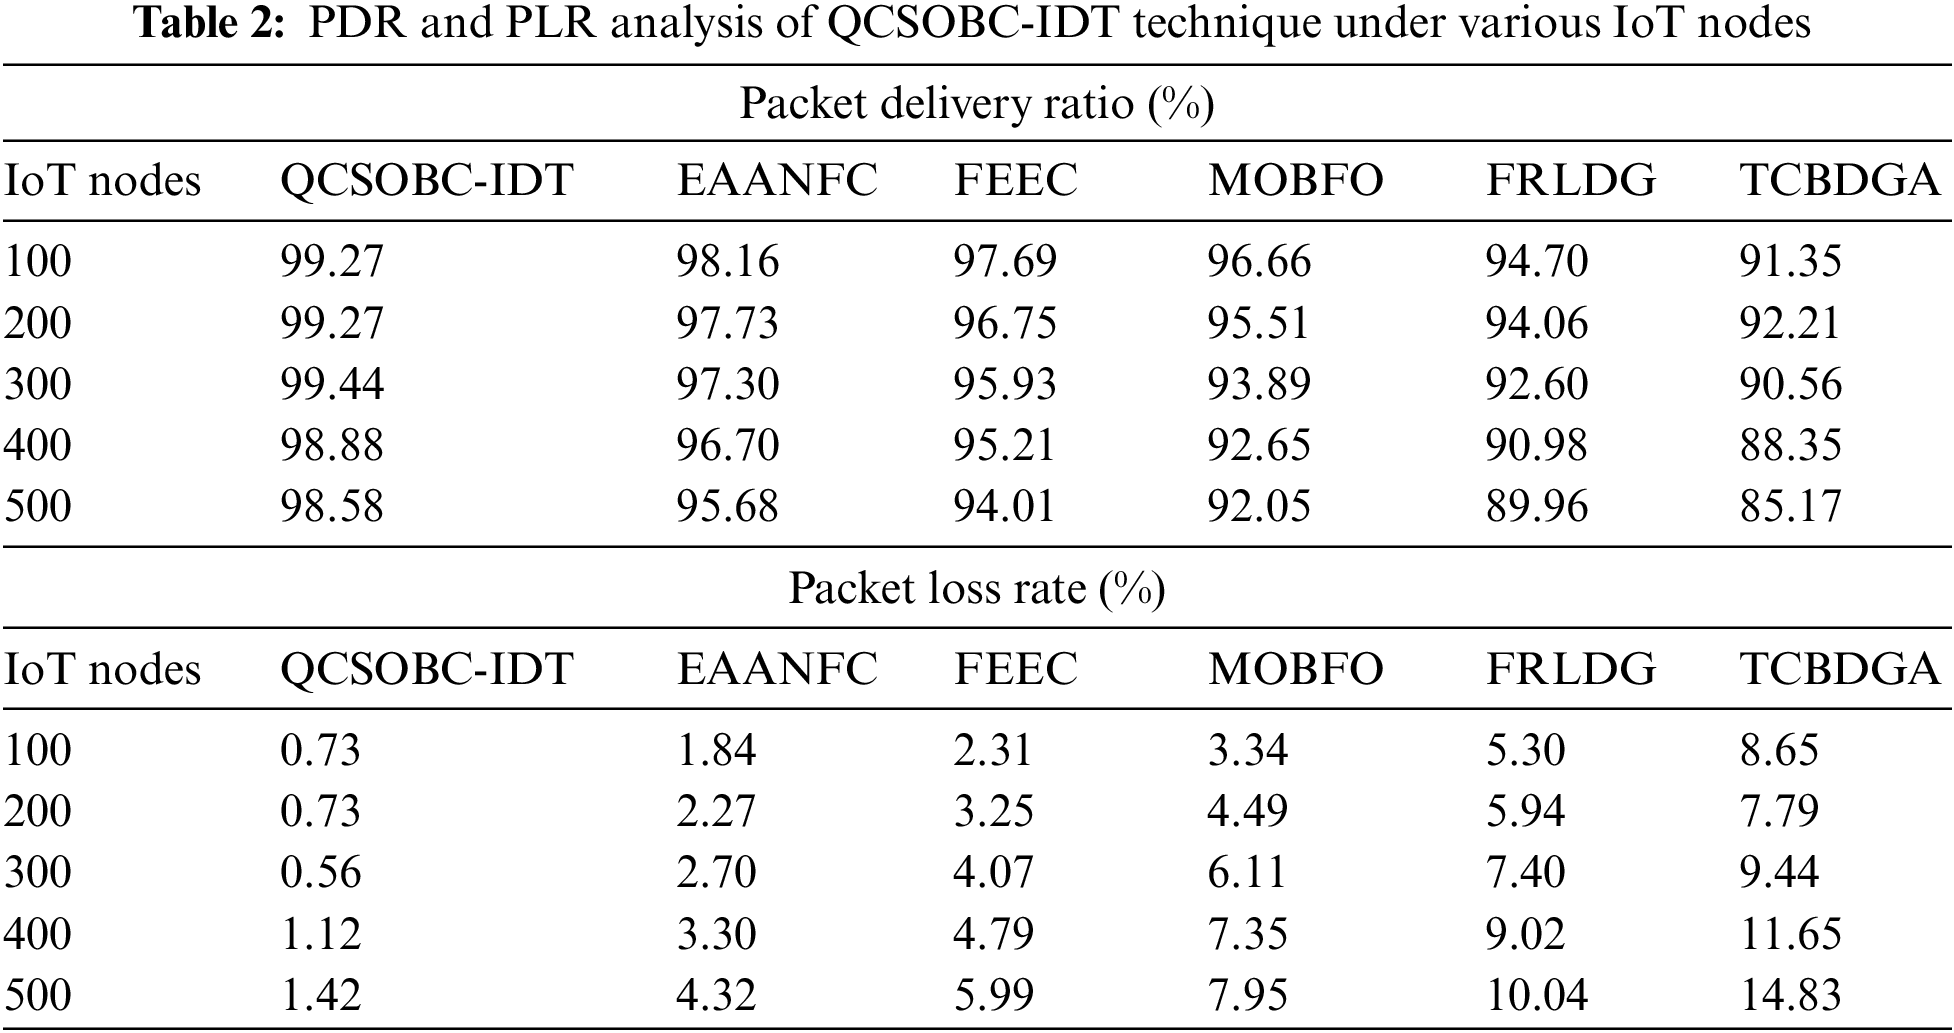
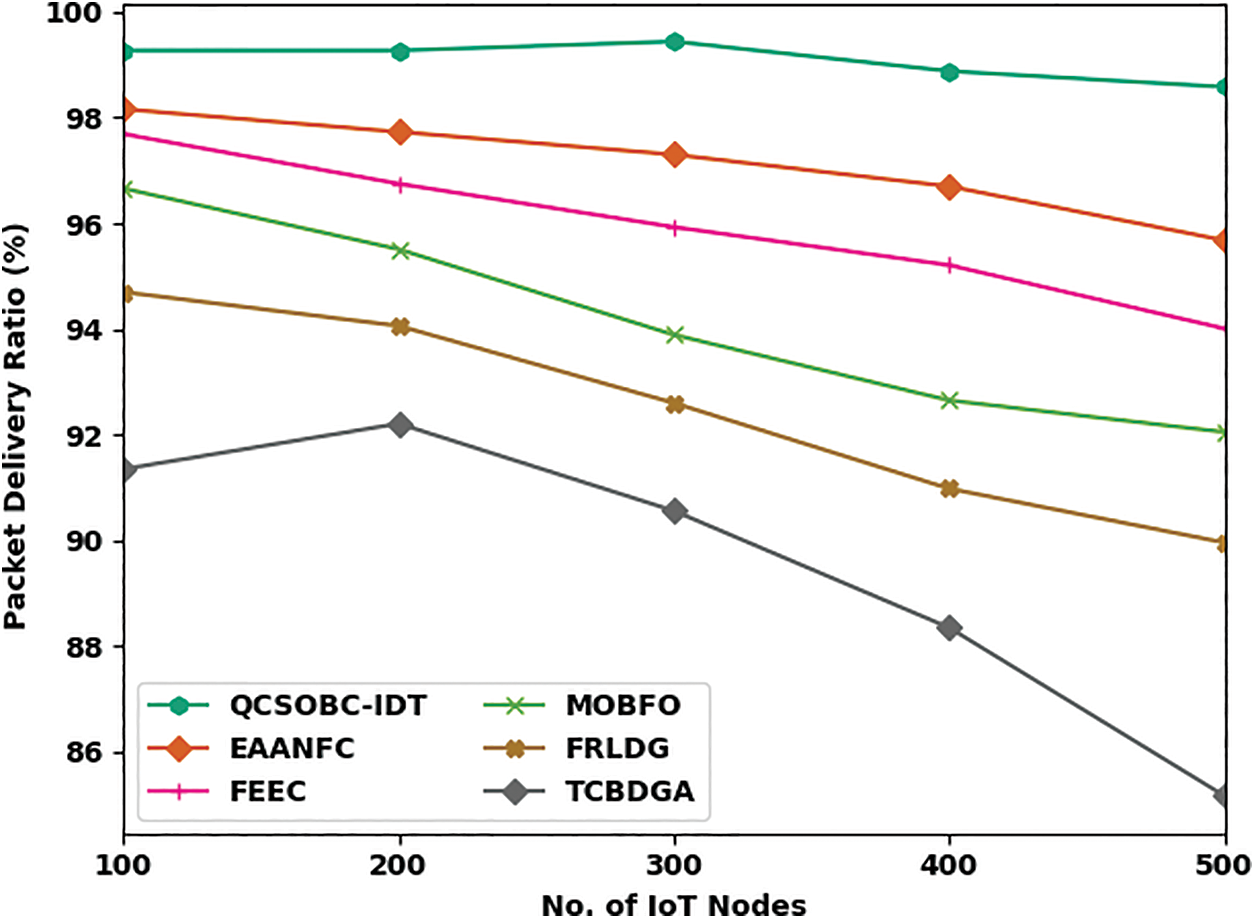
Figure 5: PDR analysis of QCSOBC-IDT technique under various IoT nodes
Fig. 6 examines the PLR assessment of the QCSOBC-IDT with current models under different IoT nodes. The figure shows that the QCSOBC-IDT model has reached maximal performance with minimum PLR under all IoT nodes. For example, on 100 IoT nodes, the QCSOBC-IDT technique has reached a slight PLR of 0.73% while the EAANFC technique, FEEC model, MOBFO approach, FRLDG system, and TCBDGA algorithm have gained a maximum PLR of 1.84%, 2.31%, 3.34%, 5.30%, and 8.65% correspondingly. Together with that, on 500 IoT nodes, the QCSOBC-IDT model has provided a low PLR of 1.42% while the EAANFC technique, FEEC model, MOBFO approach, FRLDG system, and TCBDGA algorithm have proved to have high PLR of 4.32%, 5.99%, 7.95%, 10.04%, and 14.83% correspondingly.
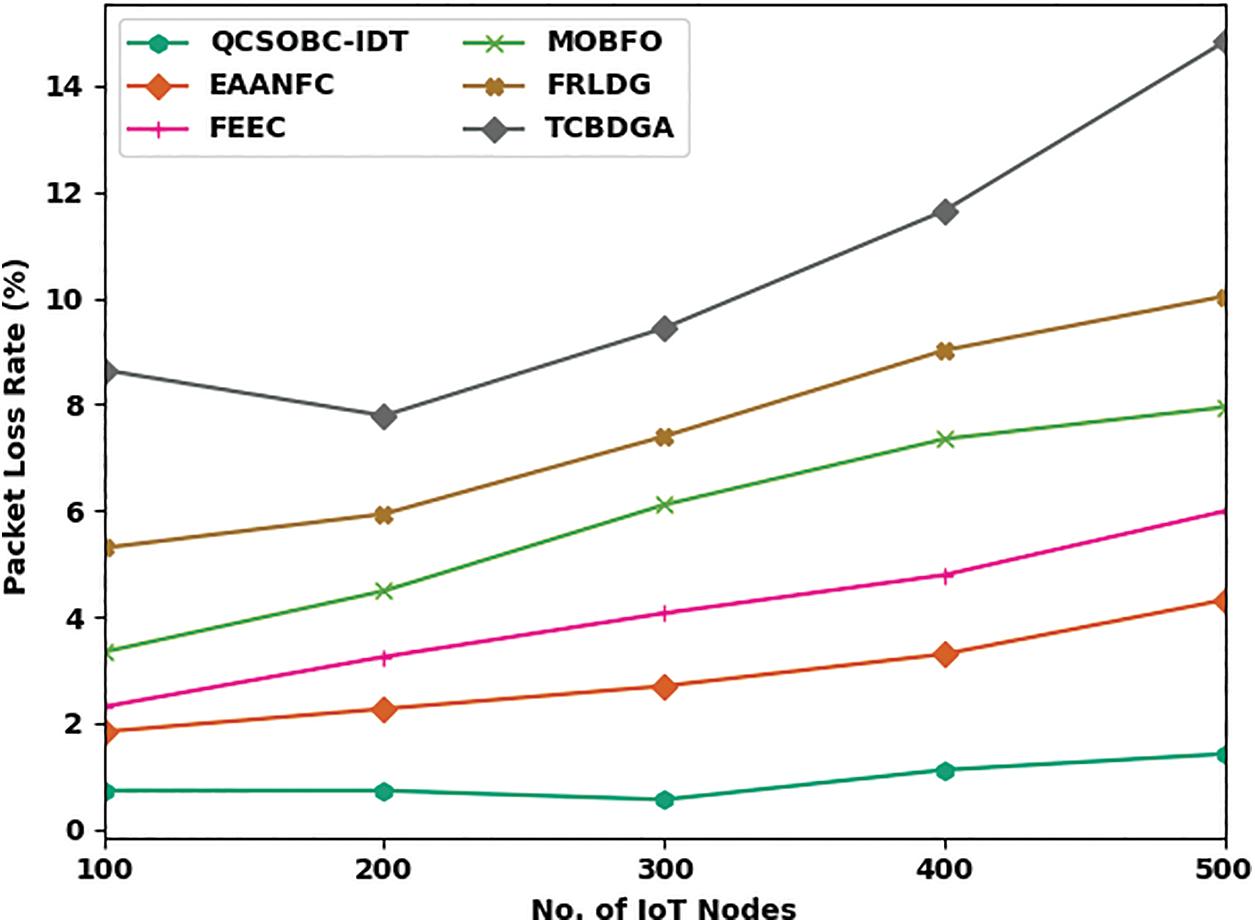
Figure 6: PLR analysis of QCSOBC-IDT technique under various IoT nodes
Table 3 and Fig. 7 inspect the ETED assessment of the QCSOBC-IDT with current models under several IoT nodes. The figure showed that the QCSOBC-IDT model had reached maximal performance with minimum ETED under all IoT nodes. For example, on 100 IoT nodes, the QCSOBC-IDT method has attained a minimal ETED of 1.91 s. In contrast, the EAANFC technique, FEEC model, MOBFO approach, FRLDG system, and TCBDGA algorithm have gained maximum ETED of 2.04, 2.06, and 2.69 s, respectively 3.81, and 5.11 s correspondingly. Together with that, on 500 IoT nodes, the QCSOBC-IDT model has provided a low ETED of 3.68 s. In contrast, the EAANFC technique, FEEC model, MOBFO approach, FRLDG system, and TCBDGA algorithm have proved higher ETED of 4.27, 5.13, 6.94, 8.04, and 8.46 s correspondingly.
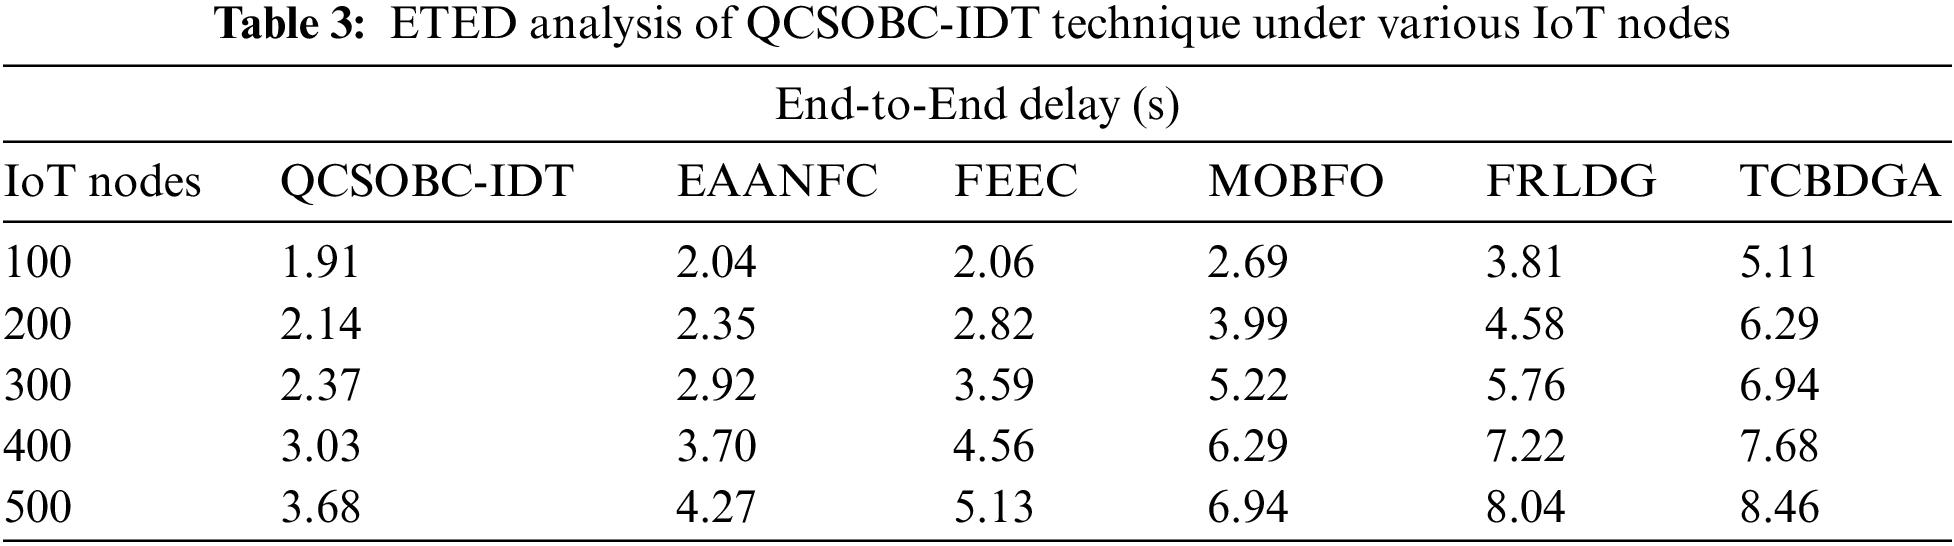
Figure 7: ETED analysis of QCSOBC-IDT technique under various IoT nodes
Comparative DR outcomes of the QCSOBC-IDT model with current methods are made in Table 4 and Fig. 8 [25]. The attained outcomes implied the improvement of the QCSOBC-IDT model over the other models under all IoT nodes. For example, with normal class, the QCSOBC-IDT model has provided a high DR of 97.89%, whereas the NIDNCSC, FMSVM, CVSGFDI, and RankRC models have reached low DR of 96.55%, 95.24%, 94.96%, and 94.52% correspondingly. Furthermore, with U2R class, the QCSOBC-IDT model has gotten a greater DR of 84.84% while the NIDNCSC, FMSVM, CVSGFDI, and RankRC models have provided lesser DR of 75.59%, 72.99%, 71.11%, and 51.16% correspondingly.
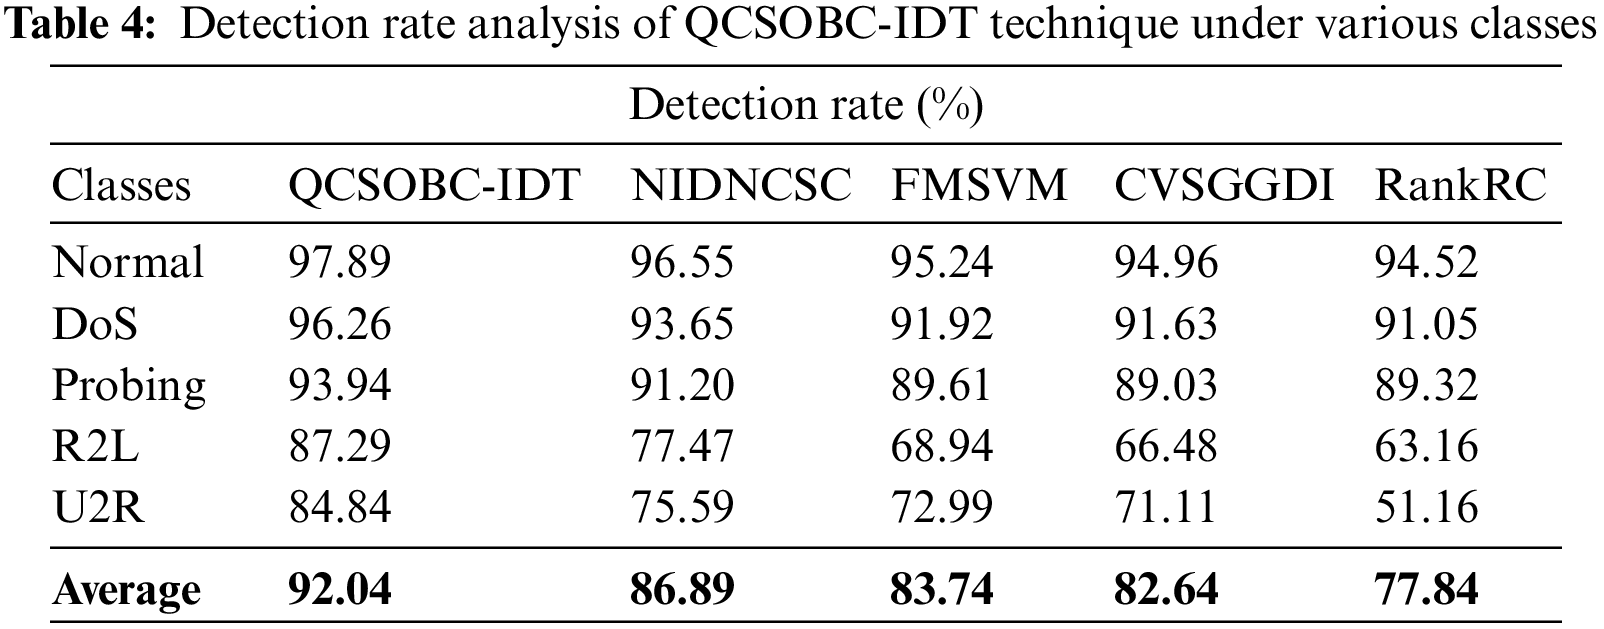
Figure 8: DR analysis of QCSOBC-IDT technique under various classes
Table 5 and Fig. 9 examine the FAR assessment of the QCSOBC-IDT method with present models under several classes [25]. The figure shows that the QCSOBC-IDT model has gained maximum performance with the least FAR under all IoT nodes. For instance, with normal class, the QCSOBC-IDT model has reached a minimal FAR of 2.11% while the NIDNCSC, FMSVM, CVSGFDI, and RankRC models have attained maximum FAR of 3.46%, 4.75%, 4.85%, and 5.42% correspondingly.
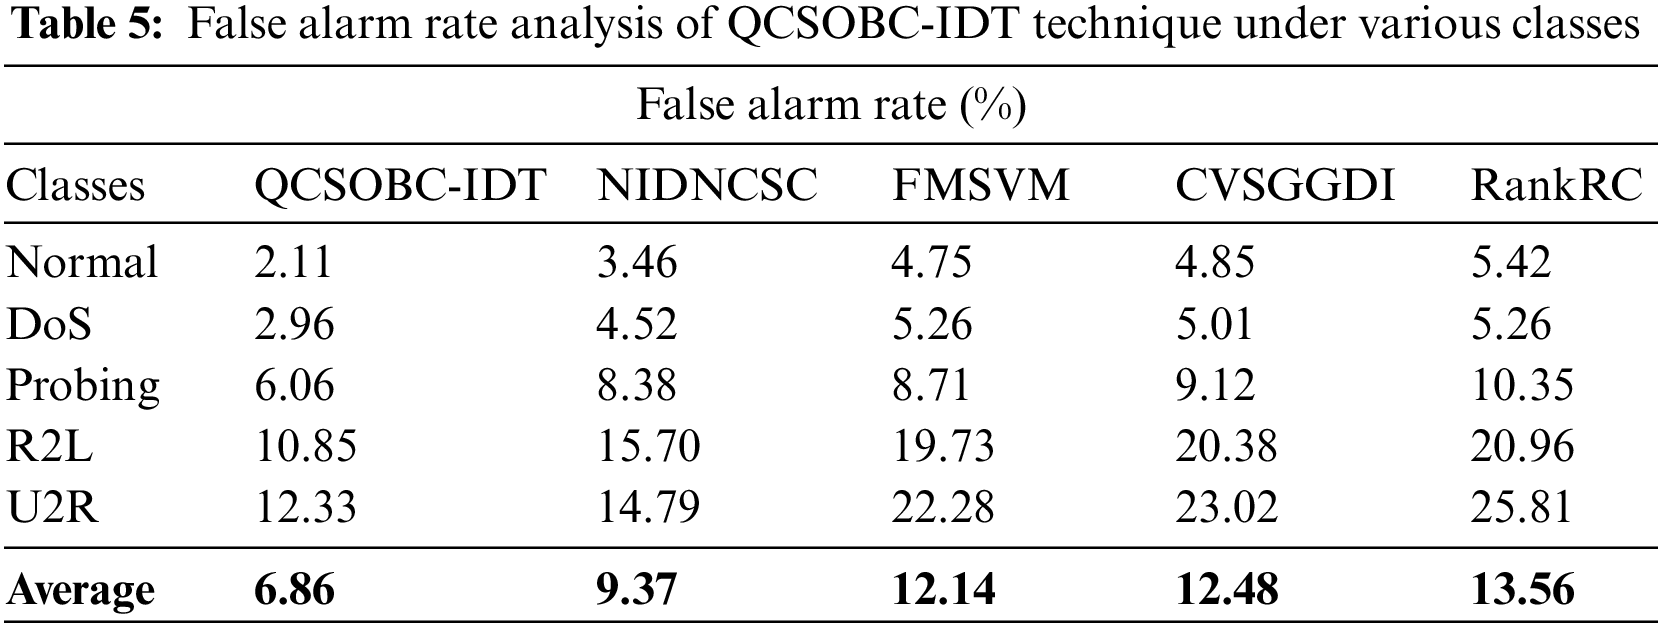
Figure 9: FAR analysis of QCSOBC-IDT technique under various classes
Finally, with U2R class, the QCSOBC-IDT model has provided a lower FAR of 12.33% while the NIDNCSC, FMSVM, CVSGFDI, and RankRC models have proved higher FAR of 14.79%, 22.28%, 23.02%, and 25.81% correspondingly. From these results and discussion, it is assumed that the QCSOBC-IDT model can attain energy efficiency and security in the IoT environment.
This study has developed a novel QCSOBC-IDT technique to attain security and energy efficiency in the IoT network. The projected QCSOBC-IDT model follows a two-phase process: clustering and intrusion detection. The QCSOBC-IDT model derives a QCSO algorithm with FF for the clustering process. Besides, HSA with CRNN model is utilized to identify and categorize intrusions in the IoT environment. The design of HSA assists in the optimal selection of hyperparameters related to the CRNN model. A detailed experimental analysis of the QCSOBC-IDT model ensured its promising efficiency compared to existing models. Thus, the QCSOBC-IDT model can be employed as a professional tool for improving the overall efficiency of the IoT network. In the future, data aggregation methods can be included in the QCSOBC-IDT algorithm to enhance network performance.
Funding Statement: This research work was funded by Institutional Fund Projects under grant no. (IFPIP: 333-611-1443). Therefore, the authors gratefully acknowledge technical and financial support provided by the Ministry of Education and Deanship of Scientific Research (DSR), King Abdulaziz University (KAU), Jeddah, Saudi Arabia.
Conflicts of Interest: The authors declare that they have no conflicts of interest to report regarding the present study.
References
1. J. Xiong, J. Ren, L. Chen, Z. Yao, M. Lin et al., “Enhancing privacy and availability for data clustering in intelligent electrical service of IoT,” IEEE Internet of Things Journal, vol. 6, no. 2, pp. 1530–1540, 2018. [Google Scholar]
2. M. D. Alshehri, F. K. Hussain and O. K. Hussain, “Clustering-driven intelligent trust management methodology for the internet of things (CITM-IoT),” Mobile Networks and Applications, vol. 23, no. 3, pp. 419–431, 2018. [Google Scholar]
3. V. Bindhu and G. Ranganathan, “Hyperspectral image processing in internet of things model using clustering algorithm,” Journal of ISMAC, vol. 3, no. 2, pp. 163–175, 2021. [Google Scholar]
4. S. Arjunan and S. Pothula, “A survey on unequal clustering protocols in wireless sensor networks,” Journal of King Saud University-Computer and Information Sciences, vol. 31, no. 3, pp. 304–317, 2019. [Google Scholar]
5. S. Verma, S. Kaur, D. B. Rawat, C. Xi, L. T. Alex et al., “Intelligent framework using IoT-based WSNs for wildfire detection,” IEEE Access, vol. 9, pp. 48185–48196, 2021. [Google Scholar]
6. N. Chouhan, “Artificial intelligence–based energy-efficient clusterin., routing in iot-assisted wireless sensor network,” Artificial Intelligence for Renewable Energy Systems, pp. 79–91, 2022. https://doi.org/10.1002/9781119761686.ch3 [Google Scholar] [CrossRef]
7. S. Arjunan and P. Sujatha, “Lifetime maximization of wireless sensor network using fuzzy based unequal clustering and ACO based routing hybrid protocol,” Applied Intelligence, vol. 48, no. 8, pp. 2229–2246, 2018. [Google Scholar]
8. Z. Cui, X. Jing, P. Zhao, W. Zhang and J. Chen, “A new subspace clustering strategy for AI-based data analysis in IoT system,” IEEE Internet of Things Journal, vol. 8, no. 16, pp. 12540–12549, 2021. [Google Scholar]
9. H. B. Mahajan, A. Badarla and A. A. Junnarkar, “CL-IoT: Cross-layer Internet of Things protocol for intelligent manufacturing of smart farming,” Journal of Ambient Intelligence and Humanized Computing, vol. 12, no. 7, pp. 7777–7791, 2021. [Google Scholar]
10. S. Famila, A. Jawahar, A. Sariga and K. Shankar, “Improved artificial bee colony optimization based clustering algorithm for SMART sensor environments,” Peer-to-Peer Networking and Applications, vol. 13, no. 4, pp. 1071–1079, 2020. [Google Scholar]
11. M. N. Shad, M. Maadani and M. N. Moghadam, “GAPSO-SVM: An IDSS-based energy-aware clustering routing algorithm for IoT perception layer,” Wireless Personal Communications, pp. 1–20, 2021. https://doi.org/10.1007/s11277-021-09051-5 [Google Scholar] [CrossRef]
12. G. Kaur, P. Chanak and M. Bhattacharya, “Energy-efficient intelligent routing scheme for IoT-enabled WSNs,” IEEE Internet of Things Journal, vol. 8, no. 14, pp. 11440–11449, 2021. [Google Scholar]
13. R. Qaddoura, A. M. Al-Zoubi, I. Almomani and H. Faris, “A multi-stage classification approach for IoT intrusion detection based on clustering with oversampling,” Applied Sciences, vol. 11, no. 7, pp. 3022, 2021. [Google Scholar]
14. H. B. Mahajan, A. Badarla and A. A. Junnarkar, “CL-IoT: Cross-layer internet of things protocol for intelligent manufacturing of smart farming,” Journal of Ambient Intelligence and Humanized Computing, vol. 12, no. 7, pp. 7777–7791, 2021. [Google Scholar]
15. P. Goswami, A. Mukherjee, R. Hazra, L. Yang, U. Ghosh et al., “AI based energy efficient routing protocol for intelligent transportation system,” IEEE Transactions on Intelligent Transportation Systems, vol. 23, no. 2, pp. 1670–1679, 2021. [Google Scholar]
16. A. Biswas, A. Majumdar, S. Das and K. L. Baishnab, “OCSO-CA: Opposition based competitive swarm optimizer in energy efficient IoT clustering,” Frontiers of Computer Science, vol. 16, no. 1, pp. 1–11, 2022. [Google Scholar]
17. M. M. Khayyat, M. M. Khayyat, S. Abdel-Khalek and R. F. Mansour, “Blockchain enabled optimal Hopfield Chaotic Neural network based secure encryption technique for industrial internet of things environment,” Alexandria Engineering Journal, vol. 61, no. 12, pp. 11377–11389, 2022. [Google Scholar]
18. R. F. Mansour, “Blockchain assisted clustering with intrusion detection system for industrial internet of things environment,” Expert Systems with Applications, vol. 207, no. 14, pp. 117995, 2022. [Google Scholar]
19. M. Ragab, E. Ashary, W. Aljedaibi, I. Alzahrani, A. Kumar et al., “A novel metaheuristics with adaptive neuro-fuzzy inference system for decision making on autonomous unmanned aerial vehicle systems,” ISA Transactions, vol. 132, pp. 16–23, 2023. https://doi.org/10.1016/j.isatra.2022.04.006 [Google Scholar] [PubMed] [CrossRef]
20. S. C. Chu, P. W. Tsai and J. S. Pan, “Cat swarm optimization,” in Pacific Rim Int. Conf. on Artificial Intelligence, Lecture Notes in Computer Science Book Series, Berlin, Springer, vol. 4099, pp. 854–858, 2006. [Google Scholar]
21. A. M. Ahmed, T. A. Rashid and S. A. M. Saeed, “Cat swarm optimization algorithm: A survey and performance evaluation,” Computational Intelligence and Neuroscience, vol. 2020, no. 1, pp. 1–20, 2020. [Google Scholar]
22. K. Shankar, E. Perumal, V. G. Díaz, P. Tiwari, D. Gupta et al., “An optimal cascaded recurrent neural network for intelligent COVID-19 detection using Chest X-ray images,” Applied Soft Computing, vol. 113, no. 8, pp. 107878, 2021. [Google Scholar] [PubMed]
23. M. Mahdavi, M. Fesanghary and E. Damangir, “An improved harmony search algorithm for solving optimization problems,” Applied Mathematics and Computation, vol. 188, no. 2, pp. 1567–1579, 2007. [Google Scholar]
24. A. Daniel, K. M. Balamurugan, R. Vijay and K. P. Arjun, “Energy aware clustering with multihop routing algorithm for wireless sensor networks,” Intelligent Automation and Soft Computing, vol. 29, no. 1, pp. 233–246, 2021. [Google Scholar]
25. G. Yang, X. Yu, L. Xu, Y. Xin and X. Fang, “An intrusion detection algorithm for sensor network based on normalized cut spectral clustering,” PLoS One, vol. 14, no. 10, pp. e0221920, 2019. [Google Scholar] [PubMed]
Cite This Article
 Copyright © 2023 The Author(s). Published by Tech Science Press.
This work is licensed under a Creative Commons Attribution 4.0 International License , which permits unrestricted use, distribution, and reproduction in any medium, provided the original work is properly cited.
 Downloads
 Citation Tools