
 Submit a Paper
 Propose a Special lssue
 Open Access
ARTICLE

An Improved Ensemble Learning Approach for Heart Disease Prediction Using Boosting Algorithms
1
School of Business, Woxsen University, Hyderabad, Telangana, 502345, India
2
School of Computing Science & Engineering, Galgotias University, Greater Noida, UP 203201, India
3
Department of Computer Sciences, Baba Ghulam Shah Badshah University, Rajouri, 185234, India
4
Graduate School, Faculty of Information Technology, Duy Tan University, Da Nang, 50000, Vietnam
5
Department of Information and Communication Engineering, Inha University, 22212, Korea
* Corresponding Author: Kyung Sup Kwak. Email:
Computer Systems Science and Engineering 2023, 46(3), 3993-4006. https://doi.org/10.32604/csse.2023.035244
Received 13 August 2022; Accepted 03 November 2022; Issue published 03 April 2023
 View Full Text
 Download PDF
Abstract
Cardiovascular disease is among the top five fatal diseases that affect lives worldwide. Therefore, its early prediction and detection are crucial, allowing one to take proper and necessary measures at earlier stages. Machine learning (ML) techniques are used to assist healthcare providers in better diagnosing heart disease. This study employed three boosting algorithms, namely, gradient boost, XGBoost, and AdaBoost, to predict heart disease. The dataset contained heart disease-related clinical features and was sourced from the publicly available UCI ML repository. Exploratory data analysis is performed to find the characteristics of data samples about descriptive and inferential statistics. Specifically, it was carried out to identify and replace outliers using the interquartile range and detect and replace the missing values using the imputation method. Results were recorded before and after the data preprocessing techniques were applied. Out of all the algorithms, gradient boosting achieved the highest accuracy rate of 92.20% for the proposed model. The proposed model yielded better results with gradient boosting in terms of precision, recall, and f1-score. It attained better prediction performance than the existing works and can be used for other diseases that share common features using transfer learning.Keywords
Heart disease is considered one of the hazards that affect human lives globally. As per the statistical reports of different international healthcare organizations, 17.9 million (32% of all global deaths) died in 2019 because of cardiovascular diseases; this statistic has been estimated to increase to 23 million people by 2030 [1]. Out of all the cardiovascular disease deaths, 85% are due to heart disease and stroke. Research studies have estimated that heart disease accounts for 80% of lives in low economically developed countries and creates 85% of disabilities [1]. Detecting and predicting heart disease at earlier stages are necessary to reduce premature deaths by a significant number in the future. The risk and progression of heart-related diseases depend on factors such as age, changes in lifestyle, food habits, and rapidly growing socio-economic causes, such as admission to healthcare centers [2,3]. Thus, some other risk factors due to heart-related problems are high blood pressure, raised glucose levels, upraised blood lipids, obesity, and being overweight.
Exploring computational intelligence techniques is needed for better prediction of heart-related diseases so that they can be prevented and cautionary measures can be taken in advance. Furthermore, machine learning (ML) techniques can be extensively explored to cater to healthcare resources and governance for better patient health services. This will directly benefit hospital management, telemedicine systems, practitioners, healthcare providers, and patient categories. In this study, we intend to develop a model for better heart disease prediction using Ensemble Learning (EL) techniques. Specifically, considering the criticalness of the application, we intend to improve the accuracy and other measures of the model for heart disease prediction. Following are the novel contributions of this work:
• Preprocessing of the data to improve the characteristic assessment of the dataset
• Comparison of results before and after applying preprocessing techniques
• Exercising feature engineering process to identify the contribution of attributes
• Applying boosting algorithms using an ensemble learning approach to increase prediction accuracy
• Compare the performance evaluation of the proposed model with similar research works
The rest of the article is organized as follows. Section 2 mentions the related work. Section 3 presents the details of the proposed methodology and dataset. Section 4 presents and analyzes the experimental details and results. Finally, Section 5 describes the conclusion and some future directions.
Machine/ensemble learning techniques, with their potential to deliver consistent, reliable, and valid results, are used in almost every sphere of life to solve real-life problems [4,5]. Copious work has been done for disease prediction using ML and EL techniques [6]. Researchers have explored different datasets, algorithms, and methodologies to conduct future research in diagnosing cardiovascular disease [7,8]. Some of the important kind of literature is discussed as follows.
Latha et al. [9] experimented with different ensemble techniques, such as bagging boosting, stacking, and a majority vote, using traditional classification algorithms to improve the efficacy of predicting disease risk. They achieved the highest accuracy with a majority vote. Theerthagiri et al. [10] explored a gradient boosting algorithm based on recursive feature elimination to predict heart disease based on some medical parameters such as patient’s age, systolic and diastolic blood pressure, height, weight, smoke, glucose/blood sugar, cholesterol, alcohol intake, smoke, and physical workout. Sultan Bin Habib et al. [11] tried different ensemble techniques such as adaptive boosting (AdaBoost), gradient boosting machine (GBM), light GBM (LGBM), extreme gradient boosting (XGBoost), and category boosting (CatBoost) to predict coronary disease, considering several attributes such as gender, age, education, smoking habits, blood pressure, hypertension, diabetes, cholesterol level, Quetelet index, heart rate, glucose level, and chronic heart disease history. They achieved the highest accuracy with XGBoost. Budholiya et al. [12] used an enhanced XGBoost classifier to predict heart disease effectively. The One-Hot encoding technique was used to handle categorical features, and Bayesian optimization was used to enhance the hyper-parameters to achieve better results. Pan et al. [13] conducted an extensive study by using a dataset containing a good mixture of numerical and categorical attributes based on EL techniques to predict disease. The authors observed that combining the support vector machine and AdaBoost with categorical attributes provides better results in predicting heart disease. Pouriyeh et al. [14] developed a framework for the prediction/detection of heart disease by comparing conventional ML techniques with EL methods. The dataset used for this work is taken from the online available UCI ML repository. The authors have used a 10-fold cross-validation technique to validate the results. The results showed that the support vector machine, in combination with the boosting method, provides better results with the highest accuracy rate of 89.12%. Moreover, bagging and stacking techniques, combined with different traditional classifiers, improve the efficacy of overall results. Deshmukh [15] used an ensemble learning approach for heart disease prediction. The results are compared between majority voting classifiers and the rest of the classifiers. An extra tree classifier was used for the feature selection process. Bagged classifiers with the majority outperformed other classifiers with the highest accuracy of 87.78%. The authors suggested that this work can be extended using optimization procedures and new feature extraction methods. Mary et al. [16] developed a model for heart disease prediction using ten machine learning algorithms. Among all the considered classifiers, support vector machine yielded better results with accuracy rate of 83.49% on the UCI dataset. The simple card algorithm increased the accuracy and reduced the prediction error rate for other measurements. Different metrics are evaluated to validated the proposed framework. The authors suggested that hybrid approach can be used to extend the existing work for better prediction. Alqahtani et al. [17] proposed a framework for cardiovascular disease prediction using ensemble learning and deep learning techniques. In the experiment, the random forest algorithm achieved the highest accuracy (88.65%), precision (90.03), recall (88.03), f1-score (88.02), and ROC-AUC value (92). Furthermore, feature importance was calculated to measure the risk of being involved in this disease in the future. Kondababu et al. [18] built a model by comparing different machine learning techniques for heart disease prediction. Seven machine learning classifiers were considered for comparative and performance analyses. Out of all classifiers, hybrid random forest with linear model produced better results with accuracy rate of 88.4%. No data preprocessing technique was used to improve the output of proposed model. The authors suggested that the future course of this work can done using large datasets and diverse mixture of machine learning techniques.
Most of the work mentioned above did not sufficiently exploit data preprocessing before developing the ensemble learning models. It resulted in inadequate outputs. Therefore, we felt the need to utilize exploratory data analysis to improve the data quality required for the prediction model. Furthermore, data normalization and standardization were missing in most of the existing literature, although these approaches play crucial roles in achieving higher prediction performance.
Fig. 1 depicts the methodology adopted for this experimental study. It presents the procedural steps that must be executed for the early prediction of disease using various ensemble learning techniques. A publicly available heart disease dataset has been imported into the web-based Jupyter notebook (open-source platform) for the experimental process. The required library packages are installed from Sklearn using the Python programming language. Initially, the boosting classifiers are applied without data preprocessing to predict the disease. After exploratory data analysis, we found that preprocessing of data can play an important role in attaining better results. In preprocessing phase, missing values are identified and replaced using the data imputation method. The interquartile range method is used to detect and replace outliers present in the dataset. Also, some other required libraries are executed to check the corrupted data, if any, in the dataset. The dataset is split into a 70:30 ratio, where 70% is used to train the models and 30% to test these models. To validate the results, k-fold cross-validation (K = 10) is applied. Finally, the three considered boosting algorithms are applied after data preprocessing to obtain the desired results.
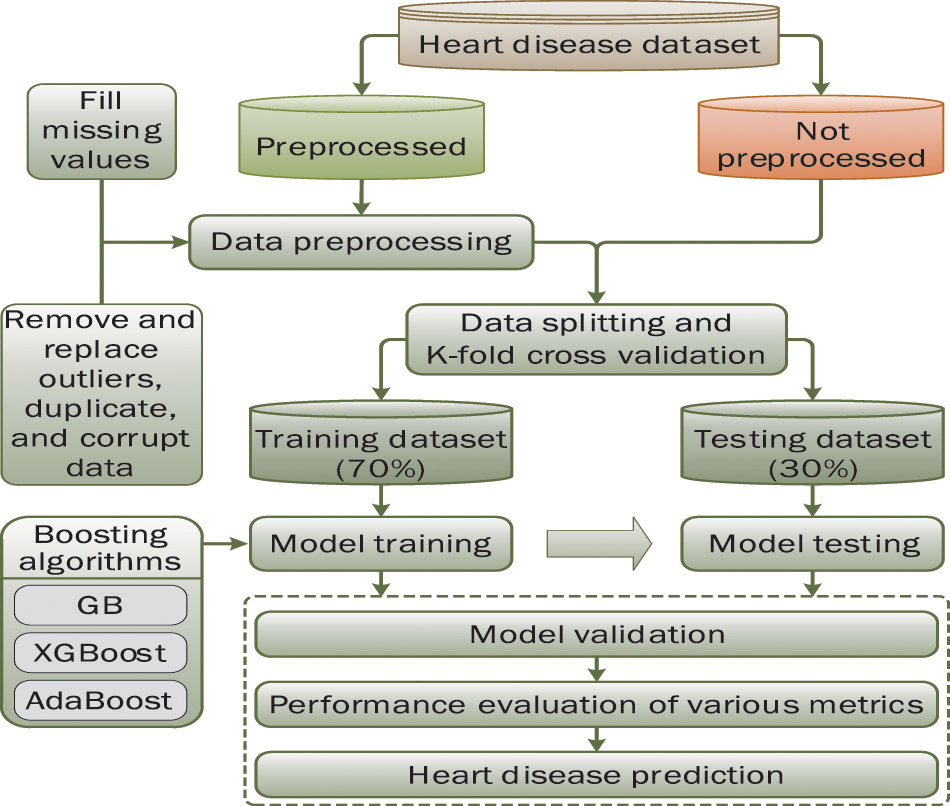
Figure 1: Proposed methodology for research work
The use of ensemble learning techniques is explored in almost every field to solve real-life problems [19]. These models have made significant progress in better prediction, detection, diagnosis, and prognosis of different diseases. In this study, for heart disease prediction, we considered the following three ensemble-learning-based boosting algorithms [6]:
• Gradient boosting: The weak learners are trained sequentially, and all estimators are added gradually by adapting the weights. The gradient boosting algorithm focuses on predicting the residual errors of previous estimators and attempts to minimize the difference between the predicted and actual values.
• AdaBoost: AdaBoost works by adjusting all the weights without prior knowledge of weak learners. The base learners’ weakness is measured by the estimator’s error rate while training the models. Decision tree stumps are widely used with the AdaBoost algorithm to solve classification and regression problems.
• XGBoost: XGBoost works by combining different kinds of decision trees (weak learners) to calculate the similarity scores independently. It helps to overcome the problem of overfitting during the training phase by adapting the gradient descent and regularization process.
For the experiment, we used the popular dataset on heart disease, openly available in the machine learning repository1 at the University of California Irvine (UCI). The dataset is rich in clinical features related to heart disease, covering wide demography. Thus, it has been one of the most popular choices for researchers.
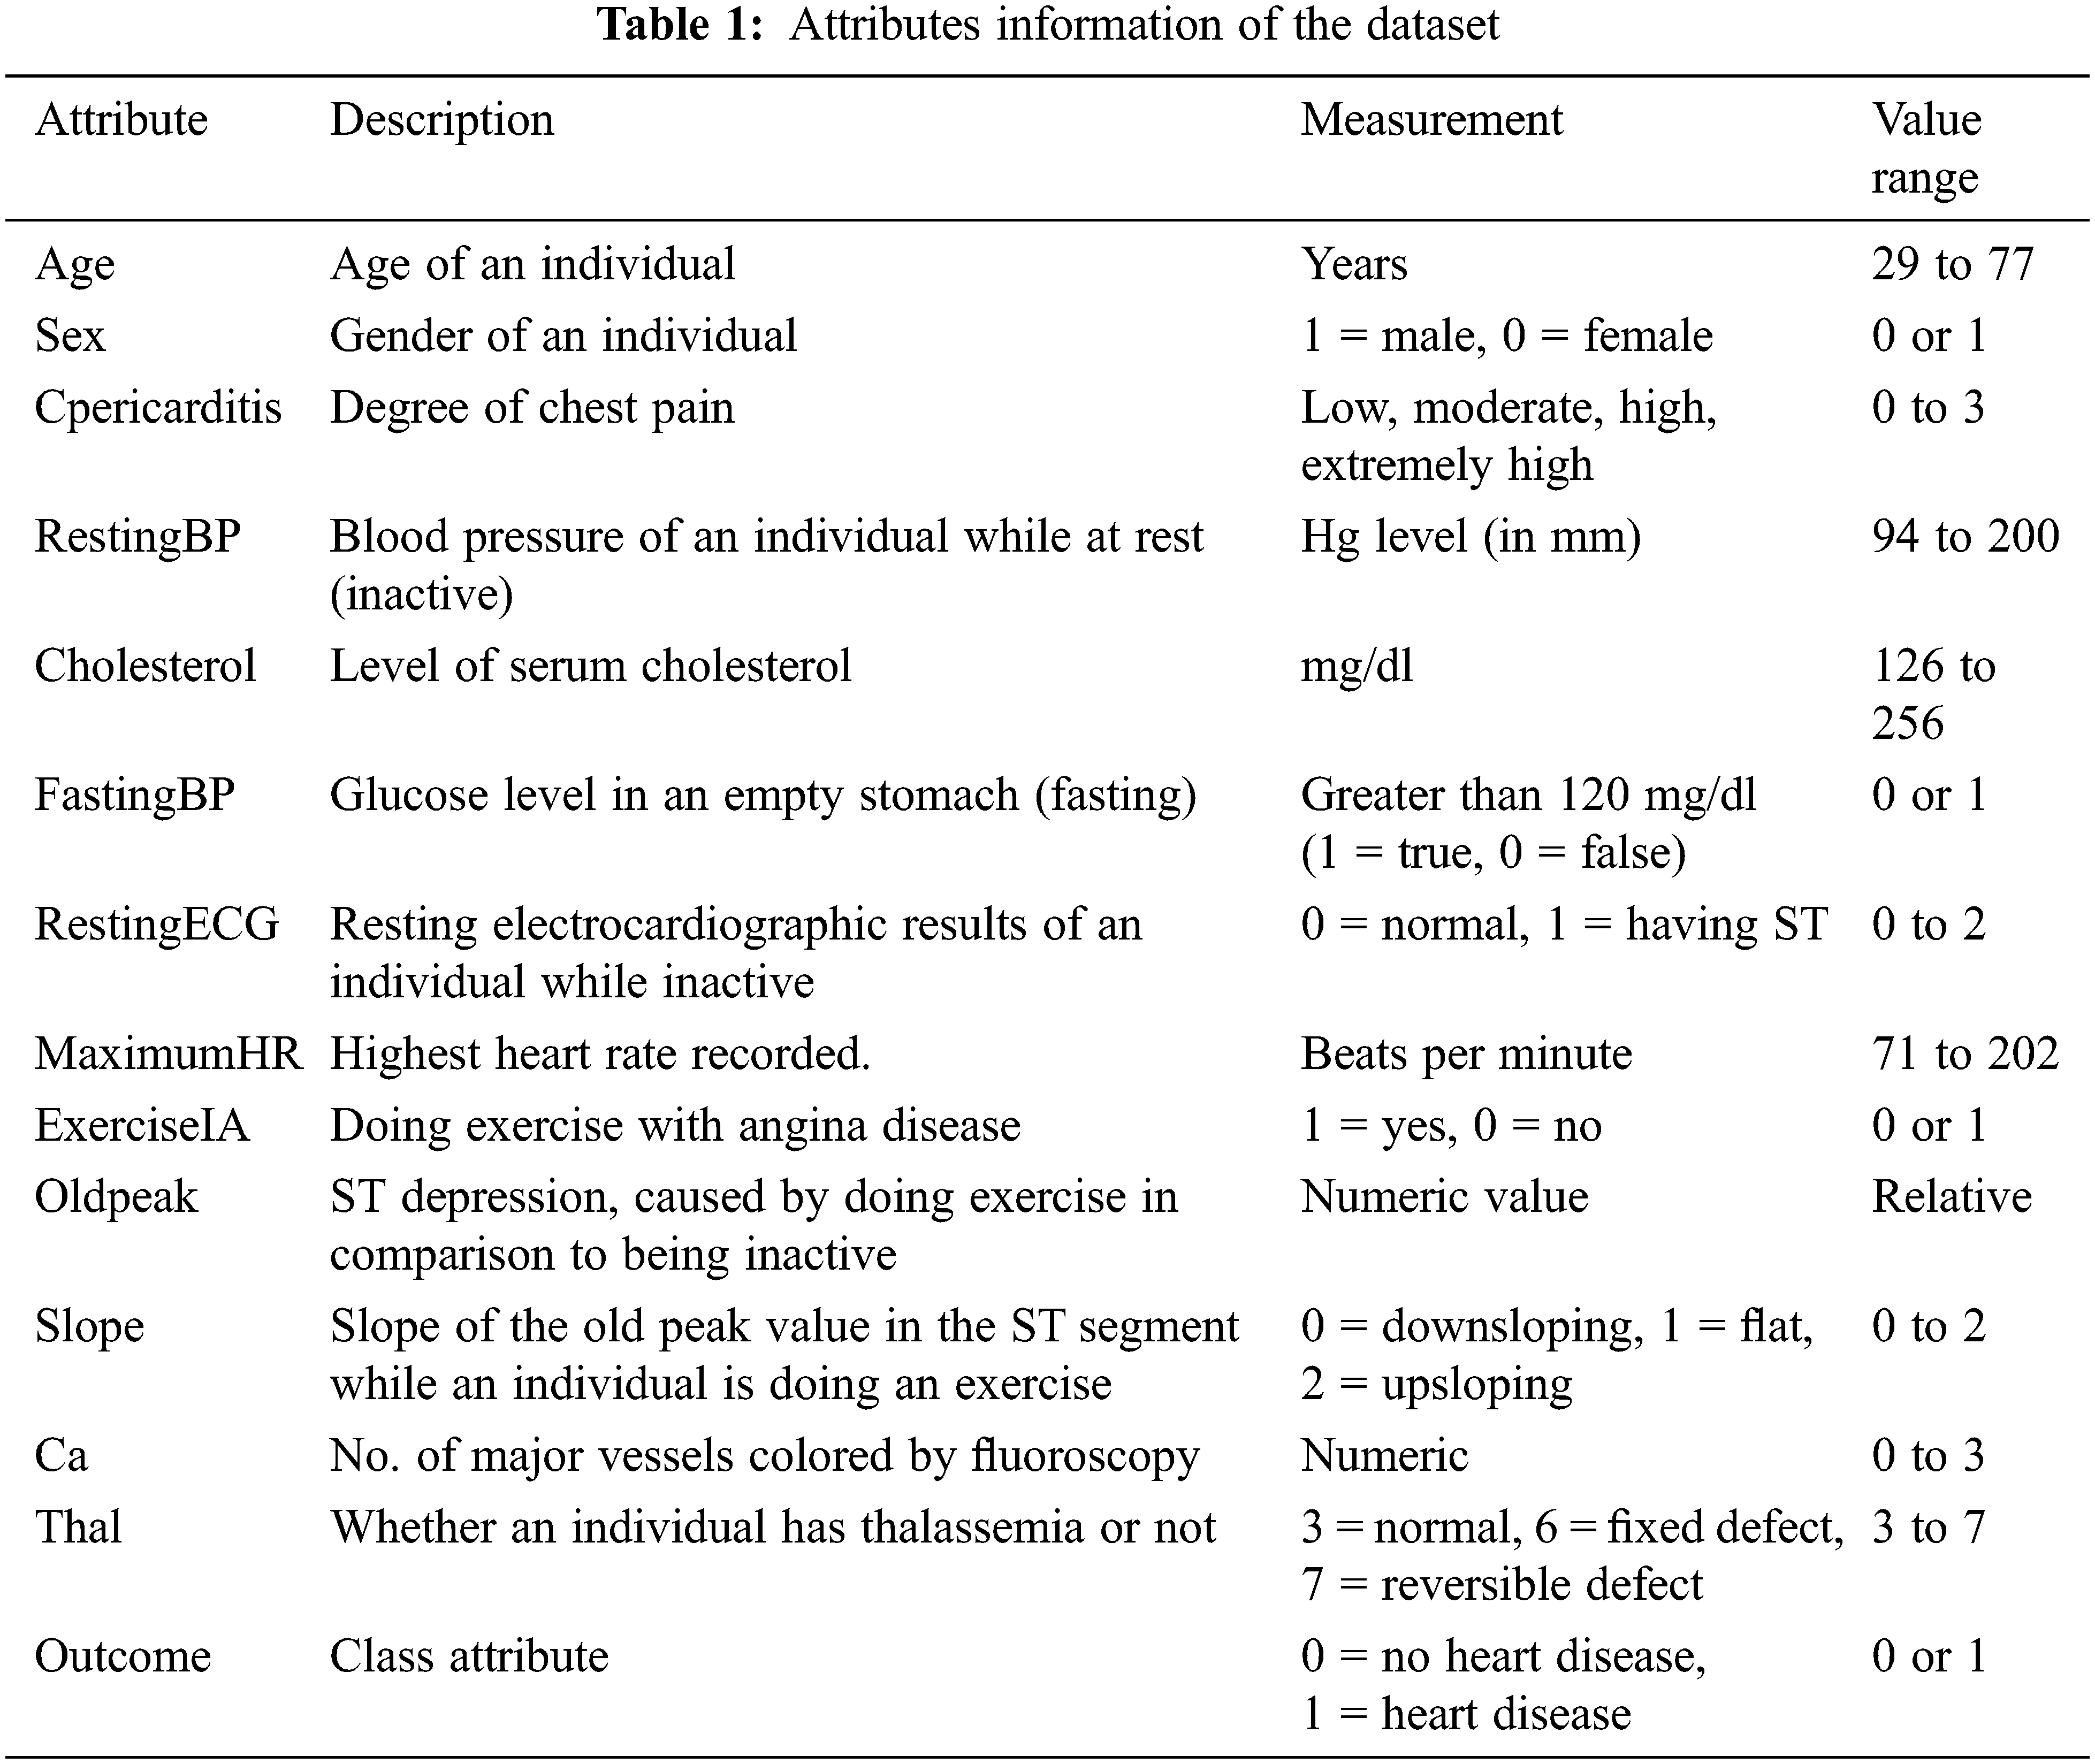
The dataset contains 1329 instances and 14 attributes, where the first 13 attributes are predicate/ independent variables, and the last one is a dependent/target variable. The attributes are described in Table 1. The table presents information about considered attributes, the description of attributes, their measurements, and the value of the range.
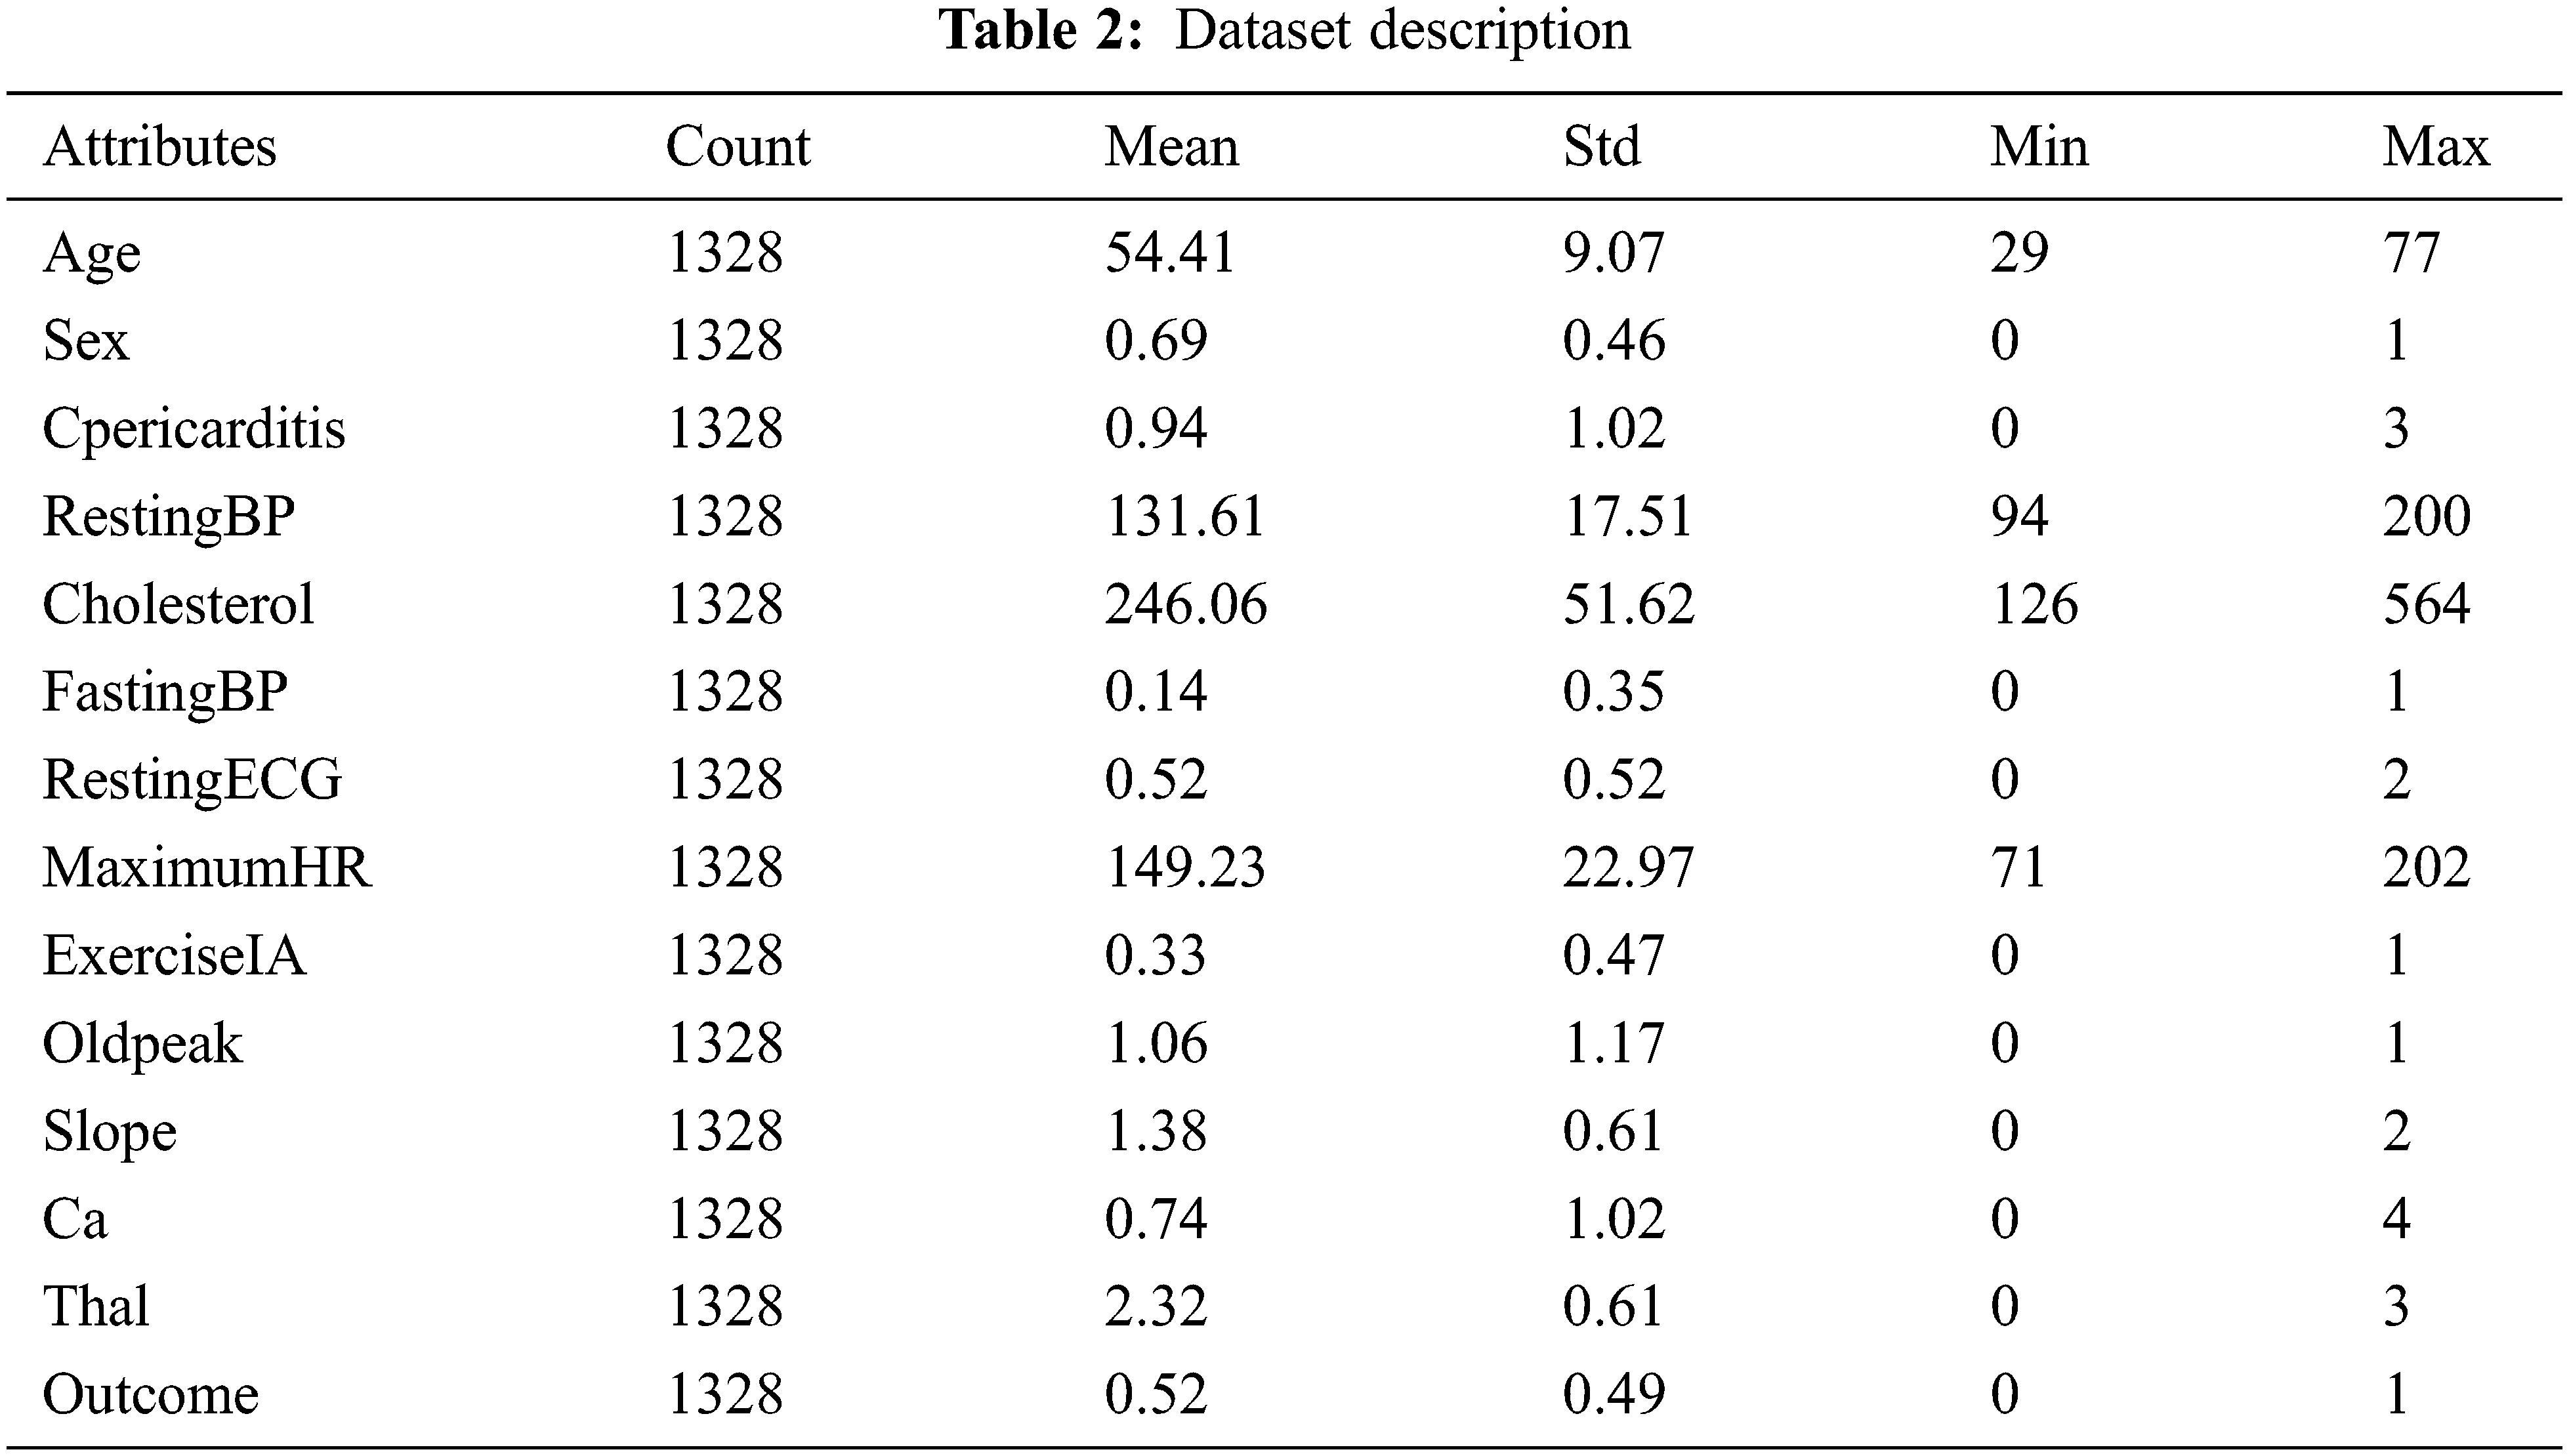
Descriptive statistics play a vital role in identifying the data characteristics. It summarizes the data so that understanding data becomes easier for human interpretation. Table 2 describes the statistical measurements of the clinical attributes with their measures, such as count of records, minimum (min) value, maximum (max) value, mean, and standard deviation (Std). For example, the age attribute has 54.41 as a mean value and 9.07 as a standard deviation, and the maximum and minimum age numbers are 77 and 29 years, respectively. These statistical measurements are also calculated for the rest of the attributes.
Machine/ensemble learning models provide poor results if the dataset used is not balanced for the problem statement. In some situations, if the target class is not equally distributed, then some sampling techniques can be used to make a balanced dataset. The dataset for this experiment contains a good mixture of classes, where class 1 is heart disease (691 instances) and class 0 is no heart disease (637 instances), as shown in Fig. 2.
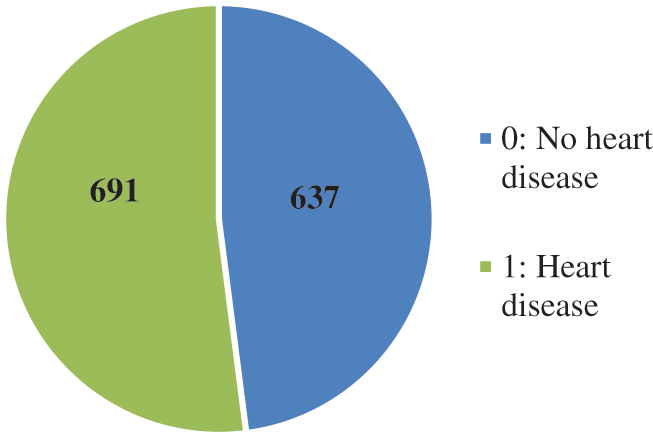
Figure 2: Instances of the outcome variable
A histogram is used to visualize and interpret the distribution of data samples. The representation of histograms can be uniform, normal, left-skewed, and right-skewed. Fig. 3 depicts the normally distributed histograms that groups all the attributes within the value range. The x-axis represents the nature of the attribute, and the y-axis represents the value of that attribute.
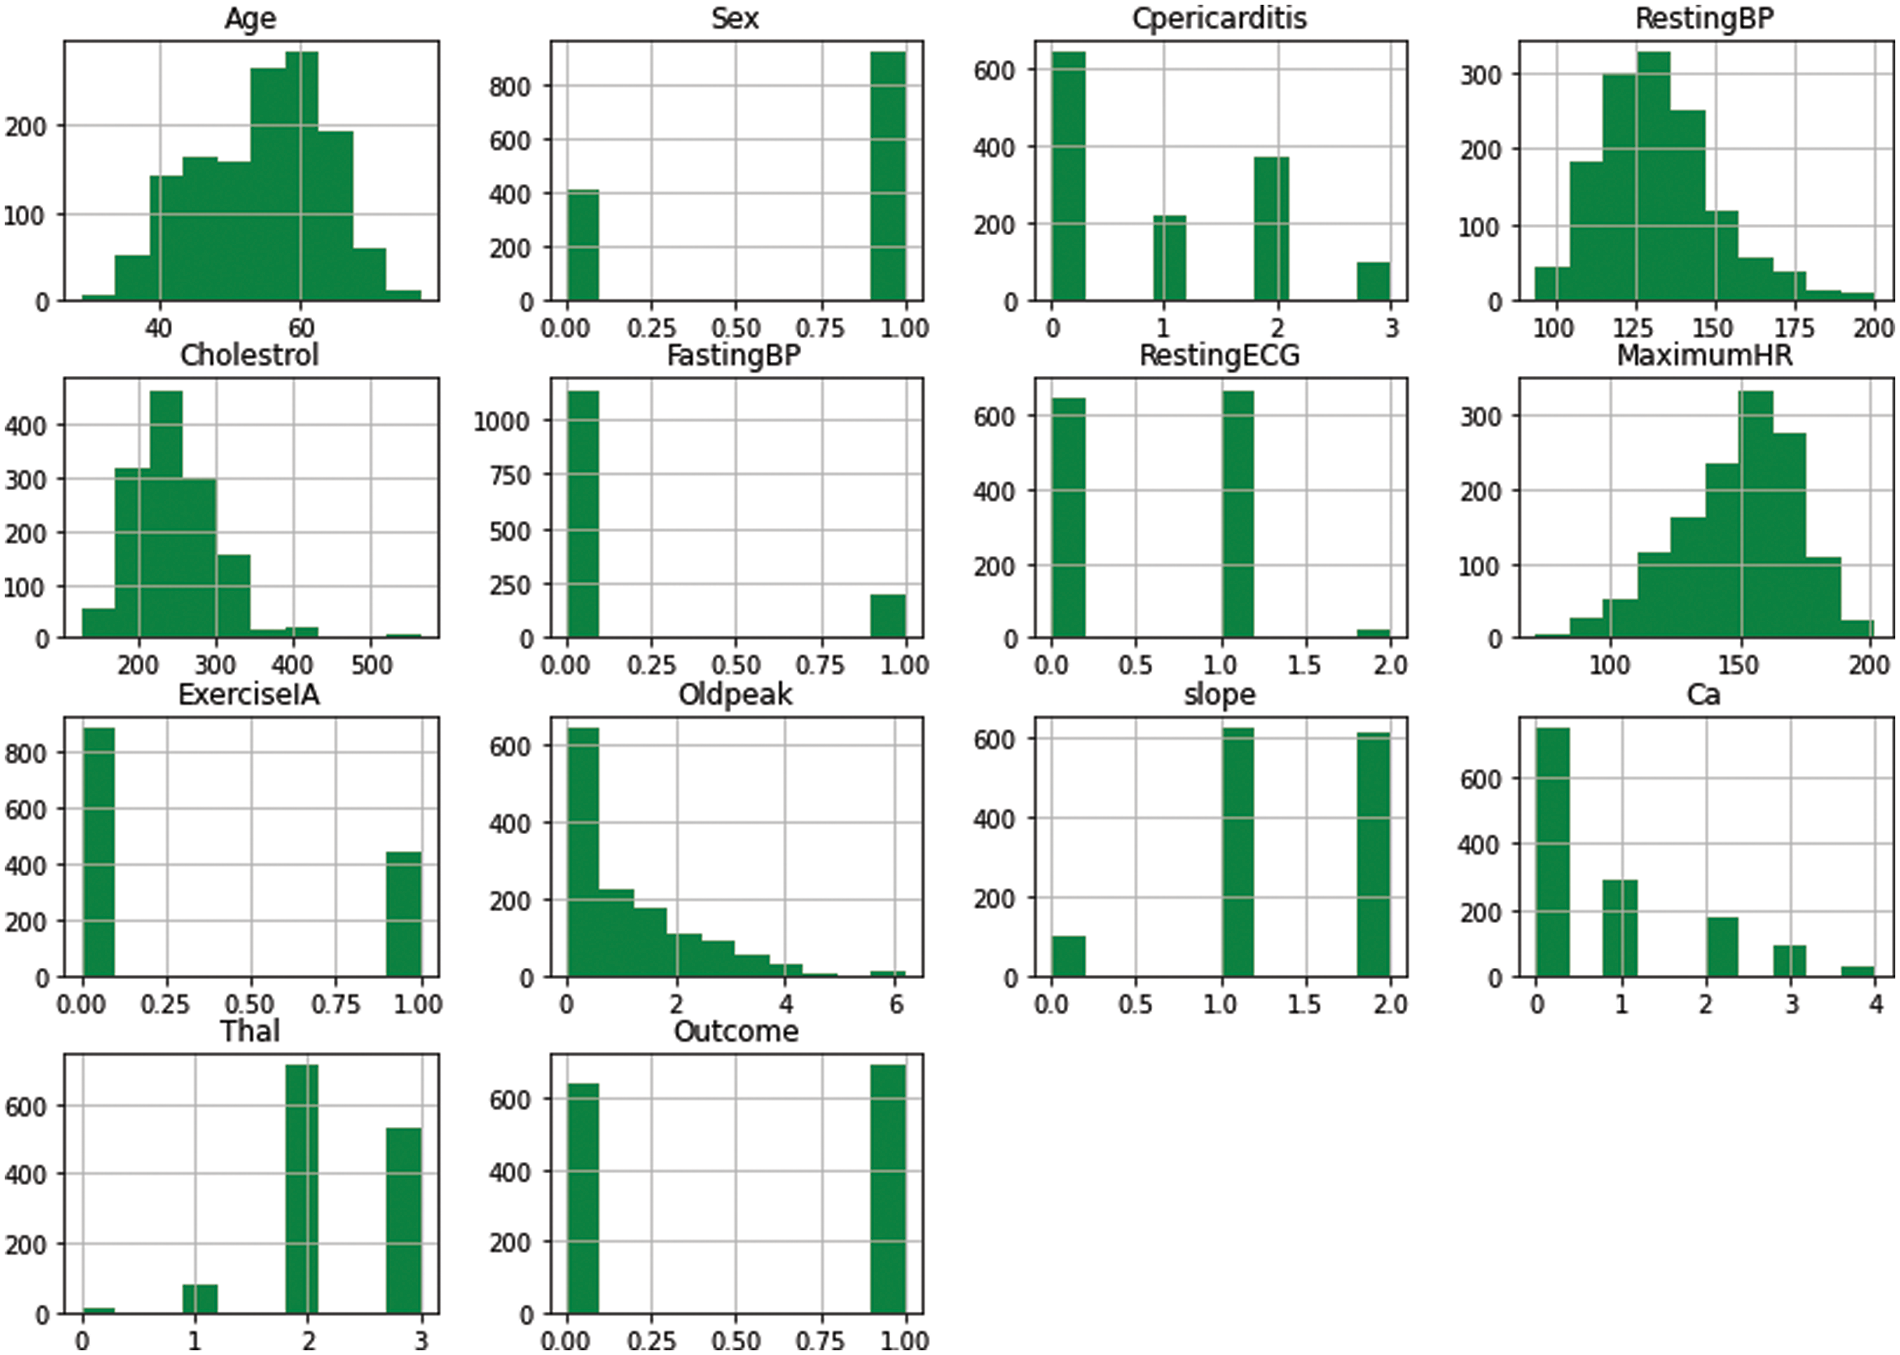
Figure 3: Histogram of attributes
Fig. 4 shows the boxplots of each attribute present in the dataset. To represent boxplots for attributes, the interquartile range method using the probability density function has been used to handle the outliers in the dataset. For example, in fasting blood pressure, a single outlier was detected, whereas, in resting blood pressure, multiple outliers were detected and were replaced with the z-score method.
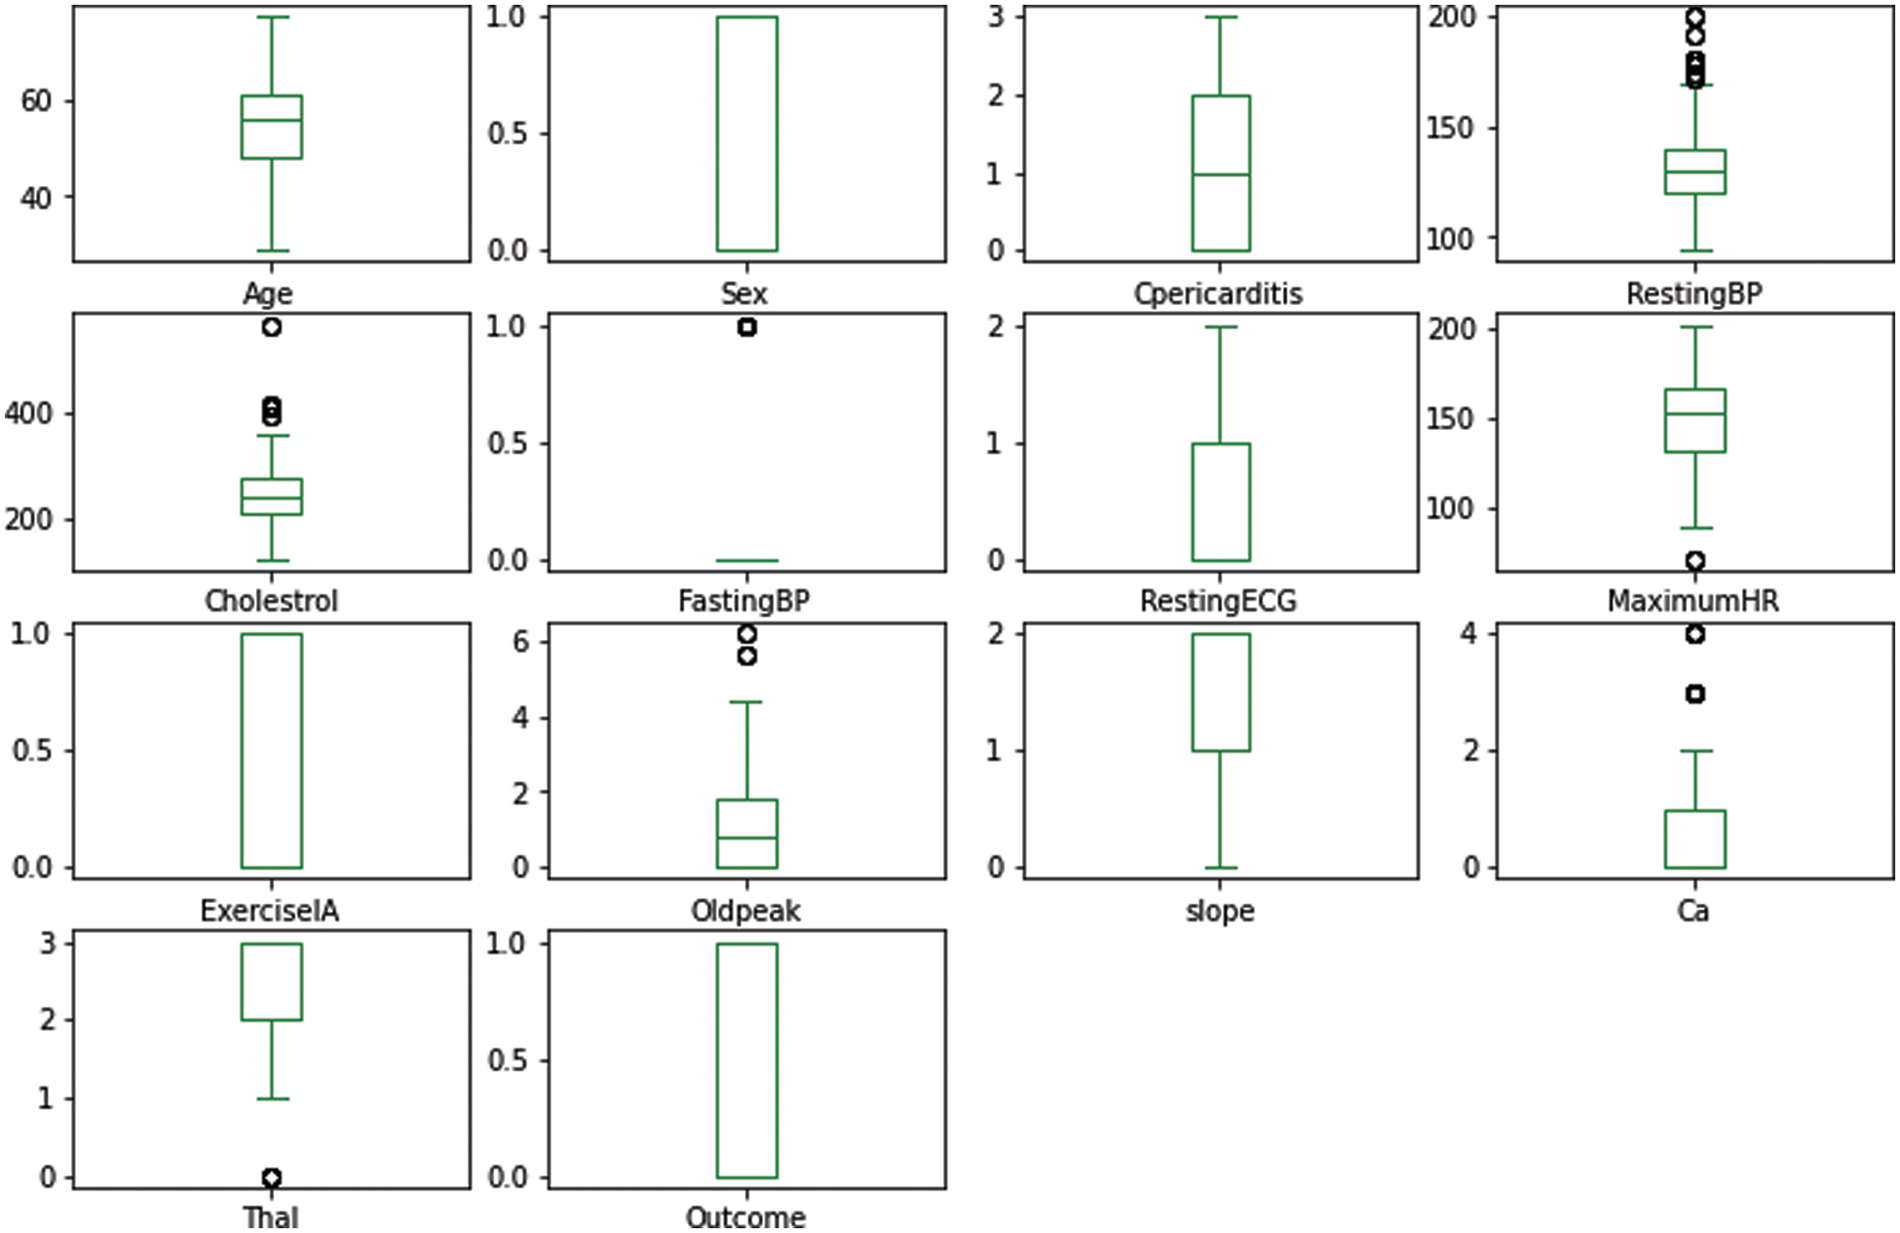
Figure 4: Boxplot of attributes
3.8 Correlation Coefficient Analysis
The correlation coefficient analysis (CCA) method is used to identify and plot the relationship among the dataset’s attributes [20]. A dataset is considered good if a strong association/relationship exists between the set of independent and dependent attributes. Fig. 5 presents the CCA of all attributes used to predict disease, and the range of relationships exists between +1 to −1 within the x-axis and y-axis. The cell value indicates the degree of relationship between the intersecting attributes. For example, the relationship value between resting blood pressure and age is 0.12.
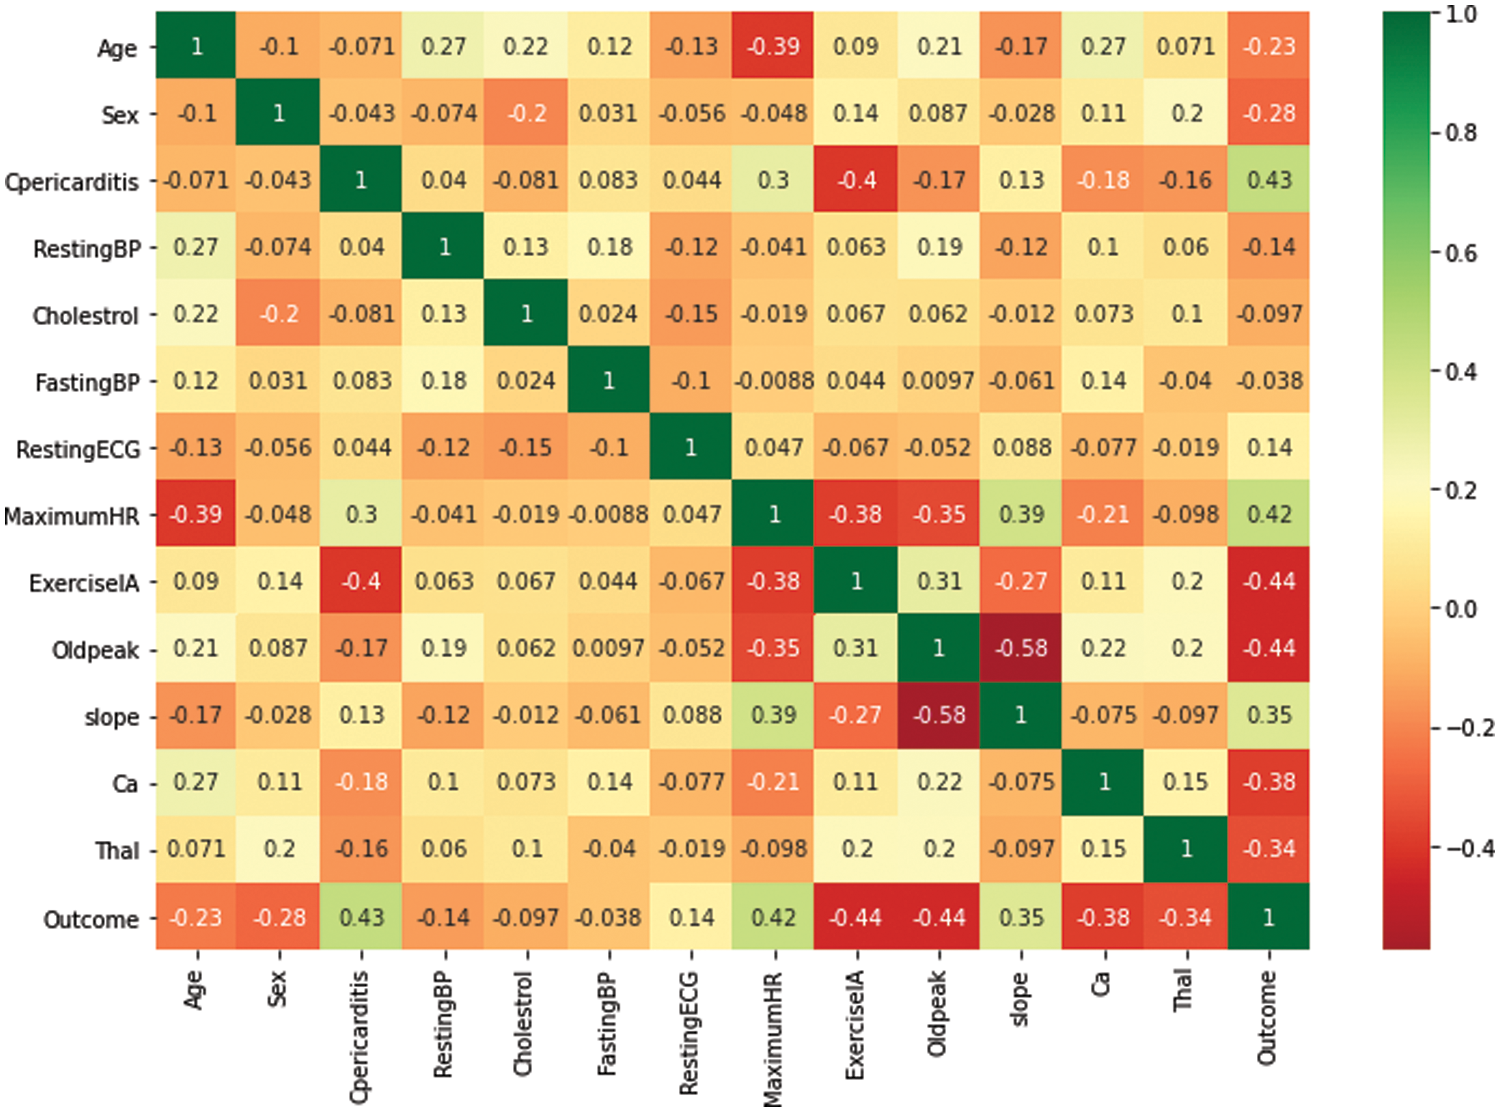
Figure 5: Correlation coefficient matrix
4 Experiment, Results, and Discussion
This section presents the discussion on the experimental details and results achieved using boosting algorithms for heart disease prediction. Subsequently, all results after implementing the proposed framework are shown and analyzed systematically. The results are presented in two modules: before preprocessing and after preprocessing for disease prediction. The evaluation is extensively discussed in terms of performance evaluation metrics such as precision, recall, f1-score, receiver operation curve, and traveling time of considered boosting algorithms.
Data preprocessing is vital in developing a robust and reliable system before applying ML methods to the model [21]. In this work, missing values have been identified and replaced by the data imputation method. Initially, we used the isnull() method to detect all the missing values and then executed the mean and mode imputation technique with the SimpleImputer() method to fill in these missing values. This process replaces all the missing values using the column’s mean, median, and mode. Outliers have been detected and replaced using the Interquartile range method, where Z-score techniques were used to shift the distribution of all the data samples and make the mean 0.
4.2 Hardware/Software Specification and Computational Time
An HP Z60 workstation was used to carry out this research work. The hardware specification of the system is as follows: Intel XEON 2.4 GHz CPU (12 core), 4 GB RAM, 1 TB hard disk, and Windows 10 pro-64-bit. The algorithms ADB, XGB, and GB on this machine took 4.23, 3.57, and 4.51 Seconds, respectively, for execution. Apart from hardware components, the software used for implementations is graphical user interface-based Anaconda Navigator, web-based computing platform Jupyter Notebook, and Python as a programming language.
The testing accuracy of boosting algorithms is shown in Fig. 6. The algorithms employed in this work are XGBoost (XGB), AdaBoost (ADB), and gradient boosting (GB). Without applying preprocessing techniques, the accuracy of classifiers like XGB, ADB, and GB are 87.50%, 81.50%, and 86%, respectively. After applying preprocessing techniques, GB outperformed other boosting algorithms by obtaining the highest accuracy rate of 92.20%, followed by AGB and ADB, both having 89.61%.
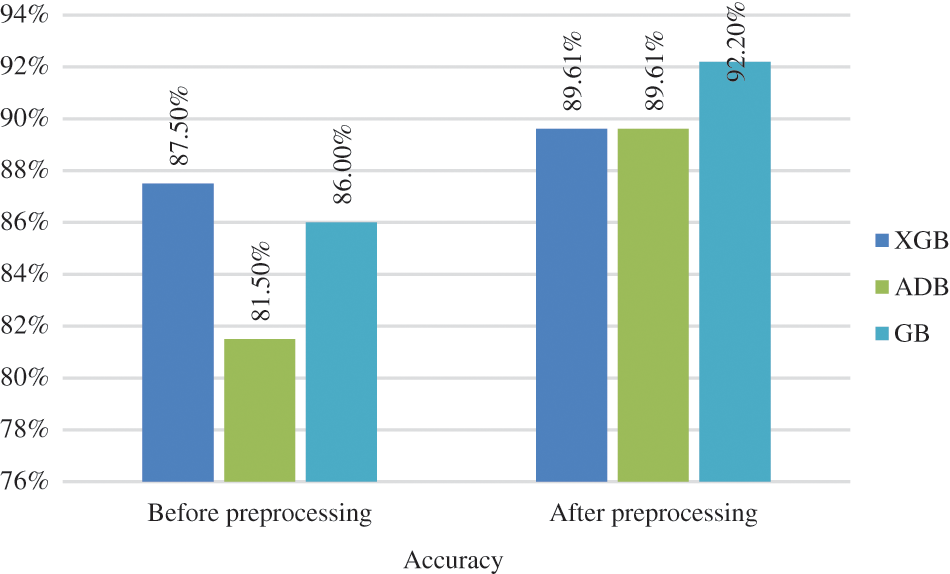
Figure 6: Classification accuracy
The precision, recall, and f1-score of the three considered classifiers were calculated before and after data preprocessing. The values were calculated (in percentage) for both the classes (0: no heart disease, 1: heart disease), as shown in Figs. 7 and 8. XGB performed best for all the measurements without preprocessing, whereas ADB performed the worst. With preprocessing, GB performed the best in most measurements, whereas XGB and ADB achieved more or less the same results.
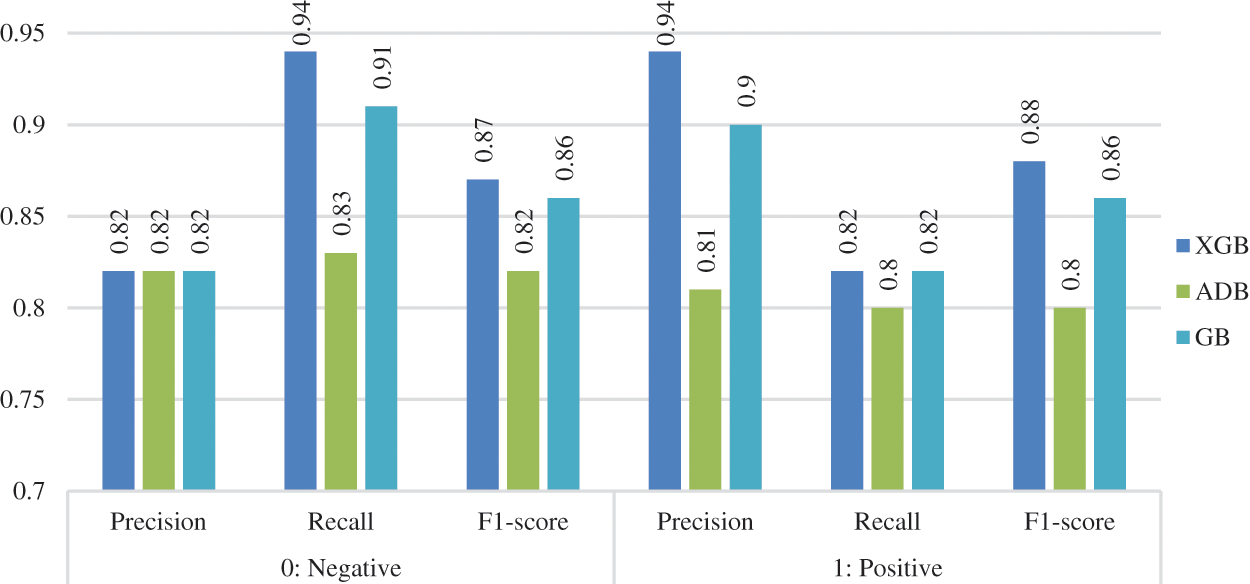
Figure 7: Other measurements before preprocessing
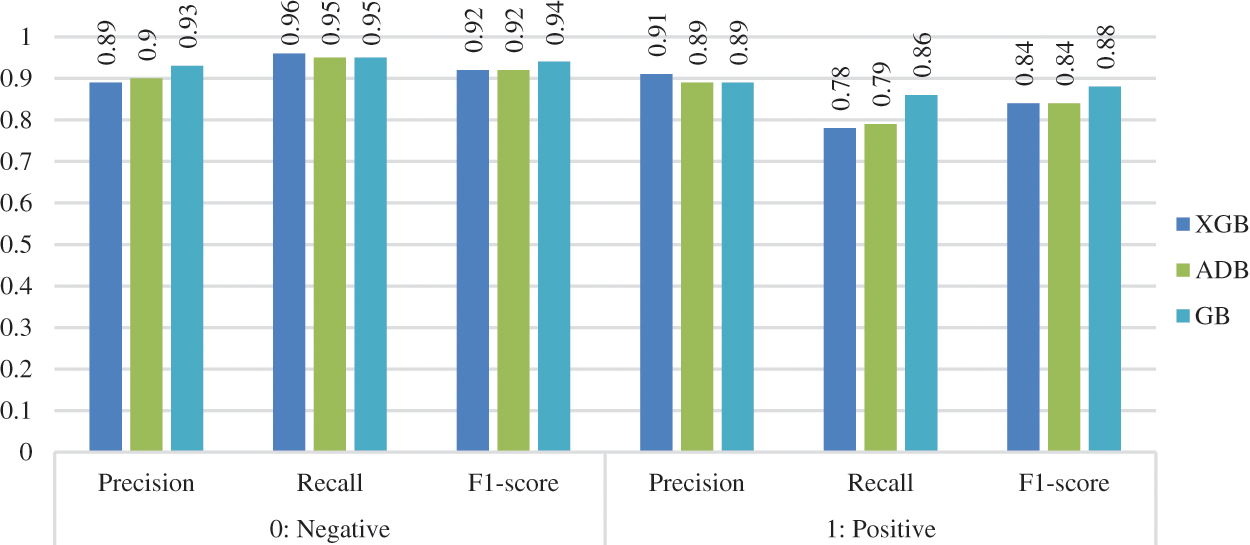
Figure 8: Other measurements after preprocessing
Feature importance is a process to calculate the score of input features (independent predicate variables) based on the contribution predicting the output feature (dependent/target variable) [22]. It plays an important role in developing machine/ensemble learning models to improve prediction results. In this work, the feature importance score (F-score) represents the number of times an attribute is used for splitting in the training process. A higher F-score of a feature (e.g., cholesterol) indicates that it is an important attribute. Fig. 9 shows the contribution of all the attributes toward prediction in descending order based on their F-score. For example, cholesterol has the highest significance in the prediction, whereas fasting blood pressure has the lowest.
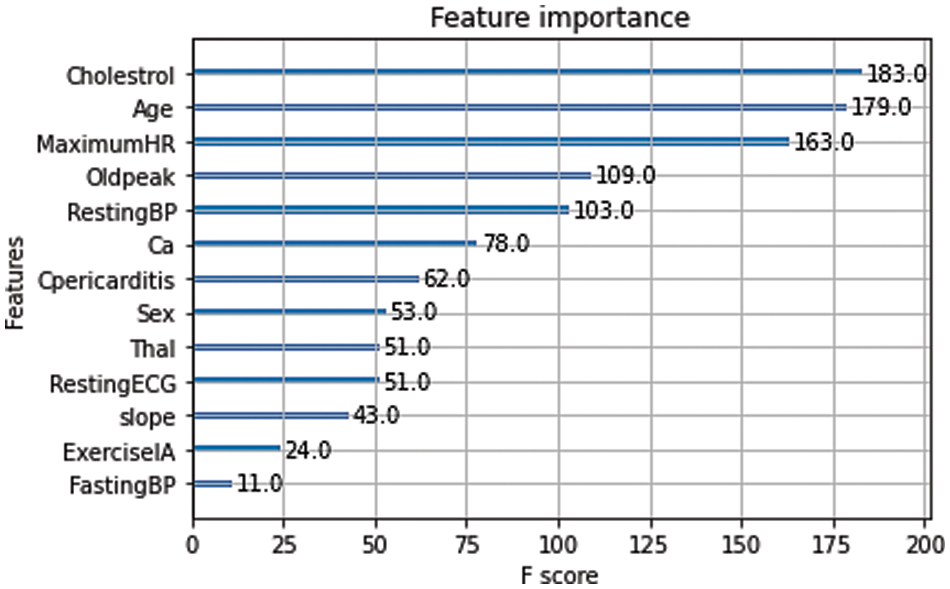
Figure 9: Feature importance for prediction
The receiver operating characteristic (ROC) curve has been used to show the prediction capability of considered boosting algorithms at different thresholds. It represents the false-positive rate vs. the true-positive rate along the x-axis and y-axis, respectively. Using the ROC curve, we analyzed how well our models distinguish between classes (0-no heart disease and 1-heart disease). A higher ROC curve means that the model is predicting good results between 0’s and 1’s. If the model has AUC near 1, it means a good separability measure; if AUC is near 0, it means the worst measure of disassociation. When the value of AUC is 0.5, the model is not working to separate the classes effectively. The ROC curves for ADB, XGB, and GB are shown in Figs. 10–12, respectively. From the figures, we conclude that XGB performs best, followed by GB and ADB.
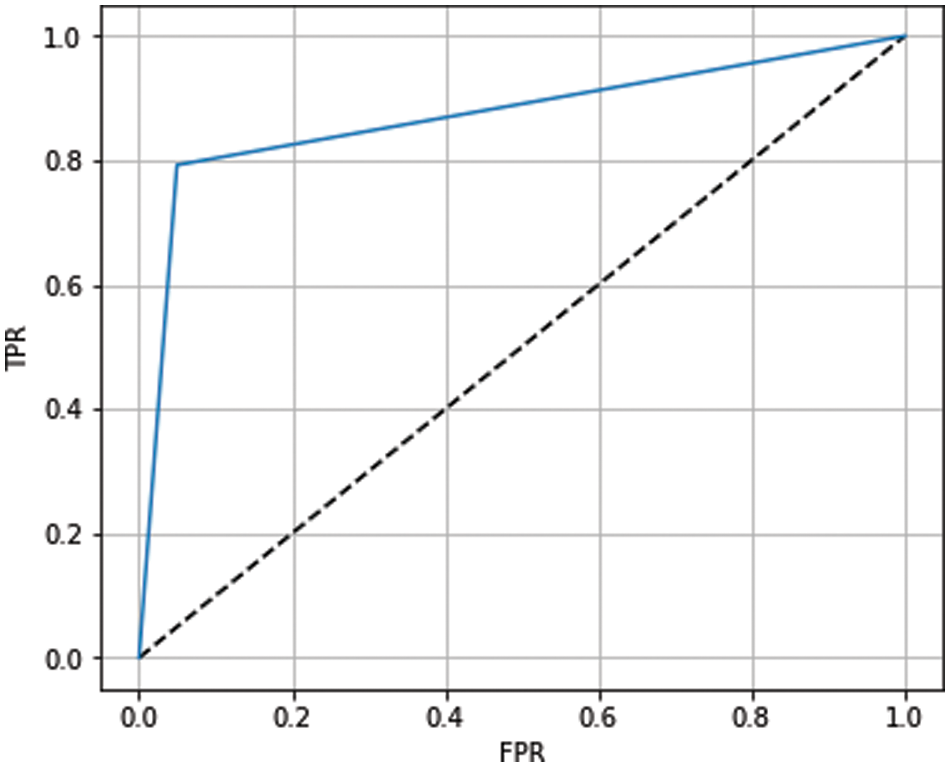
Figure 10: ROC curve for ADB
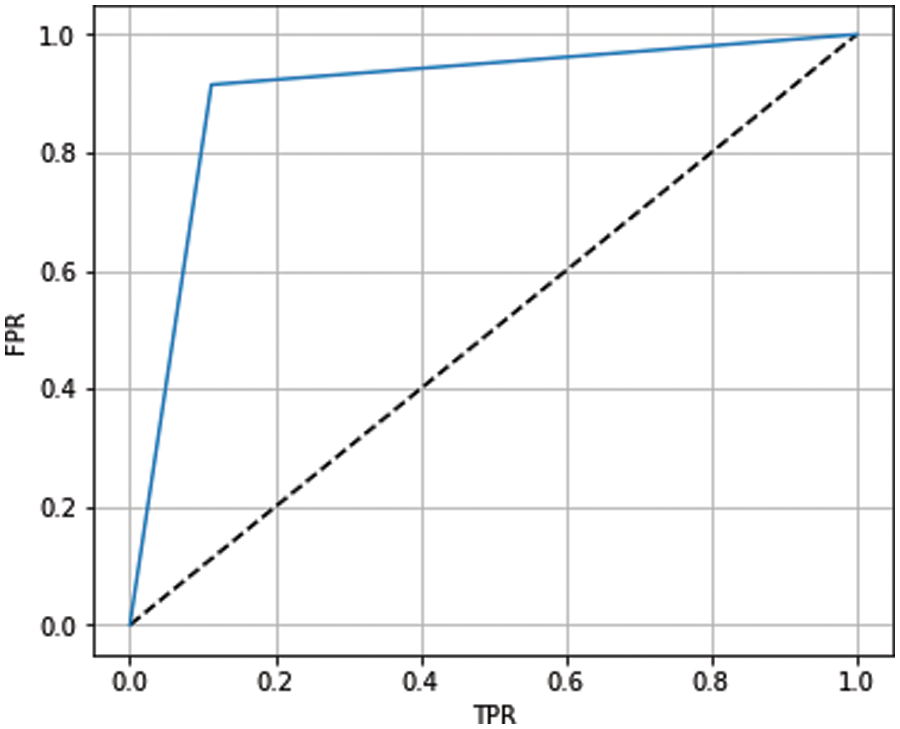
Figure 11: ROC curve for XGB
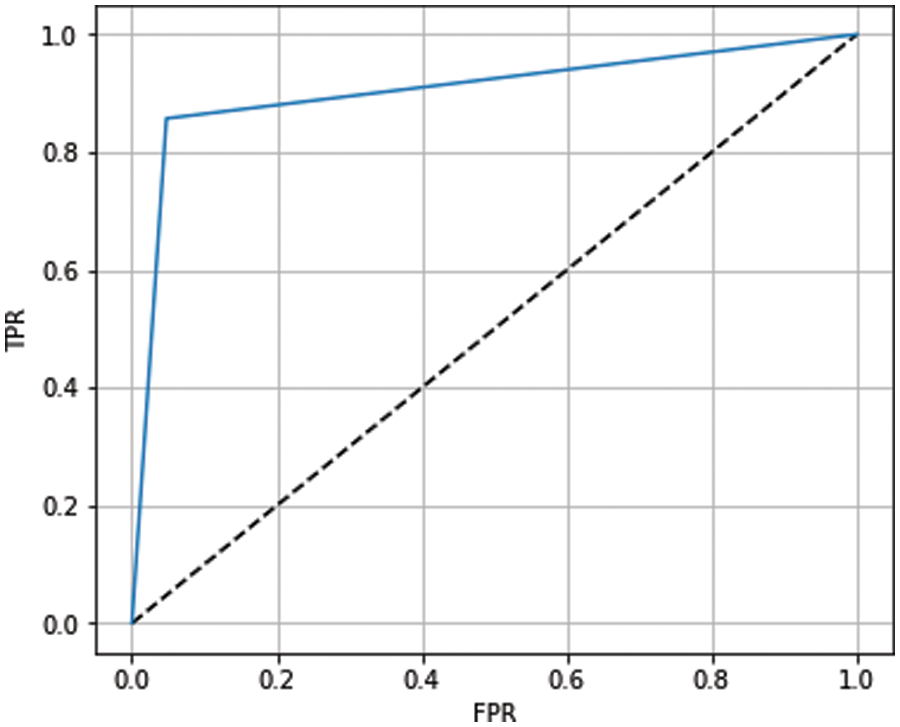
Figure 12: ROC curve for GB
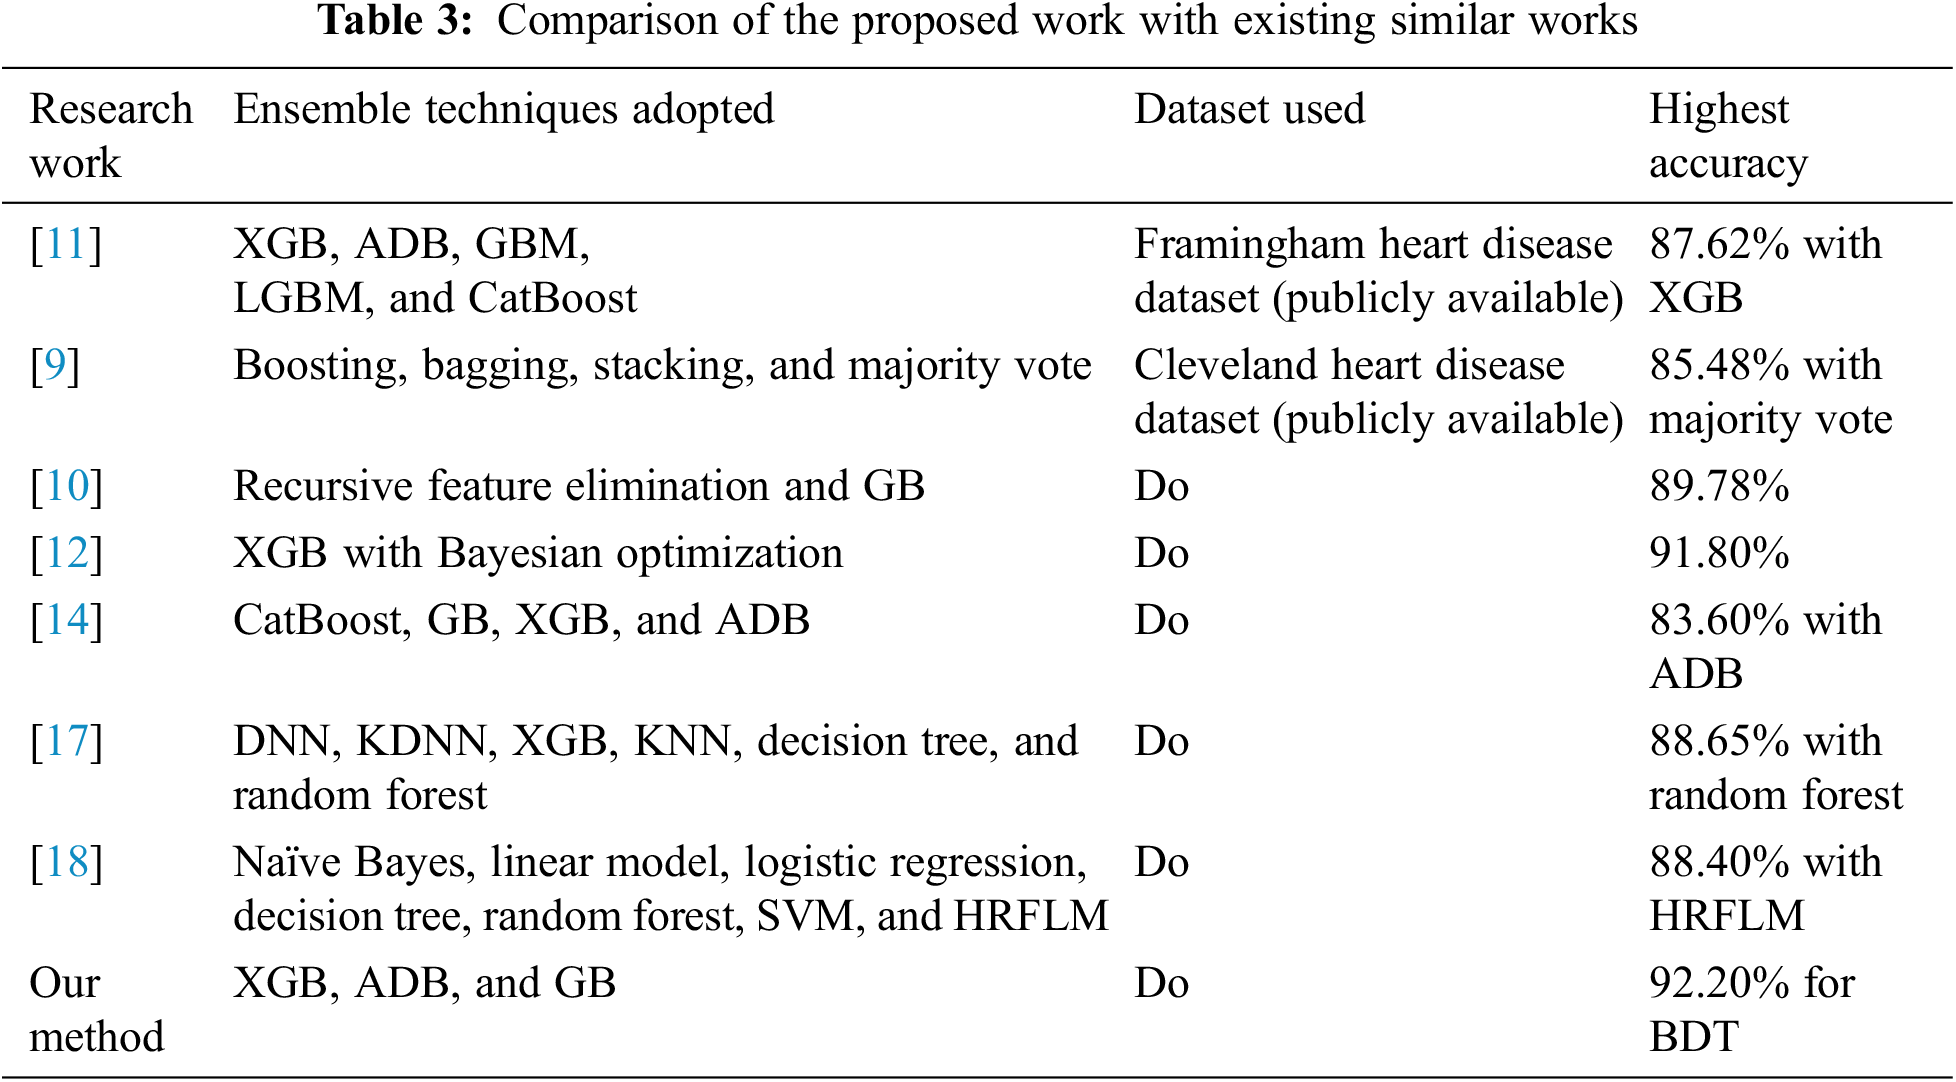
The proposed method produced good results in terms of different evaluation metrics for heart disease prediction. The performance of our proposed framework has been compared with several relevant studies in terms of techniques used, dataset, and accuracy, as shown in Table 3. Our proposed framework yielded good results in terms of different evaluation metrics, particularly for accuracy in predicting heart disease. Techniques such as data imputation for handling missing values, detection, and replacement of outliers using the Boxplot method have been used to achieve better results than other related works.
This study applied boosting algorithms to predict heart disease effectively. Different preprocessing methods, such as imputation, Z-score, and cleaning methods, were employed to improve the dataset’s prediction results and quality assessment. This study also executed three different boosting algorithms, namely, XGBoost, AdaBoost, and gradient boosting, before and after applying preprocessing techniques. The experimental results were assessed using different statistical/ML measurements. The experimental results revealed that gradient boosting achieved the highest accuracy rate of 92.20%. The gradient boosting algorithm also achieved better results for other metrics, such as precision, recall, and f1-score. Finally, the feature importance process was employed to calculate the contribution of independent features toward the final outcome.
Other ensemble learning techniques, such as bagging and stacking, can be used to improve the efficacy of this work. This proposed method can be used for other healthcare datasets that share the commonality of features to extend the scope of this research work. Deep learning techniques can also be explored to detect and predict cardiovascular diseases better.
Funding Statement: This work was supported by National Research Foundation of Korea-Grant funded by the Korean Government (MSIT)-NRF-2020R1A2B5B02002478.
Conflicts of Interest: The authors declare that they have no conflicts of interest to report regarding the present study.
1https://www.kaggle.com/datasets/johnsmith88/heart-disease-dataset.
References
1. WHO, “Cardiovascular diseases (CVDs),” 11th June, 2021. [Online]. Available: https://www.who.int/news-room/fact-sheets/detail/cardiovascular-diseases-(cvds) (accessed on 6 July 2022). [Google Scholar]
2. Y. Ruan, Y. Guo, Y. Zheng, Z. Huang, S. Sun et al., “Cardiovascular disease (CVD) and associated risk factors among older adults in six low-and middle-income countries: Results from SAGE Wave 1,” BMC Public Health, vol. 18, no. 1, pp. 1–13, 2018. [Google Scholar]
3. M. -H. Biglu, M. Ghavami and S. Biglu, “Cardiovascular diseases in the mirror of science,” Journal of Cardiovascular and Thoracic Research, vol. 8, no. 4, pp. 158–163, 2016. [Google Scholar] [PubMed]
4. S. M. Ganie, M. B. Malik and T. Arif, “Early prediction of diabetes mellitus using various artificial intelligence techniques: A technological review,” International Journal of Business Intelligence and Systems Engineering, vol. 1, no. 4, pp. 1–22, 2021. [Google Scholar]
5. J. Alzubi, A. Nayyar and A. Kumar, “Machine learning from theory to algorithms: An overview,” Journal of Physics: Conference Series, vol. 1142, no. 1, pp. 012012, 2018. [Google Scholar]
6. S. M. Ganie, M. B. Malik and T. Arif, “Performance analysis and prediction of type 2 diabetes mellitus based on lifestyle data using machine learning approaches,” Journal of Diabetes & Metabolic Disorders, vol. 21, no. 1, pp. 339–352, 2022. [Google Scholar]
7. N. Nissa, S. Jamwal and S. Mohammad, “Early detection of cardiovascular disease using machine learning techniques an experimental study,” International Journal of Recent Technology and Engineering, vol. 9, no. 3, pp. 635–641, 2020. [Google Scholar]
8. S. Jamwal and S. M. Najmu Nissa, “Heart disease prediction using machine learning,” Lecture Notes in Networks and Systems, vol. 203, no. 67, pp. 653–665, 2021. [Google Scholar]
9. C. B. C. Latha and S. C. Jeeva, “Improving the accuracy of prediction of heart disease risk based on ensemble classification techniques,” Informatics in Medicine Unlocked, vol. 16, no. November 2018, pp. 100203, 2019. [Google Scholar]
10. P. Theerthagiri and J. Vidya, “Cardiovascular disease prediction using recursive feature elimination and gradient boosting classification techniques,” CoRR, vol. abs/2106.0, 2021. [Online]. Available: https://arxiv.org/abs/2106.08889 [Google Scholar]
11. A. Z. Sultan Bin Habib, T. Tasnim and M. M. Billah, “A study on coronary disease prediction using boosting-based ensemble machine learning approaches,” in Proc. ICIET 2019, Dhaka, Bangladesh, pp. 23–24, 2019. [Google Scholar]
12. K. Budholiya, S. K. Shrivastava and V. Sharma, “An optimized XGBoost based diagnostic system for effective prediction of heart disease,” Journal of King Saud University-Computer and Information Sciences, vol. 34, no. 7, pp. 4514–4523, 2022. [Google Scholar]
13. C. Pan, A. Poddar, R. Mukherjee and A. K. Ray, “Impact of categorical and numerical features in ensemble machine learning frameworks for heart disease prediction,” Biomedical Signal Processing and Control, vol. 76, no. April, pp. 103666, 2022. [Google Scholar]
14. S. Pouriyeh, S. Vahid, G. Sannino, G. De Pietro, H. Arabnia et al., “A comprehensive investigation and comparison of machine learning techniques in the domain of heart disease,” in Proc. IEEE Symp. Computers and Communications, Heraklion, Greece, pp. 204–207, 2017. [Google Scholar]
15. V. M. Deshmukh, “Heart disease prediction using ensemble methods,” International Journal of Recent Technology and Engineering, vol. 8, no. 3, pp. 8521–8526, 2019. [Google Scholar]
16. N. Mary, B. Khan, A. A. Asiri, F. Muhammad, S. Alqhtani et al., “Investigating of classification algorithms for heart disease risk prediction,” Journal of Intelligent Medicine and Healthcare, vol. 1, no. 1, pp. 11–31, 2022. [Google Scholar]
17. A. Alqahtani, S. Alsubai, M. Sha, L. Vilcekova and T. Javed, “Cardiovascular disease detection using ensemble learning,” Computational Intelligence and Neuroscience, vol. 2022, no. 3, pp. 1–9, 2022. [Google Scholar]
18. A. Kondababu, V. Siddhartha, B. H. K. Bhagath Kumar and B. Penumutchi, “A comparative study on machine learning based heart disease prediction,” Materials Today: Proceedings, [in press], 2021. [Google Scholar]
19. S. M. Ganie and M. B. Malik, “An ensemble machine learning approach for predicting type-II diabetes mellitus based on lifestyle indicators,” Healthcare Analytics, vol. 2, no. 1, pp. 100092, 2022. [Google Scholar]
20. A. Hussain and S. Naaz, “Prediction of diabetes mellitus: Comparative study of various machine learning models,” in Int. Conf. on Innovative Computing and Communications. Advances in Intelligent Systems and Computing, vol. 1166. Singapore: Springer, pp. 103–115, 2021. [Google Scholar]
21. A. Jazayeri, O. S. Liang and C. C. Yang, “Imputation of missing data in electronic health records based on patients’ similarities,” Journal of Healthcare Informatics Research, vol. 4, no. 3, pp. 295–307, 2020. [Google Scholar] [PubMed]
22. D. Dutta, D. Paul and P. Ghosh, “Analysing feature importances for diabetes prediction using machine learning,” in Proc. IEMCON 2018, Vancouver, Canada, pp. 924–928, 2019. [Google Scholar]
Cite This Article
 Copyright © 2023 The Author(s). Published by Tech Science Press.
This work is licensed under a Creative Commons Attribution 4.0 International License , which permits unrestricted use, distribution, and reproduction in any medium, provided the original work is properly cited.
 Downloads
 Citation Tools