
 Submit a Paper
 Propose a Special lssue
 Open Access
ARTICLE

Leveraging Multimodal Ensemble Fusion-Based Deep Learning for COVID-19 on Chest Radiographs
1 Department of Medical Equipment Technology, College of Applied Medical Sciences, Majmaah University, Al Majmaah, 11952, Saudi Arabia
2 Department of Biomedical Engineering, Bannari Amman Institute of Technology, Sathyamangalam, 638401, India
3 Department of Computer Science and Engineering, K.Ramakrishnan College of Engineering, Tiruchirappalli, 621112, India
4 Institute of Biomedical Engineering, Saveetha School of Engineering, Saveetha Institute of Medical and Technical Sciences, Saveetha University, Chennai, 602105, India
5 Department of Applied Data Science, Noroff University College, Kristiansand, Norway
6 Artificial Intelligence Research Center (AIRC), College of Engineering and Information Technology, Ajman University, Ajman, United Arab Emirates
7 Department of Electrical and Computer Engineering, Lebanese American University, Byblos, Lebanon
8 Department of Software, Kongju National University, Cheonan, 31080, Korea
9 Division of Computer Engineering, Hansung University, Seoul, 02876, Korea
* Corresponding Author: Mohamed Yacin Sikkandar. Email:
Computer Systems Science and Engineering 2023, 47(1), 873-889. https://doi.org/10.32604/csse.2023.035730
Received 01 September 2022; Accepted 21 December 2022; Issue published 26 May 2023
 View Full Text
 Download PDF
Abstract
Recently, COVID-19 has posed a challenging threat to researchers, scientists, healthcare professionals, and administrations over the globe, from its diagnosis to its treatment. The researchers are making persistent efforts to derive probable solutions for managing the pandemic in their areas. One of the widespread and effective ways to detect COVID-19 is to utilize radiological images comprising X-rays and computed tomography (CT) scans. At the same time, the recent advances in machine learning (ML) and deep learning (DL) models show promising results in medical imaging. Particularly, the convolutional neural network (CNN) model can be applied to identifying abnormalities on chest radiographs. While the epidemic of COVID-19, much research is led on processing the data compared with DL techniques, particularly CNN. This study develops an improved fruit fly optimization with a deep learning-enabled fusion (IFFO-DLEF) model for COVID-19 detection and classification. The major intention of the IFFO-DLEF model is to investigate the presence or absence of COVID-19. To do so, the presented IFFO-DLEF model applies image pre-processing at the initial stage. In addition, the ensemble of three DL models such as DenseNet169, EfficientNet, and ResNet50, are used for feature extraction. Moreover, the IFFO algorithm with a multilayer perceptron (MLP) classification model is utilized to identify and classify COVID-19. The parameter optimization of the MLP approach utilizing the IFFO technique helps in accomplishing enhanced classification performance. The experimental result analysis of the IFFO-DLEF model carried out on the CXR image database portrayed the better performance of the presented IFFO-DLEF model over recent approaches.Keywords
With the outburst of an unknown disease in late 2019 in China, a few individuals were infected by the disease in a local marketplace. The disease was unidentified in the beginning; then, experts identified the symptoms were similar to that of COVID-19 and flu [1]. The clinical characteristics of COVID-19 have pneumonia, cough, respiratory symptoms, fever, and dyspnea. But such indications shall not denote COVID-19 all the time, and it is monitored in numerous pneumonia cases, resulting in prognostic issues for doctors [2]. As the RT-PCR test was considered a fixed method for diagnosing coronavirus infection, the test contains restricting prospects with some characteristics that made diagnosing the virus complex. RT-PCR test was complex, costly, manual process, and time taking [3]. One such disadvantage of this particular test is there occurring demand for a lab kit; the provision is impossible or hard for several nations at the time of epidemics and crises. The most significant means for diagnosing COVID-19 is utilizing radiological images, which include computed tomography (CT) scans and X-rays [4]. Chest imaging has been considered an easy and quick process suggested by health and medical procedures, and it was indicated in numerous texts as the primary apparatus in screening at the time of the epidemic [5]. When coronaviral infections spread worldwide, there is increasing attention to the appropriateness of chest X-Rays (CXR) for diagnosing and managing patients with alleged or identified coronavirus infections. Also, an increasing quantity of journals elaborates on the CXR appearances in patients infected by COVID-19 [6].
The correctness of the CXR prognosis of coronavirus infection mostly depends on radiological expertness because of the complicated morphological paradigms of pulmonary participation that could vary in extent and appear on time [7]. The restricted quantity of subspecialty-trained thoracic radiotherapists hinders the dependable analysis of complex chest analysis, particularly in developing nations, where general radiotherapists rarely analyze chest imaging [8]. One major application of DL in radiological practice is the identification of tissue skeletal irregularities and categorising syndromes. The convolutional neural network (CNN) was the most significant DL system and efficient method of identifying pathologies and abnormalities in chest radiographs [9]. Since the coronavirus pandemic, many studies have been carried out on data processing in connection with DL methods, particularly CNN. With the help of distinct methods and DL structures, such researchers embarked on recognising and variance the prognosis of coronavirus infection [10].
This study develops an improved fruit fly optimization with a deep learning-enabled fusion (IFFO-DLEF) approach for COVID-19 detection and classification. The presented IFFO-DLEF model applies image pre-processing at the initial stage. In addition, the ensemble of three DL models such as DenseNet169, EfficientNet, and ResNet50, are used for feature extraction. Moreover, the IFFO algorithm with a multilayer perceptron (MLP) classification model is utilized to identify and classify COVID-19. The parameter optimization of the MLP technique utilizing the IFFO approach supports enhanced classification performance. The experimental result analysis of the IFFO-DLEF model was carried out on the CXR image database.
In [11], the authors have suggested a DL-NN-related technique, nCOVnet. This alternate fastest screening technique is utilized for identifying the coronavirus infection by examining the patients’ X-rays that would be observed for visual indicators discovered in the chest radiography imaging of COVID-19 patients. Vaid et al. [12] advanced a DL methodology to improve the correctness of cases that have reported and accurately forecast the syndrome from CXR scans. This method depends upon CNNs for detecting the classification of disease and structural abnormalities and which is a key factor in uncovering concealed models. In [13], the researchers suggest a novel method for detecting COVID-19 by exploiting a conditional generative adversarial network (GAN) to produce synthetic images to expand the restricted quantity of data presented. Moreover, the researchers suggest 2 DL techniques, including lightweight architecture, commensurate with the entire volume of available data. This study mainly aimed at binary classification for COVID-19 vs. Normal cases and multi-categorization involving the third class for bacterial pneumonia. This technique reached a competitive outcome than other researchers in the publications and a ResNet8 method.
In [14], the authors recommend CVDNet, a Deep CNN methodology for classifying COVID-19 from normal and other respiratory diseases with the help of CXR images. The suggested structure depends on the residual NN, and it can be built by utilizing 2 parallel stages having distinct kernel sizes for capturing global and local characteristics of the inputs. This method can be well-trained on a dataset publicly existing consisting of a grouping of 1341 normal and 1345 viral pneumonia CXR and 219 COVID-19 images. A methodology for COVID forecasting from CXRs utilizing CheXNet is presented in [15]. This suggested method categorizes the binary classes (normal and COVID) with 99.9% precision. CheXNet was regarded as a CNN method which can leverage the ChestXray14 dataset, and it has been trained for detecting abnormalities in CXRs.
In [16], the research scholars recommend a weakly supervised DL strategy for classifying and detecting coronavirus infection through CT images. The suggested technique may reduce the need for labelling CT images manually however it can acquire precise infection identification and differentiate COVID-19 from non-COVID19 cases. In [17], the researchers suggested a deep transfer learning (DTL) method, which hastens the identification of COVID-19 cases with utilized of CT-Scan and X-ray images of the chest. Initial CXR (CXR) cab screening offers important information for identifying alleged COVID-19 cases. The researchers assumed 3 datasets: CXR Images (Pneumonia), COVID-CXR, and SARS-COV-2 CT-scan. With the acquired outcomes, the suggested DL method could identify coronavirus infection-positive cases in lesser than two seconds which will be faster when compared with RT-PCR tests, which have been used in recent times for identifying COVID-19 cases. The researcher scholars also accomplished an association among COVID-19 patients with that Pneumonia patient have discovered the model among COVID-19 and Pneumonia radiology images.
This study developed a new IFFO-DLEF approach for COVID-19 detection and classification on CXR images. The presented IFFO-DLEF algorithm involves different subprocesses: image pre-processing, ensemble fusion model, image classification, and parameter optimization. Using the fusion process and hyperparameter optimization algorithm helps accomplish improved performance. Fig. 1 depicts the block diagram of the IFFO-DLEF approach.

Figure 1: Block diagram of the IFFO-DLEF approach
The presented IFFO-DLEF model performed image pre-processing at the initial stage. In the primary step, the CXR images obtain pre-processing with removed noise utilizing the WF approach. Noise removal is an image pre-processed method intended at improving the feature of images corrupted by noise. The certain case was adaptive filtering in that the denoising entirely depends on the noise content projected in the image locally. Consider that the corrupted image is determined as
Here, when the noise variance through the image has been equal to zero,
If
In this study, the ensemble of three DL models such as DenseNet169, EfficientNet, and ResNet50, are used for feature extraction. The transfer learning (TL) model represents the machine learning algorithm that transmits data learned from one domain to related problems in a similar domain. It is suggested to use the model developed and trained for a task as a basis of the tasks viz., same as the trained one. The researcher utilized different notations for describing the concept of transfer learning. The two fundamental concepts of TL, Task and Domain, are mathematically explained. Transfer learning is arithmetically defined as making a clearer picture. The fusion of features is an important process that integrates multiple features. It mainly depends upon the features fusion using entropy and the four vectors can be represented using Eqs. (2)–(4):
The integration of derived features into a single vector takes place using Eq. (5).
where f is the fused vector
DenseNet is one of the effectively utilized DL model for image classification [18]. In this work, the DenseNet169 model is used. The initial phase is derived from the design of a deeper convolutional network comprising short links among the layers closer to the input and output. This DL model is precise and effective in the training process. It varies from the ResNet in the way that it has skin connections which can bypass the non-linear transformations.
Also, the DenseNet append a straight linking from anyone layer to succeeding layer. Therefore, the
where
ResNet50 is the abbreviation of Residual Network with fifty layers. Once the researcher followed the “the deeper, the better” phrase with the DL model, they faced difficulties. “Deeper the network is the efficiency of network needed to be improved”; this concept proves them wrong once a deeper network with fifty-two layers produced poor performance than that of the network with twenty to thirty layers [19]. Various predictions are described the model performance reduction, and the major reason for that is the gradient vanishing. Once the network is extremely in-depth, the gradient value decreases to zero, causing the weight not to upgrade, and consequently, no learning is executed.
EfficientNet-B0 network and uniformly scaled up the depth, resolution, and width using an effective and compound coefficient to increase EfficientNet model B1–B7 [20]. The model attained superiority and performed efficiently over the present CNN model on the ImageNet dataset. EfficientNet is faster, small with lesser parameters, and well generalized to attain high performance on other popular data for the TL process. The presented work fine-tuned EfficientNet model B0–B4 on CXR to identify COVID-19. As a result of the limited dataset in healthcare imaging, the data augmentation method is used for generating further CXR images to control over-fitting. While transporting the pre-trained EfficientNet to the CXR datasets, we finetuned the model by appending a global average pooling (GAP) to handle overfitting and decrease the parameter count. Two dense layers follow the GAP using a dropout rate of 0.4 and a ReLU function beforehand; a last dense layer acts as output using softmax activation function for determining the probability of input CXR demonstrating the infected and normal classes. This can be attained by using the following equation
From the expression, σ refers to the softmax function, q indicates the input vector to output layer i described from the exponential component
Once the features are derived, the MLP classification model is utilized to identify and classify COVID-19. The feedforward neural network (FFNN) is a well-known type of ANN, and MLP is the most common form of FFNN that is extensively utilized in resolving realistic classification problems [21]. An MLP is composed of: hidden
In Eq. (8),
The widely employed sigmoid activation function was designated in the MLP. Using the outcomes of the hidden neuron, the last production of the output neuron is calculated by:

Figure 2: MLP structure
MLP performance highly relies on biases and weights; also, trainable MLP aims to find optimum weight and bias. MLP training is a difficult process which results in a higher-performance MLP.
The parameter optimization of the MLP model using the IFFO algorithm helps in accomplishing enhanced classification performance. Pan [22] proposed a basic FFO algorithm that is stimulated by the foraging behaviour of natural fruit flies (FF). The foraging behaviour of FF is divided into the visual and olfactory search phases. During olfactory foraging, the FF locate and search food sources near the population, and then estimate the odour concentration corresponding to each potential food source. In the visual foraging, an optimal food source with the highest smell concentration value was introduced; later, the FF group fly nearer to it. The procedure of FOA has delineated in the following:
Step 1: Initialized parameter contains the highest count of iterations and size of the population.
Step 2: Initialize the position of the FF swarm.
Step 3: Olfactory foraging: makes different FF arbitrarily closer to the existing FF swarm position to construct a population
Step 4: Evaluate the population to obtain the fitness values of each FF.
Step 5: Visual foraging: define the FF with optimal fitness value, then the FF group flies nearer the optimal one.
Step 6: When the highest iteration is obtained, the process ends; otherwise, return to Step 3.
Before generating a new solution with each decision variable of population position as the original FOA, IFFO makes a novel solution with an index arbitrarily selected to enhance the search from the growth stage [23].
Let
The IFFO system develops a fitness function (FF) for achieving higher classifier performances. It resolves a positive integer to imply the superior performance of candidate results. In this case, the minimized classification error rate was assumed that FF is offering in Eq. (13).
This section inspects the performance of the IFFO-DLEF model on the test CXR dataset [24], containing 3224 COVID images and 3224 healthy images as illustrated in Table 1. A few sample images are depicted in Fig. 3. The parameter settings are given as follows: learning rate: 0.01, dropout: 0.5, batch size: 5, epoch count: 50, and activation: ReLU.


Figure 3: Sample images
Fig. 4 exemplifies a set of confusion matrices generated by the IFFO-DLEF model on diverse epochs. On 100 epochs, the IFFO-DLEF model has categorized 3192 COVID images and 3199 Healthy images. In addition, on 600 epochs, the IFFO-DLEF methodology has categorized 3180 COVID images and 3173 Healthy images. Along with that, on 900 epochs, the IFFO-DLEF model has categorized 3198 COVID images and 3199 Healthy images. Also, on 1200 epochs, the IFFO-DLEF technique has categorized 3195 COVID images and 3204 Healthy images.


Figure 4: Confusion matrices of IFFO-DLEF method under varying epochs (a) 100, (b) 200, (c) 300, (d) 400, (e) 500, (f) 600, (g) 700, (h) 800, (i) 900, (j) 1000, (k) 1100, and (l) 1200
Table 2 and Fig. 5 highlight the COVID-19 classification results of the IFFO-DLEF model under varying epochs. On 100 epochs, the IFFO-DLEF model has offered average

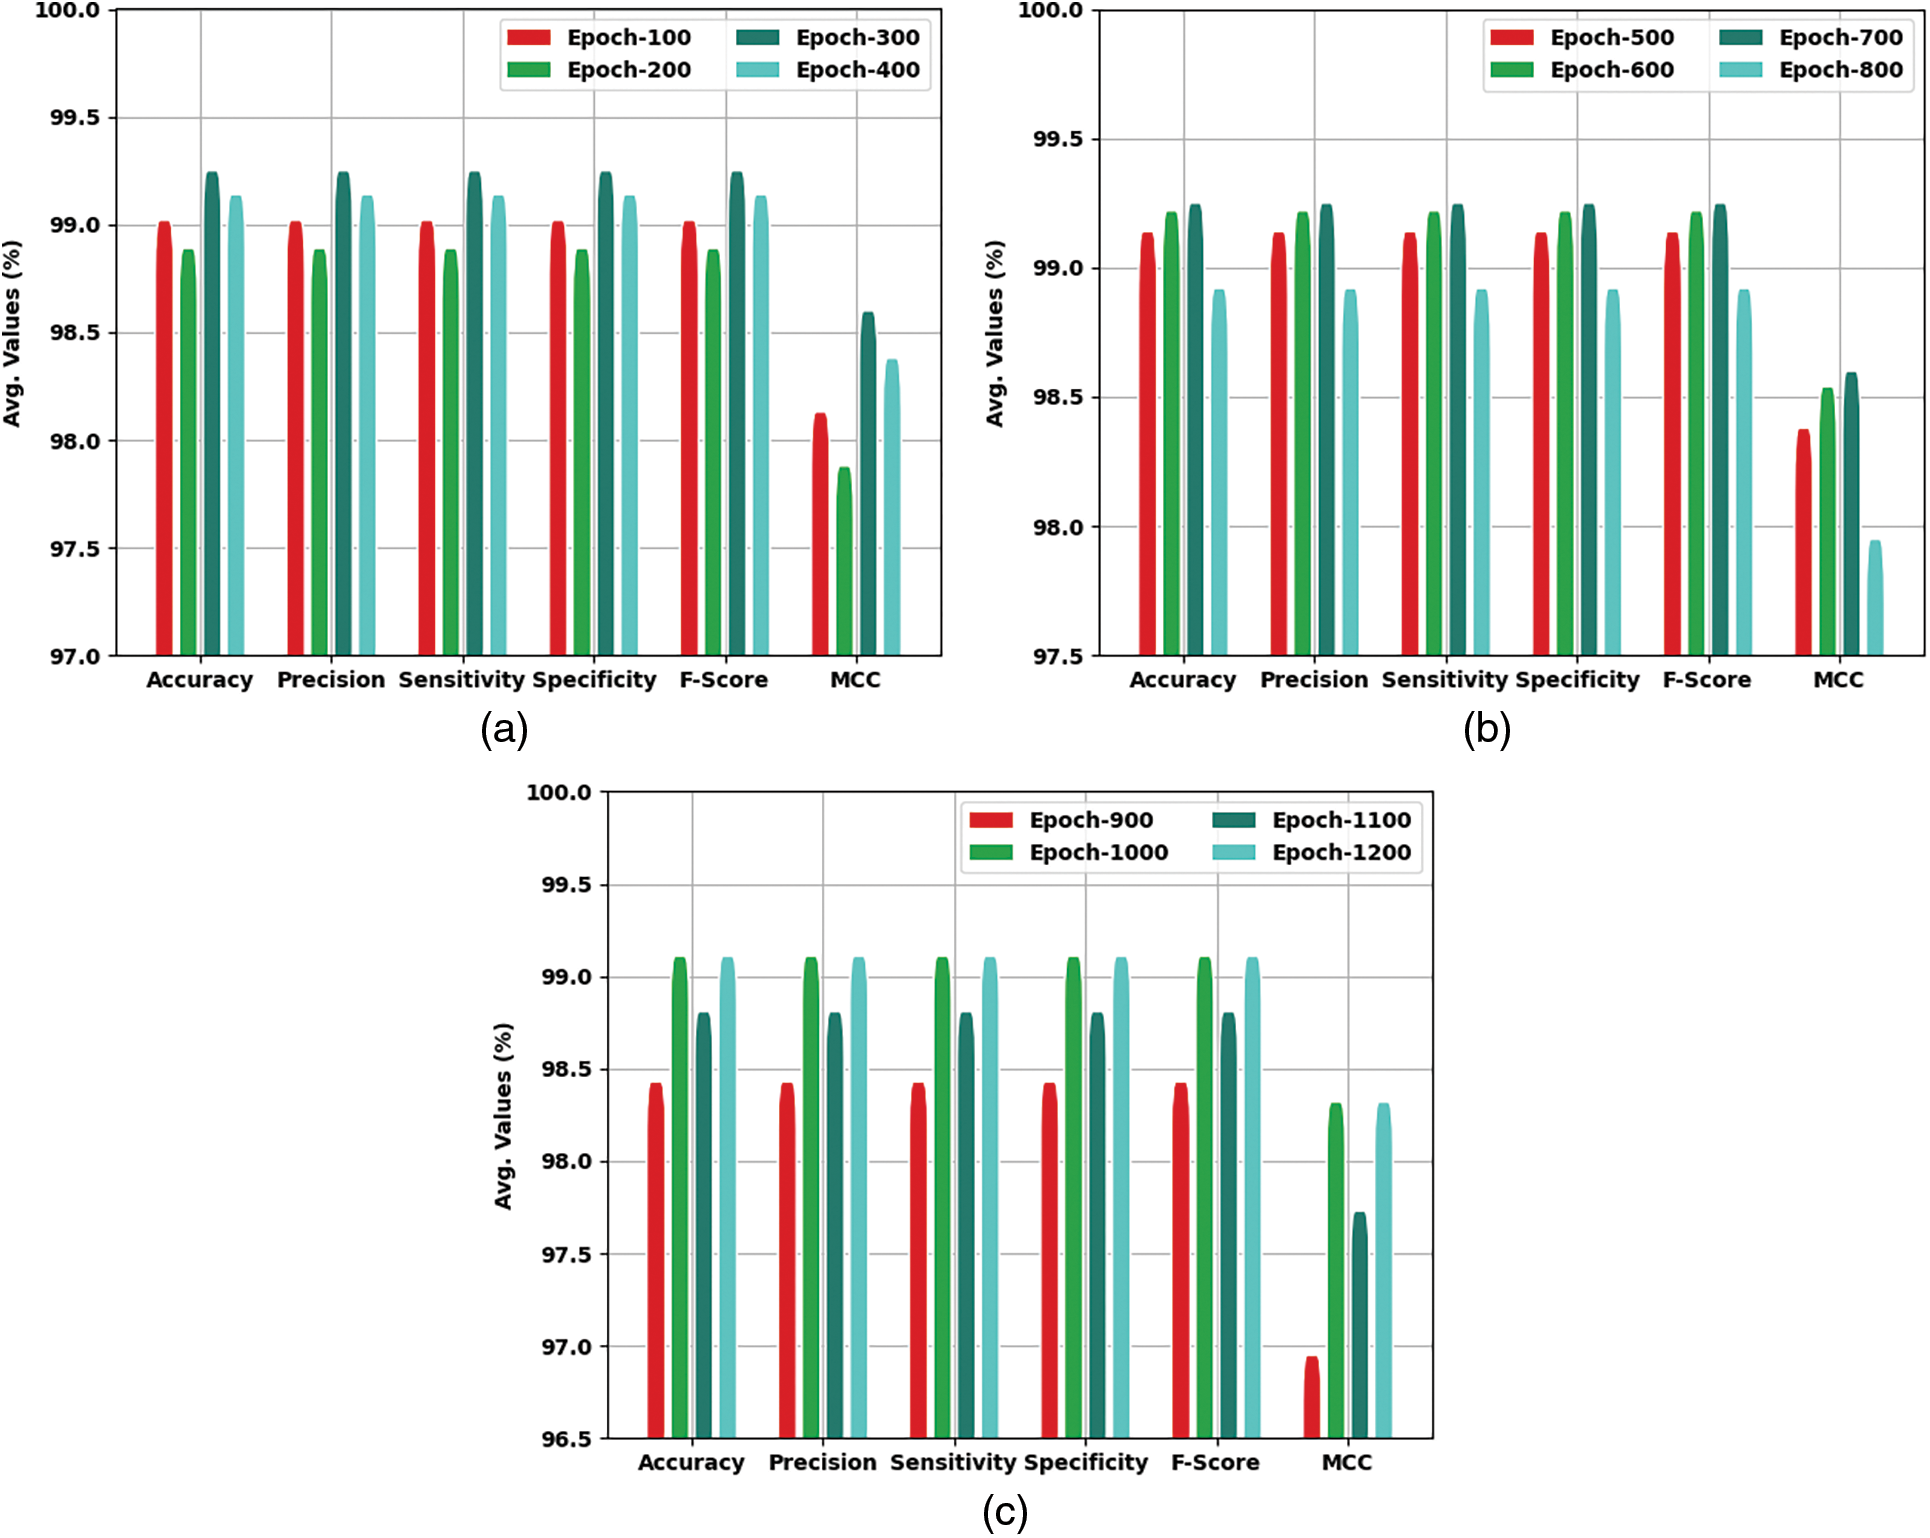
Figure 5: Average analysis of IFFO-DLEF method
A brief precision-recall analysis of the IFFO-DLEF technique on the test dataset is portrayed in Fig. 6. By observing the figure, it is noted that the IFFO-DLEF system has accomplished maximum precision-recall performance under all classes. A detailed ROC examination of the IFFO-DLEF technique on the test dataset is portrayed in Fig. 7. The results denoted the IFFO-DLEF algorithm has exhibited its ability in categorizing two different classes on the test dataset.

Figure 6: Precision-recall curve analysis of IFFO-DLEF methodology

Figure 7: ROC curve analysis of IFFO-DLEF methodology
Table 3 reports a brief comparative study of the IFFO-DLEF model with different existing models in terms of different measures [25–27].

Fig. 8 offers a detailed comparative examination of the IFFO-DLEF model with recent models in terms of

Figure 8:
Fig. 9 provides a brief comparative scrutiny of the IFFO-DLEF system with recent models in terms of
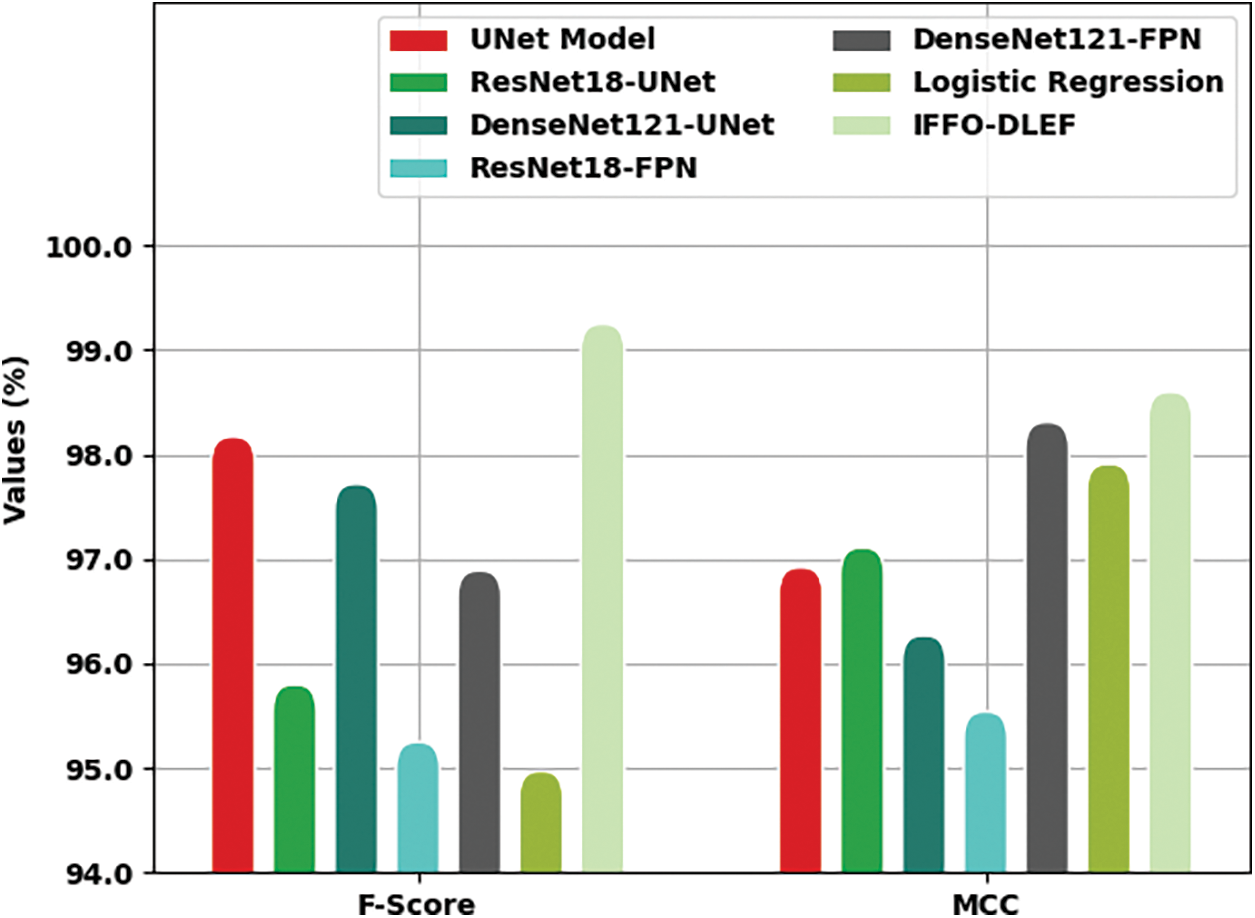
Figure 9:
Fig. 10 presents a detailed comparative investigation of the IFFO-DLEF algorithm with recent models in terms of

Figure 10:
In this study, a new IFFO-DLEF approach was established for COVID-19 detection and classification on CXR images. The presented IFFO-DLEF model performed image pre-processing at the initial stage. Followed by, the ensemble of three DL models such as DenseNet169, EfficientNet, and ResNet50 models are used for feature extraction. Besides, the IFFO algorithm with MLP classification model is utilized for the identification and classification of COVID-19. The parameter optimization of the MLP algorithm utilizing the IFFO method supports accomplishing enhanced classification performance. The experimental result analysis of the IFFO-DLEF model carried out on the CXR image database portrayed the better performance of the presented IFFO-DLEF model over recent approaches. In future, the performance of the IFFO-DLEF model is extended to the design of a metaheuristic weight selection approach for the fusion model.
Acknowledgement: The author extends their appreciation to the deputyship for Research & Innovation, Ministry of Education in Saudi Arabia for funding this research work through the project number (IFP-2020-111).
Funding Statement: This research was partly supported by the Technology Development Program of MSS [No. S3033853] and by Basic Science Research Program through the National Research Foundation of Korea (NRF) funded by the Ministry of Education (No. 2020R1I1A3069700).
Conflicts of Interest: The authors declare that they have no conflicts of interest to report regarding the present study.
References
1. R. Jain, M. Gupta, S. Taneja and D. J. Hemanth, “Deep learning based detection and analysis of COVID-19 on chest X-ray images,” Applied Intelligence, vol. 51, no. 3, pp. 1690–1700, 2021. [Google Scholar] [PubMed]
2. S. R. Nayak, D. R. Nayak, U. Sinha, V. Arora and R. B. Pachori, “Application of deep learning techniques for detection of COVID-19 cases using chest X-ray images: A comprehensive study,” Biomedical Signal Processing and Control, vol. 64, pp. 102365, 2021. [Google Scholar] [PubMed]
3. A. Shoeibi, M. Khodatars, R. Alizadehsani, N. Ghassemi, M. Jafari et al., “Automated detection and forecasting of COVID-19 using deep learning techniques: A review,” arXiv preprint arXiv:2007.10785, 2020. [Google Scholar]
4. N. Subramanian, O. Elharrouss, S. Al-Maadeed and M. Chowdhury, “A review of deep learning-based detection methods for COVID-19,” Computers in Biology and Medicine, vol. 143, pp. 105233, 2022. [Google Scholar] [PubMed]
5. M. Ghaderzadeh and F. Asadi, “Deep learning in the detection and diagnosis of COVID-19 using radiology modalities: A systematic review,” Journal of Healthcare Engineering, vol. 2021, pp. 1–10, 2021. [Google Scholar]
6. C. Zheng, X. Deng, Q. Fu, Q. Zhou, J. Feng et al., “Deep learning-based detection for COVID-19 from chest CT using weak label,” IEEE Transactions on Medical Imaging, vol. 39, no. 8, pp. 2615–2625, 2020. [Google Scholar]
7. E. Luz, P. Silva, R. Silva, L. Silva, J. Guimarães et al., “Towards an effective and efficient deep learning model for COVID-19 patterns detection in X-ray images,” Research on Biomedical Engineering, vol. 38, no. 1, pp. 149–162, 2022. [Google Scholar]
8. J. Zhang, Y. Xie, Y. Li, C. Shen and Y. Xia, “COVID-19 screening on chest x-ray images using deep learning based anomaly detection,” arXiv preprint arXiv:2003.12338, 2020. [Google Scholar]
9. X. R. Zhang, J. Zhou, W. Sun and S. K. Jha, “A lightweight CNN based on transfer learning for COVID-19 diagnosis,” Computers, Materials & Continua, vol. 72, no. 1, pp. 1123–1137, 2022. [Google Scholar]
10. K. Shankar, S. N. Mohanty, K. Yadav, T. Gopalakrishnan, and A. M. Elmisery, “Automated COVID-19 diagnosis and classification using convolutional neural network with fusion based feature extraction model,” Cognitive Neurodynamics, 2021, https://doi.org/10.1007/s11571-021-09712-y [Google Scholar]
11. H. Panwar, P. K. Gupta, M. K. Siddiqui, R. M. Menendez and V. Singh, “Application of deep learning for fast detection of COVID-19 in X-rays using nCOVnet,” Chaos, Solitons & Fractals, vol. 138, pp. 109944, 2020. [Google Scholar]
12. S. Vaid, R. Kalantar and M. Bhandari, “Deep learning COVID-19 detection bias: Accuracy through artificial intelligence,” International Orthopaedics, vol. 44, no. 8, pp. 1539–1542, 2020. [Google Scholar] [PubMed]
13. S. Karakanis and G. Leontidis, “Lightweight deep learning models for detecting COVID-19 from chest X-ray images,” Computers in Biology and Medicine, vol. 130, pp. 104181, 2021. [Google Scholar] [PubMed]
14. C. Ouchicha, O. Ammor and M. Meknassi, “CVDNet: A novel deep learning architecture for detection of coronavirus (COVID-19) from chest x-ray images,” Chaos, Solitons & Fractals, vol. 140, pp. 110245, 2020. [Google Scholar]
15. D. Haritha, M. K. Pranathi and M. Reethika, “COVID detection from chest x-rays with deeplearning: CheXNet,” in 2020 5th Int. Conf. on Computing, Communication and Security (ICCCS), Patna, India, pp. 1–5, 2020. [Google Scholar]
16. S. Hu, Y. Gao, Z. Niu, Y. Jiang, L. Li et al., “Weakly supervised deep learning for COVID-19 infection detection and classification from ct images,” IEEE Access, vol. 8, pp. 118869–118883, 2020. [Google Scholar]
17. H. Panwar, P. K. Gupta, M. K. Siddiqui, R. M. Menendez, P. Bhardwaj et al., “A deep learning and grad-CAM based color visualization approach for fast detection of COVID-19 cases using chest X-ray and CT-scan images,” Chaos, Solitons & Fractals, vol. 140, pp. 110190, 2020. [Google Scholar]
18. D. Bhowmik, M. Abdullah, R. Bin and M. T. Islam, “A deep face-mask detection model using DenseNet169 and image processing techniques,” Doctoral Dissertation, Brac University, 2022. [Google Scholar]
19. Y. Huang, S. Lian and H. Hu, “AVPL: Augmented visual perception learning for person Re-identification and beyond,” Pattern Recognition, vol. 129, pp. 108736, 2022. [Google Scholar]
20. Ü. Atila, M. Uçar, K. Akyol and E. Uçar, “Plant leaf disease classification using EfficientNet deep learning model,” Ecological Informatics, vol. 61, pp. 101182, 2021. [Google Scholar]
21. F. A. Chiappini, F. Allegrini, H. C. Goicoechea and A. C. Olivieri, “Sensitivity for multivariate calibration based on multilayer perceptron artificial neural networks,” Analytical Chemistry, vol. 92, no. 18, pp. 12265–12272, 2020. [Google Scholar] [PubMed]
22. W. -T. Pan, “A new fruit Fly optimization algorithm: Taking the financial distress model as an example,” Knowledge-Based Systems, vol. 26, pp. 69–74, 2012. [Google Scholar]
23. G. Hu, Z. Xu, G. Wang, B. Zeng, Y. Liu et al., “Forecasting energy consumption of long-distance oil products pipeline based on improved fruit fly optimization algorithm and support vector regression,” Energy, vol. 224, pp. 120153, 2021. [Google Scholar]
24. https://github.com/ieee8023/covid-chestxray-dataset [Google Scholar]
25. M. Ragab, S. Alshehri, N. A. Alhakamy, W. Alsaggaf, H. A. Alhadrami et al., “Machine learning with quantum seagull optimization model for COVID-19 chest x-ray image classification,” Journal of Healthcare Engineering, vol. 2022, pp. 1–13, 2022. [Google Scholar]
26. A. M. Hasan, M. M. AL-Jawad, H. A. Jalab, H. Shaiba, R. W. Ibrahim et al., “Classification of COVID-19 coronavirus, pneumonia and healthy lungs in ct scans using q-deformed entropy and deep learning features,” Entropy, vol. 22, no. 5, pp. 517, 2020. [Google Scholar] [PubMed]
27. Y. Qiblawey, A. Tahir, M. E. Chowdhury, A. Khandakar, S. Kiranyaz et al., “Detection and severity classification of COVID-19 in ct images using deep learning,” Diagnostics, vol. 11, no. 5, pp. 893, 2021. [Google Scholar] [PubMed]
Cite This Article
 Copyright © 2023 The Author(s). Published by Tech Science Press.
This work is licensed under a Creative Commons Attribution 4.0 International License , which permits unrestricted use, distribution, and reproduction in any medium, provided the original work is properly cited.
 Downloads
 Citation Tools