
 Submit a Paper
 Propose a Special lssue
 Open Access
ARTICLE

Towards Sustainable Agricultural Systems: A Lightweight Deep Learning Model for Plant Disease Detection
1 Department of Software, Sejong University, Seoul, 05006, Korea
2 Department of Convergence Engineering for Intelligent Drone, Sejong University, Seoul, 05006, Korea
3 Department of Electrical Engineering, College of Engineering, Jouf University, Sakaka, Saudi Arabia
* Corresponding Author: Jong Weon Lee. Email:
Computer Systems Science and Engineering 2023, 47(1), 515-536. https://doi.org/10.32604/csse.2023.037992
Received 23 November 2022; Accepted 03 March 2023; Issue published 26 May 2023
 View Full Text
 Download PDF
Abstract
A country’s economy heavily depends on agricultural development. However, due to several plant diseases, crop growth rate and quality are highly suffered. Accurate identification of these diseases via a manual procedure is very challenging and time-consuming because of the deficiency of domain experts and low-contrast information. Therefore, the agricultural management system is searching for an automatic early disease detection technique. To this end, an efficient and lightweight Deep Learning (DL)-based framework (E-GreenNet) is proposed to overcome these problems and precisely classify the various diseases. In the end-to-end architecture, a MobileNetV3Small model is utilized as a backbone that generates refined, discriminative, and prominent features. Moreover, the proposed model is trained over the PlantVillage (PV), Data Repository of Leaf Images (DRLI), and a new Plant Composite (PC) dataset individually, and later on test samples, its actual performance is evaluated. After extensive experimental analysis, the proposed model obtained 1.00%, 0.96% and 0.99% accuracies on all three included datasets. Moreover, the proposed method achieves better inference speed when compared with other State-Of-The-Art (SOTA) approaches. In addition, a comparative analysis is conducted where the proposed strategy shows tremendous discriminative scores as compared to the various pre-trained models and other Machine Learning (ML) and DL methods.Keywords
Decades ago, agriculture was integral to the domestication of today’s primary food crops and livestock. A major global challenge is food insecurity, caused by plant diseases [1]. It has been found that plant diseases cause crop damage and significantly reduce yields, resulting in food shortages [2]. As the food and agriculture organization estimates [3,4], plant insects and illnesses impact up to 40% of the damage in agricultural productivity around the world. There are serious repercussions that might result from this, such as the starving of millions of people and serious damage to the agriculture industry. Additionally, smallholder farmers, where the primary process of maintenance is dependent on agriculture, offer more than 80% of the cultivated output in developing nations. A large portion of the world’s poor, about 50%, live in smallholder households which are particularly susceptible to interruptions in food supplies caused by pathogens [5]. In addition to increasing food production, new technologies for detecting plant diseases can result in gains in the form of increased profits.
It is important to monitor large-scale agricultural production closely and limit the spread of illnesses to undesirable products to efficiently manage it. Diseases in plants are most commonly caused by pests, microbes, viruses, algae, and fungi. Specific plant diseases have no visible indicators, so sophisticated analytical techniques are employed [6,7]. A pathologist can identify the illness under an optical microscope by examining the infected leaves of plants, however, not all infected plants exhibit symptoms. The ability to diagnose plant diseases accurately requires keen observational skills and subject-concern knowledge. The process of manually identifying plant diseases takes time and depends on the accessibility of skilled plant pathologists. In addition, ongoing plant monitoring is necessary when dealing with large farms, which is quite expensive. Because of the enormous diversity of plants and changes in warning signs over time caused by climatic changes, even a skilled pathologist may take a long time to accurately detect certain illnesses. In order to prevent the wasteful expenditure of resources and money, accurate and early detection of plant diseases is essential.
As a result of technological advancements in recent years, image-based automated process control systems have provided agronomists with valuable information about diseased plants [8]. The use of automatic detection systems improves crop quality by allowing farmers to identify diseases earlier, treat them promptly, and reduce disease incidence. The size and color differences of the affected area are quantified using an image processing technique. In the beginning, ML models were suggested as a way to identify and classify plant diseases. There are several techniques that can be employed to diagnose crop plant diseases early and precisely, including Support Vector Machines (SVMs) [9], Decision Trees (DTs) [10], Random Forests (RFs) [11], and K-Nearest Neighbors (KNNs). As a result of extensive preprocessing and dependence on human expertise to extract and select appropriate features needed to conduct the classification [12], ML-based approaches are easier to implement and do not require a large amount of training data but are sluggish as a result. Additionally, having a limited feature set will reduce the identification performance while having a large feature set will increase processing complexity. Since each method depends on the accuracy and representation of the derived characteristics, each method is vulnerable to mistakes when dealing with enormous amounts of data. Therefore, ML approaches for identifying plant diseases are limited in their accuracy.
In agriculture, DL-based technologies are widely used for plant disease classification [13,14]. By automatically synthesizing discriminative features from input samples, these methods eliminate laborious image preprocessing. An effective DL model for detecting early plant leaf diseases is the Convolutional Neural Network (CNN). In the latest research, CNN has been extensively utilized in the diagnosis and classification of crop plants [15–17]. This method has demonstrated encouraging results in crop-related classification tasks because of its efficient feature representation. Existing plant disease classification techniques make extensive use of the developed CNN architectures in computer vision, including AlexNet [18], GoogLeNet [5], VGGNet [19], ResNet [20], and EfficientNet [21,22]. Custom network topologies have been developed in several types of research [23,21] to address real-world circumstances including occlusion, low light, and various climatic settings. Plant diseases can now be located and classified using DL-based object identification algorithms [24,25]. When the natural surroundings are very complicated, these techniques are less effective at pinpointing the precise location and type of illness. Although recent success has been achieved with DL architectures, generalization robustness and identification accuracy of DL architectures for agricultural plant disease classification still need to be improved to easily run on the edge devices such as Jetson Nano and smartphone, etc. Therefore, in this article different DL models are investigated, and finally, a lightweight CNN method for efficient plant disease classification is proposed. The main contributions of this study are as follows:
• Many plant diseases remain difficult to identify because of their varied sizes, shapes, colors, and locations. Several small and dense infected spots on a single leaf can also complicate the identification of plant leaf diseases, due to background noise, intra-class variations, and several small and dense infected spots present at different stages of development. A variation in lighting conditions and brightness during the picture acquisition procedure of leaves also contributes to inadequate detection results of Computer-Aided Design (CAD) solutions. As a result of this work, E-GreenNet is proposed which can detect crop disease and perform accurate classification.
• The end-to-end DL model (E-GreenNet) intelligently and efficiently evaluates deep discriminative features from a given infected plant leaf and classifies them accordingly. A comprehensive experimental study was conducted on the proposed model to analyze the training time, size, and computation revealing that it is suitable for resource-constraint devices.
• To validate the performance of the proposed model this study utilized three challenging datasets including Plant Village (PV), Data Repository of Leaf Images (DRLI), and a new Plant Composite (PC) dataset and the experimental results outperformed when compared with SOTA. Despite blurring, noise, and varying colors, sizes, and positions of the infected regions, the proposed E-GreenNet can effectively classify plant diseases under varying challenging conditions.
The remainder of this paper is organized as follows. An overview of relevant literature is presented in Section 2, a description of the methodology is presented in Section 3, and the empirical results are presented in Section 4. Lastly, Section 5 summarizes the findings and suggests future directions.
The purpose of this study is to automatically identify and categorize various plant diseases comprehensively. ML-based techniques and DL-based strategies are the two main categories of categorizing infected plant leaf regions in the current literature. Authors in [26] suggested classifying plant diseases using ML. Local Binary Pattern (LBP), Gray Level Co-Occurrence Matrix (GLCM), Shift-Invariant Feature Transform (SIFT), and Gabor feature extraction techniques were employed for the input images. An ML classifier SVM, a KNN, an Artificial Neural Network (ANN), and an RF are used to succeed in categorizing plant diseases. Based on Gabor features, Kaur’s study achieves the highest classification accuracy at 90.23%, but performance still requires improvement. According to [27], a method was developed to identify and categorize various types of plant diseases. By using the 14 color spaces, the authors extracted the 172 critical points from the suspected samples. Using the analyzed key points, the SVM was trained. This method [27] shows an enhanced accuracy of 94.68% when categorizing plant leaf-diseased regions; however, this method is not robust when dealing with samples that have significant distortions. According to [28], a strategy was presented for locating and classifying weed-based diseases. Initially, the noise was eliminated from the questionable samples using the morphological opening and closing operation. To extract the important details from the augmented image, a bespoke model called k-FLBPCM was introduced: a filtered LBP method with contour masks and coefficients. SVM training was performed using the computed key points in order to categorize the sick leaf regions.
Compared with previous methods, the method [28] achieves 98.63% accuracy in recognizing plant diseases; however, it is not reliable in the presence of perspective distortions. Using a technique developed by [29], the damaged areas of various plant leaves could be detected and identified. In the beginning, Directional Local Quinary Patterns (DLQPs) were used to extract features as input images. Through the use of the estimated key points, the SVM classifier was trained to categorize agricultural leaf diseases. According to [29], this method has an accuracy of 96.50%. Further improving detection performance can be achieved by detecting suspected photos based on color and shape. As a result of their research, Authors in [30] developed a different method for identifying and categorizing illnesses in tea plants. The input image was initially divided into a number of blocks using the Simple Linear Iterative Cluster (SLIC), from which the Harris method was utilized to compute the features. Convex hulls were used to find fuzzy salient areas, and GLCM was used to calculate the feature vector. As a final step, the SVM classifier was trained using the key points collected. With an accuracy rate of 98.50%, the framework [30] shows improved crop leaf disease categorization; nonetheless, this method is economically challenging. Several agricultural diseases can be located and categorized using the approach given by [31]. First, a sample was used to segment the suspected image using the GrabCut method. Feature calculations were performed on the segmented image using the Hue, Saturation, and Value (HSV) transform. The SVM was then trained using the key points retrieved earlier.
Plant leaf-damaged regions are successfully categorized with 95% accuracy by [31], Although, its detection accuracy declines over noisy samples. Another ML-based method was utilized by [32] to categorize various crop diseases. Using Histogram Equalization (HE), input samples were first preprocessed to provide more visual information. Using K-means clustering, the image segmentation process was carried out next. In order to compute the key points, the GLCM descriptor and the LBP descriptor were employed. To categorize different crop leaf-damaged regions, the computed features were then fed into the SVM algorithm. Despite using a dataset with a limited number of samples, [32] found improved accuracy in crop leaf diseased region classification with 84.6% accuracy. As presented by [11], a method for classifying crop leaf anomalies has been developed. A Histogram of Oriented Gradient (HOG) method was used for the key point calculation in the RF classifier training. With an accuracy of 70.14%, [11] describes an approach to categorize crop leaf diseases more accurately; however, performance still needs to be improved. The problem of classifying anomalies in turmeric leaves was solved by [33]. The samples were first preprocessed in order to improve their visual presentation. After upgrading the samples, the K-means clustering method was used to group them regionally. In the next step, the GLCM method was used to extract the key points. Using the derived characteristics, SVM classifiers were used to categorize sick regions.
Method [33] performs poorly for images with significant brightness variations, but it shows improved classification accuracy of 91%. To identify and classify crop diseases, [21] proposed the EfficientNet framework. A performance evaluation was conducted using both the original dataset and the supplemented dataset. Reference [21] developed a method that achieves 99.97% accuracy in classifying plant diseases, although it requires increased computing power. According to [34], DL can be used to automate the classification of plant diseases using a Residual Teacher/Student (ResTS) model. A CNN model was used by the ResTS technique to compute the deep features of an input sample. A decoder and two classifiers were then used to classify different plant leaf abnormalities. Despite an F1-score of 99.10% for [34] methods, they were unable to demonstrate strong performance under extreme lighting conditions. To localize and categorize grape plant diseases, [35] developed Region-based CNNs (RCNNs). An RCNN classifier was used to classify the deep features after they were computed using ResNet18. In spite of the 99.93% accuracy rate achieved, their method performs poorly in real-world situations.
As part of DL-based frameworks for predicting plant diseases from input data, [36] introduced VGG, ResNet, and DenseNet. The DenseNet framework achieved the best accuracy of 98.27%. In their study, [37] proposed using Few-Shot Learning (FSL) to recognize and classify plant leaf damage. The deep features were computed using the Inception V3 model after the input image had been preprocessed. The feature calculation was followed by the training of a multiclass SVM classifier. It was found that the classification of the various plant leaf diseases achieved an accuracy of 91.4%; however, the results were derived from a modest-size dataset. An alternative CNN-based method for identifying and categorizing tomato crop diseases has been presented [17]. The authors, categorize and compute deep features from suspected images by using three Convolution Layers (CLs) and max-pooling layers. In spite of the model over-fitting issue, this framework has a strong ability to recognize tomato diseases. It was reported by [20] that several illnesses of maize plants can be identified and located by using a simple method. Using the ResNet50 method, the characteristics of the samples were computed and categorized. As a result of the limited power, execution, and space of mobile phones, [20] developed a low-cost method for categorizing agricultural illnesses with 97% accuracy.
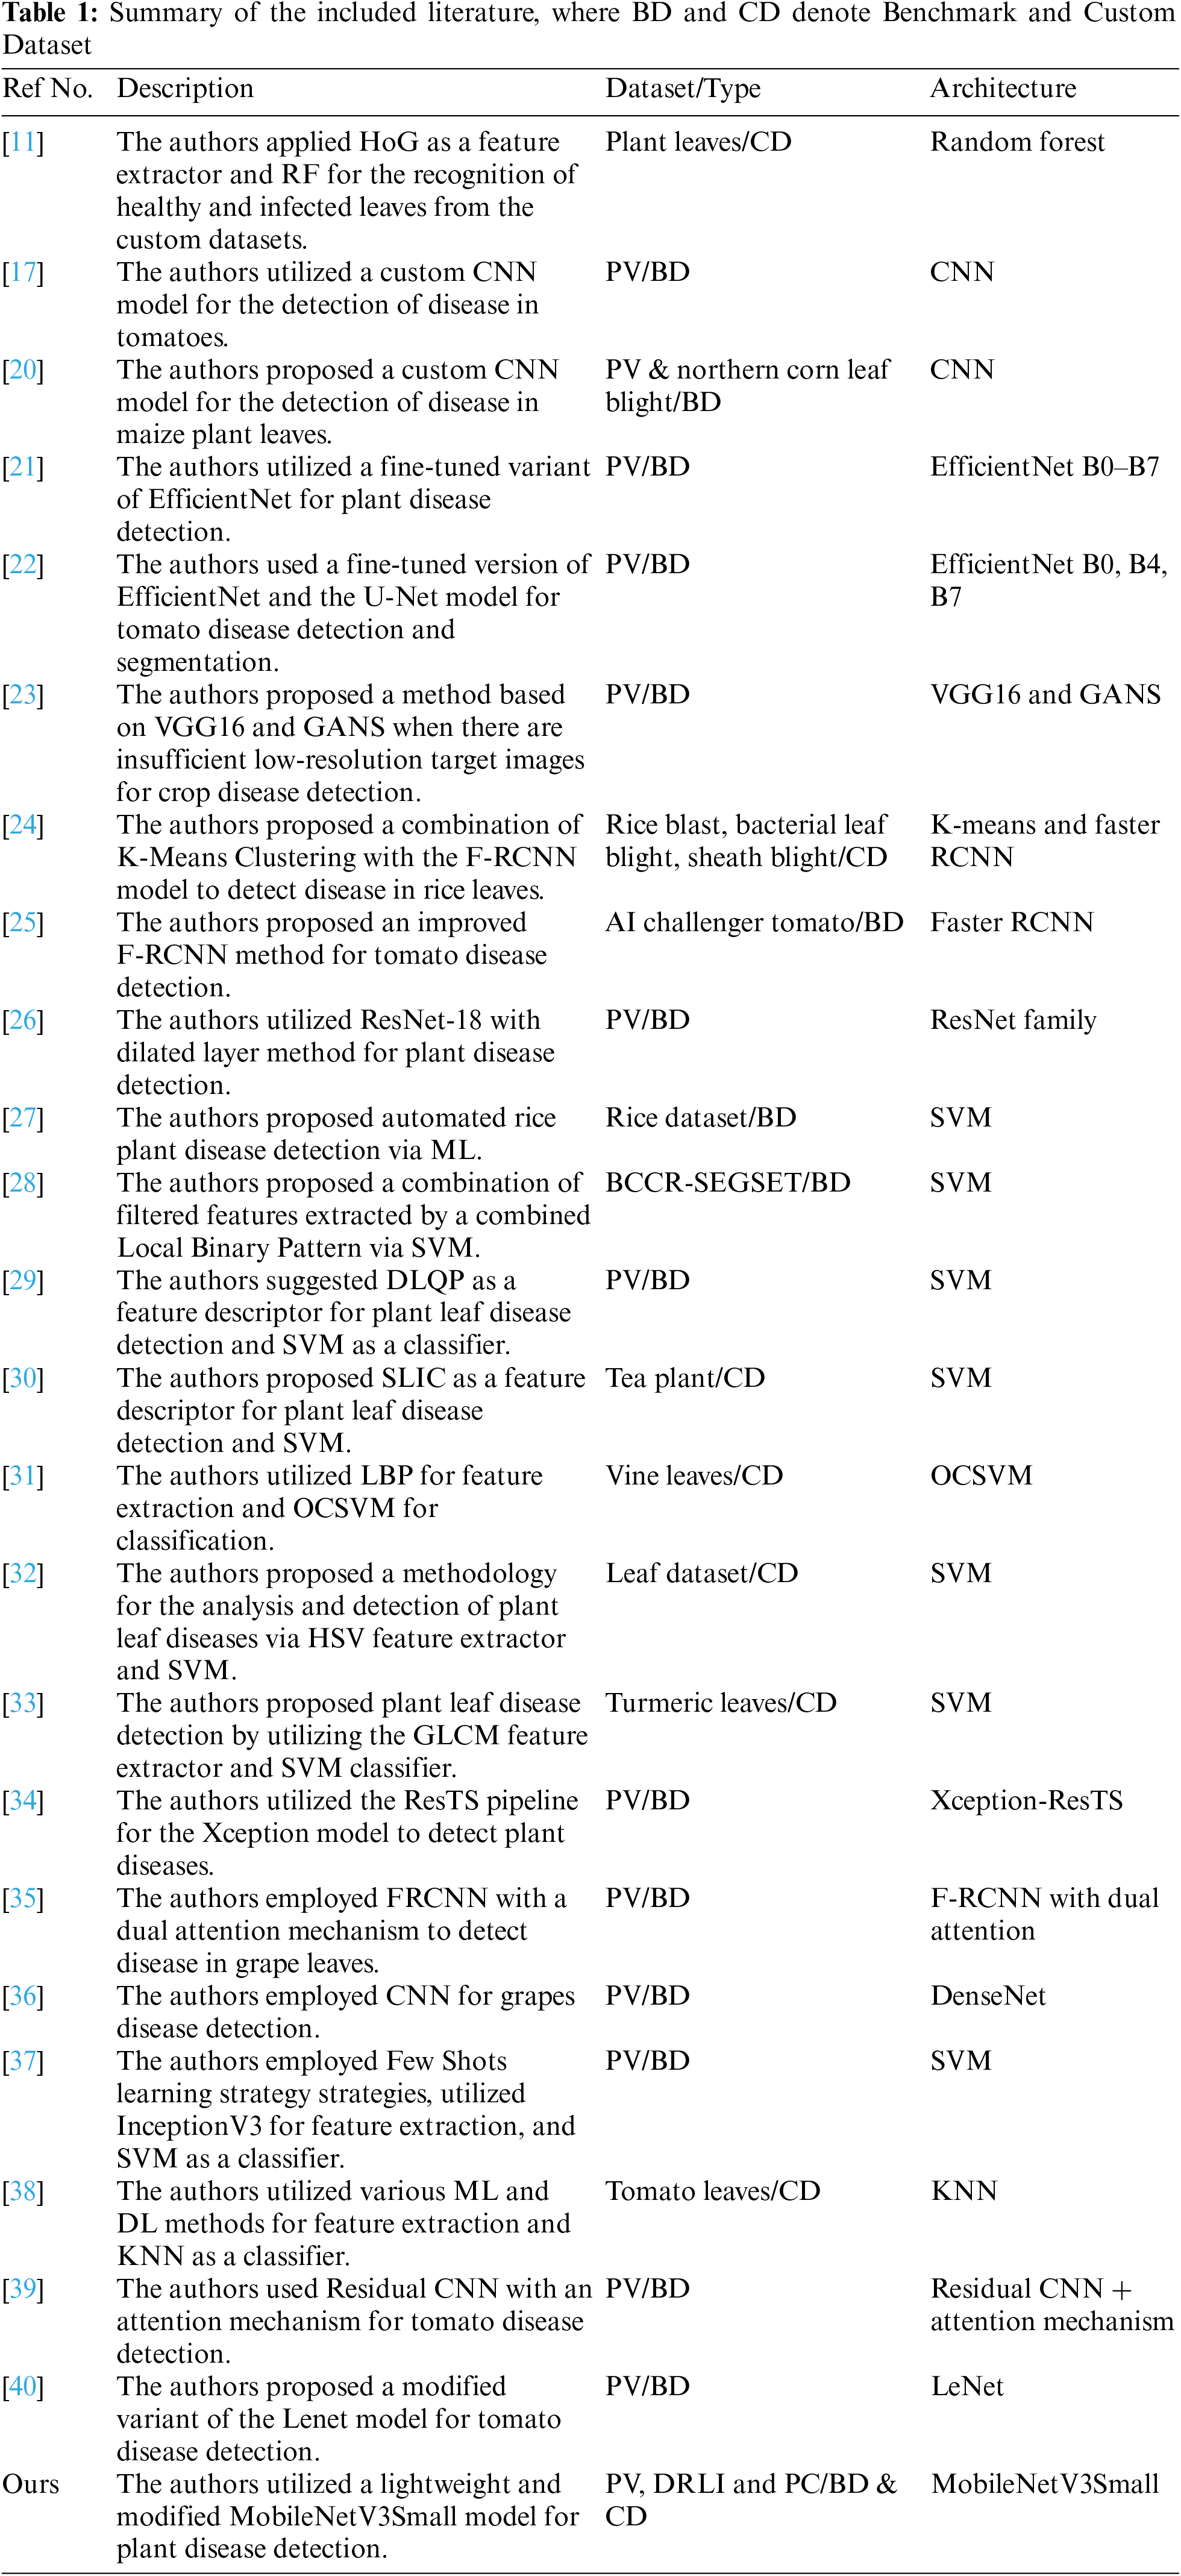
According to [25], transfer learning was used again to classify various tomato diseases. Instead of using the VGG16 network to compute image features, the Faster-RCNN framework uses a deep residual model. K-means clustering was also used to group the identified regions. With an mAP score of 98.54%, the work [25] shows an improved classification of tomato crop leaf disease regions without requiring heavy processing. Moreover, authors in [38] provided a methodology for locating and classifying tomato leaf-affected locations. AlexNet was used to compute the deep features in the input image, which were then used to train the KNN classifier. This study categorizes data with an accuracy of 76.1%, however, the KNN technique requires a lot of time and effort. Through the concept of transfer learning, [39] identified the tomato crops affected leaf regions. To extract critical details from questionable photos, [22] used a ResNet network. Once the typical set of image features had been extracted, a CNN-based classifier was used to classify the images. In the [39] study, crop leaf diseased regions were classified with 98% accuracy; however, the method is economically inefficient. For the classification of crop diseases, [40] developed a DL method. After rescaling the suspected photos, further processing was performed. A representative set of key points was then extracted from the photos using the LeNet technique. It provides a computationally efficient method for classifying tomato crop diseases, although its accuracy is poor for images with noise. The included literature is summarized and then listed in Table 1. The summary provides the description of the article, the benchmark or custom dataset used along with the method used. It is evident from the included literature that previously only one few categories of diseases were targeted while in the proposed method authors have included three datasets comprising 60 categories of crop diseases.
ML-based and DL-based methods had been used to classify plant leaf diseases. There is however room for improvement when it comes to processing times and categorizing various sick plant leaf regions. Currently, either a lot of preprocessing steps are required, or distorted samples have trouble working well. Furthermore, the strategies perform no better with unseen data because of overfitting issues. In order to prevent crop damage and to allow farmers to take prompt preventative measures, it is necessary to correctly identify and categorize plant leaf diseases.
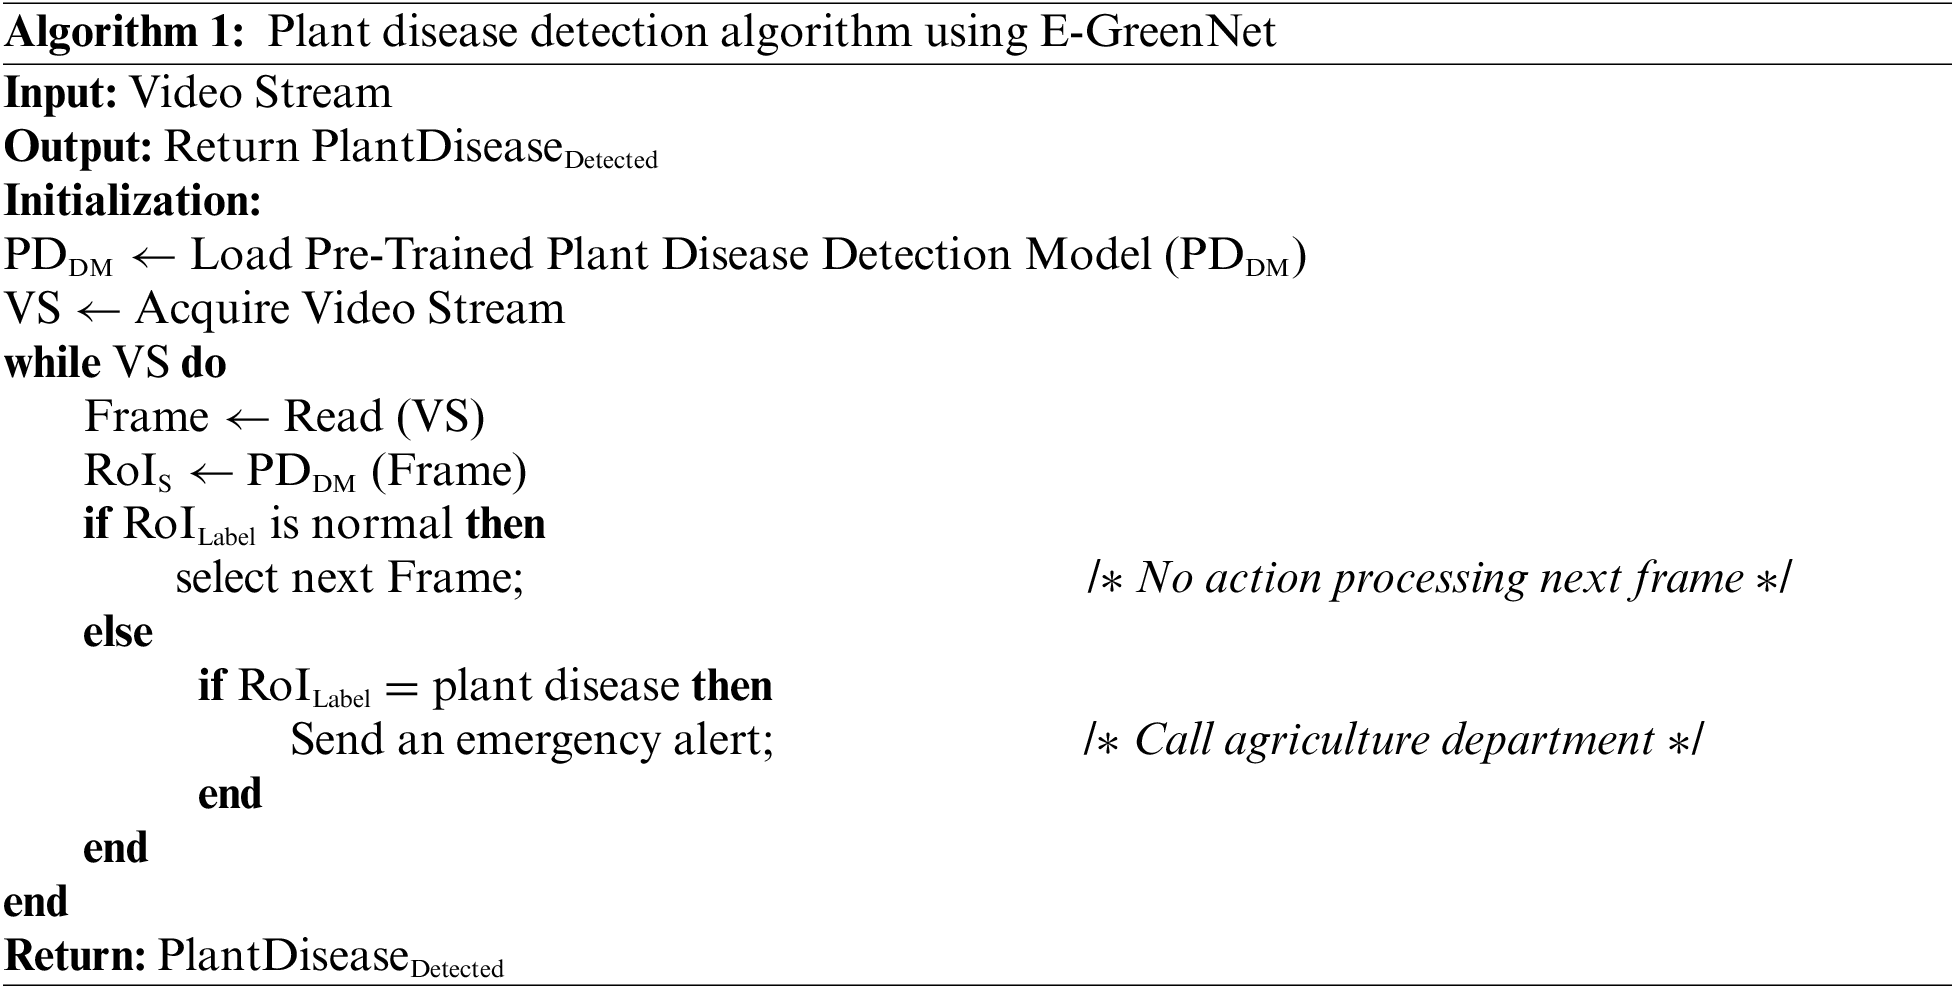
The proposed framework involves three main steps. Initially, the collected plant leaf images are preprocessed. Next, images of the diverse classes are passed to an efficient CNN model, which effectively detects and classifies the plant into the respective class. Eventually, the model takes a decision based on the predicted label for the given input image. Regarding the real-world application of the developed system, if the predicted label is a disease on a plant, an alert is generated to the nearest agriculture department to take timely action. A pictorial representation of the proposed framework is presented in Fig. 1; the step-wise procedure is presented in Algo. 1. In the initialization step of Algo. 1, the model is fed with a Video Stream (VS) and loads a pre-trained Plant Disease Detection Model (PDDM). When the frame is read, the Regions of Interest (RoIS) are extracted and checked for the presence of disease. If it is a normal image, the next frame is selected; else, if the disease is detected in the frame, an alert is generated and sent to the agriculture department and responsible emergency teams. Furthermore, in the following sections, each step is briefly discussed.
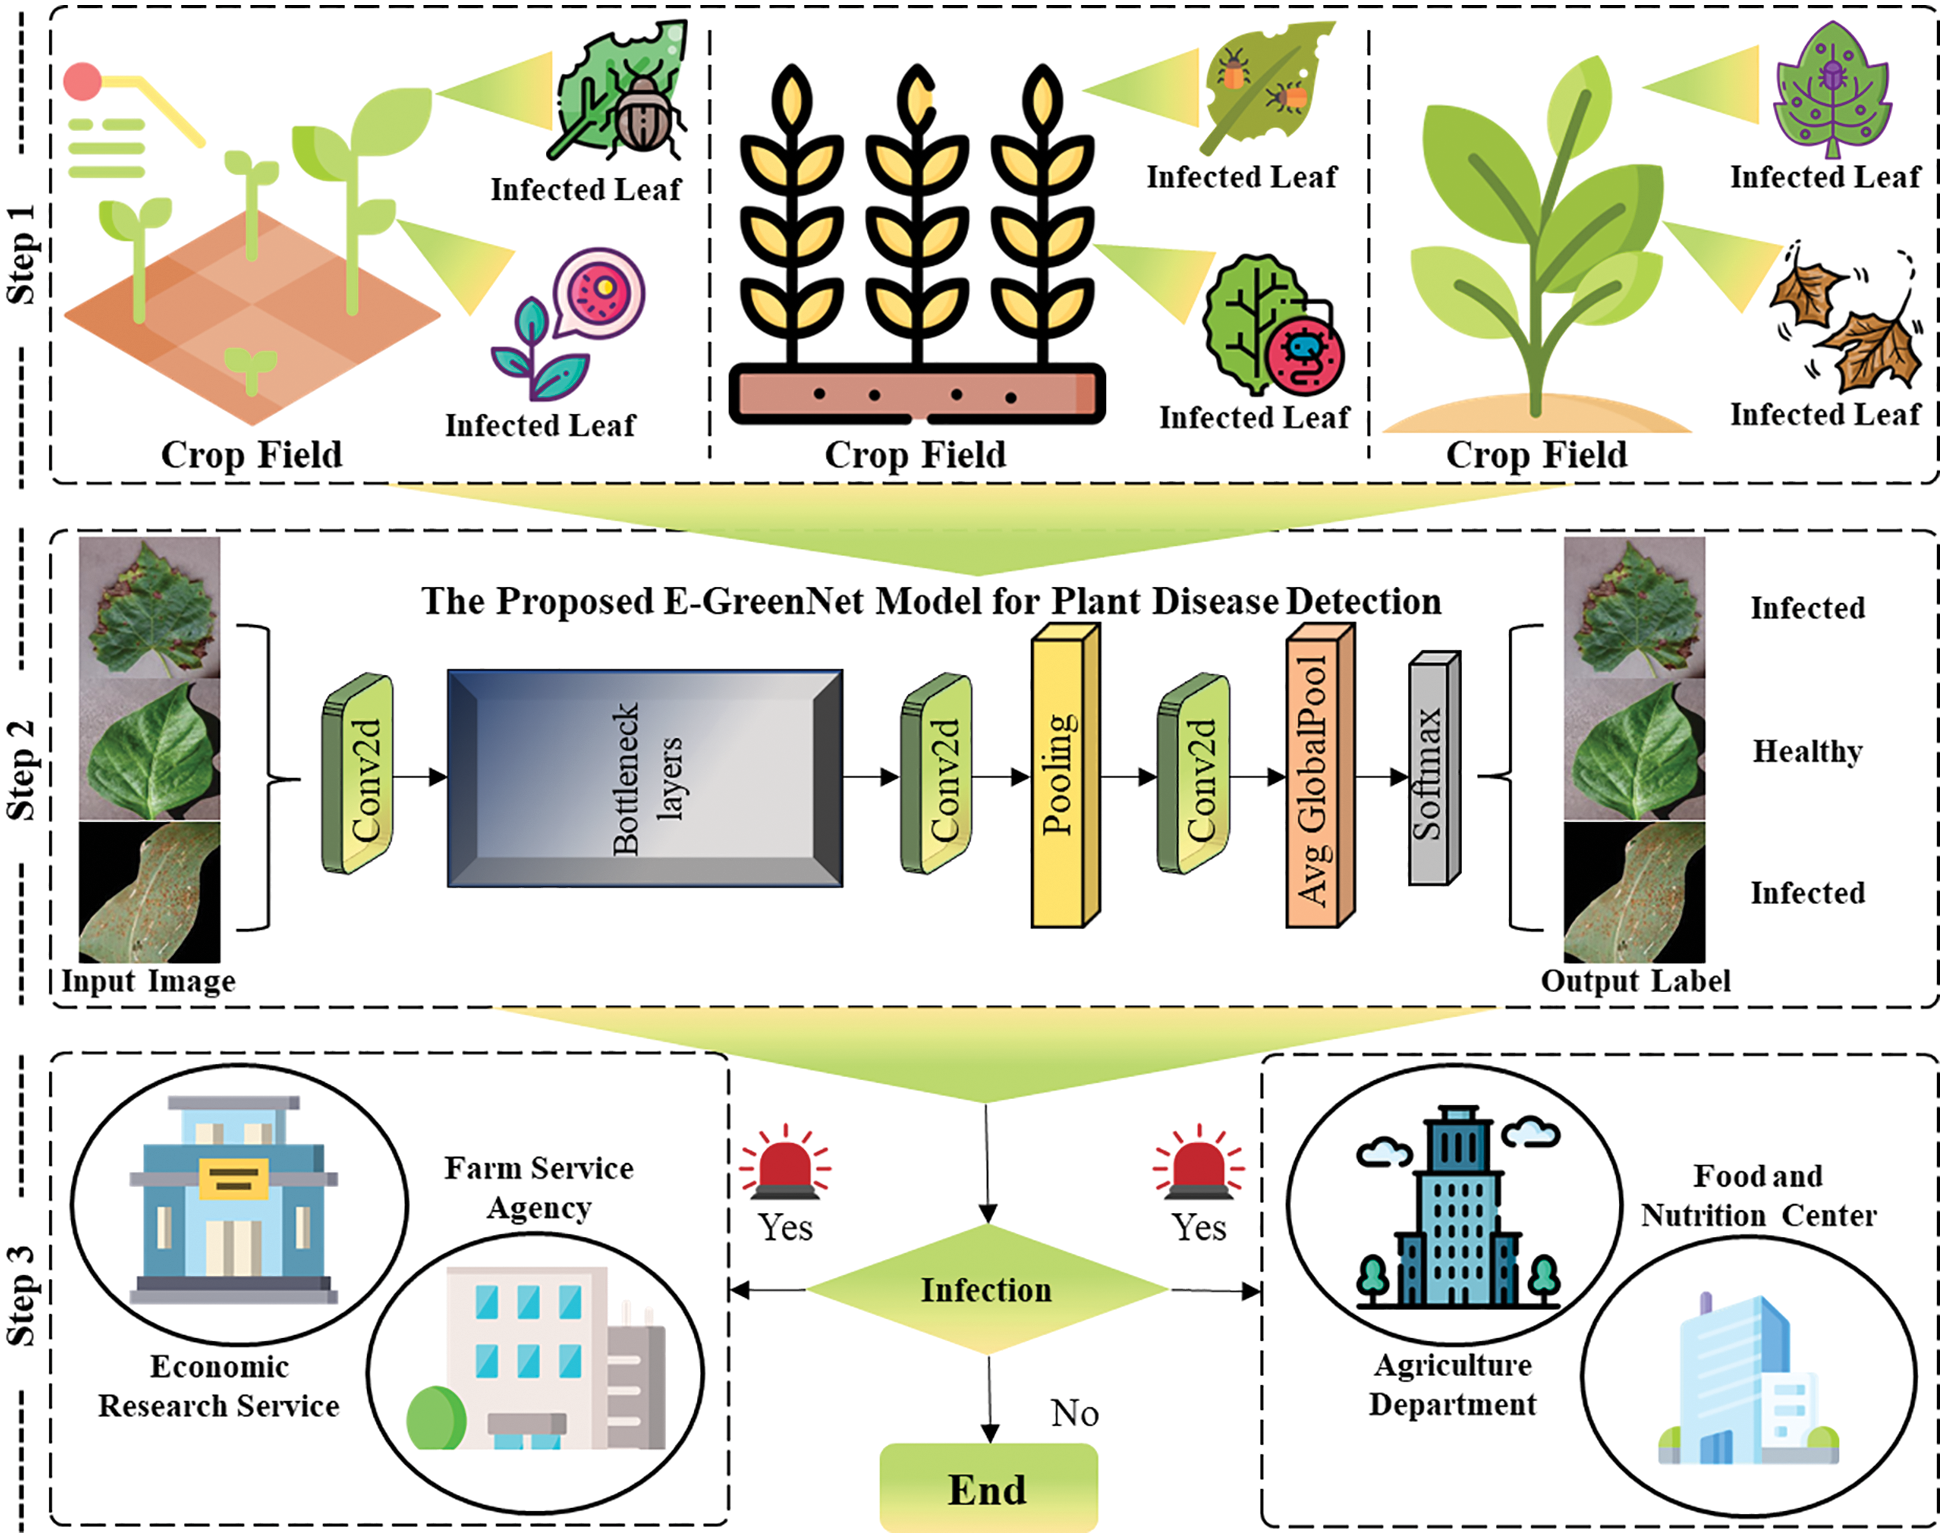
Figure 1: Proposed E-GreenNet framework for plant disease detection and classification. Initially, data is acquired from PV, DRLI and PC datasets, followed by plant disease detection using the proposed technique, and finally, in case of disease detection, alarm generation to the farm service agency, agriculture department, among others
In recent years, CNN networks for mobile devices have developed from 2017 to 2019, there are three different MobileNet architecture that was continually enhanced. When developing MobileNetV1 [9], the conventional VGG architecture was referred to and depth-wise discrete convolutions were included. Based on that, MobileNetV2 [10,11] is released a year later and has an inverted residual and a linear bottleneck. By removing costly layers and switching to the h-swish non-linearity function as a substitute for ReLU in the middle of 2019, MobileNetV3 is further enhanced with the aid of Network Architecture Search (NAS) and NetAdapt network searching for architectural optimization, which increases both its efficiency and relative accuracy.
Depth-wise Separable Convolution: A novel computing technique called depth-wise separable convolution is being developed. A lot of similarities can be found against conventional convolution. In contrast to classic convolutions, the depth-wise separable convolution performs convolutional calculations for each layer in two stages. The first stage of depth-wise convolution involves a single convolutional filter for every single input channel. The next stage of depth-wise convolution is to convolute the output channels into pointwise channels. Despite some compromises in the accuracy, the depth-wise separable convolution improves calculation speed by minimizing the extent of computation. Convolution with depth-wise separable parameters is a key procedure for several effective models, including MobileNetV1-V3. A pictorial representation is presented in Fig. 2.
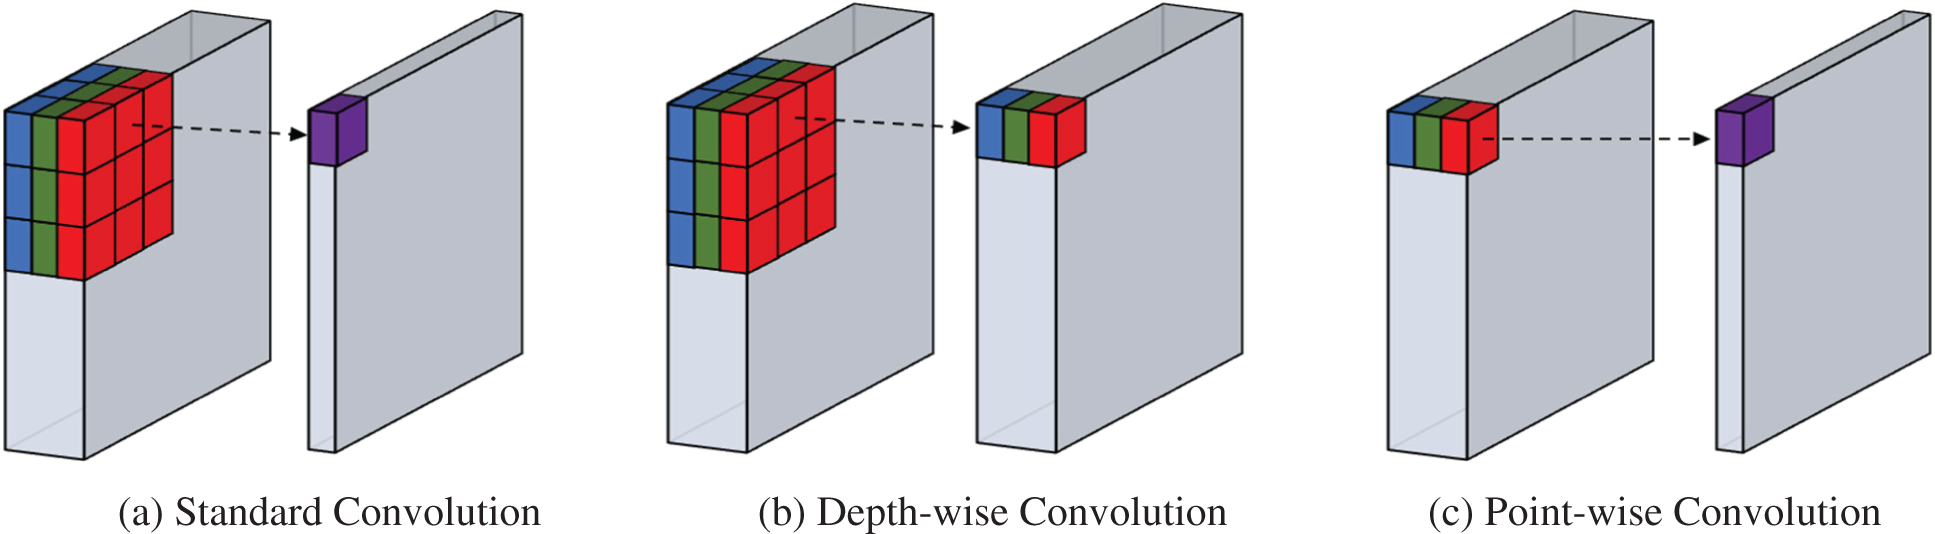
Figure 2: A pictorial representation of standard convolution along depth-wise convolution and point-wise convolution
Linear Bottleneck: The MobileNetV2 proposes linear bottlenecks to decrease the dimensionality of the input so that features can be extracted from the high-dimensional space without losing considerable information. The linear bottleneck refers to a CL with the linear activation function combined with a filter layer. MobileNetV2 inserts linear bottleneck layers0 into convolutional blocks as a substitute for traditional ReLU function transformations because they include nonlinearity and potential for information loss. To understand the concept a pictorial representation is depicted in Fig. 3.
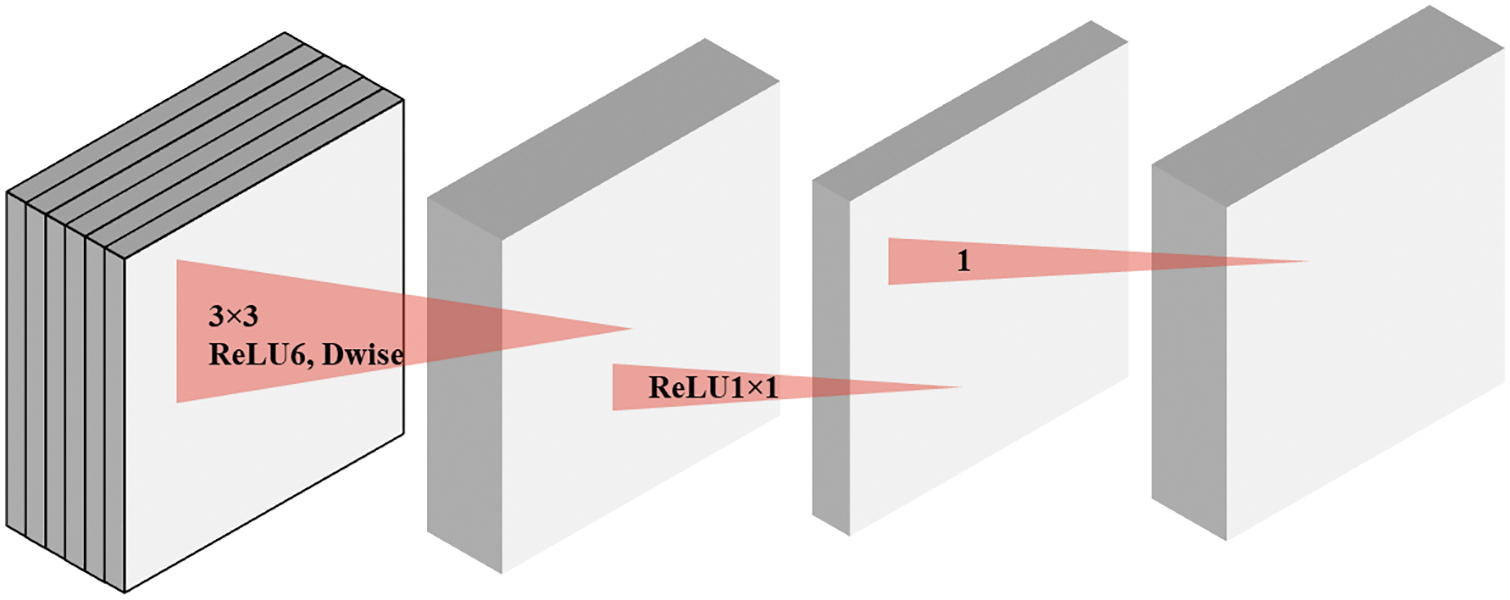
Figure 3: A pictorial representation of separable convolution with linear bottleneck
Inverted Residual: The bottleneck layers substitute the ReLU layers as a better, more effective method for extracting all data information. As part of the bottleneck block, an expansion layer is also present. The mobile network is also able to better propagate gradients between layers via shortcuts directly between bottlenecks, which prevents gradient loss and explosion between layers. Despite significantly reducing memory costs, inverted residual blocks function almost as well as residual blocks, to further identify the key difference between residual and inverted residual blocks a pictorial representation is depicted in Fig. 4.
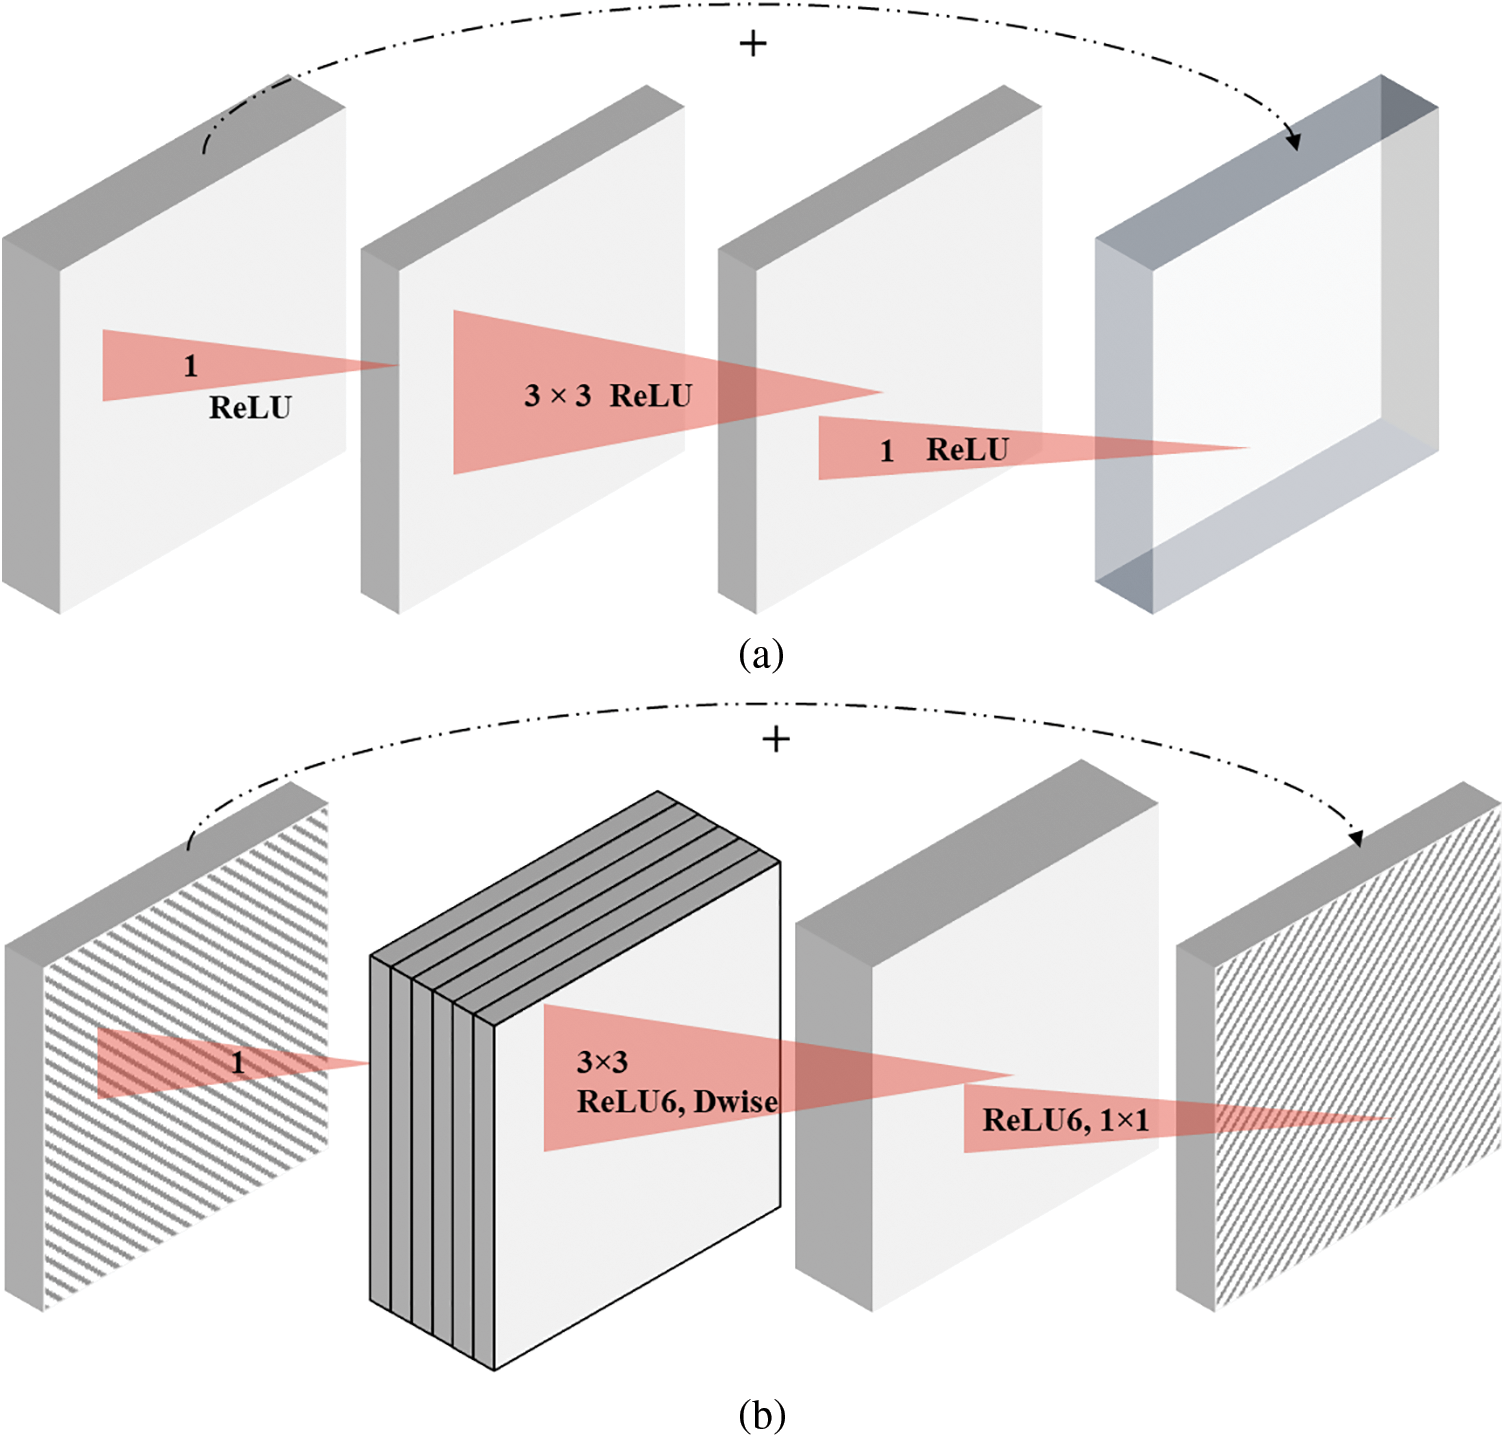
Figure 4: A pictorial representation of (a) residual block and (b) inverted residual block
Network Architecture Search (NAS): To establish the optimal architecture for MobileNetV3 on a constrained hardware platform, reinforcement learning, and Recurrent Neural Network (RNN) is applied. By using reinforcement learning to search efficiently in multiple hierarchical search spaces, it approaches the best structure for a neural network model for a specific task. As an example, MobileNetV3’s expansion layer has been redesigned based on MobileNetV2’s original design.
Swish Function: There is a new and distinct activation function that is employed to replace the ReLU function in order to achieve higher levels of accuracy named Swish. This function is defined as:
Due to the complex nature of the sigmoid function in the swish formula, it may require a lot of computational processing power on mobile edge devices. A solution to this issue is MobileNetV3, which utilizes ReLU6 functions to approximate sigmoid functions in Swish. This is known as h-Swish, which is defined as:
This section investigates the assessment measures, evaluation metrics, dataset, and graphical outcomes. The experimental setup and performance metrics are first described, followed by a discussion of the datasets, and the evaluation of the results. All the models, including the proposed E-GreenNet, were trained using a total of 10 epochs with a low learning rate to ensure that the model retained most of the previously learned knowledge. The pre-trained model progressively updates the learning parameters for optimum performance on the intended dataset. Based on the results, each model is retrained with its default input size, with a batch size of 32, the Adam optimizer was equipped with a learning rate and momentum of 1e-4 and 0.9, respectively. The experiments were conducted on an NVIDIA RTX 3070 Super Graphical Processing Unit (GPU) with 32 GB of onboard memory, a Keras DL framework, and TensorFlow for the back end. As shown in the following equations, the performance of the proposed model was assessed by utilizing multiple evaluation metrics, including accuracy, precision, recall, and F1-score.
In the classification problem, accuracy is defined as the number of correct predictions produced by the model over all the types of predictions made,
where TP is True Positive, TN is True Negative, FP is False Positive, and FN is False Negative.
Precision is a metric that indicates the percentage of the dataset labeled as plant disease truly contains disease. The predicted positives (images predicted to be diseases are TP and FP), and the photos with a disease scenario are TP.
A Recall is a metric that shows the percentage of observations in a dataset that were predicted as having plant disease by the model. The real positives and plant disease images predicted by the model are TP.
The F1-score measures the precision and recall harmonically.
Cross-Entropy loss is typically employed after Softmax activation, that is why it is also known as Softmax loss. It is evident from the literature that for classification tasks, the CE loss converges more quickly than the Mean Square Error (MSE) loss. As a result, a Softmax and CE loss combination is frequently employed to separate one class from many classes. The Categorical Cross-Entropy loss calculates the performance of the model and outputs a probability of 0 and 1.
ti is the ground truth, si is the ith element of the score vector, which is the output of the last layer of the CNN for each class i,
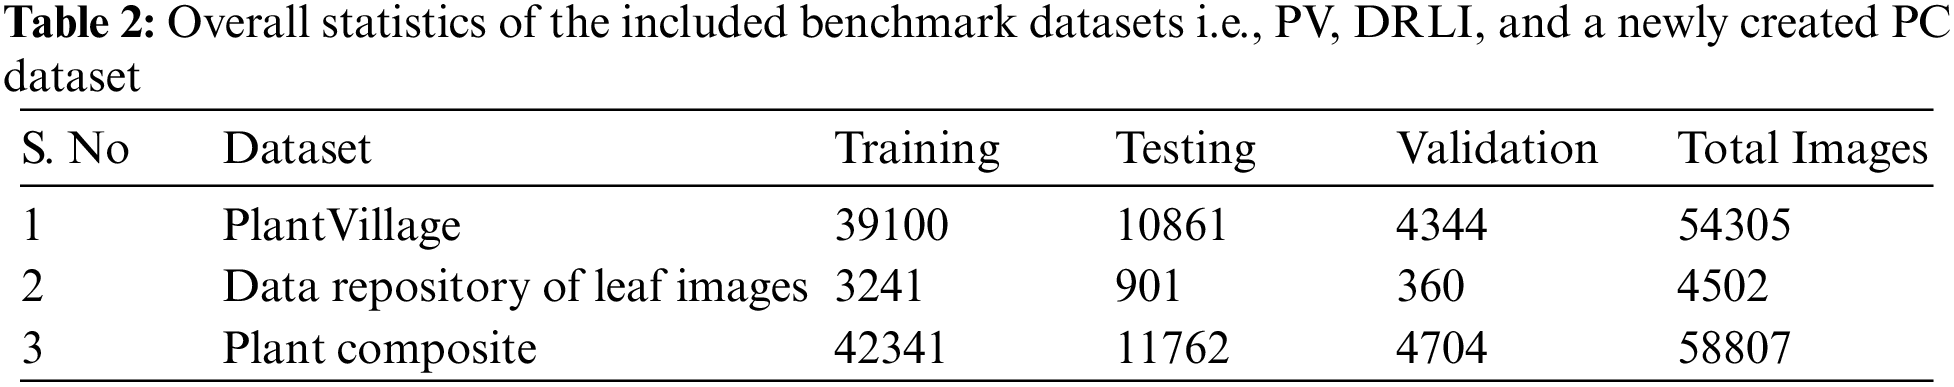
To evaluate the performance of the proposed E-GreenNet model, authors employed two benchmark datasets titled PV and the DRLI dataset. Additionally, to further check the robustness of the proposed model a new dataset called the Plant Composite (PC) dataset was acquired by integrating both datasets. The overall statistics of the included datasets are provided in Table 2.
The authors evaluated the accuracy of the proposed method by using the PV dataset [5]. In a number of historical performance evaluation approaches, the PV dataset has been extensively investigated for its sizeable, public, and free availability of the data on crop leaf disease classification. To test the classification accuracy of the proposed strategy, authors performed numerous tests on this dataset, which includes photos of plants with various types of illnesses. In more detail, the PV dataset contains 54,303 images from 14 plant species and a total of 38 classes, of which 26 classes were derived from infected plants and 12 from healthy plants. Tomatoes, Strawberries, Grapes, and Oranges are all represented using images from the PV dataset. As well as exhibiting various distortions of image quality, such as noise, blurring, and variations of color, the employed dataset has samples that vary in size, color, and light. Thus, it presents diverse and challenging data for the detection and categorization of affected plant leaf regions.
4.2.2 Data Repository of Leaf Images Dataset
A plant’s interaction with its surroundings is intricate. It contributes a variety of substances that enhances the environment. Plants are also important in controlling greenhouse gases and climate change. Despite this, authors have exterminated them ruthlessly in the past. In addition to the loss of many species that once lived there, climate change has had a serious impact on the environment. Providing plants with time and space to recover and re-clothe the planet, plants are capable of recovering and re-clothing the planet with plants and species that are recently destroyed. This work contributes to the identification, detection, and diagnosis of plant diseases as a result. There are twelve plants chosen for this project: mango, arjun, guava, Alstonia Scholaris, Bael, Jamun, Jatropha, Pomegranate, Lemon, and Basil. The leaves of these plants have been photographed in healthy and infected states and divided into two modules. There have been two main categories in the entire collection of photographs: the healthy and the infected ones. The obtained photos were first categorized and tagged concerning the plants, which ranged from P0 to P11. Following this, the entire dataset was divided into 22 subject groups, numbered from 0000 to 0022. A healthy class is defined as 0000 to 0011, while an infected class is defined as 0012 to 0022. The dataset contains approximately 4503 photos totaling 2278 healthy leaves and 2225 sick leaves. Photos were captured from March through May 2019, the University of Shri Mata Vaishno Devi in Katra gathered all of the leaf pictures. In this process, photographs were taken in an enclosed space. Wireless technology was utilized throughout the entire acquisition process. The photos were taken with the Nikon D5300 camera, which is capable of taking a single JPEG photo in 0.58 s per frame, and a RAW + JPEG photo in 0.63 s per frame. An 18–55 mm lens was used with sRGB color representation, 24-bit depth, two resolution units, coupling with 1000 ISO, and no flash to take the photographs.
To check the robustness of the proposed E-GreenNet model, authors combined the publicly available datasets i.e., PV and Data Repository of Leaf Images to create a new and more diverse and challenging dataset. The plant composite contains a total of 58807 images which is 7.6% larger than PV and 92.3% larger than the data repository of leaf images. Making the new dataset more distinct and challenging due to the huge variety of plant species, as a result, the model training process is beyond meticulous. The resultant model generalization ability is enhanced, and reliability is increased for real-time plant disease detection scenarios. Here are a few examples from the Plant Composite dataset, shown in Fig. 5.
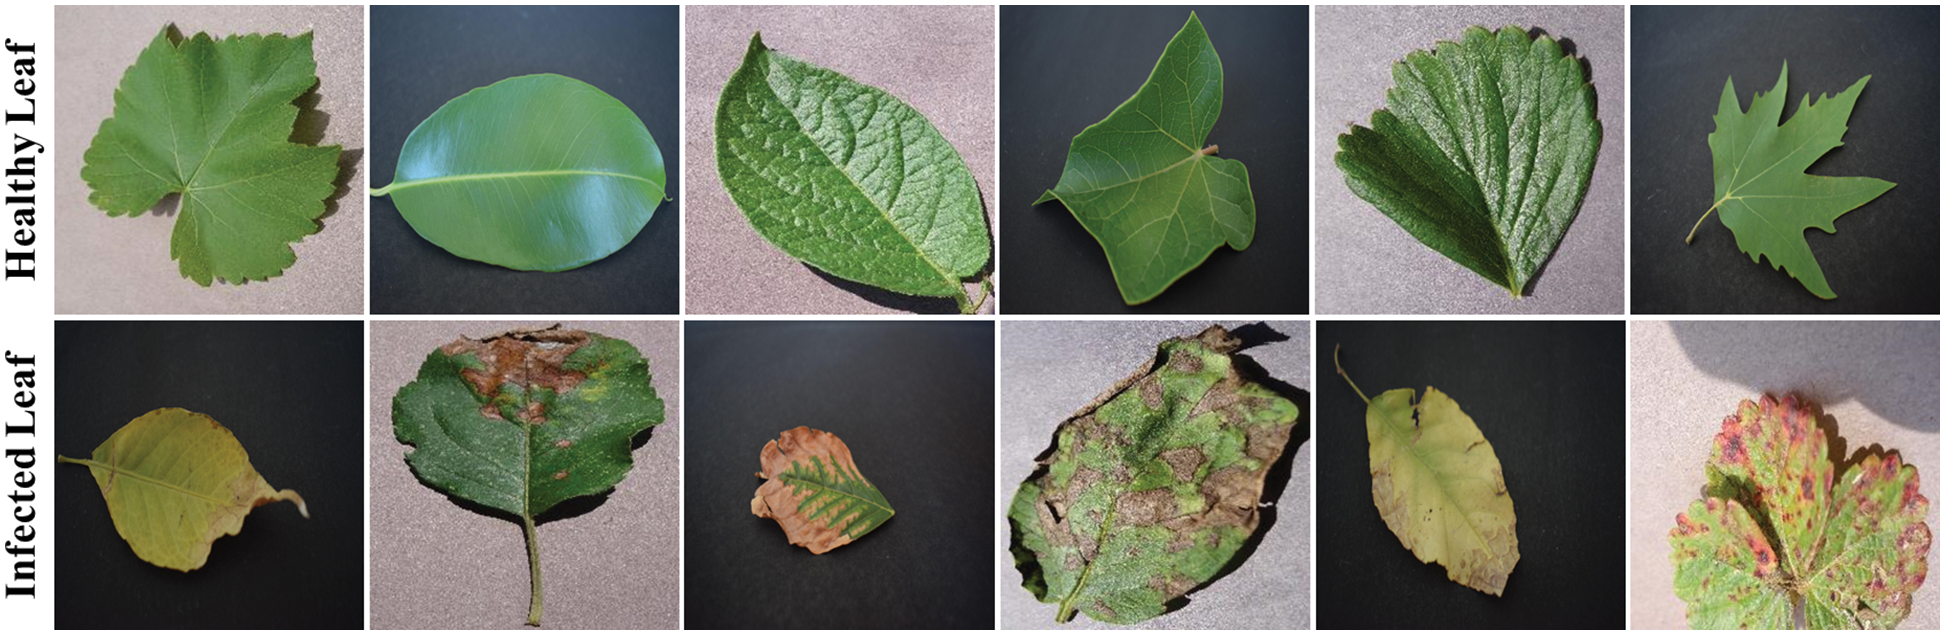
Figure 5: Sample images from the included benchmark datasets. The first row contains healthy plant leaves, while the second row has infected plant leaves. Each row includes six instances
4.3 Performance Comparison with SOTA
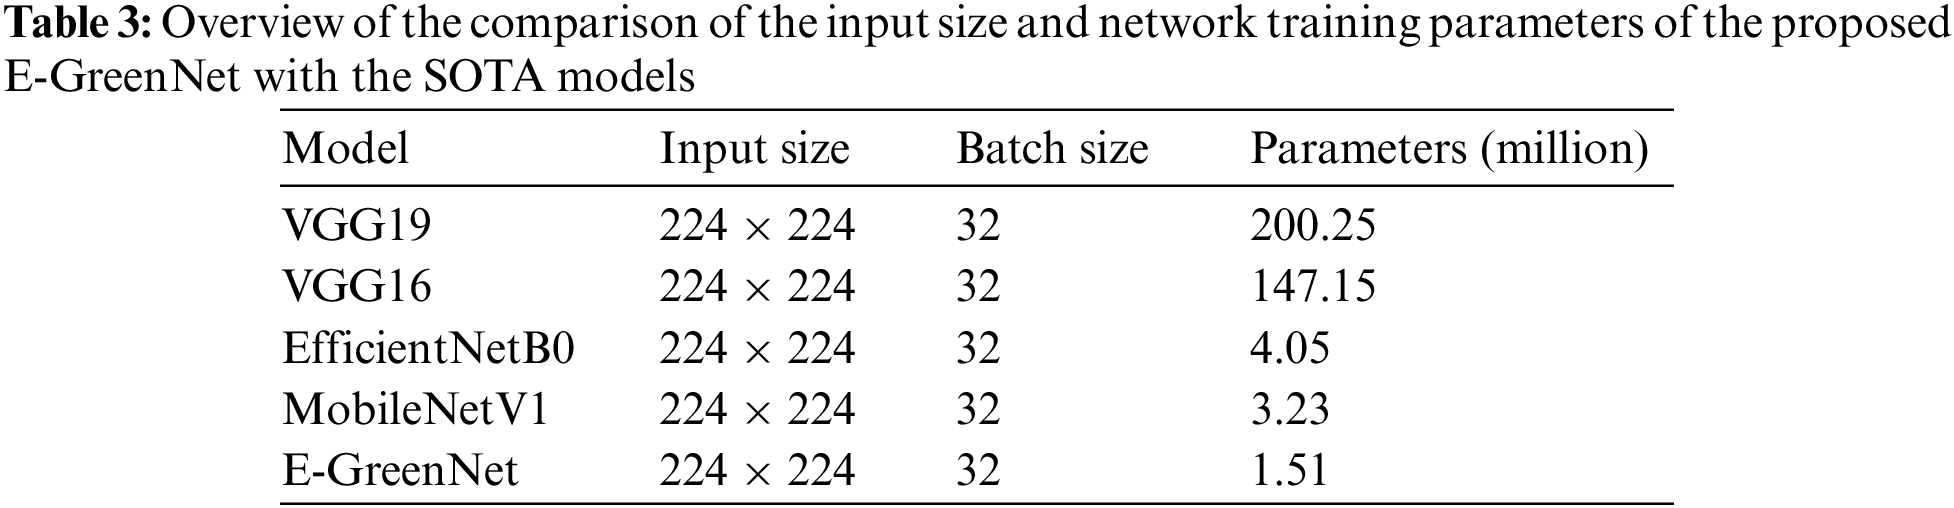
This article compared the proposed model with different pre-trained CNN-based architectures for plant disease detection. The models were compared concerning the number of parameters, precision, recall, F1-score, and accuracy. MobileNetV1, EfficientNetB0, VGG19, and VGG16 almost all models perform the same, whereas the proposed E-GreenNet model achieves the accuracies of 100%, 96%, and 99%, respectively on all three datasets while having the least number of parameters when compared to other SOTA models. In addition, a comparison of the proposed E-GreenNet model with MobileNetV1 indicates that although both models are computationally efficient, the proposed E-GreenNet has approximately two times a smaller number of parameters and still performs the best on all included datasets.
A comparison of the proposed model with MobileNetV1 indicates that the results of MobileNetV1 are proximate to those of the proposed model. However, the difference is the heavier weight, where E-GreenNet has 1.51 million parameters while MobileNetV1 has 3.23 million. An overview of the comparison of the input size and network training parameters of the proposed E-GreenNet with the SOTA models is listed in Table 2 while the performance of the pre-trained models is listed in Table 3. It can be observed that the pre-trained models achieve high performance with a low false-alarm rate. However, the false prediction rate remains high and needs to be boosted. Therefore, this research explored a fine-tuned and pre-trained CNN architecture (E-GreenNet) concerning the accuracy and incorrect prediction. After tuning, E-GreenNet attains the best performance among the other models with fewer false predictions while having the least number of trainable parameters.
The confusion matrix of the proposed E-GreenNet model trained on various benchmark datasets is depicted in Fig. 6. The dark green diagonal correlates with TP, whereas the saturation represents the accurate classification. The proposed E-GreenNet exhibits overall better classification accuracy compared to the SOTA models, although some of the images in both categories are misclassified. The training accuracy and training loss graphs are visualized in Fig. 7; the vertical axis represents the accuracy and loss, whereas the horizontal axis shows the total number of epochs. It is clear from Fig. 7 that E-GreenNet is effective for plant disease detection. As the number of iterations of the training and validation processes increases, the training and validation accuracy line graph of the model change, as depicted in Fig. 7a. The proposed E-GreenNet converges on 8 epochs, and the training and validation accuracies reach 100%, 96%, and 99% on PV, Data Repo Leaves, and Plant Composite datasets correspondingly. Likewise, the training and validation loss values change and drop to 0.0 and 0.09 respectively, as depicted in Fig. 7b. The proposed E-GreenNet is further compared with other pre-trained models in Table 4, while in Table 5 the proposed is compared against various ML and DL SOTA studies.
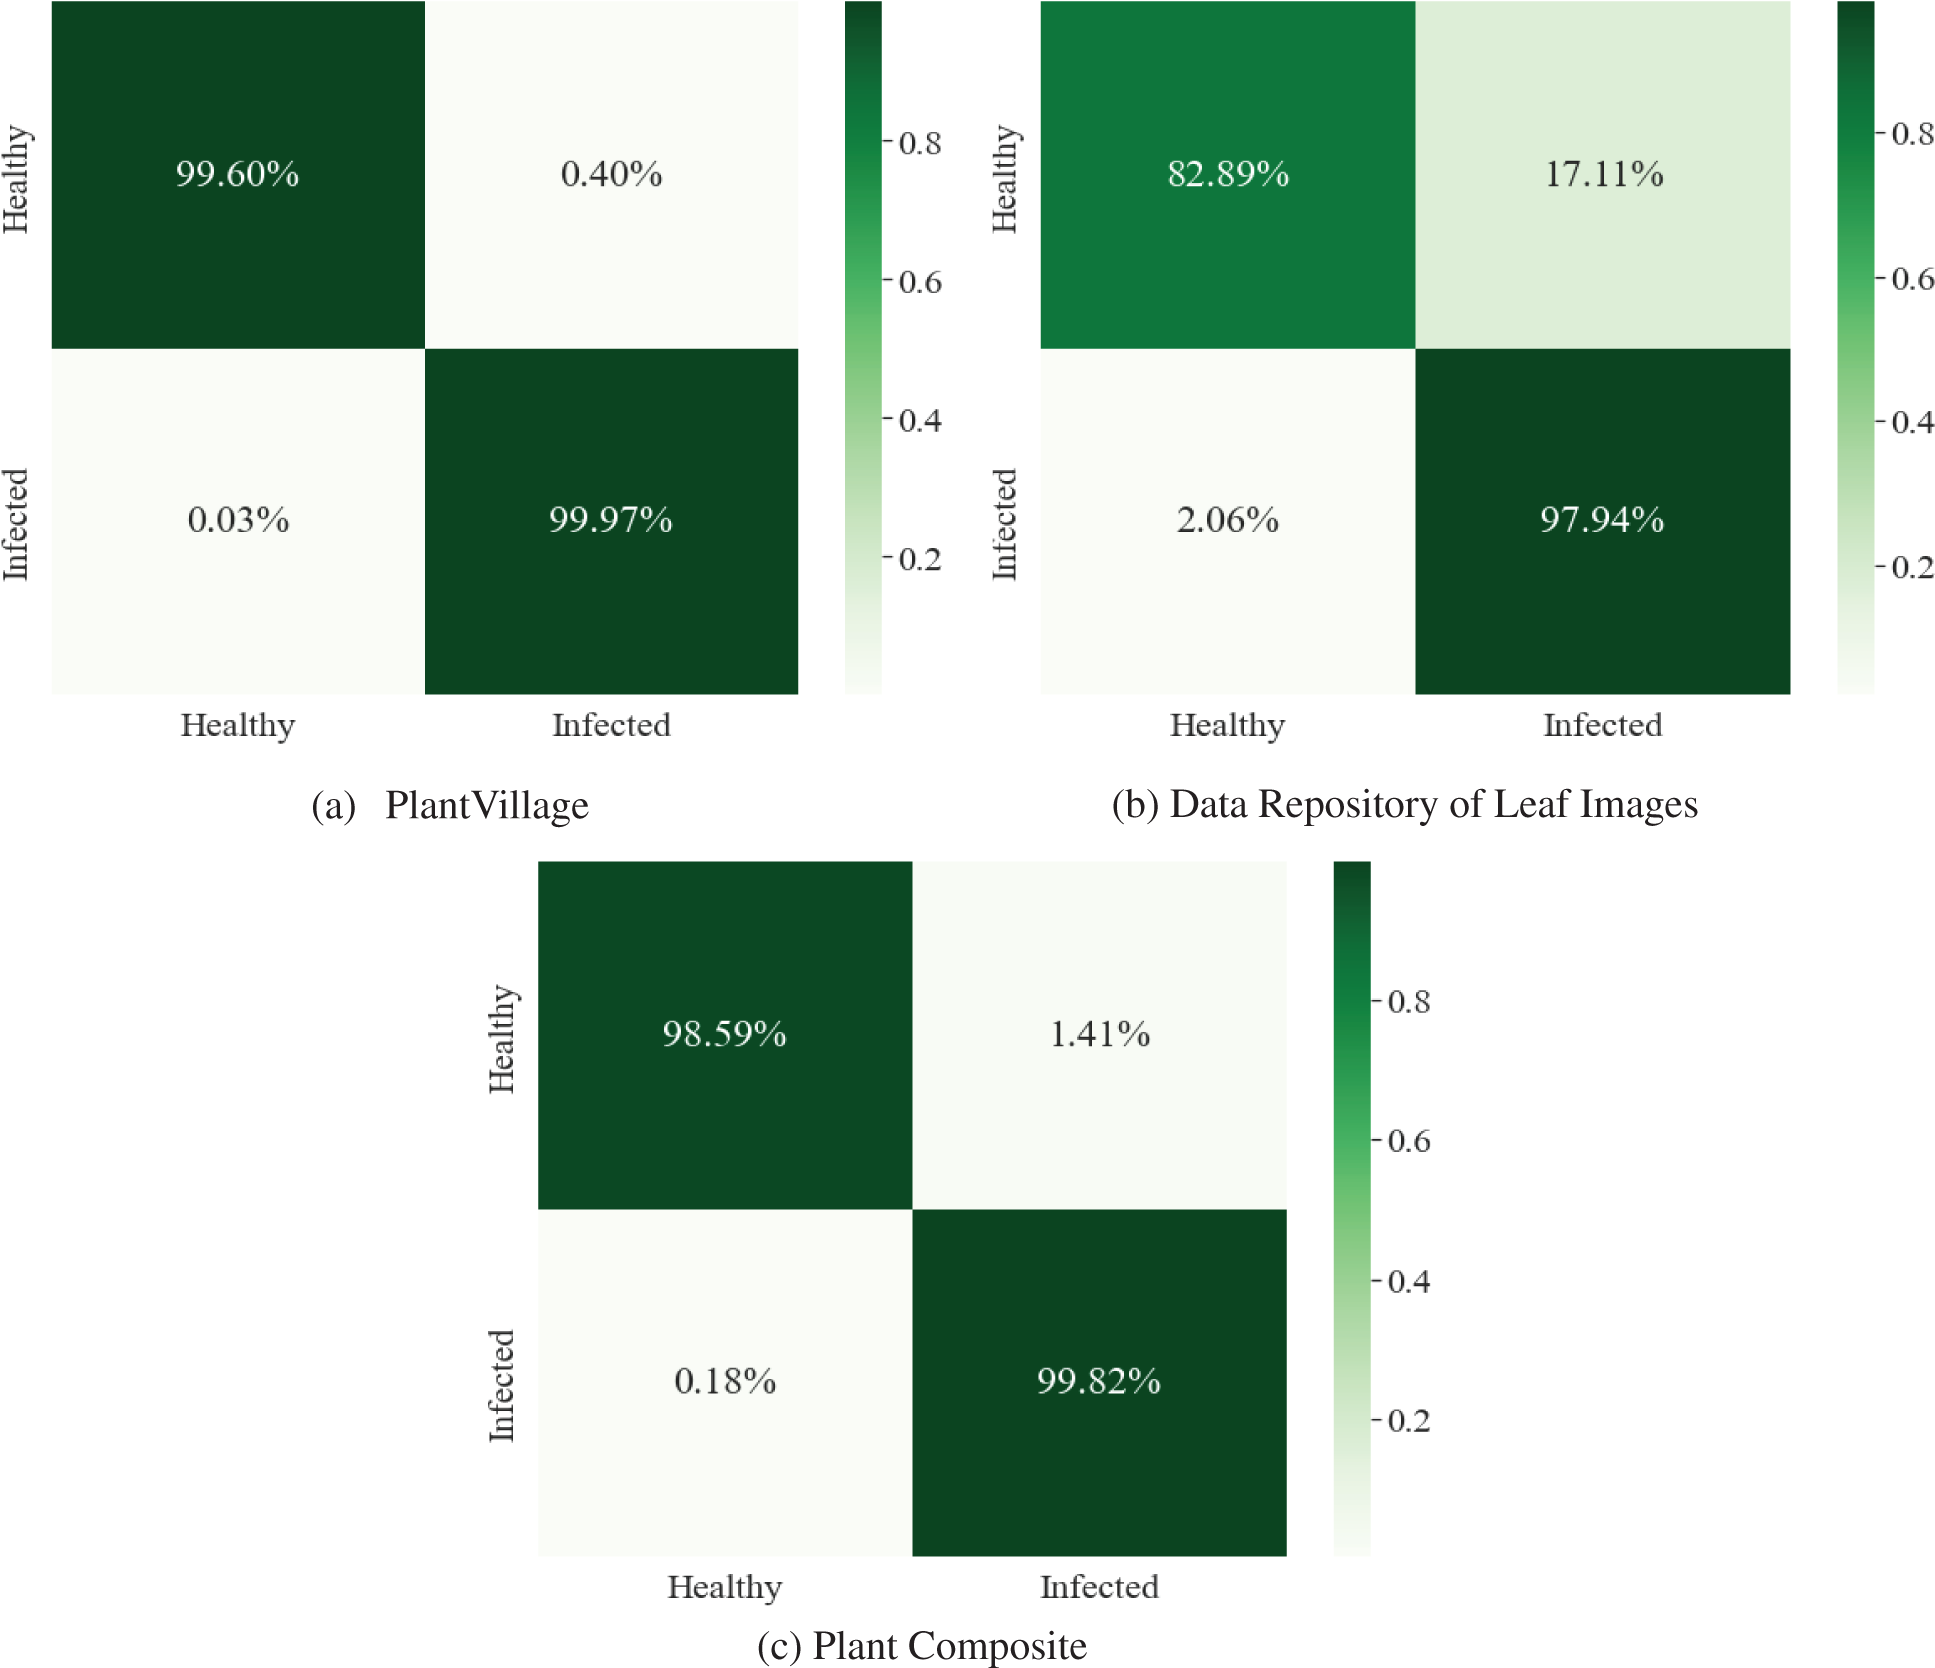
Figure 6: Confusion matrices of the proposed E-GreenNet utilizing benchmark datasets and a newly created composite dataset
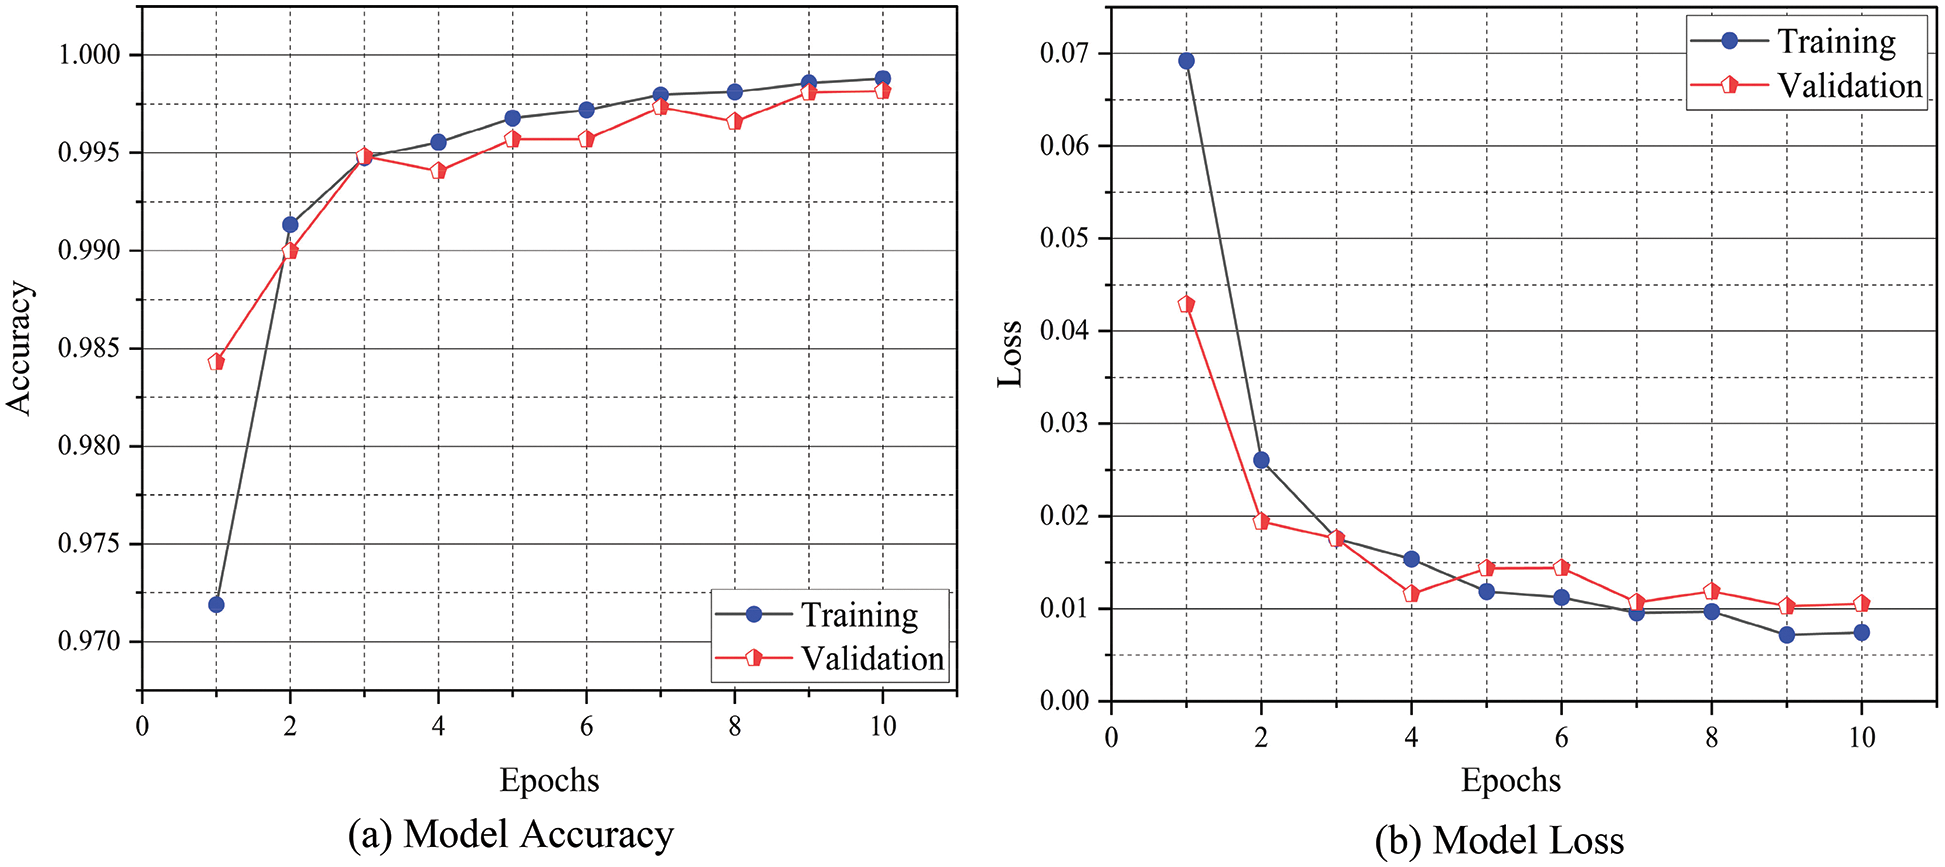
Figure 7: Training accuracy and loss against validation accuracy and loss of the proposed E-GreenNet for PC dataset
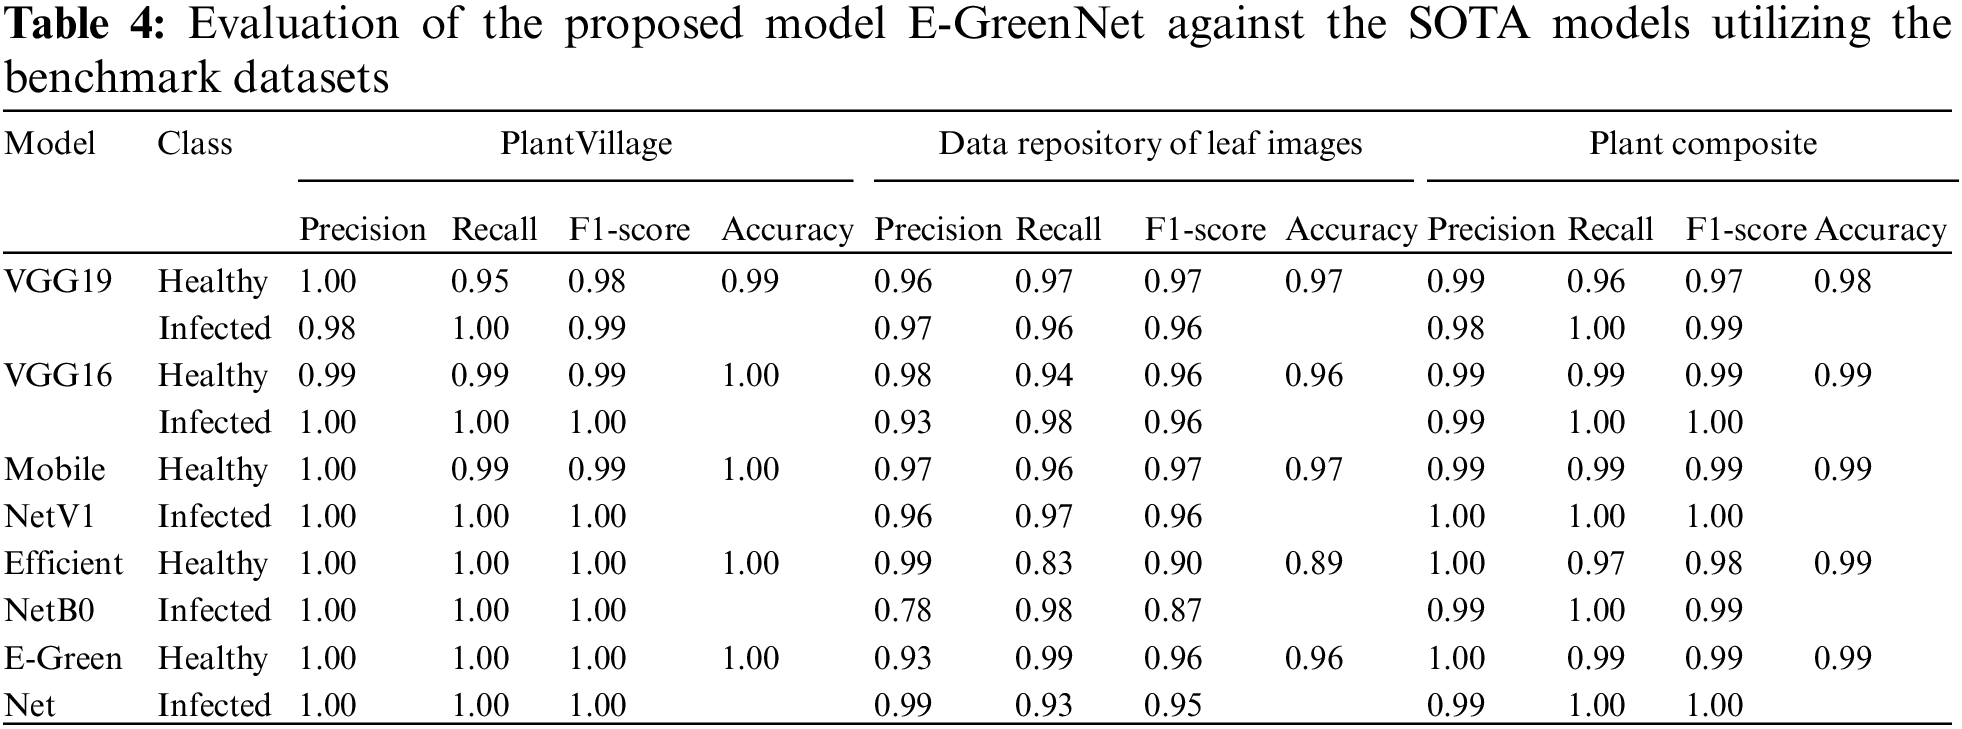
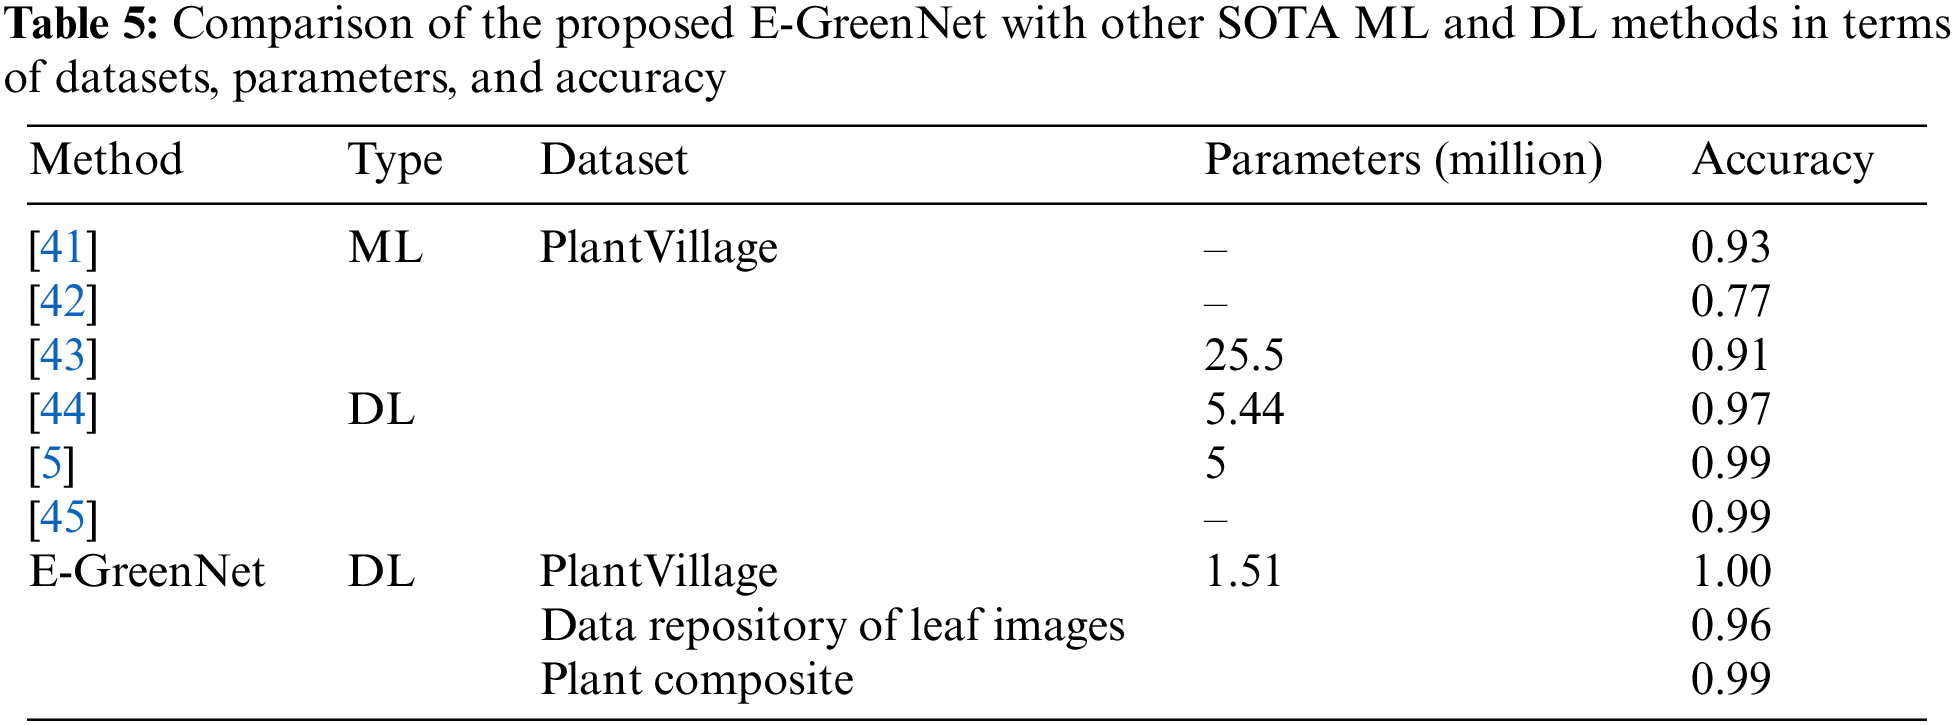
The proposed outperforms other pre-trained models listed in Table 4 and also has superior performance when compared to other ML and DL studies listed in Table 5. Those methods which have similar accuracies like E-GreenNet, the proposed outclass such methods by higher FPS and inferencing speed due to its lightweight architecture and fewer trainable parameters.
To assess a deep model’s effectiveness, performance, and deployment potential must be evaluated in real-time across various devices, including a small edge device such as Nvidia Jetson Nano along with Central Processing Unit (CPU) and GPU. Nvidia Jetson Nano is equipped with a quad-core ARM architecture-based CPU i.e., Cortex-A57, and a discrete GPU based on Maxwell architecture with 128 Nvidia CUDA cores and 4 GB of LPDDR4 onboard memory. The specifications of the CPU and GPU employed for analyzing the FPS of the proposed E-GreenNet model are listed in Section 4. The criteria to assess the model performance for real-time application is that the model achieving 30 or more FPS is considered optimal for real-world scenarios [46–55]. To evaluate the model’s performance, the authors captured a short video of tree leaves via mobile phone. The FPS for the proposed E-GreenNet model utilizing Jetson Nano, CPU, and GPU is 8.98, 29.67, and 31.73, respectively. Fig. 8 compares the proposed E-GreenNet model in terms of the FPS with several baseline models.
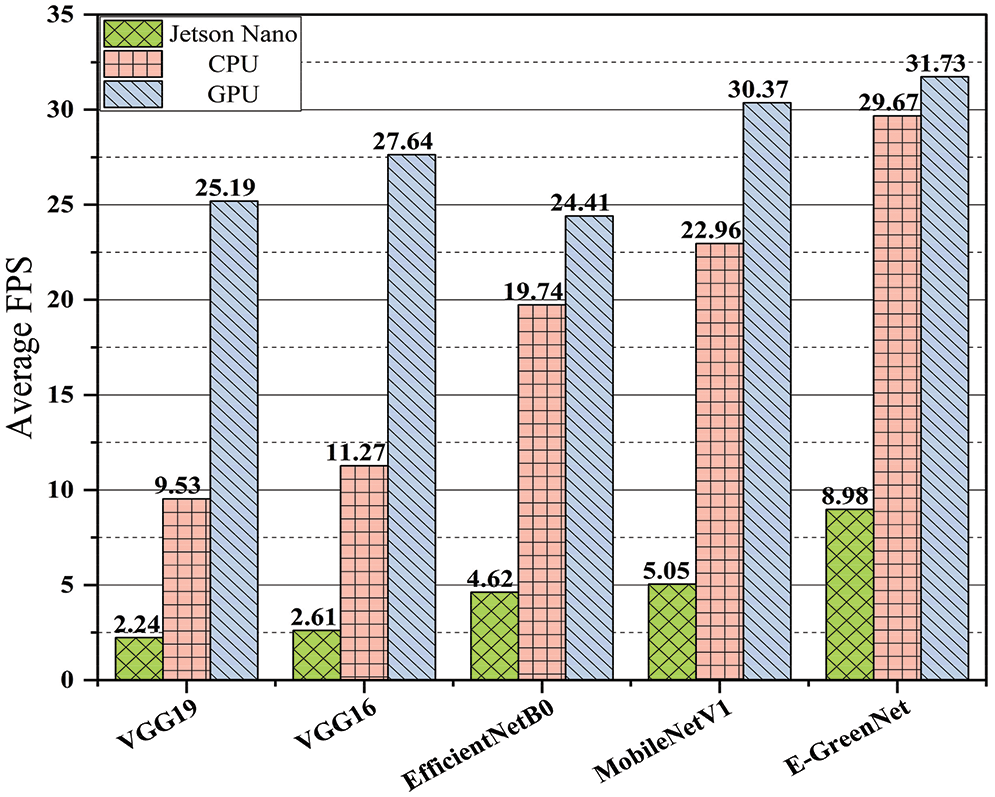
Figure 8: Comparison of the proposed E-GreenNet with various deep models in terms of FPS
The experimental results show that employing the Jetson Nano, CPU, and GPU, respectively, the FPS of the VGG19 model is 2.24, 9.53, and 25.19, the VGG16 model is 2.61, 11.27, and 27.64, EfficientNetB0 model is 4.62, 19.74 and 24.41, and MobileNetV1 is 5.05, 22.96 and 30.37. A comparison of the time complexity of the E-GreenNet model with those of the other baseline models indicates that the performance of the proposed model is convincing. Thus, the proposed E-GreenNet model is capable of real-time processing and operation.
In this study, authors proposed a new model for plant disease detection i.e., E-GreenNet inspired by MobileNetV3Small architecture. The authors fine-tuned the existing model for the specific task of plant disease detection. The proposed E-GreenNet can accurately identify and classify infected plant leaves from the PV dataset, the DRLI dataset, and a new dataset called the PC dataset. The research presented here features a refined and improved version of MobileNetV3Small i.e., E-GreenNet. By employing E-GreenNet, deep key points are calculated and classified according to their corresponding classes using an end-to-end training architecture. The new PC dataset that contains images spanning over multiple classes, and publicly available benchmark datasets such as PV and DRLI were used to evaluate performance. The highest accuracy was achieved with a precision of 99.5%, a recall of 99.5%, and an accuracy of 99.99%. The robustness and time-effectiveness of the proposed approach were found to be superior to other recent approaches. However, the proposed method is not suitable for such scenarios when the environment is foggy or hazy i.e., visibility is low then the model performance is affected. Secondly, if the object is far from the vision sensor i.e., in the case of a drone surveillance scenario the model robustness is influenced adversely. In the future, authors intend to develop a new model with an attention mechanism and evaluate the proposed method on challenging datasets.
Acknowledgement: This work was financially supported by MSIT (Ministry of Science and ICT), Korea, under the ITRC (Information Technology Research Center) support program (IITP-2022-RS-2022-00156354) supervised by the IITP (Institute for Information & Communications Technology Planning & Evaluation) and also by the Ministry of Trade, Industry and Energy (MOTIE) and Korea Institute for Advancement of Technology (KIAT) through the International Cooperative R&D program (Project No. P0016038).
Funding Statement: This work was financially supported by MSIT (Ministry of Science and ICT), Korea, under the ITRC (Information Technology Research Center) support program (IITP-2022-RS-2022-00156354) supervised by the IITP (Institute for Information & Communications Technology Planning & Evaluation) and also by the Ministry of Trade, Industry and Energy (MOTIE) and Korea Institute for Advancement of Technology (KIAT) through the International Cooperative R&D program (Project No. P0016038).
Conflicts of Interest: The authors declare that they have no conflicts of interest to report regarding the present study.
References
1. J. B. Ristaino, P. K. Anderson, D. P. Bebber, K. A. Brauman, N. J. Cunniffe et al., “The persistent threat of emerging plant disease pandemics to global food security,” Proceedings the National Academy of Sciences, vol. 118, no. 23, pp. e2022239118, 2021. [Google Scholar]
2. R. N. Strange and P. R. Scott, “Plant disease: A threat to global food security,” Annual Review of Phytopathology, vol. 43, no. 1, pp. 83–116, 2005. [Google Scholar] [PubMed]
3. G. Fenu and F. M. Malloci, “Forecasting plant and crop disease: An explorative study on current algorithms,” Big Data and Cognitive Computing, vol. 5, no. 1, pp. 2, 2021. [Google Scholar]
4. M. H. Saleem, J. Potgieter and K. M. Arif, “Plant disease detection and classification by deep learning,” Plants, vol. 8, no. 11, pp. 468, 2019. [Google Scholar] [PubMed]
5. S. P. Mohanty, D. P. Hughes and M. Salathé, “Using deep learning for image-based plant disease detection,” Frontiers in Plant Science, vol. 7, pp. 1419, 2016. [Google Scholar] [PubMed]
6. S. Sankaran, A. Mishra, R. Ehsani and C. Davis, “A review of advanced techniques for detecting plant diseases,” Computers and Electronics in Agriculture, vol. 72, no. 1, pp. 1–13, 2010. [Google Scholar]
7. H. X. Dinh, D. Singh, S. Periyannan, R. F. Park and M. Pourkheirandish, “Molecular genetics of leaf rust resistance in wheat and barley,” Theoretical and Applied Genetics, vol. 133, no. 7, pp. 2035–2050, 2020. [Google Scholar] [PubMed]
8. T. Talaviya, D. Shah, N. Patel, H. Yagnik and M. Shah, “Implementation of artificial intelligence in agriculture for optimisation of irrigation and application of pesticides and herbicides,” Artificial Intelligence in Agriculture, vol. 4, no. 1, pp. 58–73, 2020. [Google Scholar]
9. K. Elangovan and S. Nalini, “Plant disease classification using image segmentation and SVM techniques,” International Journal of Computational Intelligence Research, vol. 7, pp. 1821–1828, 2017. [Google Scholar]
10. O. Maimon and L. Rokach, Data Mining and Knowledge Discovery Handbook, 2nd ed., vol. 2. NY, USA: Springer, 2005. [Google Scholar]
11. S. Ramesh, R. Hebbar, M. Niveditha, R. Pooja, N. Shashank et al., “Plant disease detection using machine learning,” in Proc. Int. Conf. on Design Innovations for 3Cs Compute Communicate Control, Bangalore, India, 2018. [Google Scholar]
12. S. Dargan, M. Kumar, M. R. Ayyagari and G. Kumar, “A survey of deep learning and its applications: A new paradigm to machine learning,” Archives of Computational Methods in Engineering, vol. 4, no. 4, pp. 1071–1092, 2020. [Google Scholar]
13. S. Zhang, L. Yao, A. Sun and Y. Tay, “Deep learning based recommender system: A survey and new perspectives,” ACM Computing Surveys, vol. 52, no. 1, pp. 1–38, 2019. [Google Scholar]
14. J. Liu and X. Wang, “Plant diseases and pests detection based on deep learning: A review,” Plant Methods, vol. 17, no. 1, pp. 1–18, 2021. [Google Scholar]
15. Y. Lu, S. Yi, N. Zeng, Y. Liu and Y. Zhang, “Identification of rice diseases using deep convolutional neural networks,” Neurocomputing, vol. 267, no. 1, pp. 378–384, 2017. [Google Scholar]
16. R. Ahila Priyadharshini, S. Arivazhagan, M. Arun and A. Mirnalini, “Maize leaf disease classification using deep convolutional neural networks,” Neural Computing and Applications, vol. 31, no. 12, pp. 8887–8895, 2019. [Google Scholar]
17. M. Agarwal, A. Singh, S. Arjaria, A. Sinha and S. Gupta, “Toled: Tomato leaf disease detection using convolution neural network,” Procedia Computer Science, vol. 167, pp. 293–301, 2020. [Google Scholar]
18. A. K. Rangarajan, R. Purushothaman and A. Ramesh, “Tomato crop disease classification using pre-trained deep learning algorithm,” Procedia Computer Science, vol. 133, pp. 1040–1047, 2018. [Google Scholar]
19. J. Chen, J. Chen, D. Zhang, Y. Sun and Y. A. Nanehkaran, “Using deep transfer learning for image-based plant disease identification,” Computers and Electronics in Agriculture, vol. 173, pp. 105393, 2020. [Google Scholar]
20. B. Richey, S. Majumder, M. Shirvaikar and N. Kehtarnavaz, “Real-time detection of maize crop disease via a deep learning-based smartphone app,” in Proc. Real-Time Image Processing and Deep Learning, Online, California, United States, 2020. [Google Scholar]
21. Ü. Atila, M. Uçar, K. Akyol and E. Uçar, “Plant leaf disease classification using efficientnet deep learning model,” Ecological Informatics, vol. 61, pp. 101182, 2021. [Google Scholar]
22. M. E. Chowdhury, T. Rahman, A. Khandakar, M. A. Ayari, A. U. Khan et al., “Automatic and reliable leaf disease detection using deep learning techniques,” AgriEngineering, vol. 3, pp. 294–312, 2021. [Google Scholar]
23. J. Wen, Y. Shi, X. Zhou and Y. Xue, “Crop disease classification on inadequate low-resolution target images,” Sensors, vol. 20, no. 16, pp. 4601, 2020. [Google Scholar] [PubMed]
24. G. Zhou, W. Zhang, A. Chen, M. He and X. Ma, “Rapid detection of rice disease based on FCM-KM and faster R-CNN fusion,” IEEE Access, vol. 7, pp. 143190–143206, 2019. [Google Scholar]
25. Y. Zhang, C. Song and D. Zhang, “Deep learning-based object detection improvement for tomato disease,” IEEE Access, vol. 8, pp. 56607–56614, 2020. [Google Scholar]
26. M. Saberi Anari, “A hybrid model for leaf diseases classification based on the modified deep transfer learning and ensemble approach for agricultural AIoT-based monitoring,” Computational Intelligence and Neuroscience, vol. 2022, pp. 6504616, 2022. [Google Scholar] [PubMed]
27. V. K. Shrivastava and M. K. Pradhan, “Rice plant disease classification using color features: A machine learning paradigm,” Journal of Plant Pathology, vol. 103, no. 1, pp. 17–26, 2021. [Google Scholar]
28. V. N. T. Le, S. Ahderom, B. Apopei and K. Alameh, “A novel method for detecting morphologically similar crops and weeds based on the combination of contour masks and filtered local binary pattern operators,” GigaScience, vol. 3, pp. giaa017, 2020. [Google Scholar]
29. W. Ahmad, S. Shah and A. Irtaza, “Plants disease phenotyping using quinary patterns as texture descriptor,” KSII Transactions on Internet and Information Systems, vol. 8, pp. 3312–3327, 2020. [Google Scholar]
30. Y. Sun, Z. Jiang, L. Zhang, W. Dong and Y. Rao, “SLIC_SVM based leaf diseases saliency map extraction of tea plant,” Computers and Electronics in Agriculture, vol. 157, no. 2, pp. 102–109, 2019. [Google Scholar]
31. X. E. Pantazi, D. Moshou and A. A. Tamouridou, “Automated leaf disease detection in different crop species through image features analysis and one class classifiers,” Computers and Electronics in Agriculture, vol. 156, no. 13, pp. 96–104, 2019. [Google Scholar]
32. Y. M. Oo and N. C. Htun, “Plant leaf disease detection and classification using image processing,” International Journal of Research and Engineering, vol. 5, no. 9, pp. 516–523, 2018. [Google Scholar]
33. G. Kuricheti and P. Supriya, “Computer vision based turmeric leaf disease detection and classification: A step to smart agriculture,” in Proc. Int. Conf. on Trends in Electronics and Informatics, Tirunelveli, India, 2019. [Google Scholar]
34. D. Shah, V. Trivedi, V. Sheth, A. Shah and U. Chauhan, “Rests: Residual deep interpretable architecture for plant disease detection,” Information Processing in Agriculture, vol. 9, no. 2, pp. 212–223, 2022. [Google Scholar]
35. R. Dwivedi, S. Dey, C. Chakraborty and S. Tiwari, “Grape disease detection network based on multi-task learning and attention features,” Sensors Journal, vol. 16, pp. 17573–17580, 2021. [Google Scholar]
36. K. Akshai and J. Anitha, “Plant disease classification using deep learning,” in Proc. Int. Conf. on Signal Processing and Communication, Tamil Nadu, India, 2021. [Google Scholar]
37. D. Argüeso, A. Picon, U. Irusta, A. Medela, M. G. San-Emeterio et al., “Few-shot learning approach for plant disease classification using images taken in the field,” Computers and Electronics in Agriculture, vol. 175, pp. 105542, 2020. [Google Scholar]
38. A. Batool, S. B. Hyder, A. Rahim, N. Waheed and M. A. Asghar, “Classification and identification of tomato leaf disease using deep neural network,” in Proc. Int. Conf. on Engineering and Emerging Technologies, Lahore, Pakistan, 2020. [Google Scholar]
39. R. Karthik, M. Hariharan, S. Anand, P. Mathikshara, A. Johnson et al., “Attention embedded residual CNN for disease detection in tomato leaves,” Applied Soft Computing, vol. 86, pp. 105933, 2020. [Google Scholar]
40. P. Tm, A. Pranathi, K. SaiAshritha, N. B. Chittaragi and S. G. Koolagudi, “Tomato leaf disease detection using convolutional neural networks,” in Proc. Int. Conf. on Contemporary Computing, Gurgaon, India, 2018. [Google Scholar]
41. J. Ma, K. Du, F. Zheng, L. Zhang, Z. Gong et al., “A recognition method for cucumber diseases using leaf symptom images based on deep convolutional neural network,” Computers and Electronics in Agriculture, vol. 154, no. 1, pp. 18–24, 2018. [Google Scholar]
42. T. S. Xian and R. Ngadiran, “Plant diseases classification using machine learning,” Journal of Physics: Conference Series, vol. 1962, pp. 012024, 2021. [Google Scholar]
43. F. Mohameth, C. Bingcai and K. A. Sada, “Plant disease detection with deep learning and feature extraction using plant village,” Journal of Computer and Communications, vol. 6, no. 6, pp. 10–22, 2020. [Google Scholar]
44. F. Feldmann and U. Vogler, “Towards sustainable performance of urban horticulture: Ten challenging fields of action for modern integrated pest management in cities,” Journal of Plant Diseases and Protection, vol. 128, no. 1, pp. 55–66, 2021. [Google Scholar] [PubMed]
45. J. Chen, H. Yin and D. Zhang, “A self-adaptive classification method for plant disease detection using GMDH-logistic model,” Sustainable Computing: Informatics and Systems, vol. 28, pp. 100415, 2020. [Google Scholar]
46. A. Aggarwal, S. Kumar, A. Bhatt and M. A. Shah, “Solving user priority in cloud computing using enhanced optimization algorithm in workflow scheduling,” Computational Intelligence and Neuroscience, vol. 2022, no. 11, pp. 1–11, 2022. [Google Scholar]
47. P. Nagpal, S. Chaudhary and S. Kumar, “Detection of disease in plants with android integration using machine learning in applied computational technologies,” in Proc. Int. Conf. on Computing in Engineering & Technology, SG, pp. 144–151, 2022. [Google Scholar]
48. N. Dilshad, T. Khan and J. Song, “Efficient deep learning framework for fire detection in complex surveillance environment,” Computer Systems Science and Engineering, vol. 46, no. 1, pp. 749–764, 2023. [Google Scholar]
49. N. Dilshad, A. Ullah, J. Kim and J. Seo, “LocateUAV: Unmanned aerial vehicle location estimation via contextual analysis in an IoT environment,” IEEE Internet of Things Journal, vol. 10, no. 5, pp. 4021–4033, 2022. https://doi.org/10.1109/JIOT.2022.3162300 [Google Scholar] [CrossRef]
50. N. Dilshad, J. Hwang, J. Song and N. Sung, “Applications and challenges in video surveillance via drone: A brief survey,” in Proc. Int. Conf. on Information and Communication Technology Convergence, Jeju Island, SK, pp. 728–732, 2020. [Google Scholar]
51. N. Dilshad and J. Song, “Dual-stream siamese network for vehicle re-identification via dilated convolutional layers,” in Proc. Int. Conf. on Smart Internet of Things, Jeju Island, SK, pp. 350–35, 2021. [Google Scholar]
52. U. Ullah Khan, N. Dilshad, M. Husain Rehmani and T. Umer, “Fairness in cognitive radio networks: Models, measurement methods, applications and future research directions,” Journal of Network and Computer Applications, vol. 73, no. 2, pp. 12–26, 2016. [Google Scholar]
53. M. Ullah, S. U. Amin, M. Munsif, U. Safaev, H. Khan et al., “Serious games in science education. A systematic literature review,” Virtual Reality & Intelligent Hardware, vol. 4, no. 3, pp. 189–209, 2022. [Google Scholar]
54. S. Ullah Khan, I. Ul Haq, N. Khan, K. Muhammad, M. Hijji et al., “Learning to rank: An intelligent system for person reidentification,” International Journal of Intelligent Systems, vol. 37, no. 9, pp. 5924–5948, 2022. [Google Scholar]
55. S. Ullah Khan, T. Hussain, A. Ullah and S. Wook Baik, “Deep-Reid: Deep features and autoencoder assisted image patching strategy for person re-identification in smart cities surveillance,” Multimedia Tools and Applications, vol. 164, no. 2, pp. 1–22, 2021. [Google Scholar]
Cite This Article
 Copyright © 2023 The Author(s). Published by Tech Science Press.
This work is licensed under a Creative Commons Attribution 4.0 International License , which permits unrestricted use, distribution, and reproduction in any medium, provided the original work is properly cited.
 Downloads
 Citation Tools