
 Submit a Paper
 Propose a Special lssue
 Open Access
ARTICLE

HSPM: A Better Model to Effectively Preventing Open-Source Projects from Dying
1 School of Computer Science and Engineering, Central South University, Changsha, 410075, China
2 National Engineering Research Center of High-speed Railway Construction Technology, Changsha, 410075, China
3 School of Civil Engineering, Central South University, Changsha, 410075, China
4 School of Engineering and Built Environment, Glasgow Caledonian University, Glasgow, G4 OBA, UK
* Corresponding Author: Sui Tan. Email:
Computer Systems Science and Engineering 2023, 47(1), 431-452. https://doi.org/10.32604/csse.2023.038087
Received 26 November 2022; Accepted 03 March 2023; Issue published 26 May 2023
 View Full Text
 Download PDF
Abstract
With the rapid development of Open-Source (OS), more and more software projects are maintained and developed in the form of OS. These Open-Source projects depend on and influence each other, gradually forming a huge OS project network, namely an Open-Source Software ECOsystem (OSSECO). Unfortunately, not all OS projects in the open-source ecosystem can be healthy and stable in the long term, and more projects will go from active to inactive and gradually die. In a tightly connected ecosystem, the death of one project can potentially cause the collapse of the entire ecosystem network. How can we effectively prevent such situations from happening? In this paper, we first identify the basic project characteristics that affect the survival of OS projects at both project and ecosystem levels through the proportional hazards model. Then, we utilize graph convolutional networks based on the ecosystem network to extract the ecosystem environment characteristics of OS projects. Finally, we fuse basic project characteristics and environmental project characteristics and construct a Hybrid Structured Prediction Model (HSPM) to predict the OS project survival state. The experimental results show that HSPM significantly improved compared to the traditional prediction model. Our work can substantially assist OS project managers in maintaining their projects’ health. It can also provide an essential reference for developers when choosing the right open-source project for their production activities.Keywords
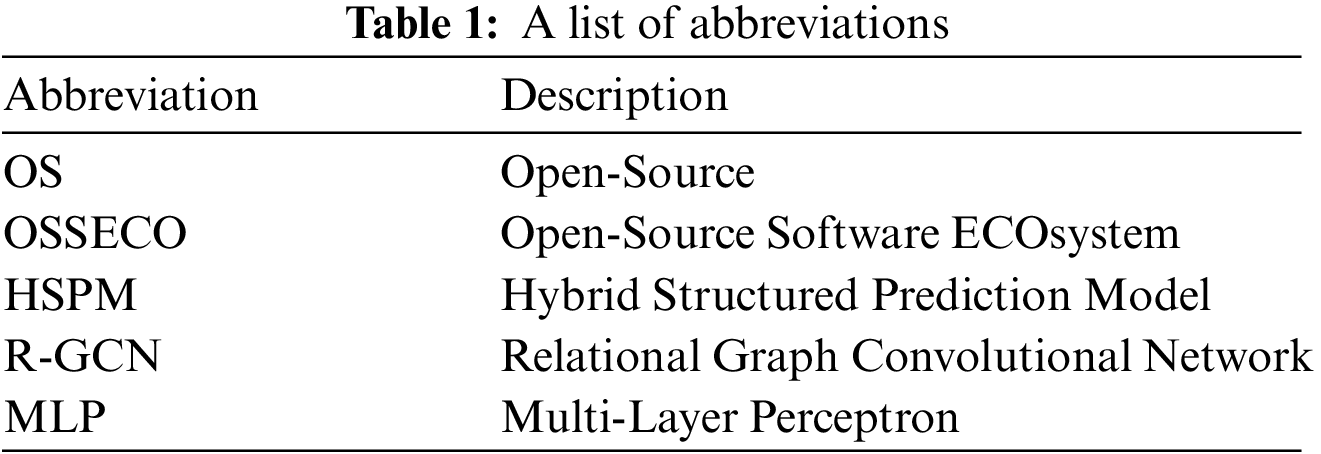
As open-source code gains more acceptance, an increasing number of software projects are being developed and released in this form. According to GitHub’s 2022 annual review [1], there are over 94 million developers and more than 350 million open-source projects on the platform as of December 2022. However, not all of these projects are healthy and stable in various open-source ecosystems, and many are “dying out” due to various factors. Additionally, not all open-source projects are independent, as they can be reused by other projects, making the prediction of their survival state important. The OS project is a crucial part of the open-source ecosystem, and its decline can lead to the collapse of the entire network. Table 1 provides a list of abbreviations for better illustration.
Measuring the health of open-source projects is crucial for predicting their survival. Scholars have proposed various methods, from focusing on single features [2–4] to multiple features of projects [5,6], and introduced concepts such as project sustainability and viability. Traditional machine learning methods [7–10] have also been applied to this task in recent years. However, these studies often ignored the ecosystem environment characteristics of OS projects and only considered the basic features of projects at the project or ecosystem level. To ensure reliable survival predictions, we need to comprehensively consider both types of project characteristics.
We collect data on over 1.3 million OS projects from eight ecosystems. Using survival analysis and GCNs, we determine the project and ecosystem characteristics that impact project survival and create an OS project survival prediction model. This study aims to assist project managers in maintaining the health of OS projects, to help examine the risks that exist in their projects, and to identify whether the project is in a good state of survival. Overall, this study makes the following contributions:
1) In this paper, we design the survival analysis experiment to identify basic project characteristics that will have an impact on the viability of OS projects from the project level and the ecosystem level;
2) We analyze the ecosystem network of OS projects by constructing graph convolution networks, thus determining the characteristics of the ecosystem environment of OS projects;
3) We construct an open-source project survival prediction model based on a hybrid structure, which has significantly improved in each evaluation metric compared with the traditional models.
The paper is structured as follows: Section 2 discusses previous work on OS project health. In Section 3, we analyze the survival of OS projects. Section 4 presents our methodology for predicting their survival, while Section 5 covers the experimental environment and results. We discuss the effectiveness and limitations of our approach in Section 6 and conclude the paper with future work in Section 7.
Project health has always been one of the significant research contents in software engineering. With the increasing popularity of open-source, more projects are being developed and managed in this form. Traditional health measurement methods for software are unsuitable for OS projects, leading to more scholars studying OS project health. Early scholars focused on a single characteristic of OS projects, such as project code, tools for building, and project size [2–4]. As more studies were conducted on the impact of a single feature on OS project health, scholars began to integrate related metrics [5, 6], such as project output, process, and members, and created methods for defining OS project health [11–13].
Scholars have expanded the definition of OS project health to include project sustainability and viability. Raja et al. [14] introduced a method to measure OS project viability with multiple dimensions, constructing a vitality index to predict project success. Valiev et al. [15] conducted a survival analysis of PyPI projects to model dormancy risk. Liao et al. [16] introduced an evaluation index system to assess ecosystem sustainability and determined the OSSECO sustainable development state. Liao et al. [17] studied the lifecycle of OS projects in the ecosystem and proposed a project life prediction model based on linear correlation. Yin et al. [18] studied the evolution of projects in the Apache Software Foundation Incubator from a socio-technical network modeling perspective.
With the popularity of deep learning [19–23], scholars have been applying it to OS project health prediction. In 2017, Coelho et al. [24] identified that the lack of contributors is the main reason for OS project failure. And in 2018, they measured the level of maintenance activity of GitHub projects to help developers select OS projects [25]. Two years later, they proposed a data-driven approach to measuring the level of maintenance activity of GitHub projects [26]. Eluri et al. [7] used a simple MLP to predict the survival of OS projects and found that their model achieved excellent accuracy on the GitHub dataset. In 2021, Osman et al. [8] defined the Bitcoin software ecosystem and established health metrics based on the social and technical features of the projects. In 2022, Linåker et al. [9] derived a framework consisting of 107 health characteristics for OS projects. Xia et al. [10] found that traditional estimation algorithms may make many mistakes and proposed hyperparameter optimization to algorithm error rates. The latest research [27] suggested improving the configuration of control parameters in machine learning to mitigate error rates. Additionally, they developed SNEAK [27], a method to predict OS project health using data clustering. Robinson et al. [28] found that OS projects with a large development team, frequent updates, and hosted code on multiple platforms are more likely to endure over time.
Previous studies didn’t fully consider the environment where OS projects exist, which includes the ecosystem network structure, and didn’t integrate this with the basic characteristics of OS projects to predict survival. However, the ecosystem environment is vital for predicting the survival of OS projects. This paper proposes a graph convolutional network-based model that extracts the network structure characteristics of OS projects from the ecosystem network and combines them with basic project characteristics to construct a more effective survival prediction model than traditional methods.
This section describes the definitions related to the survival of open-source projects and introduces the survival of OS projects at two levels: the whole project and the ecosystem.
The original dataset used in this paper is the libraries.io Open Data dataset (https://libraries.io/data), which collects data from 32 package managers and 3 source code repositories, tracking over 4 million unique open-source packages, 30 million repositories, and their interdependencies. Not all project dependencies are recorded in libraries.io, and some project dependencies are missing under the package manager. Therefore, 1,368,587 OS projects were selected from 4,976,470 projects to conduct experiments related to project survival. These projects come from package managers of eight popular development languages, and there is no project dependency across package managers. In the future, these projects can be naturally divided into eight ecosystems according to the package manager they belong to and their dependencies. These ecosystem networks vary in size, adding an element of comparison to observe how OS projects survive at the ecosystem level. Table 2 provides a basic overview of these eight ecosystems.
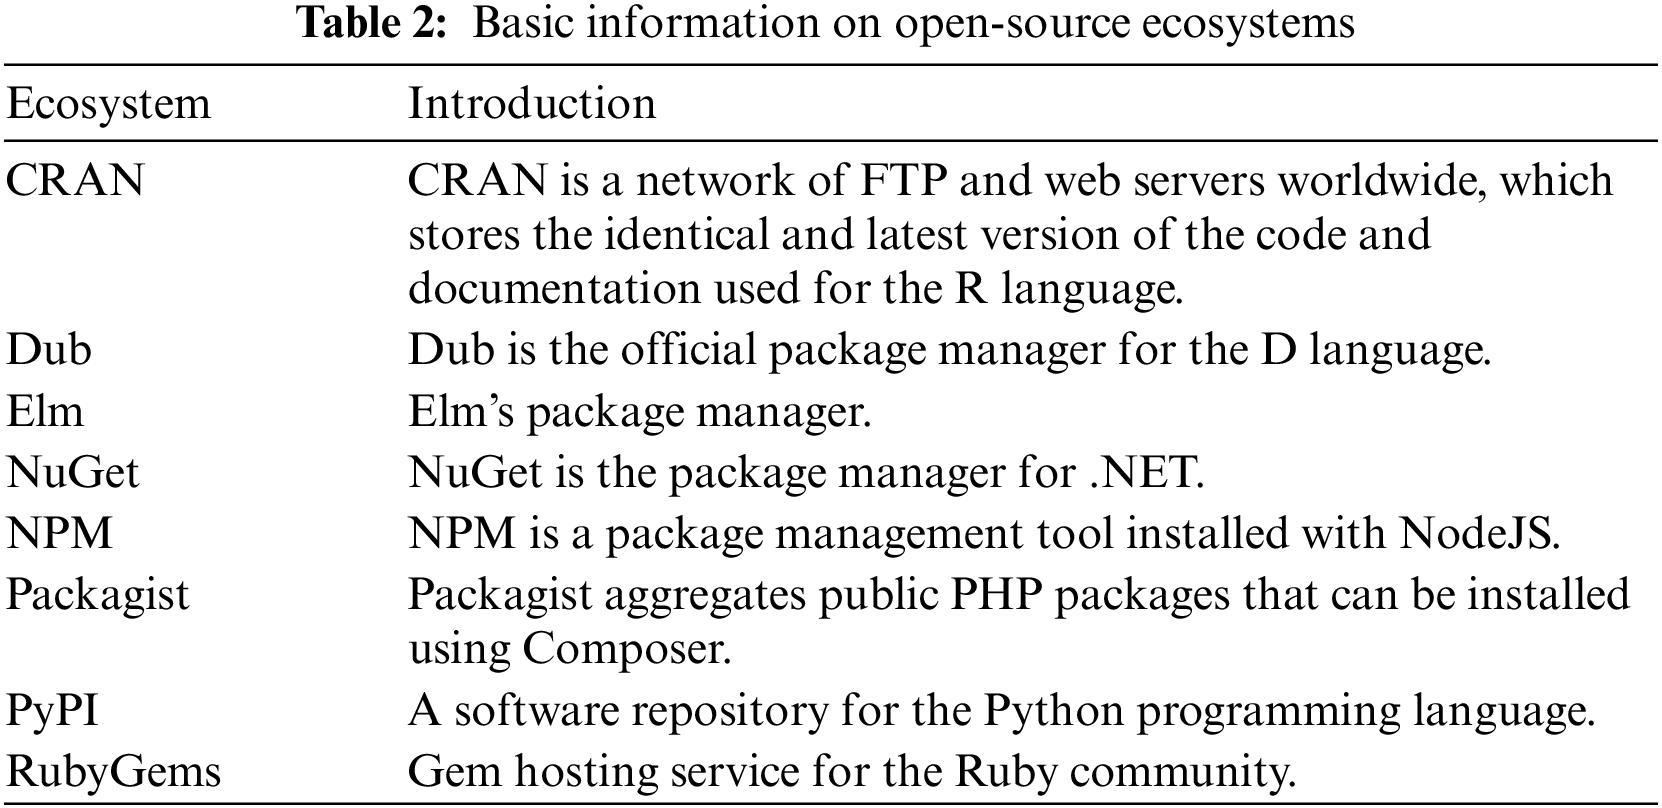
Additionally, some OS projects may have become inactive due to a lack of community participation. We exclude projects which were created before 2012 in our analysis since source code repositories like GitHub were not commonly used at that time. According to the criteria outlined in this paper, projects that haven’t been updated for six months are considered “dead” projects. And the data collection deadline for this study is September 2021. So we exclude projects created after March 2021 that don’t have sufficient history of observation. As a result, we obtain a total of 1,303,171 projects.
3.2 Definition of Survival State
To ensure consistency in subsequent studies, we need to define the survival state of OS projects first. Even in large OS projects, project abandonment is a reality, as noted by Avelino et al. in [29]. Meanwhile, Valiev et al. [15] proposed in their study that a project is considered to be dormant if it is no longer maintained, meaning that development activity has ceased. This paper adopts this concept and defines the survival state of OS projects as either “dead” or “alive”.
• “Dead” project: An open-source project that hasn’t been updated in 6 months or was marked as “Deprecated”, “Hidden”, “Removed”, or “Unmaintained” when last updated can be defined as a project in the “dead” state;
• “Alive” project: An open-source project not in the “dead” state.
Based on the definition of the survival state above, this section conducts analysis experiments on OS projects’ survival state at the ecosystem level to explore their differences. The primary purpose is to show why it’s essential to consider the survival of OS projects from an ecosystem perspective.
Firstly, we analyze the distribution of the OS project survival state. The left side of Fig. 1 shows the distribution of the survival state of all projects in the dataset. We can see that only 19.86% of the projects are still updated, while more than 80% of the projects are in the “dead” state until September 2021.
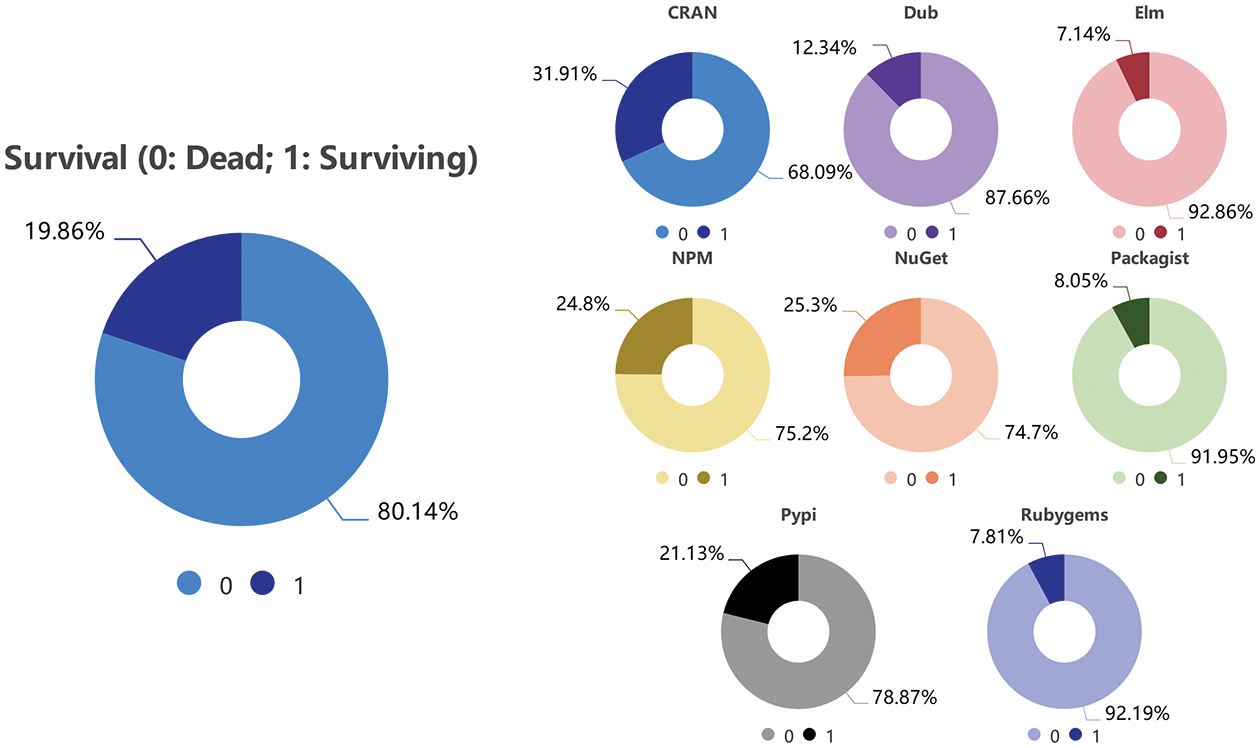
Figure 1: Open-source project survival state distribution (left side); distribution of open-source project survival state in each ecosystem (right side)
The survival state of OS projects from different ecosystems varies significantly, as shown on the right side of Fig. 1. Projects in the CRAN ecosystem show the best survival state, with 31.91% of the projects surviving. In contrast, projects in the Elm and RubyGems ecosystems fare worst, with only about 7% surviving. And survival projects in the NPM, NuGet, and PyPI ecosystems account for more than 20%. About 10% of projects survive in the remaining two ecosystems (Dub:12.34%; Packagist: 8.05%).
To estimate the survival probability of current OS projects, we use the product-limit method, also called the Kaplan-Meier (KM) method. The idea of the KM method is straightforward, that is, to obtain the final survival function
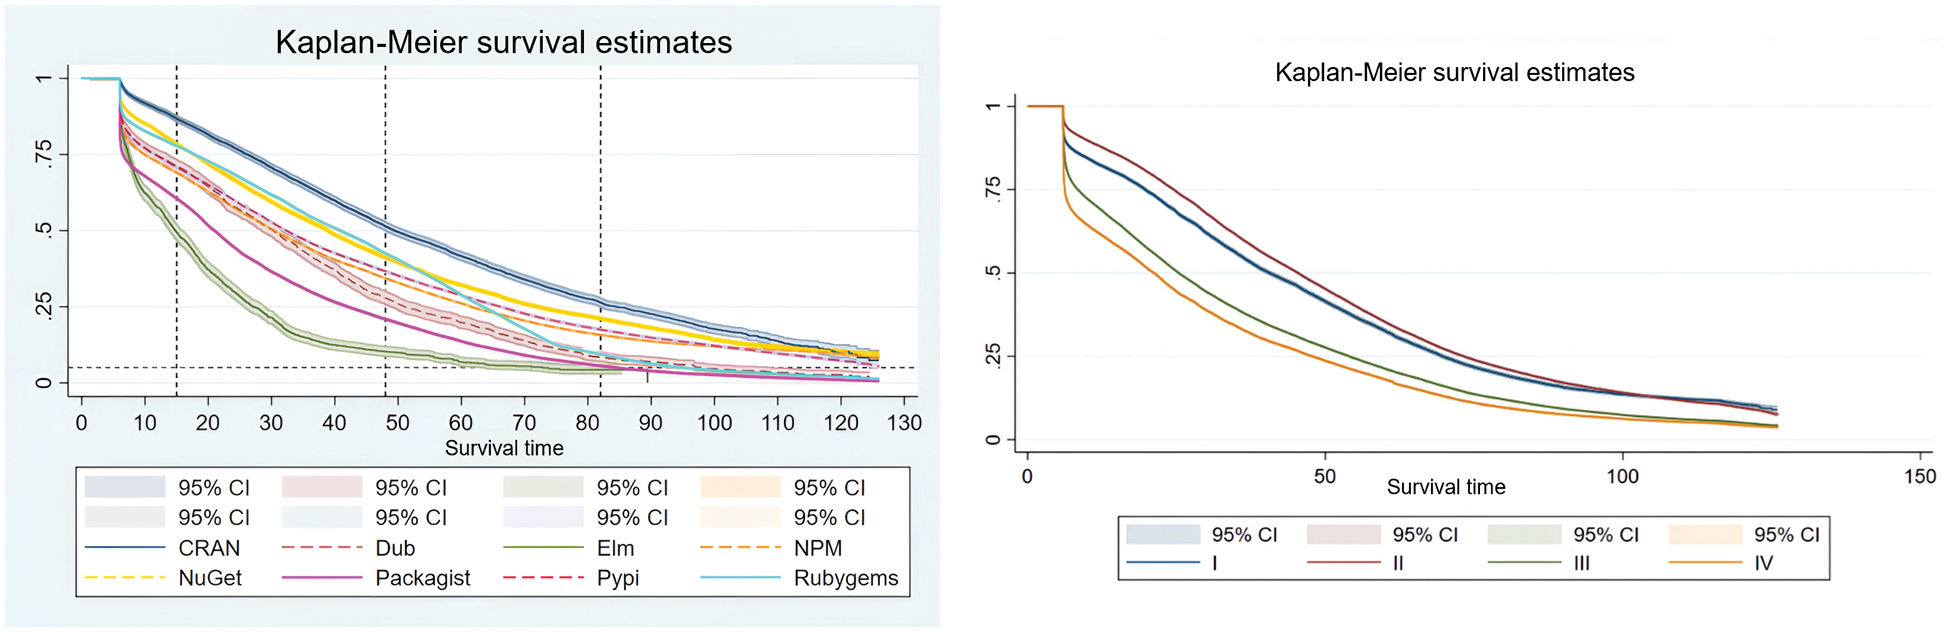
Figure 2: Project survival probability function curves for each OS ecosystem (left side); conducting survival analysis experiment on the OS project according to the degree of project node (right side)
The left side of Fig. 2 illustrates that OS projects in different ecosystems have different survival situations. The survival probability of OS projects in the Elm ecosystem drops the fastest. The survival rate of the entire project group falls below 50% after 15 months of observation and declines rapidly afterward, eventually approaching less than 5%. OS projects in the Packagist ecosystem also perform poorly, with only about 5% surviving after 20 months of observation. The project groups in five ecosystems, including Dub, NPM, NuGet, PyPI, and RubyGems, vary uniformly in survival probability at early observation, but gradually they are divided into two groups. Finally, OS projects in the Dub and RubyGems ecosystems have survival probabilities below 5%, whereas those in the NPM, NuGet, and PyPI ecosystems have survival probabilities between 5% and 10%. The CRAN ecosystem still performs well in this experiment, with the survival probability of the projects in this ecosystem declining the most slowly. The survival rate remains above 50% after 48 months of observation and gradually decreases to 25% after 82 months. Ultimately, the survival probability of the project remains above 5%.
Table 3 shows the Log-Rank test results of the survival probability of OS projects in each ecosystem. It can be seen that the value of
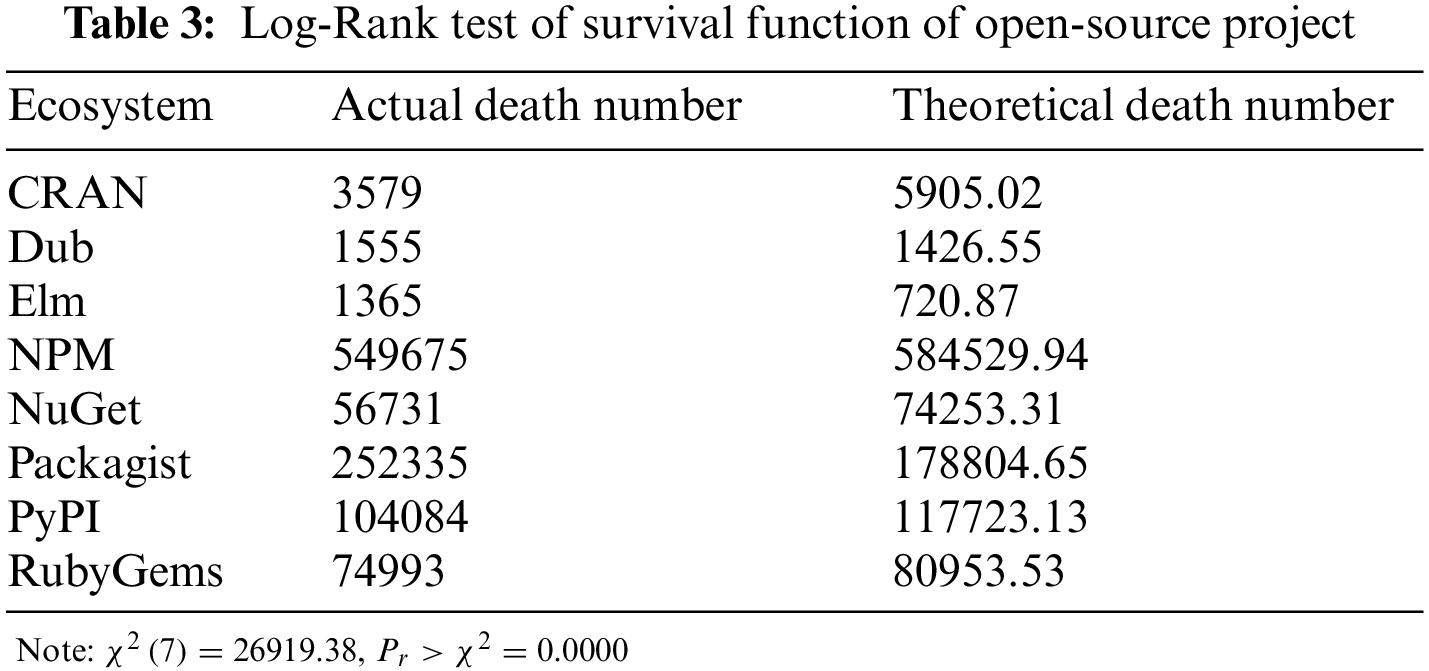
This series of survival analysis experiments all demonstrate that the ecosystem in which OS projects reside has an impact on their survival state. It is necessary to identify the factors affecting the survival state of OS projects from an ecosystem perspective and construct a predictive model for OS project survival.
Predicting the survival state of OS projects is vital for the long-term sustainability of the ecosystem. Thus, this paper aims to design a survival prediction model for OS projects to help developers avoid projects in a bad survival state when choosing OS projects for production activities. Or help projects that are not in a good state of survival to effectively avoid the risk of “death”. Based on this, it is necessary to determine the input characteristics of the model when constructing the prediction model.
We utilize the Cox proportional hazard regression model to identify the basic characteristics of OS projects and then employ GCNs to extract the characteristics of the OS project ecosystem environment. Subsequently, we build an OS project survival prediction model based on the concept of mixed structure in the integration model, allowing us to address the issues of sample imbalance and lack of integration diversity in the survival prediction of OS projects. The overall workflow of HSPM is depicted in Fig. 3. The pipeline of HSPM comprises four key stages: (a) extraction of basic characteristics of projects at both the project and ecosystem levels, (b) construction of an open-source ecosystem network, (c) extraction of node features through an R-GCN autoencoder, and (d) training of our Hybrid Structure Prediction Model.
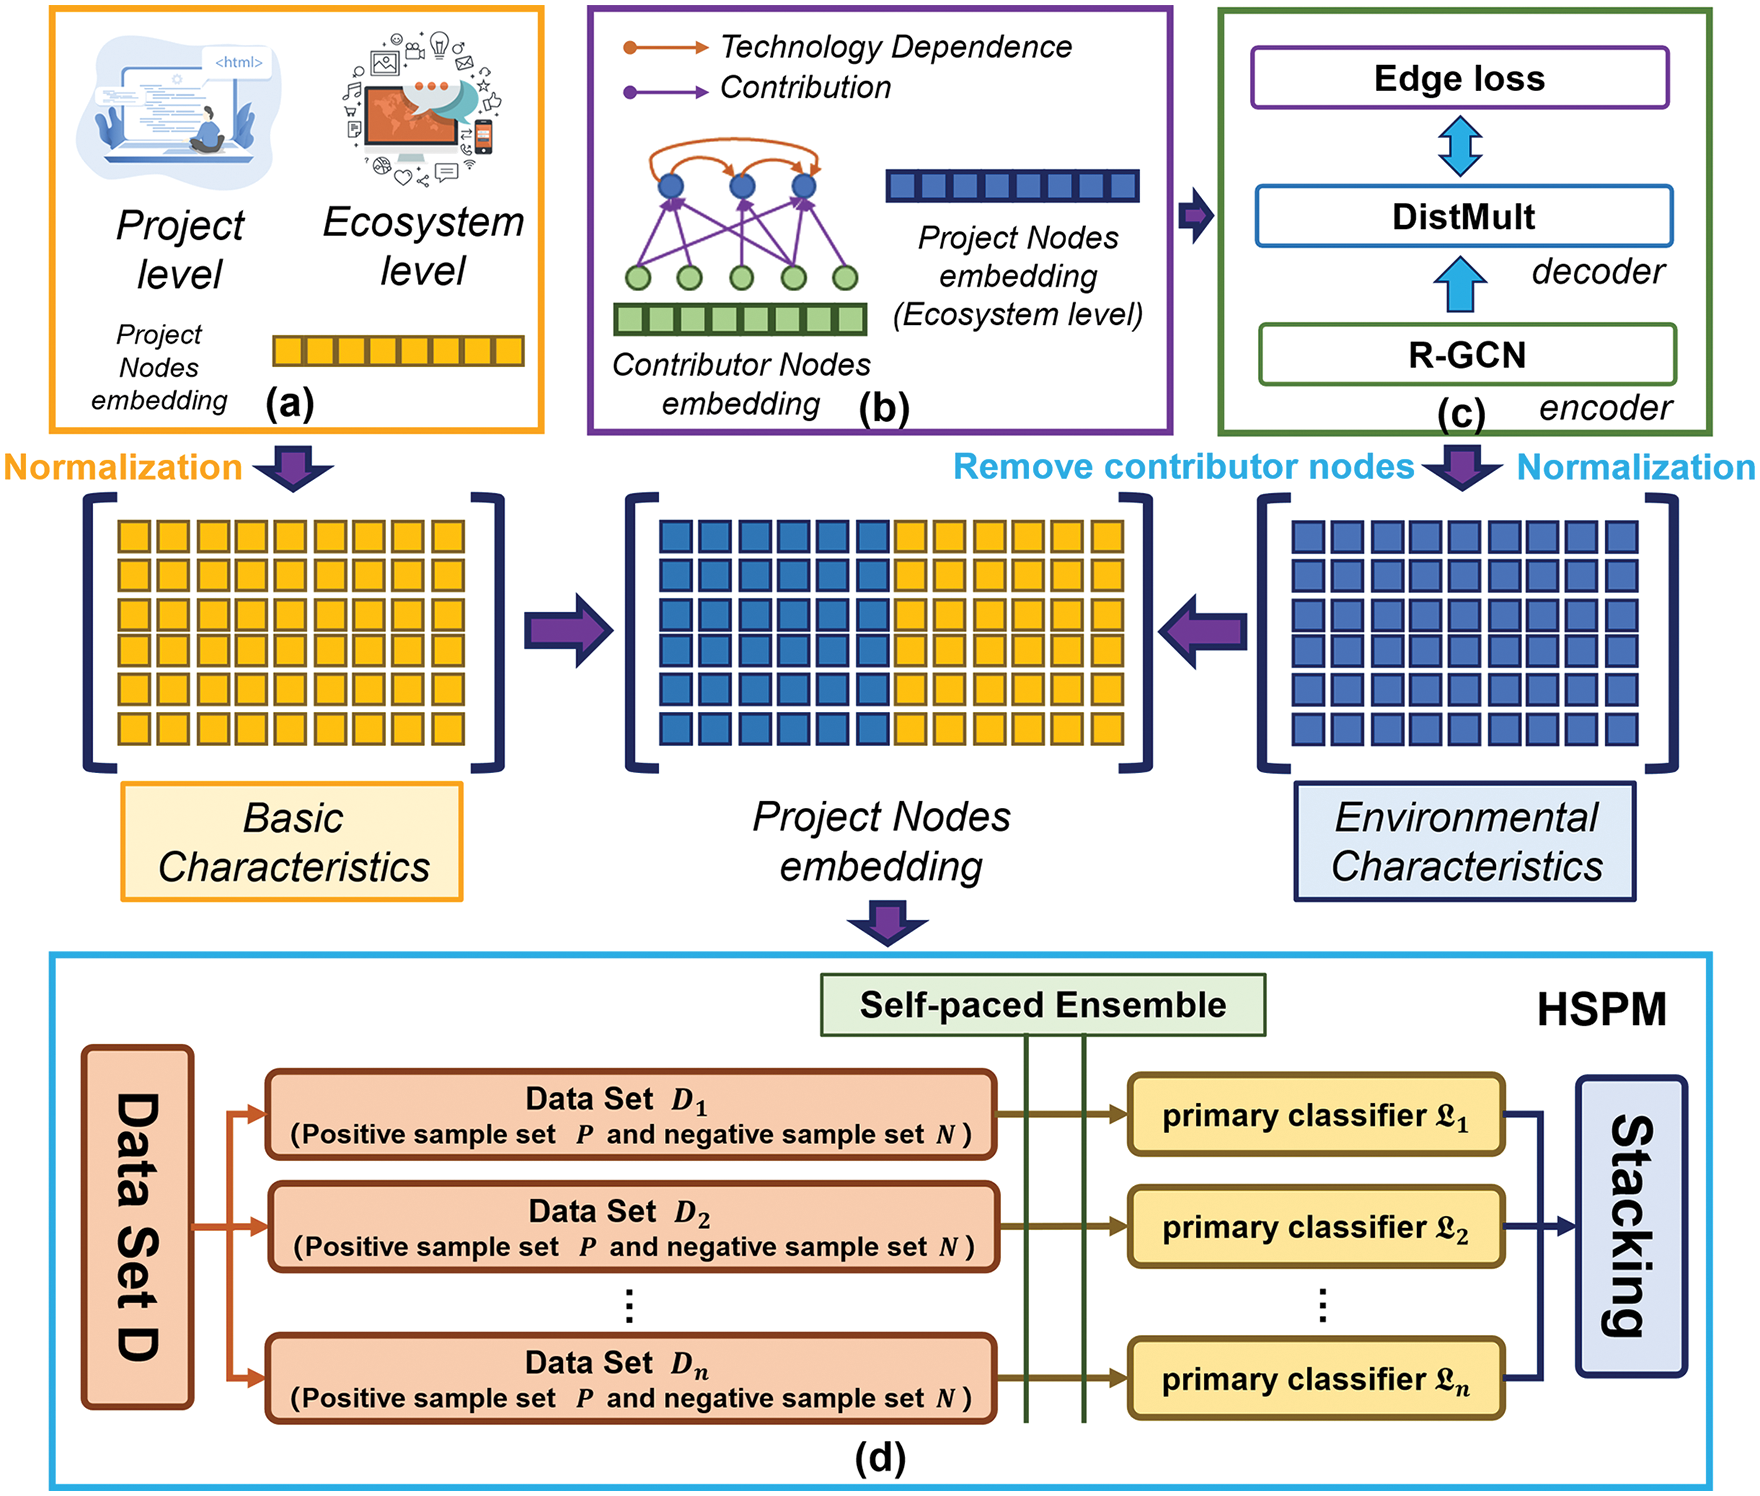
Figure 3: The overall workflow of HSPM
4.1 Determination of the Basic Characteristics of OS Projects
Previous studies have identified large amounts of project attribute and developer behavior data in OS projects that affect these projects’ health. However, it remains to be debated whether these data, as the basic characteristics of the project, will directly impact the OS projects’ survival. Based on this, this paper respectively collects a series of project attribute data and developer behavior data from the project level and the ecosystem level. Then we combine these data with the survival analysis experiment to explore whether the basic characteristics of these projects directly affect the survival of OS projects.
1) Basic characteristics at the project level. The basic characteristics selected in this paper at the project level are derived from the study by Franco-Bedoya et al. [30], which include the following: the formalization of OS projects (whether stored on GitHub, presence of keyword information, presence of a readme file, presence of a separate homepage, presence of a valid open-source license, use of version control to manage project iteration, use of semantic version control for all versions, etc.); stability of OS projects (age of OS projects, whether there are released versions and number of project versions, whether they were created from other fork projects, etc.); popularity of OS projects (number of Stars in projects, number of project subscribers, number of projects forked, etc.); open-source project activity (number of project contributors, amount of project contributions, project response speed, etc.).
2) Basic characteristics at the ecosystem level. In order to select more comprehensive project characteristics from the ecosystem level, the ecosystem network needs to be constructed from the perspectives of technology dependencies and contributor relationships.
a) Technology-dependent Network: The libraries.io Open Data holds the technical dependencies of OS projects, recorded in the project manifest files or readme files. Dependencies between projects can be added manually by users or generated automatically by package managers when OS projects are created and updated. When cleaning the data stored in the Dependencies table, we find that some dependent projects aren’t recorded in the Projects table. If these projects are included in the network, external factors could influence the analysis of the factors affecting the survival of OS projects based on the technology-dependent network. Thus, this kind the dependency relationship needs to be removed first. Secondly, different versions of each OS project rely on the same project repeatedly. For example, the 1.1 and 1.2 versions of an archivist are technically dependent on the project RCurl. For this dependency, the data needs to be merged, and the version information of the OS project must be ignored. So we record that the data for the project archivist technically relies on the project RCurl twice.
Technology-dependent networks can be expressed as
b) Contributor-Project Network: The contributor-project network is a two-mode social network in which nodes represent two different sets, contributors or projects, and the link between the two nodes indicates that the contributor has contributed to the project. This network has the following characteristics:
• Bipartite graph: The contributor node and the project node are two subsets of nodes in the network, and each edge in the network connects nodes from different subsets. This is because, in this case, there is no direct connection between two contributors or two projects.
• Nondirectional feature: In this network, we only focus on which projects are connected by contributors, not on the relationship between projects and contributors.
The contributor-project network can be represented as a graph
After constructing the ecosystem network, we select the following characteristics as the basic characteristics of the project at the ecosystem level. These characteristics are chosen because they can be effectively measured by relevant techniques in complex networks.
a) dead_dependencies: In the OS community, developers can find the development techniques or product features they need in other projects to quickly develop their own projects. However, the downside of this approach is that when one of the projects on which an OS project’s technology depends crashes, this OS project’s survival may be affected.
b) dependency_hierarchy: Valiev et al. [15] stated that OS projects that are further downstream in the project technology-dependent network are more prone to risks. When constructing the open-source project technology-dependent network, it’s observed that the technology-dependent relationship between projects sometimes has more than one layer. Sometimes, there are layers of dependencies where project A depends on project B, and project B depends on project C. In this case, the impact may be transitive when a bug occurs in project C. We divide the level of technology dependency of open-source projects and try to study its influence on the existence of OS projects.
c) direct_technical_importance: OS projects that are further downstream in the project technology-dependent network are more vulnerable. Contrarily, OS projects that are further upstream or depended on by a greater number of projects are more secure because they are more critical. In this paper, the degree centrality of nodes in the technology-dependent network is used to represent the degree of technical importance of OS projects. However, the original definition of degree centrality didn’t consider the edge direction and the edge weight between nodes in the network. To calculate the degree centrality of nodes in technology-dependent networks, we use the JP-Degree centrality method, which takes into account the number of adjacent nodes of projects, the direction of connecting edges, and the weight of edges. The calculation formula of JP-Degree centrality is as follows:
Eq. (3) is the measurement formula of the node degree centrality in undirected weighted networks.
d) indirect_technical_importance: In the technology-dependent network of OS projects, it’s not just direct dependencies that can make a big difference in the life or death of a project. As mentioned in a previous report, a JavaScript package called 11-LOC wasn’t well known in the whole community. But thousands of projects crashed when 11-LOC was removed from the community by developers only because another critical project referred to it [26]. Thus, we use the feature vector centrality of project nodes to represent their indirect technical importance and explore its impact on the survival of OS projects.
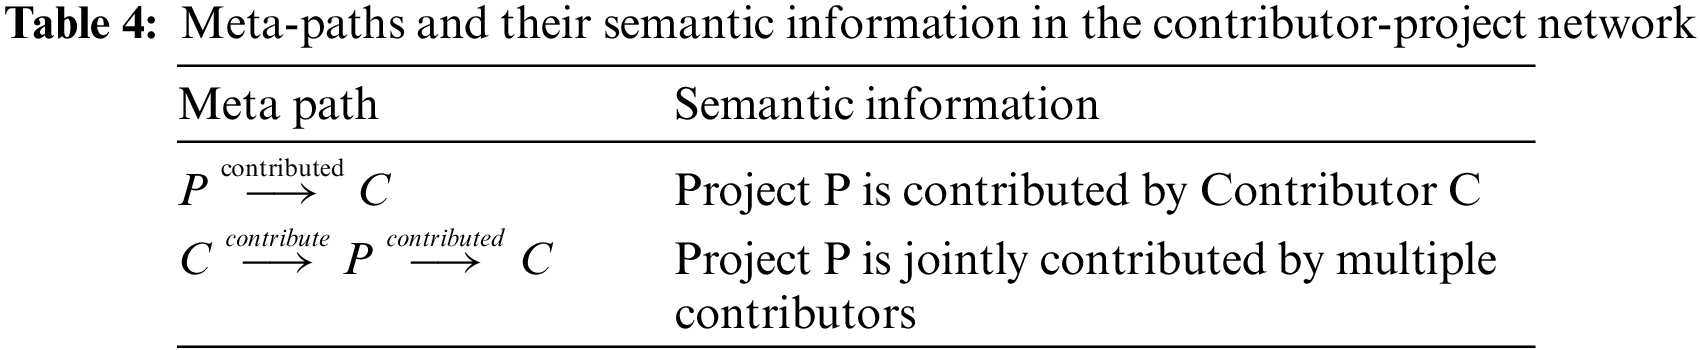
e) social_importance: The contributor-project network constructed in this paper contains two types of nodes, contributor, and project, which can effectively reflect the social relations of the OSSECO. Since the network is a heterogeneous information network in nature, contributor and project nodes cannot be separated when measuring the importance of nodes. Based on the concept of meta-path in heterogeneous information networks, we measure the social importance of OS projects. Different meta-paths can represent different semantic information. If contributors are represented as
In general, OS projects involving high-importance contributors are also important, and there are many contributors within the same open-source ecosystem. On the premise that the contribution behavior of each contributor is equally important, the more the contributors contribute, the more important they are, and each OS project will be participated by multiple contributors. Based on this, this paper measures the social importance of OS projects, as shown in Eq. (5):
f) information_dissemination_capability: We also find that OS projects in the technology-dependent network can be simply divided into four categories according to the input and output of project nodes: I) Only input (only depended on by other projects); II) Both in and out (that is, depended on by other projects and also dependent on other projects); III) Availability only (only dependent on other projects); IV) Completely independent (i.e., not dependent on other projects nor depended on by other projects).
The right side of Fig. 2 shows the results of an OS project survival analysis experiment based on the categories above. Obviously, OS projects that are completely independent have the worst survival state, followed by OS projects that rely solely on other projects. OS projects with both output and input are the best performers when the survival time of the OS project is less than 100 months. In the actual development process, all technical information flows between further upstream and further downstream projects pass through these projects. Thus, we use the mediating centrality of project nodes to represent the information dissemination ability of OS projects and explore its impact on the survival of OS projects.
g) technical_independence: In the complex network, the aggregation coefficient can measure the degree of node aggregation. Meanwhile, the degree of node aggregation can be used to represent the degree of independence and dependence on OS project technology in technology-dependent networks.
h) social_independence: The contributor-project network constructed in this paper can effectively reflect the social relations of the OSSECO, and the aggregation degree of project nodes can indicate the social independence of OS projects. Critically, the heterogeneous information network must be converted into a homogeneous network to assess the independence of projects. In the contributor-project network
3) Identify basic project characteristics that affect the survival of OS projects. In this paper, Cox proportional risk regression model is used to explore the actual impact of project characteristics on the survival state of OS projects. Cox proportional risk regression model is a multi-factor analysis method commonly used in the field of survival analysis, which can analyze the impact of multiple risk factors on the survival probability of OS projects. The Cox proportional risk model is defined as Eq. (8):
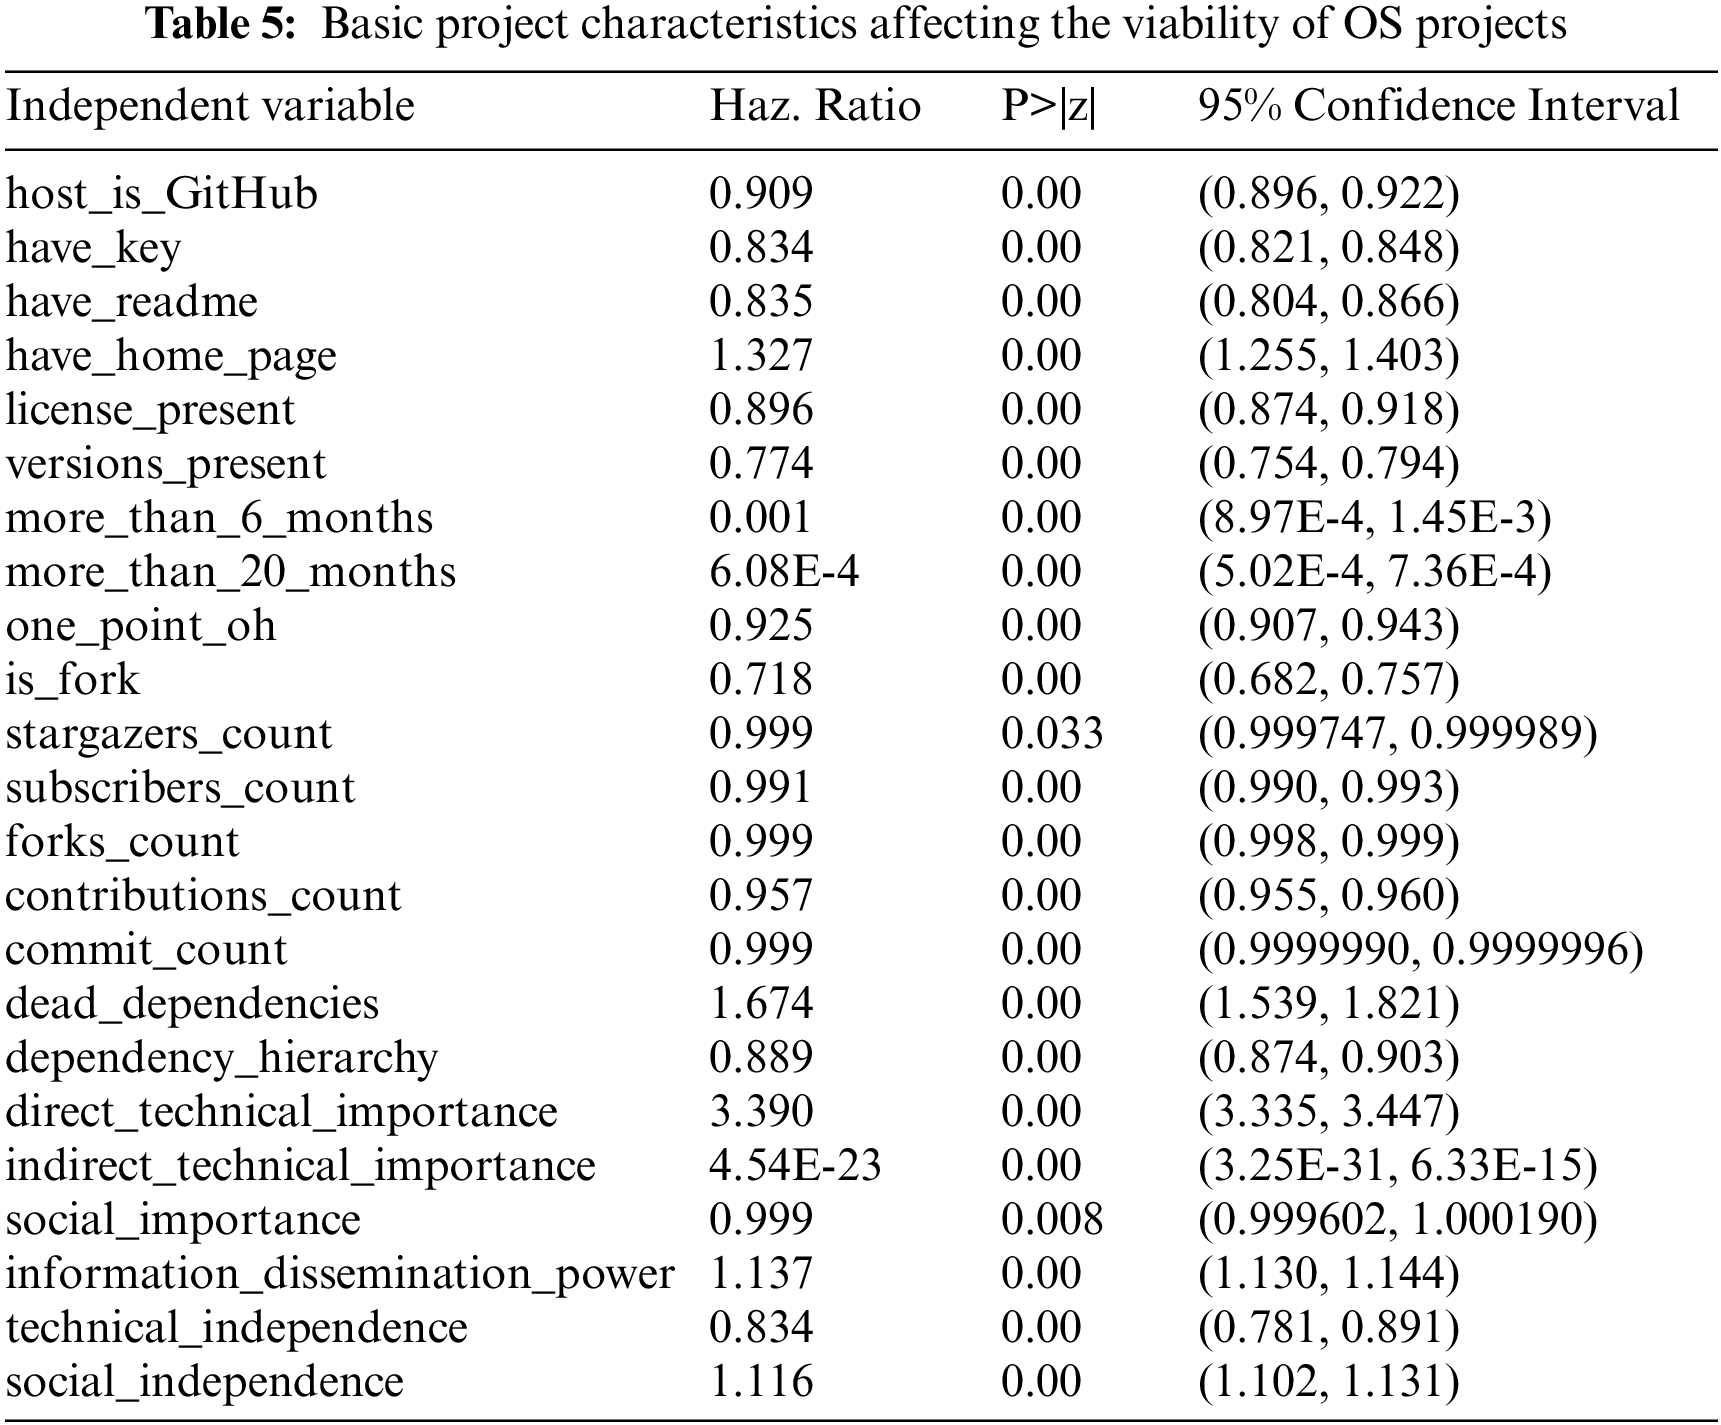
As shown in Table 5, a total of 23 measurable features are found to impact the survival state of OS projects after ignoring collinearity factors and factors that don’t affect the survival of OS projects. There are 15 measurable features at the project level and 8 at the ecosystem level. The Haz. Ratios of these factors are all greater than 0, and values of
4.2 Capture of Environmental Characteristics of Open-Source Project Ecosystem
In Section 4.1, we carry out a detailed analysis of the main factors that affect the survival state of OS projects. At the project level, OS projects have 15 basic attribute features affecting their survival state as independent entities. At the ecosystem level, OS projects have 8 node characteristics that affect their survival state as network nodes. If only the basic features of OS projects are used in the prediction model, the environmental features of the ecosystem where the projects are located may be neglected, and this can affect the accuracy of the survival prediction results. Therefore, this section employs GCNs to extract the environmental characteristics of OS projects.
In the above study, we construct the technology-dependent network and the contributor-project network of OS projects, both of which can reflect a specific relationship between projects in the OSSECO. If we want the network structure characteristics of the whole ecosystem in the past, we need to integrate the two networks to get a complete OS project ecosystem network. Therefore, this section constructs a heterogeneous information network to reflect the relationship between projects and projects and that between projects and contributors in the open-source ecosystem.
Fig. 3b shows an example of an OS ecosystem network as a directed graph
The network structure and node features of the OSSECO are input into the graph encoder composed of GCNs. Each node is mapped to a truth vector
The OS ecosystem network we construct is a directed heterogeneous network, but the traditional GCN model cannot directly solve related problems. Thus, R-GCN [32] model is introduced, which is an optimization model that applies the GCN framework to the directed or undirected network with multiple relations and nodes. The working principle of R-GCN is shown in Eq. (9):
The R-GCN model updates nodes’ representation by gathering information from nearby nodes with different relationships. The information is aggregated based on edge types, then transformed and passed through an activation function to get the node representation. Notably, the update uses shared parameters for each node, including self-connection, and the computation is done in parallel. To predict links, a DistMult layer is stacked on top of the R-GCN layer. The DistMult layer reconstructs network edges based on the node representations obtained from the R-GCN layer. The model trains using negative sampling and cross-entropy loss (refers to [33]) to score observable triplets higher than negative ones.
4.3 Construction of Open-Source Project Survival Prediction Model
In the survival analysis experiment, we find that the proportion of OS projects that are “alive” versus “dead” is around 1:4. As a result, imbalanced samples will occur when training the prediction model with this dataset. So properly solving the imbalance of positive and negative samples is the key to constructing the OS project survival prediction model. Meanwhile, homogeneous “individual learners” can be chosen in common ensemble learning methods for model integration. However, using homogeneous “individual learners” in binary classification problems may lead to a low diversity of model integration. To solve these problems, we first iterate the basic model on the serial link to get a primary classifier to solve the problem of unbalanced sample data. Then several primary classifiers with low correlation are trained on parallel links to solve the problem of insufficient diversity in ensemble learning. Finally, the combined strategy is used to output a secondary classifier as the final prediction model. The novelty of this model is its ability to effectively address the challenges of sample imbalance and integration diversity in the prediction model with the use of two-layer ensemble learning. The model structure is shown in Fig. 3d.
1) Training strategy for the primary classifiers: The problem of sample imbalance needs to be solved in the training process of the primary classifiers. And there are many solutions to the problem of unbalanced sample data. The simplest one is to solve the problem directly from the data level by over-sampling, under-sampling, or random sampling. In addition, labeled weight models can also be used for training. For example, the scale_pos_weight parameter in XGBoost can be used to adjust the proportion of positive and negative samples to help the model get better training convergence when samples are not balanced. However, the prediction model proposed in this paper focuses more on the determination of “dead” projects, which constitute the majority of the samples. Therefore, we can refer to the Self-paced Ensemble algorithm to solve the sample imbalance problem when training the primary classifier.
2) Training strategy for the secondary classifiers: The training of the secondary classifiers mainly needs to solve the problem of insufficient diversity of “individual learners” in ensemble learning. The concept of “individual learner” diversity is easy to understand, that is, the differences between “individual learners”. Previous studies showed that the errors of “individual learners” will accumulate after integration, and Eq. (10) is the formula for calculating the expected cumulative errors of the integration model.
In practice, it’s challenging to get the “individual learner” with high diversity on the same task and training set. Even if various “individual learners” are obtained through some strategies, the performance of these learners isn’t often optimal under the task, and the performance of the ensemble model still cannot be effectively improved. To solve this problem, we divide the data in the original dataset into
Since the survival state of OS projects is divided into two categories: “dead” and “alive”, the survival prediction of OS projects can be transformed into a binary classification problem. Therefore, we adopt the most commonly used metric indicators in binary classification problems, including Recall, Precision, Accuracy, F-measure, ROC curve, and AUC, to evaluate the prediction model.
In previous studies, few scholars explored the survival state of OS projects from the perspective of the ecosystem, and no one applied the characteristics of the ecosystem environment of OS projects to predict the survival state of OS projects. Therefore, we design a hybrid structure prediction model (HSPM) based on the ecosystem boundary. This section focuses on the following questions:
Question 1: Can ecosystem-level influence factors effectively improve the accuracy of open-source project survival state prediction?
Question 2: Does the HSPM prediction model perform better than the traditional prediction model in the dataset used in this paper?
Question 3: Is the feature extraction module for the open-source project ecosystem environment designed in this paper effective?
All experiments are conducted on a workstation with the Intel(R) Xeon(R) Silver 4210 CPU, the NVIDIA GTX2080TI GPU, 256 GB memory, and 8 TB hard disk. The whole experiment process takes about 71 min to train the R-GCN, 54 min to train the primary classifiers, and 40.8 min for ensemble learning. Thus, the time complexity of the entire pipeline is about 165 min. Next, the corresponding experimental analysis will be carried out for the above three problems.
To answer question 1, we use XGBoost to calculate the importance of 23 measurable features. And the experimental results are shown in Fig. 4 that all of the 23 measurable features identified in this paper are necessary for predicting the survival state of OS projects.
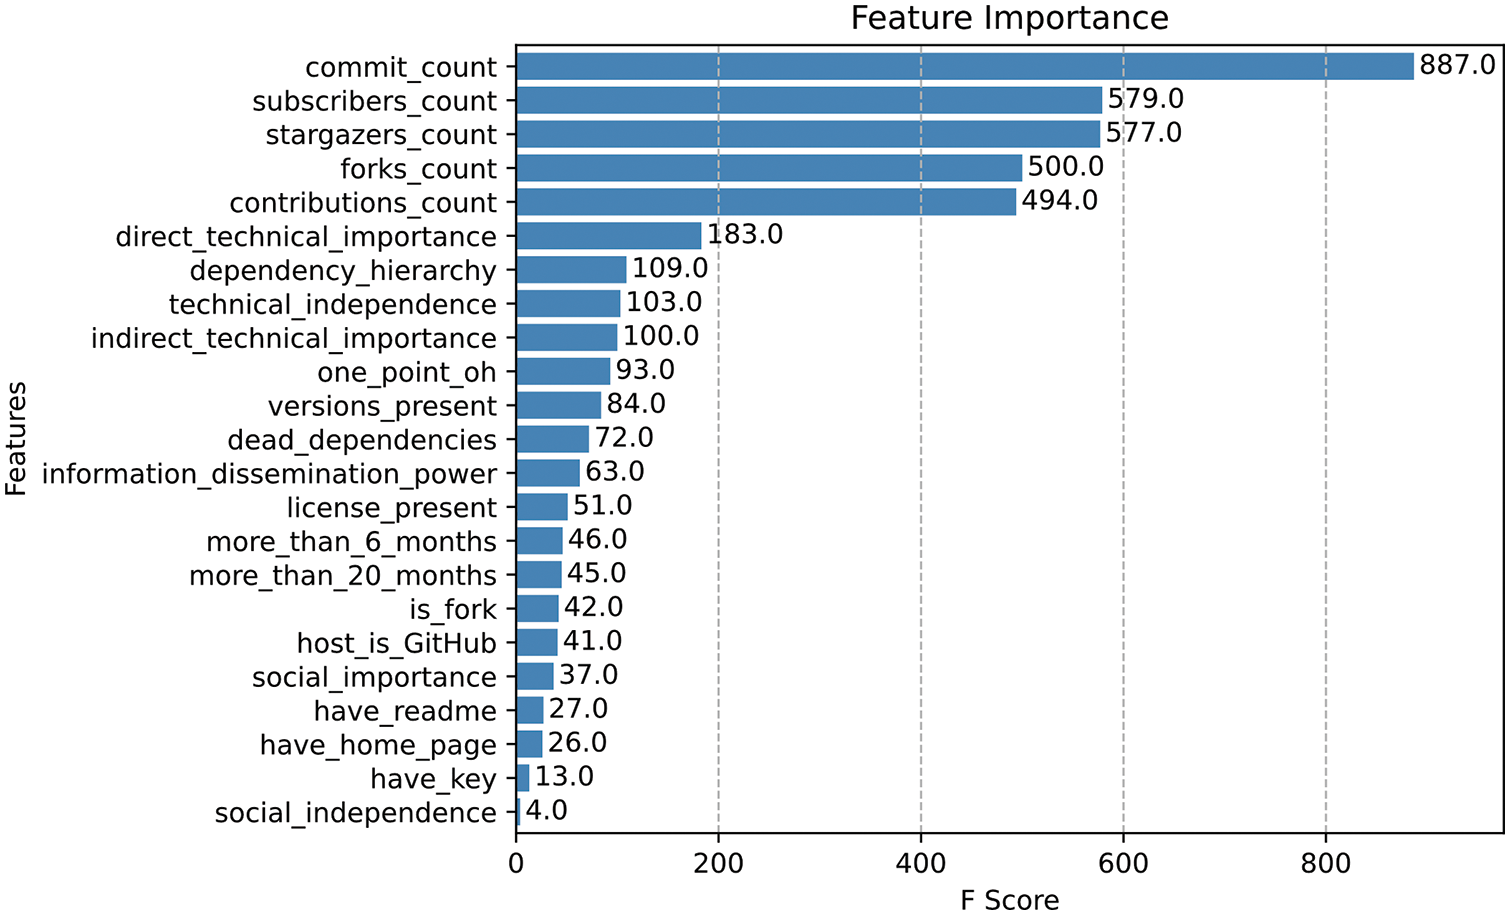
Figure 4: Importance ranking of model features
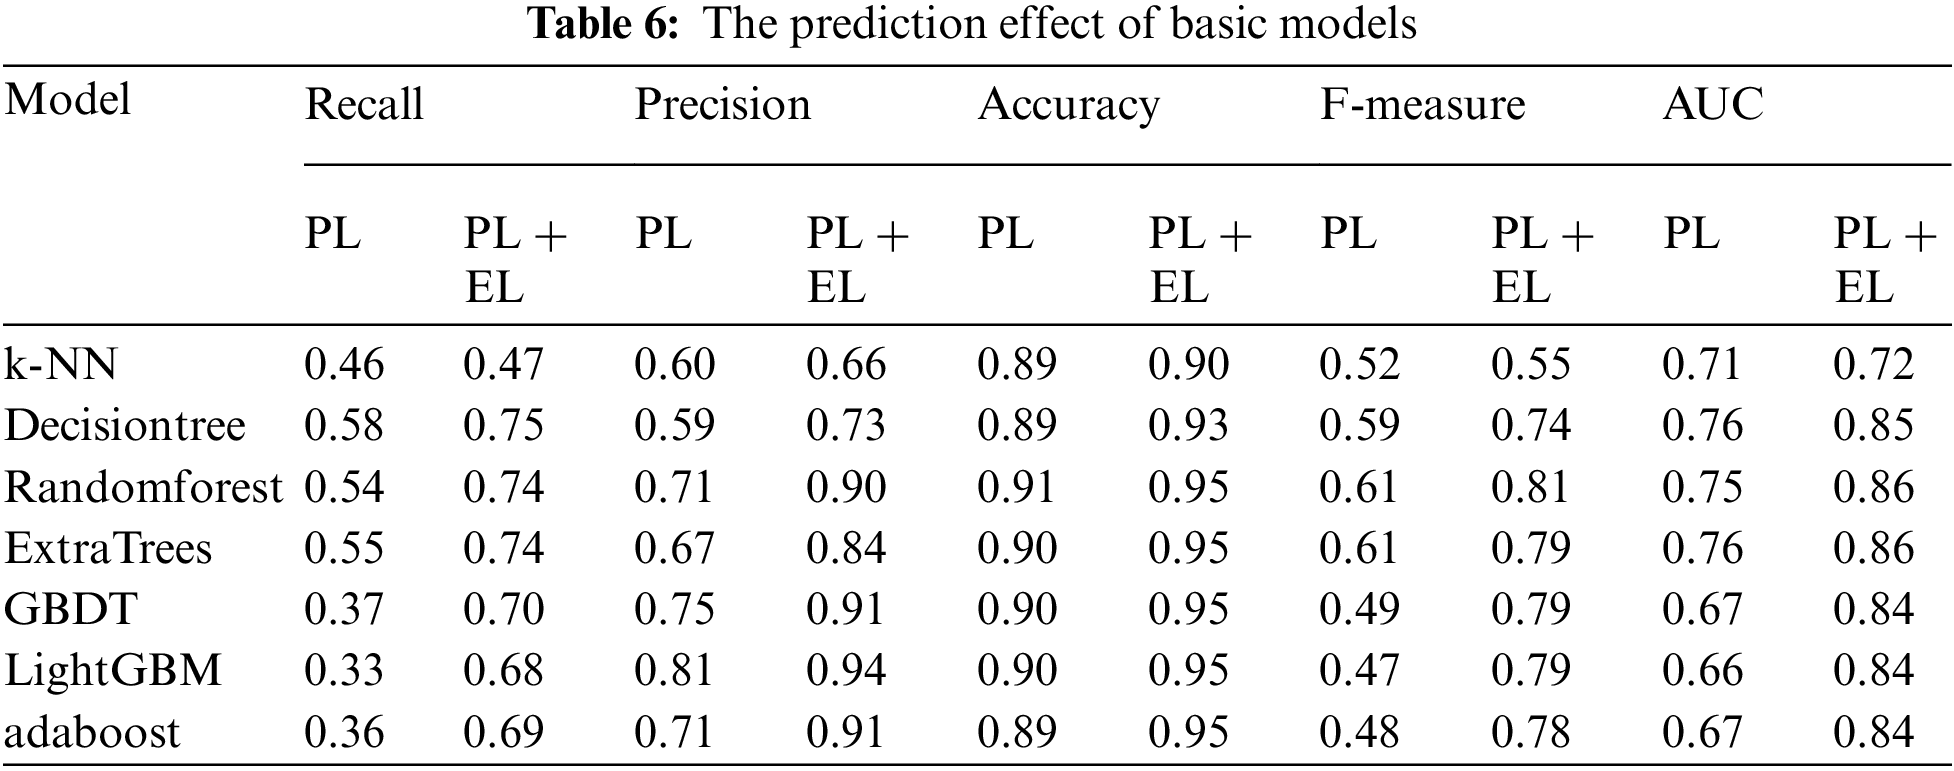
Then, we respectively input project-level (PL) measurable features and project-level + ecosystem-level (PL + EL) measurable features into traditional machine learning models to explore whether the ecosystem-level factors identified in this paper have an impact on predicting the survival state of OS projects. In this paper, 7 traditional machine learning models are selected, including k-NN, decision tree, random forest, ExtraTrees, GBDT, LightGBM, and Adaboost. Fig. 5a illustrates the ROC curves of 7 machine learning models at the project level and the ecosystem level. And Table 6 shows the specific performance of the 7 machine learning models above on recall, precision, accuracy, F-measure, and AUC at the project level and the ecosystem level.
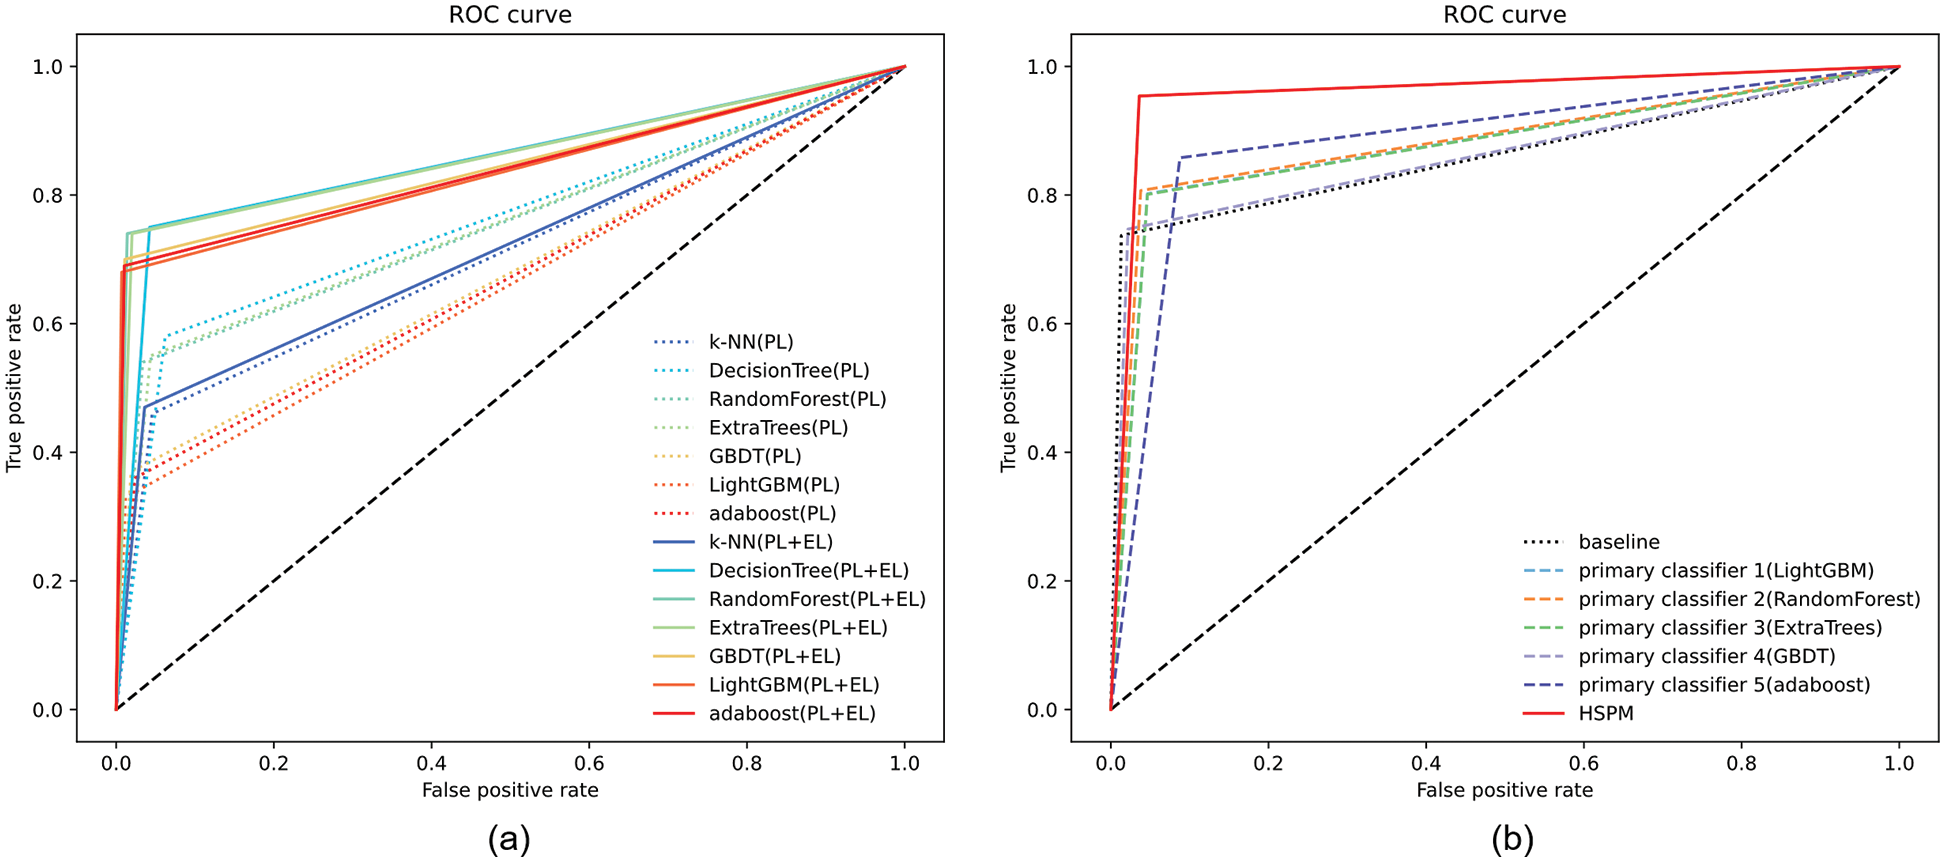
Figure 5: Comparison of ROC curves of basic models (a); ROC curves of the HSPM prediction model (b)
Answer 1: All 23 basic characteristics of OS projects selected in this paper are deemed significant in predicting project survival. These features can effectively help project managers avoid the risk of project death. And the basic characteristics of projects at the ecosystem level we identify can effectively improve the performance of OS project survival prediction models.
Fig. 5a shows that the ROC curves of the 7 machine learning models both at the project level and the ecosystem level are significantly better than those only at the project level (In the figure, dotted lines represent the ROC curves of 7 machine learning models at project-level, and solid lines represent the ROC curves at project-level + ecosystem-level). Obviously, DecisionTree is the most effective model, while k-NN is the least. Therefore, we choose DecisionTree as the baseline and select five other models, apart from k-NN and DecisionTree, as the primary classifiers (LightGBM, RandomForest, ExtraTrees, GBDT, and Adaboost in order). Table 6 also indicates that the recall, precision, accuracy, F-measure, and AUC of the 7 machine learning models at both levels are higher than those only at the project level.
To answer question 2, we conduct a comparative analysis of the performance of the HSPM prediction model against that of the optimal basic model identified in the first experiment, as well as five primary classifiers, in an effort to evaluate the validity of the ecosystem survival prediction model based on the hybrid structure proposed in this paper. The experimental results are shown in Table 7.
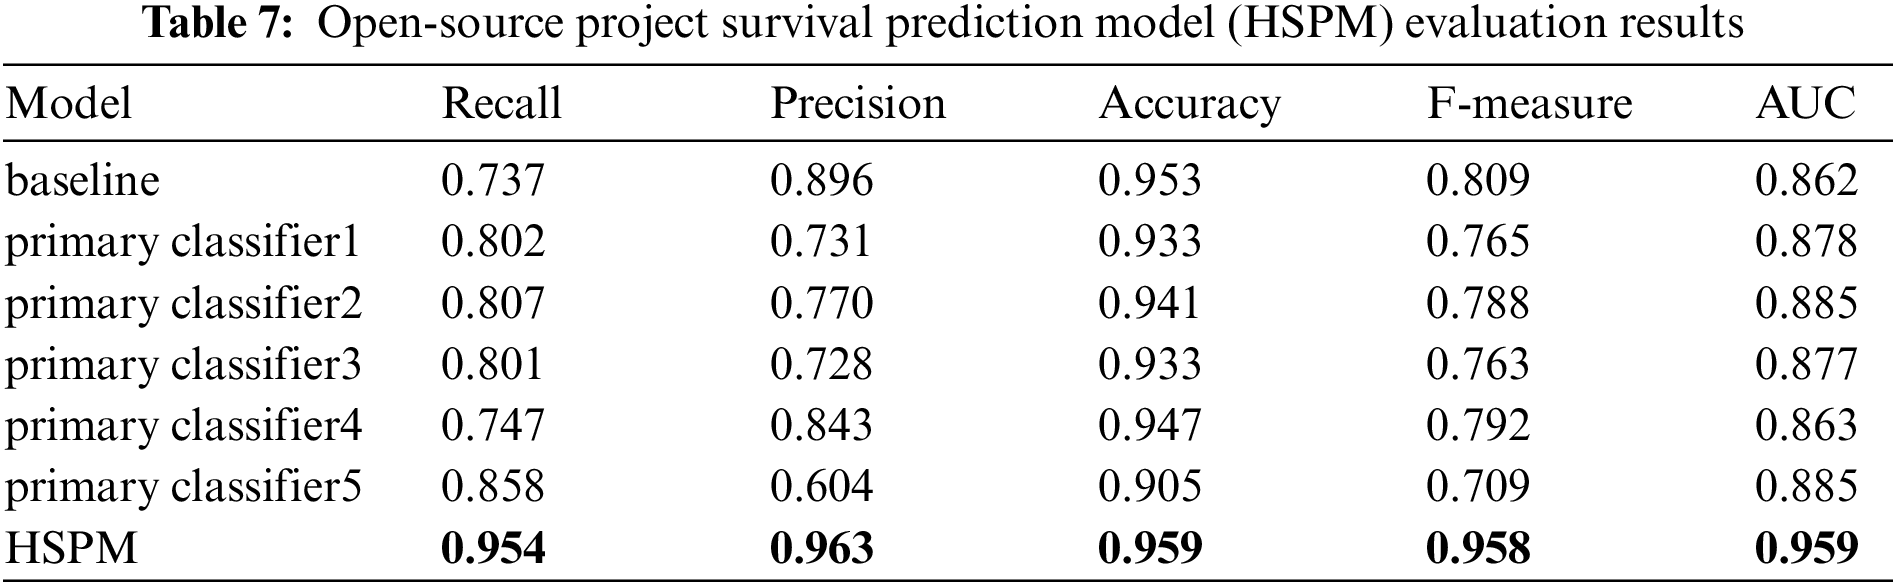
Answer 2: The HSPM prediction model finally obtained in this paper performs better than the traditional prediction model on the dataset used in this paper, showing that HSPM can help project managers get an accurate picture of the survival state of OS projects.
Table 7 illustrates that the performance of five primary classifiers is not as good as that of traditional machine learning algorithms. However, in terms of evaluation indexes such as recall, precision, accuracy, F-measure, and AUC, the HSPM prediction model demonstrates superior performance. It can be seen from Fig. 5b that the ROC curve of the HSPM prediction model performs the best compared with the traditional machine learning model (baseline) and the primary classifiers. Based on this, it’s clear that the OS project survival prediction model (HSPM) proposed in this paper can effectively predict the survival state of OS projects and has a significant improvement over the traditional machine learning algorithms.
It’s worth mentioning the failure case of the HSPM model. For example, we find that Project react-fetch is marked as “dead” by the model, but it’s actually “alive”. Further analysis shows that this project was wrongly linked to a repository (Legitcode/react-fetch) that hasn’t been updated for a long time. The project was actually moved to another repository (Facebook/react), which was being updated regularly. This finding highlights the need to study the effect of such changes on the survival of a project.
To answer question 3, we combine ecosystem environment characteristics with basic project features and input them into the OS project survival prediction model to evaluate the effectiveness of the open-source ecosystem network structure module. The experimental results are shown in Table 8.
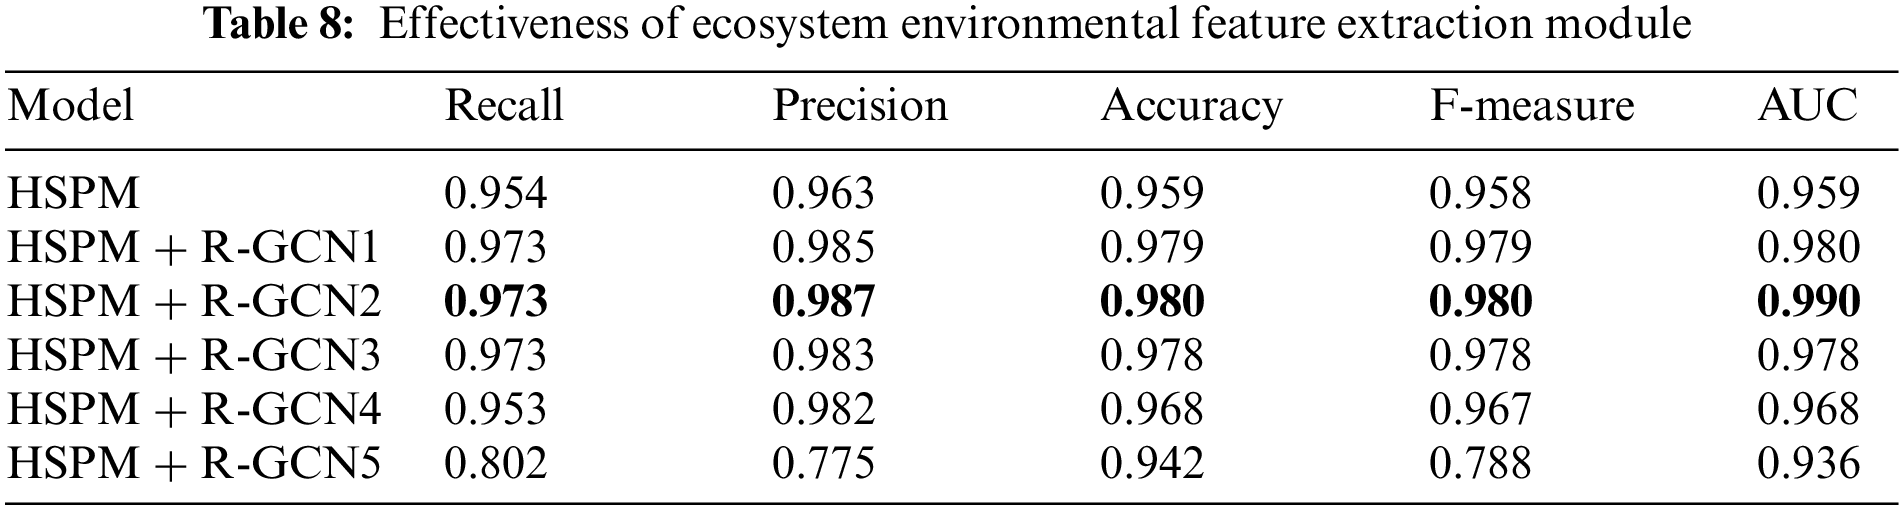
Answer 3: The environmental feature extraction module designed in this paper is extremely effective. The performance of the HSPM is further improved after the addition of ecosystem environment characteristics.
We design an OS project survival prediction model based on a hybrid structure called HSPM. With the selection of basic classifiers and the combination strategy, the HSPM model solves the problems of sample imbalance and the lack of integration diversity in predicting the OS project survival state. Firstly, HSPM iterates the basic machine learning model on the serial link to obtain the primary classifier to solve the problem of unbalanced sample data. Secondly, to solve the problem of insufficient ensemble diversity in ensemble learning, several primary classifiers with low correlation are trained on parallel links, and secondary classifiers are output by stacking strategy. Experimental results show that the HSPM model performs better than the traditional machine learning models in each evaluation metric.
Furthermore, only entering the basic features of OS projects can lead to the loss of the characteristics of the ecosystem environment in which OS projects are located. Therefore, we use GCNs to obtain the ecosystem environment characteristics of OS projects, that is, the network structure characteristics of the OSSECO. In this paper, the basic features of OS projects and the network characteristics of the ecosystem are input into a graph encoder composed of R-GCN to integrate node features and network structure features. Meanwhile, DistMult is used as a decoder to reconstruct the edge of the OS ecosystem network according to the node representation vector so as to continuously optimize the learning results of R-GCN. Then, the contributor nodes are deleted from the finally learned graph to obtain feature vectors with only project nodes. Later, the measurable features impacting the project survival are fused with the normalized data, and this composite input is then utilized as the input for the classifier component of the HSPM model to predict the survival state of OS projects. The final experiment shows that the performance of the OS project survival prediction model is further improved after the ecosystem-level features are added.
The main threat to construct validity is the particular encoder-decoder architecture we adopt in this paper. We select R-GCN as the autoencoder because it can apply GCN framework to the directed or undirected network with multiple relations and nodes, and we choose DisMult as the decoder because it was used to reconstruct the edges of the open-source ecosystem network to continuously optimize the R-GCN learning result. However, other architectures may have their own strengths, and as future work, we will test and compare other encoder-decoder architectures, such as Graph Neural Networks (GNN) with masked generative reconstruction [34], to see how they perform and to provide a more comprehensive understanding of the strengths and limitations of different architectures for this task.
Threats to internal validity related to internal factors of our evaluation that could have an impact on the results. One possible threat is the way in which we select the baseline. By conducting a comparative analysis of the performance of the 7 traditional machine learning models, we choose the optimal model as the baseline. Another threat may be that we don’t migrate our dataset to other advanced methods. Due to inconsistent datasets and different classification criteria for project survival state, we cannot fairly compare other state-of-the-art approaches with our method. Thus, we will unify the form of input data and the standards of classification and add a comparison to strongly prove the superiority of the HSPM model.
The threat to external validity is that we only select OS projects published in eight package managers, including CRAN, Dub, Elm, NuGet, NPM, Packagist, PyPI, and RubyGems. Although the amount of data is large enough, it is still necessary to continue to expand the research boundary facing the huge open-source world and obtain more open-source data to analyze the survival state of OS projects in other ecosystems. In future work, we will combine project data from code hosting platforms (GitHub, GitLab, and Bitbucket, etc.) and community Q&A platforms (for example, Stack Overflow) to train open-source project survival prediction models that can be applied to various platforms.
In this paper, we propose a hybrid structured prediction model, namely HSPM, to predict the survival state of OS projects both from the project and ecosystem perspectives. Moreover, HSPM solves the problems of sample imbalance and the lack of integration diversity in the prediction of the OS project survival state from the selection of the basic classifier and combination strategy. The experimental results show that the ecosystem environment features of OS projects are helpful for the prediction model, and HSPM performs better than the traditional machine learning models in each evaluation metric. In the future, we will try other advanced encoder-decoder architectures to get better performance and combine project data from different platforms to make the HSPM model widely available. The source code of HSPM can be found at the following website: https://github.com/Dandelion-F/HSPM.
Acknowledgement: This work was supported by the National Social Science Foundation (NSSF) Research on intelligent recommendation of multi-modal resources for children’s graded reading in smart library (22BTQ033), and the Science and Technology Research and Development Program Project of China railway group limited (Project No. 2021-Special-08).
Funding Statement: This work was supported by the National Social Science Foundation (NSSF) Research on intelligent recommendation of multi-modal resources for children’s graded reading in smart library (22BTQ033), and the Science and Technology Research and Development Program Project of China railway group limited (Project No. 2021-Special-08).
Conflicts of Interest: The authors have no conflicts of interest to report regarding the present study.
References
1. GitHub, “GitHub 2022 annual summary,” 2022. [Online]. Available: https://octoverse.github.com/ [Google Scholar]
2. D. Izquierdo-Cortazar, N. Sekitoleko, J. M. Gonzalez-Barahona and L. Kurth, “Using metrics to track code review performance,” in Proc. of the 21st Int. Conf. on Evaluation and Assessment in Software Engineering, Karlskrona, Sweden, pp. 214–223, 2017. [Google Scholar]
3. M. Ortu, G. Destefanis, M. Kassab and M. Marchesi, “Measuring and understanding the effectiveness of JIRA developers communities,” in 2015 IEEE/ACM 6th Int. Workshop on Emerging Trends in Software Metrics, Florence, Italy, pp. 3–10, 2015. [Google Scholar]
4. J. Aué, M. Haisma, K. F. Tómasdóttir and A. Bacchelli, “Social diversity and growth levels of open source software projects on GitHub,” in Proc. of the 10th ACM/IEEE Int. Symp. on Empirical Software Engineering and Measurement, Ciudad Real, Spain, pp. 1–6, 2016. [Google Scholar]
5. L. Madeyski and M. Kawalerowicz, “Continuous defect prediction: the idea and a related dataset,” in 2017 IEEE/ACM 14th Int. Conf. on Mining Software Repositories (MSR), Buenos Aires, Argentina, pp. 515–518, 2017. [Google Scholar]
6. Z. Liao, Y. Zhao, S. Liu, Y. Zhang, L. Liu et al., “The measurement of the software ecosystem’s productivity with GitHub,” Computer Systems Science and Engineering, vol. 36, no. 1, pp. 239–258, 2021. [Google Scholar]
7. V. K. Eluri, S. Sarkani and T. Mazzuchi, “Open source software survivability prediction using multi layer perceptron,” in Proc. of 28th Int. Conf. on Software Engineering and Data Engineering, San Diego, California, USA, pp. 148, 2019. [Google Scholar]
8. K. Osman and O. Baysal, “Health is wealth: Evaluating the health of the Bitcoin ecosystem in GitHub,” in 2021 IEEE/ACM 4th Int. Workshop on Software Health in Projects, Ecosystems and Communities (SoHeal), Madrid, Spain, pp. 1–8, 2021. [Google Scholar]
9. J. Linåker, E. Papatheocharous and T. Olsson, “How to characterize the health of an open source software project? a snowball literature review of an emerging practice,” in The 18th Int. Symp. on Open Collaboration, Madrid, Spain, pp. 1–12, 2022. [Google Scholar]
10. T. Xia, W. Fu, R. Shu, R. Agrawal and T. Menzies, “Predicting health indicators for open source projects (using hyperparameter optimization),” Empirical Software Engineering, vol. 27, no. 6, pp. 122, 2022. [Google Scholar]
11. L. Lavazza, E. Frumento and R. Mazza, “Defining and evaluating software project success indicators: A GQM-based case study,” in 2015 10th Int. Joint Conf. on Software Technologies (ICSOFT), Colmar, France, vol. 1, pp. 1–12, 2015. [Google Scholar]
12. L. Wang, J. Wan and X. Gao, “Toward the health measure for open source software ecosystem via projection pursuit and real-coded accelerated genetic,” IEEE Access, vol. 7, pp. 87396–87409, 2019. [Google Scholar]
13. S. Goggins, K. Lumbard and M. Germonprez, “Open source community health: Analytical metrics and their corresponding narratives,” in 2021 IEEE/ACM 4th Int. Workshop on Software Health in Projects, Ecosystems and Communities (SoHeal), Madrid, Spain, pp. 25–33, 2021. [Google Scholar]
14. U. Raja and M. J. Tretter, “Defining and evaluating a measure of open source project survivability,” IEEE Transactions on Software Engineering, vol. 38, no. 1, pp. 163–174, 2012. [Google Scholar]
15. M. Valiev, B. Vasilescu and J. Herbsleb, “Ecosystem-level determinants of sustained activity in open-source projects: A case study of the PyPI ecosystem,” in Proc. of the 2018 26th ACM Joint Meeting on European Software Engineering Conf. and Symposium on the Foundations of Software Engineering, Lake Buena Vista, Florida, USA, pp. 644–655, 2018. [Google Scholar]
16. Z. Liao, L. Deng, X. Fan, Y. Zhang, H. Liu et al., “Empirical research on the evaluation model and method of sustainability of the open source ecosystem,” Symmetry, vol. 10, no. 12, pp. 747, 2018. [Google Scholar]
17. Z. Liao, B. Zhao, S. Liu, H. Jin, D. He et al., “A prediction model of the project life-span in open source software ecosystem,” Mobile Networks and Applications, vol. 24, no. 4, pp. 1382–1391, 2019. [Google Scholar]
18. L. Yin, Z. Chen, Q. Xuan and V. Filkov, “Sustainability forecasting for Apache incubator projects,” in Proc. of the 29th ACM Joint Meeting on European Software Engineering Conf. and Symposium on the Foundations of Software Engineering, Athens, Greece, pp. 1056–1067, 2021. [Google Scholar]
19. S. Pervaiz, Z. Ul-Qayyum, W. H. Bangyal, L. Gao and J. Ahmad, “A systematic literature review on particle swarm optimization techniques for medical diseases detection,” Computational and Mathematical Methods in Medicine, vol. 2021, no. 5, pp. 1–10, 2021. [Google Scholar]
20. W. H. Bangyal, N. U. Rehman, A. Nawaz, K. Nisar, Ag. A. Ag. Ibrahim et al., “Constructing domain ontology for alzheimer disease using deep learning based approach,” Electronics, vol. 11, no. 12, pp. 1890, 2022. [Google Scholar]
21. Y. Tang, Z. Pan, W. Pedrycz, F. Ren and X. Song, “Viewpoint-based kernel fuzzy clustering with weight information granules,” IEEE Transactions on Emerging Topics in Computational Intelligence, pp. 1–15, 2022. https://doi.org/10.1109/TETCI.2022.3201620 [Google Scholar]
22. Y. M. Tang, L. Zhang, G. Q. Bao, F. J. Ren and W. Pedrycz, “Symmetric implicational algorithm derived from intuitionistic fuzzy entropy,” Iranian Journal of Fuzzy Systems, vol. 19, no. 4, pp. 27–44, 2022. [Google Scholar]
23. W. H. Bangyal, K. Nisar, A. B. Ag Ibrahim, M. R. Haque, J. J. P. C. Rodrigues et al., “Comparative analysis of low discrepancy sequence-based initialization approaches using population-based algorithms for solving the global optimization problems,” Applied Sciences, vol. 11, no. 16, pp. 7591, 2021. [Google Scholar]
24. J. Coelho and M. T. Valente, “Why modern open source projects fail,” in Proc. of the 2017 11th Joint Meeting on Foundations of Software Engineering, Paderborn, Germany, pp. 186–196, 2017. [Google Scholar]
25. J. Coelho, M. T. Valente, L. L. Silva and E. Shihab, “Identifying unmaintained projects in github,” in Proc. of the 12th ACM/IEEE Int. Symp. on Empirical Software Engineering and Measurement, Oulu, Finland, pp. 1–10, 2018. [Google Scholar]
26. J. Coelho, M. T. Valente, L. Milen and L. L. Silva, “Is this GitHub project maintained? measuring the level of maintenance activity of open-source projects,” Information and Software Technology, vol. 122, no. 1, pp. 106274, 2020. [Google Scholar]
27. A. Lustosa and T. Menzies, “Optimizing predictions for very small data sets: A case study on open-source project health prediction,” 2023. [Google Scholar]
28. D. Robinson, K. Enns, N. Koulecar and M. Sihag, “Two approaches to survival analysis of open source python projects,” in Proc. of the 30th IEEE/ACM Int. Conf. on Program Comprehension, Virtual Event, pp. 660–669, 2022. [Google Scholar]
29. G. Avelino, E. Constantinou, M. T. Valente and A. Serebrenik, “On the abandonment and survival of open source projects: an empirical investigation,” in 2019 ACM/IEEE Int. Symp. on Empirical Software Engineering and Measurement (ESEM), Recife, Brazil, pp. 1–12, 2019. [Google Scholar]
30. O. Franco-Bedoya, D. Ameller, D. Costal and X. Franch, “Open source software ecosystems: A systematic mapping,” Information and Software Technology, vol. 91, no. 11, pp. 160–185, 2017. [Google Scholar]
31. G. Zhao, P. Jia, A. Zhou and B. Zhang, “InfGCN: Identifying influential nodes in complex networks with graph convolutional networks,” Neurocomputing, vol. 414, no. 11, pp. 18–26, 2020. [Google Scholar]
32. T. Thanapalasingam, L. van Berkel, P. Bloem and P. Groth, “Relational graph convolutional networks: A closer look,” PeerJ Computer Science, vol. 8, no. 5, pp. e1073, 2022. [Google Scholar] [PubMed]
33. M. Schlichtkrull, T. N. Kipf, P. Bloem, R. Van Den Berg, I. Titov et al., “Modeling relational data with graph convolutional networks,” in European semantic web conf., Heraklion, Crete, pp. 593–607, 2018. [Google Scholar]
34. Z. Hou, X. Liu, Y. Cen, Y. Dong, H. Yang et al., “GraphMAE: self-supervised masked graph autoencoders,” in Proc. of the 28th ACM SIGKDD Conf. on Knowledge Discovery and Data Mining, Washington, D.C., USA, pp. 594–604, 2022. [Google Scholar]
Cite This Article
 Copyright © 2023 The Author(s). Published by Tech Science Press.
This work is licensed under a Creative Commons Attribution 4.0 International License , which permits unrestricted use, distribution, and reproduction in any medium, provided the original work is properly cited.
 Downloads
 Citation Tools