
 Submit a Paper
 Propose a Special lssue
 Open Access
ARTICLE

Identifying Severity of COVID-19 Medical Images by Categorizing Using HSDC Model
Department of Computing Technologies, School of Computing, SRM Institute of Science and Technology, Kattankulathu, Chennai, Chengalpattu, Tamilnadu, 603203, India
* Corresponding Author: K. Ravishankar. Email:
Computer Systems Science and Engineering 2023, 47(1), 613-635. https://doi.org/10.32604/csse.2023.038343
Received 08 December 2022; Accepted 20 March 2023; Issue published 26 May 2023
 View Full Text
 Download PDF
Abstract
Since COVID-19 infections are increasing all over the world, there is a need for developing solutions for its early and accurate diagnosis is a must. Detection methods for COVID-19 include screening methods like Chest X-rays and Computed Tomography (CT) scans. More work must be done on preprocessing the datasets, such as eliminating the diaphragm portions, enhancing the image intensity, and minimizing noise. In addition to the detection of COVID-19, the severity of the infection needs to be estimated. The HSDC model is proposed to solve these problems, which will detect and classify the severity of COVID-19 from X-ray and CT-scan images. For CT-scan images, the histogram threshold of the input image is adaptively determined using the ICH Swarm Optimization Segmentation (ICHSeg) algorithm. Based on the Statistical and Shape-based feature vectors (FVs), the extracted regions are classified using a Hybrid model for CT images (HSDC-CT) algorithm. When the infections are detected, it’s classified as Normal, Moderate, and Severe. A fused FHI is formed for X-ray images by extracting the features of Histogram-oriented gradient (HOG) and Image profile (IP). The FHI features of X-ray images are classified using Hybrid Support Vector Machine (SVM) and Deep Convolutional Neural Network (DCNN) HSDC-X algorithm into COVID-19 or else Pneumonia, or Normal. Experimental results have shown that the accuracy of the HSDC model attains the highest of 94.6 for CT-scan images and 95.6 for X-ray images when compared to SVM and DCNN. This study thus significantly helps medical professionals and doctors diagnose COVID-19 infections quickly, which is the most needed in current years.Keywords
COVID-19 has infected many people, leading to the cause of dangerous pneumonia. Fever, tiredness, high cough, and breathlessness are its symptoms. Severe infections of this disease may cause renal failure leading to death. Since this virus has unique properties, it won’t be easy to detect it earlier. Hence it has to be detected well in advance and adequately controlled for the speedy recovery of patients [1].
The detection methods of COVID-19 include screening techniques such as CT-scan and chest X-rays which provide visual guidance. These techniques are faster and more efficient when compared to other tests [2]. But frequently taking CT scans is not healthy for kids and pregnant women because high radiation may affect them severely [3]. Recently, Deep Learning (DL) techniques have been utilized in medical applications effectively for detecting various diseases so that the detected diseases may reduce the burden for medical practitioners [4].
Implementing the DL algorithm in various medical applications provides very effective prediction and diagnosis and helps control the spread of COVID-19 [5,6]. Early stages of detecting and discovering viruses with high accuracy can reduce the spreading of the virus, and estimating the severity may also reduce the death ratio. Except for a few works, many still need to apply DL techniques in X-ray and CT-scan images. Before training, usually, these images are in grayscale. Hence the preprocessing method is essential for evaluating the images since their size and structure may vary.
Localizing the infection and segmenting the pneumonia lesions is challenging for accurate detection and further actions. But most works rarely identify the shape and size of the infected regions from pneumonia lesions. Segmentation of CT scan medical images would be beneficial to prioritize the patients by severity. It will help to localize the infected region and provide its spatial features like size and shape. But only a few works have applied segmentation tasks for COVID-19 CT images in the chest.
The problem statement can be defined as follows: “There are little works on preprocessing the datasets such as eliminating the diaphragm portions, enhancing the image contrast, and minimizing the noises. In addition to detecting COVID-19 infections, the severity of the infection needs to be estimated using the DL techniques. The infected regions have to be identified using segmentation techniques”.
This paper designs an HSDC model for detecting and classifying COVID-19 from Chest X-rays and severity from CT images. The major contributions of HSDC models are:
(i) The HSDC model estimates the severity of infection from CT images and classifies the infections from X-ray images by applying hybrid DL methods.
(ii) It applies an optimization technique for adaptively determining the segmentation threshold for CT images.
The content of this manuscript is structured as follows. Section 2 presents a brief literature review of existing works, Section 3 includes a brief discussion of existing techniques used in the proposed work, Section 4 contains the proposed methodology of the HSDC model, and Section 5 presents the simulation results. Section 6 concludes the paper along with future work.
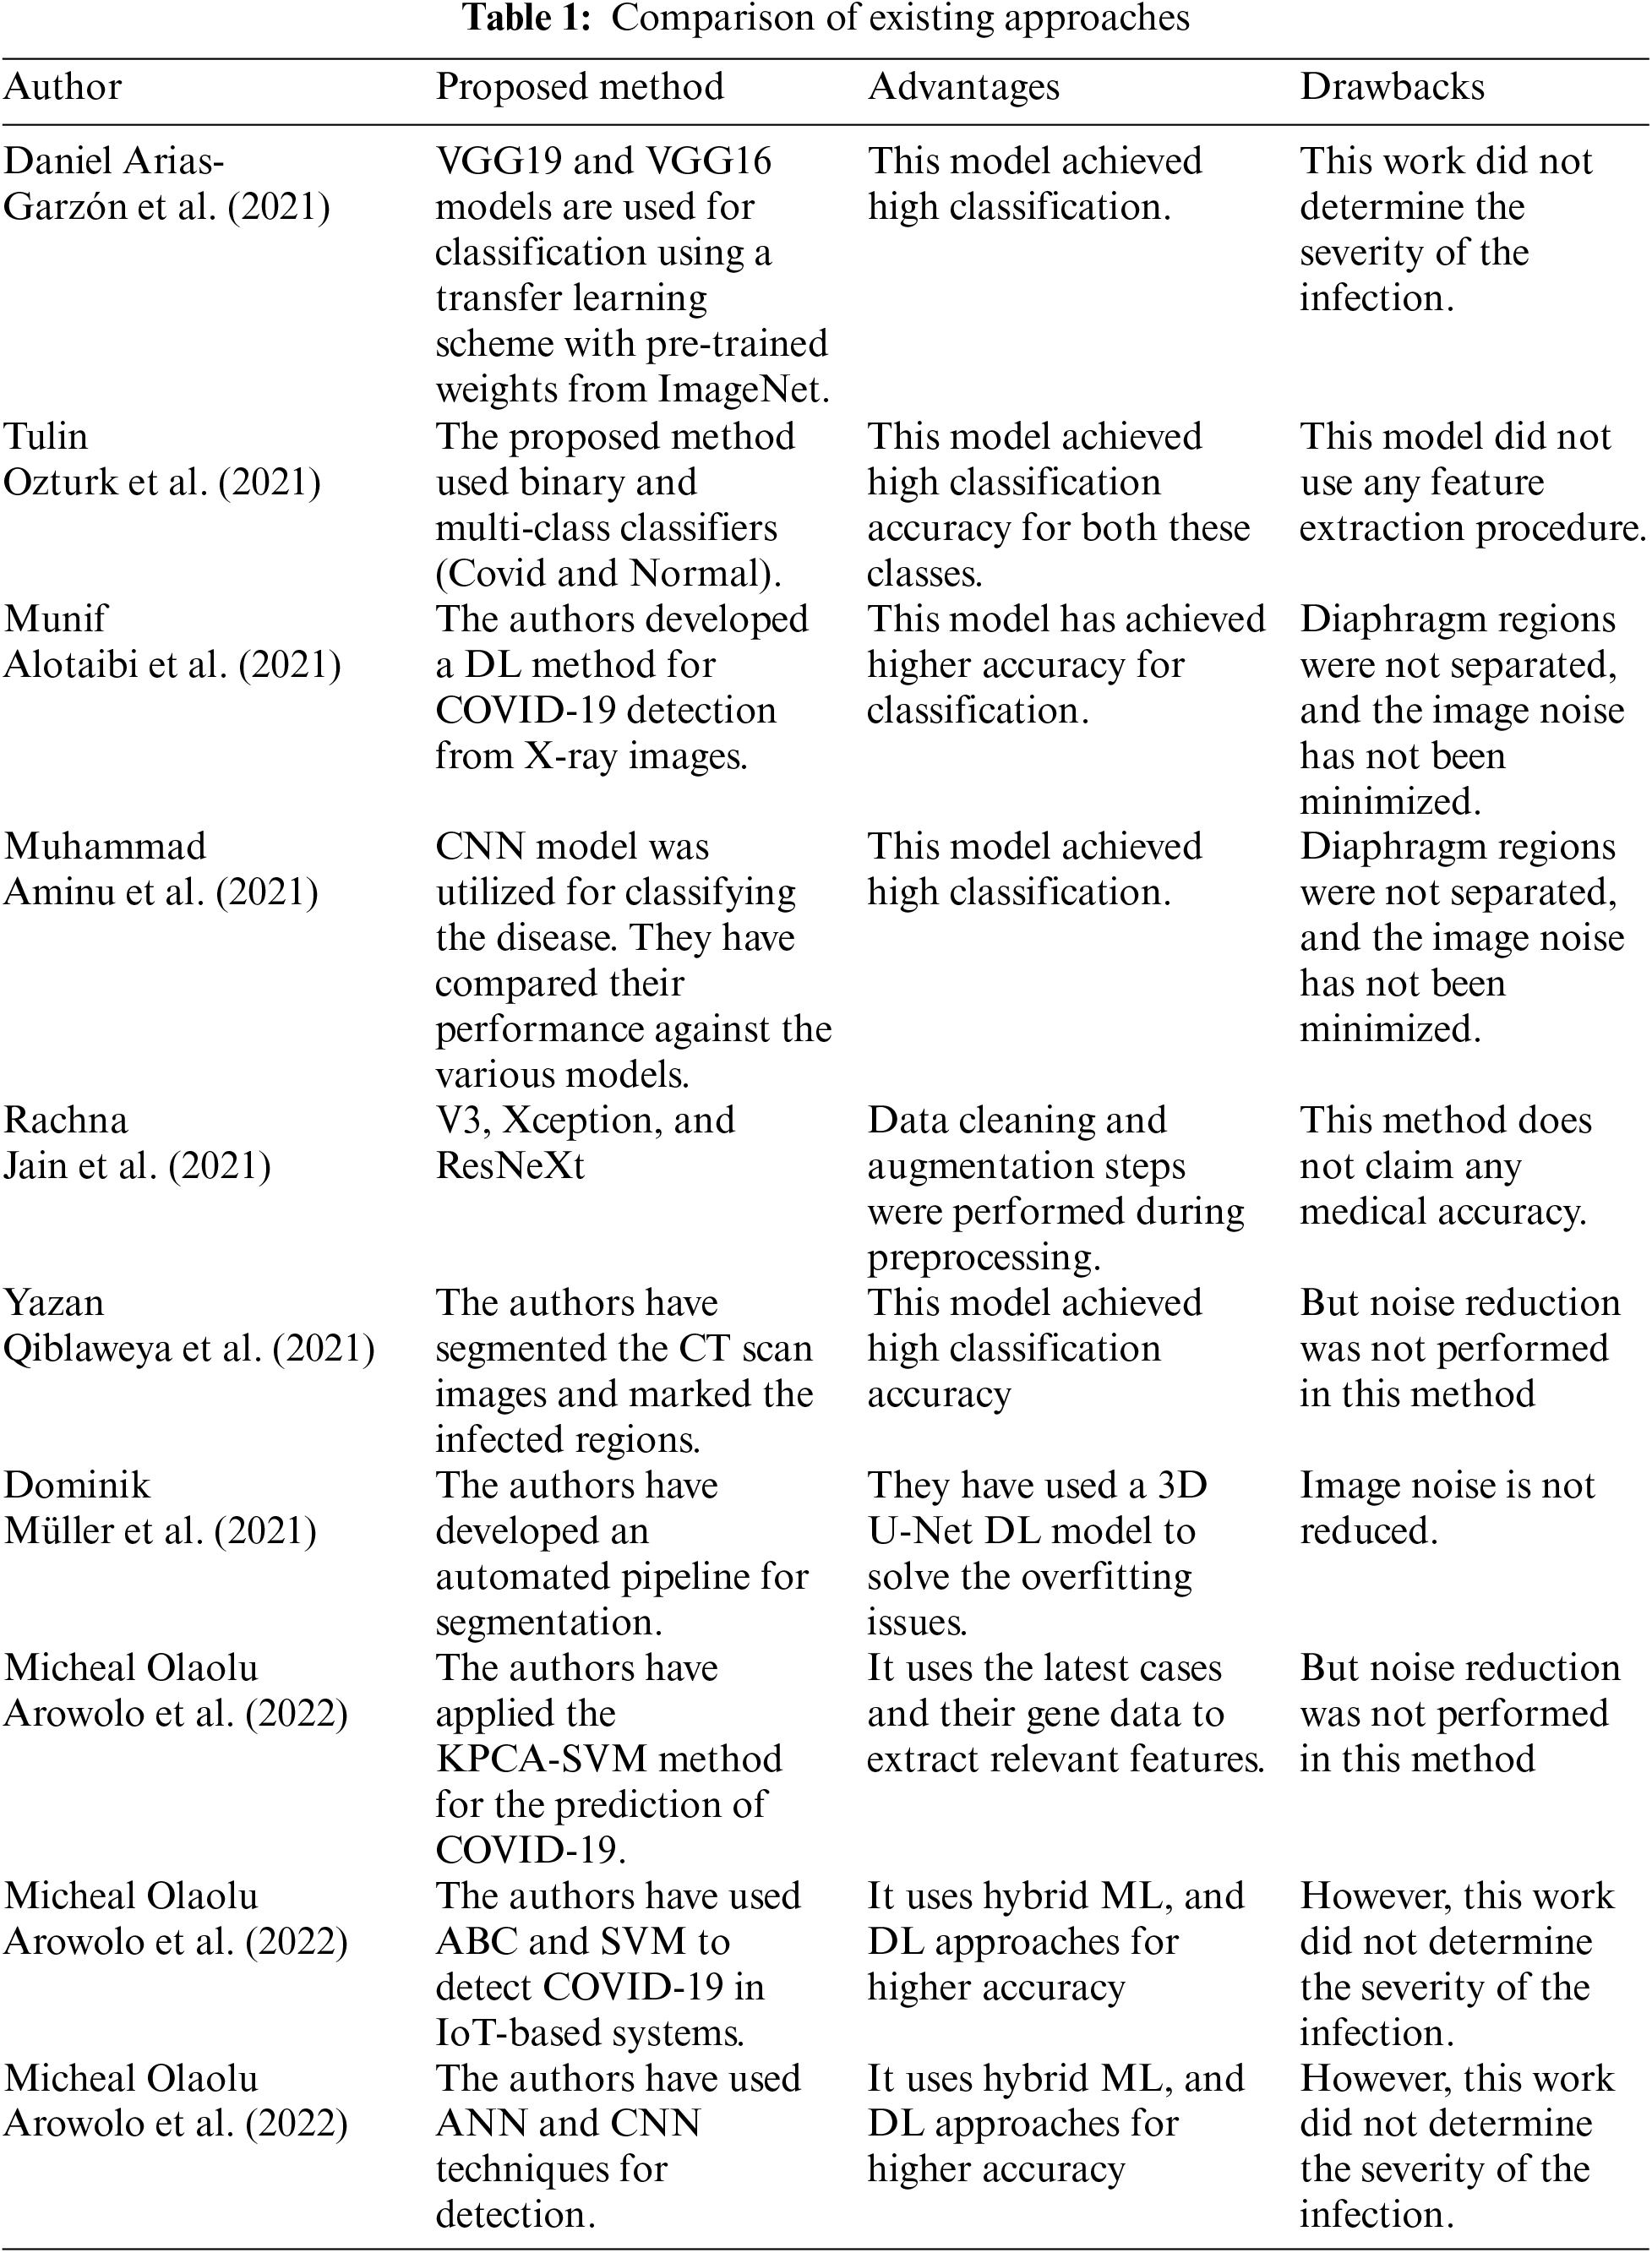
In [7], VGG19 and VGG16 models are used to classify the X-ray images as present or absent for COVID-19. During the classification step, these two models were trained using the transfer learning method with pre-trained weights of ImageNet. But, this work did not determine the severity of the infection.
In the COVID-19 detection model of Ozturk et al. [8], both binary classifiers (COVID-19 and Normal) and multi-class classifiers (COVID-19, Normal, and Pneumonia) were used. This model achieved high classification accuracy for both these classes. However, this model did not use any feature extraction procedure. Alotaibi et al. [9] have developed a DL method for detecting COVID-19 infection from chest X-ray images—three types of classes based on the classification experiments. Moreover, the Transfer-learning method is applied to boost the model’s performance.
Aminu et al. [10] proposed a DL architecture CovidNetfor deep feature extraction, which uses grayscale images with a limited training dataset. Unlike the other approaches, classification is done for both X-ray and CT-scan images.
A COVID-19 identification technique was developed from CT images and X-rays [11]. After performing the preprocessing techniques like data cleaning and image augmentation, the CNN model was utilized for classifying the disease. They have compared their performance against the Inception V3, Xception, and ResNeXt models. However, the prediction accuracy could be better.
A U-Net architecture has been designed by Qiblaweya et al. [12], which segments the infected CT images and marks the infected regions. But noise reduction was not performed in this method. A hierarchical model was designed in [12] for COVID-19 detection. The DL-based Encoder-Decoder was applied in the CNN model to classify the infection as severe, normal, and mild. But noise reduction was not performed in this method.
Müller et al. [13] have developed an automated pipeline for segmenting the COVID-19-infected regions. This technique generates unique and random image slices for training and utilizes data augmentation procedures for training. They have used a 3D U-Net DL model to solve the overfitting issues.
Arowolo et al. [14] have applied an ML method for COVID-19 detection Using KPCA-SVM. It uses the latest cases and their gene data to extract suitable features. In [15], they used ABC and SVM classifiers for COVID-19 detection in an IoT data system on a San Francisco COVID-19 dataset. Again in [16], they used ANN and CNN classifiers for detection from chest X-ray images.
Table 1 presents the comparison of existing approaches with their advantages and drawbacks.
3 Existing Techniques Used in this Model
3.1 OTSU Thresholding for Segmentation
In Image processing, selecting a suitable threshold value of gray-level pixels for extracting the features from their background is essential. Plenty of techniques have been developed for this purpose. OTSU is a threshold-based image segmentation technique. It uses a threshold selection rule based on the max Inter-class difference of the background from the given image. Another way to find the optimal thresholding is through the Ostu threshold. They use a variance-based method, finding the threshold value where the weighted variation between the background and foreground pixels is the least.
In OTSU [17], an optimal threshold is selected using the splitting condition to separate the resultant classes in gray levels. After implementing the threshold techniques in an image, pixel by grey level histogram representing the probability distribution is applied in several steps to return the final output as total inter-class variance G(T). It is not only a standard technique in image processing but also applied in unsupervised learning solutions of pattern recognition. Let the pixels of a given image with L gray levels can be given by
Let the pixels of a given image with L gray levels can be given by
Then grey level histogram is represented as a probability distribution as
A threshold T divides the pixels of the grey scale image into the background and the object classes C1 = (0, 1, 2…T) and C2 = (T + 1, T + 2, T + 3,…L), respectively.
The probabilities C1 and C2 are given by
The mean values of C1 and C2 are given by
Then the value of T can be determined from the following parameters
Here A(T) represents the Inter-class variance where in terms of statistical characteristics first order, B(T) the other one is termed as inter-class variance statistical characteristics of second order, and G(T) is the total inter-class variance.
3.2 Improved Chicken Swarm Optimization (ICHO) Algorithm
ICHO [18] is a NIB algorithm as New Intelligent Bionic, behavioral of a chicken swarm searching for food in nature. Compared to the traditional CHO algorithm, the improved version included the Chick position update mode and the cock and hen position update modes.
It is demonstrated that ICHO is faster and more cost-effective than other optimization methods. Unlike traditional optimization methods, it does not require the problem to be differentiable. It includes updating Cock position, Hen position, chick, and population.
(i) Update of Cock Position
When the cock is away from the mid-point p of the hen in a cluster, it will perform a random search in a more extensive region, thus improving the probability of global tracking. On the other hand, when the cock is nearer to the mid-point p of the hen, it will perform a dynamic search in a minor region, which improves the local estimation capacity of ICHO and the chances of determining the best solution [19].
The cock position update equation is given as
where C is an individual cock, Q =
(ii) Hen Position Update Mode
Among the initial population, Gbest individuals with better fitness values are selected, and one is randomly chosen as the supreme individual. During the foraging step, the supreme individual is considered the learning objective for the hen.
Hence, using the following equation, the hen (H) position is updated based on the supreme individual.
where C and H denote the cock and hen, r1 is the index of cock where ith hen’s group mate, r2 is the index of the Chicken, Pe(t) is the chosen member hen’s supreme learning object in the tth round, hao denotes the Elite candidates fetched from the population.
S1 and S2 are calculated as
where fi, fr1, and fr2 represent the fitness function values at i, r1, and r2, respectively.
(iii) Chick Position Update Mode
The chick’s position can be updated based on the position of the chick’s mother and cock, which is ith chick’s group mate.
(iv) Population Update Strategy
In most of the optimization solutions, during higher iterations, the number of similar individuals may linearly increase, thereby reducing the chances of meeting the optimal global solution. Hence, to keep the population’s diversity unaffected, the population’s individuals are updated.
This technique [19] eliminates the noises from the X-ray dataset. It removes the noises from the images after performing several iterations where the edge portions are removed. In this technique, the input images are divided into slices. These slices are filtered one by one and then fused again.
An Input image ‘O’ mixed with multiplicative noise, also called a speckle, n is denoted as
n =
The binding between the image and its noise should be minimized. This noise elimination process is iteratively executed as long as the noisy segment of the image does not reach the Gaussian term.
The kurtosis (ku) is computed by
To obtain an accurate image, the filtering procedure is iteratively performed until the value k is equal to 0.001 since all the features will be eliminated if k becomes 0.
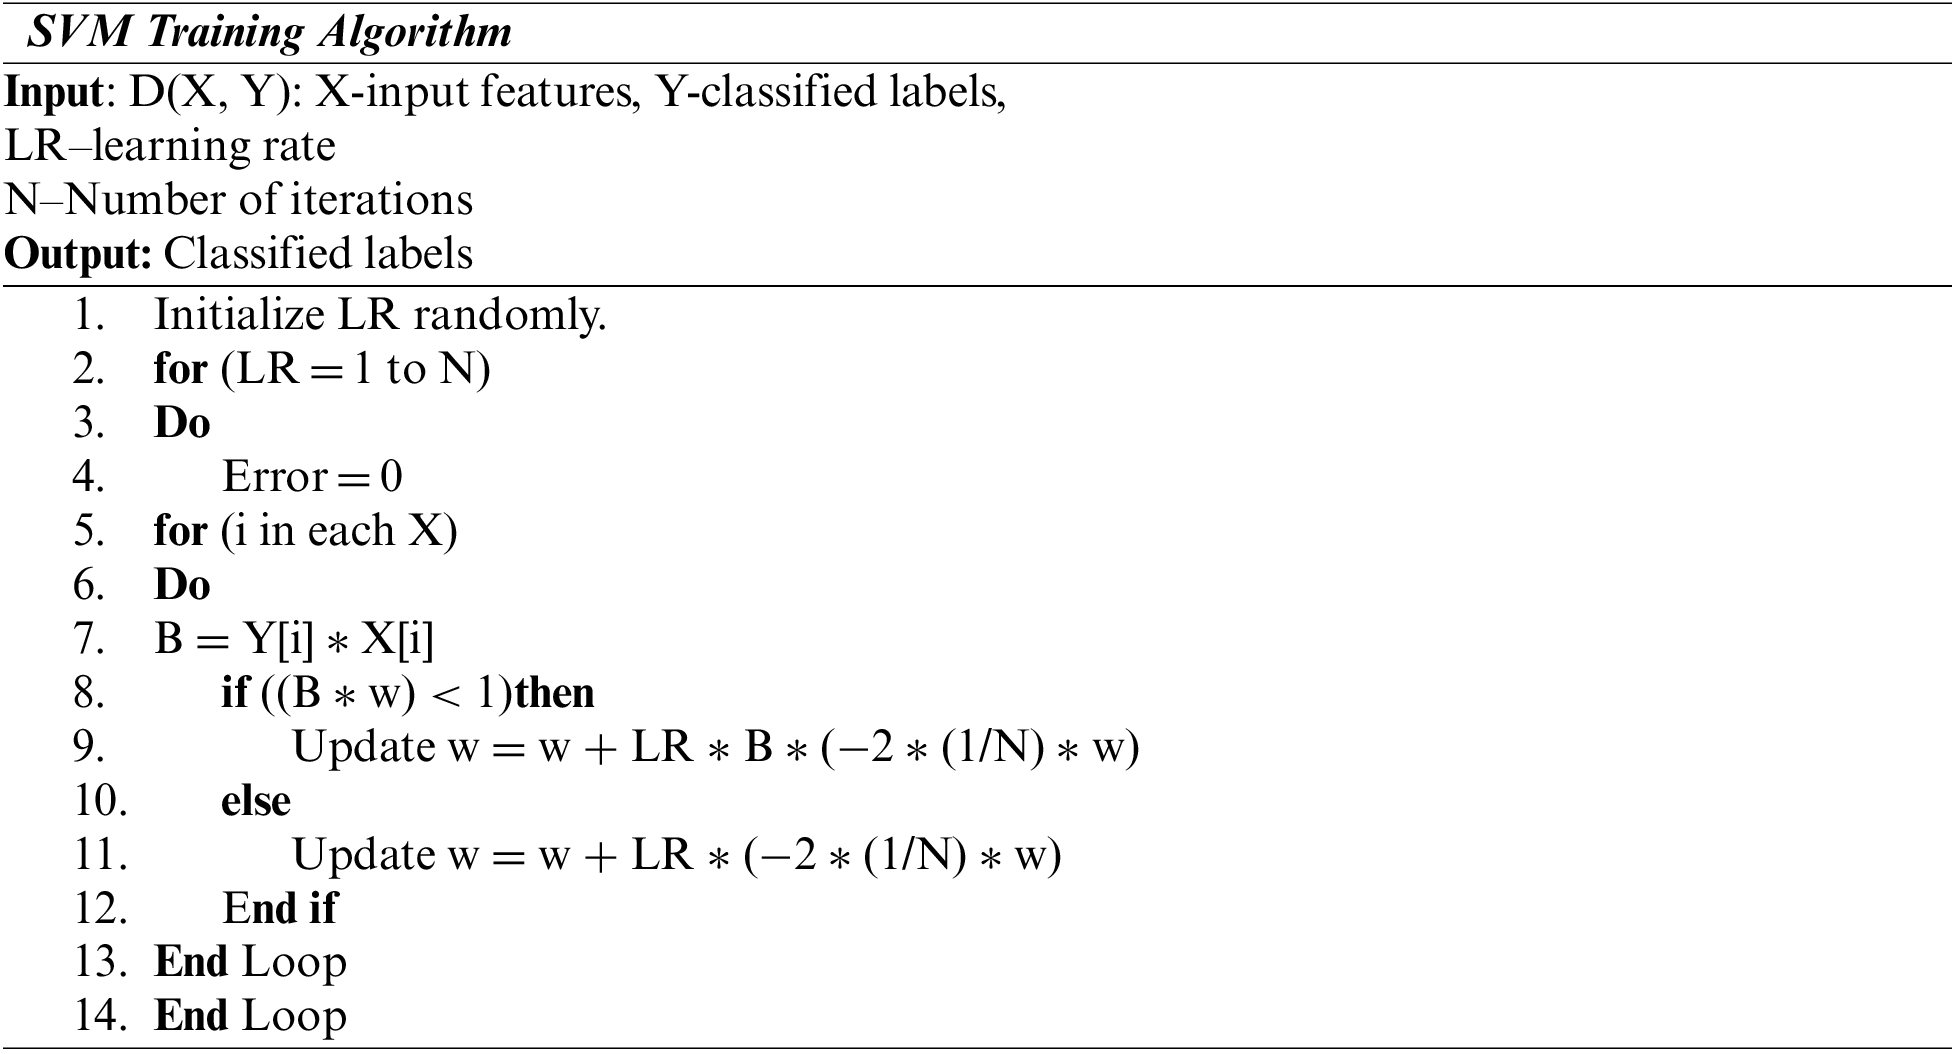
The fundamental aim of SVM is to determine the best hyperplane which maximally divides the target class into two. Geometrically, the SVM algorithm determines an optimal hyperplane with the maximal margin to divide the two classes,
The training set of SVM is represented as
Here pj is the characteristic vector of the model as input, and qj is the output catalog = +1 or −1. SVM divides the positive and negative instances using a hyperplane as
Here w.p indicates the dot product of w and p.
The Radial Basis Function (RBF) is a Kernel part used to find a non-linear classifier or regression line. The RBF kernel function for (P₁, P₂), which calculates the likeliness of these points, can be denoted as:
where ||P1 − P2|| is the distance between P1 and P2 and is the variance.
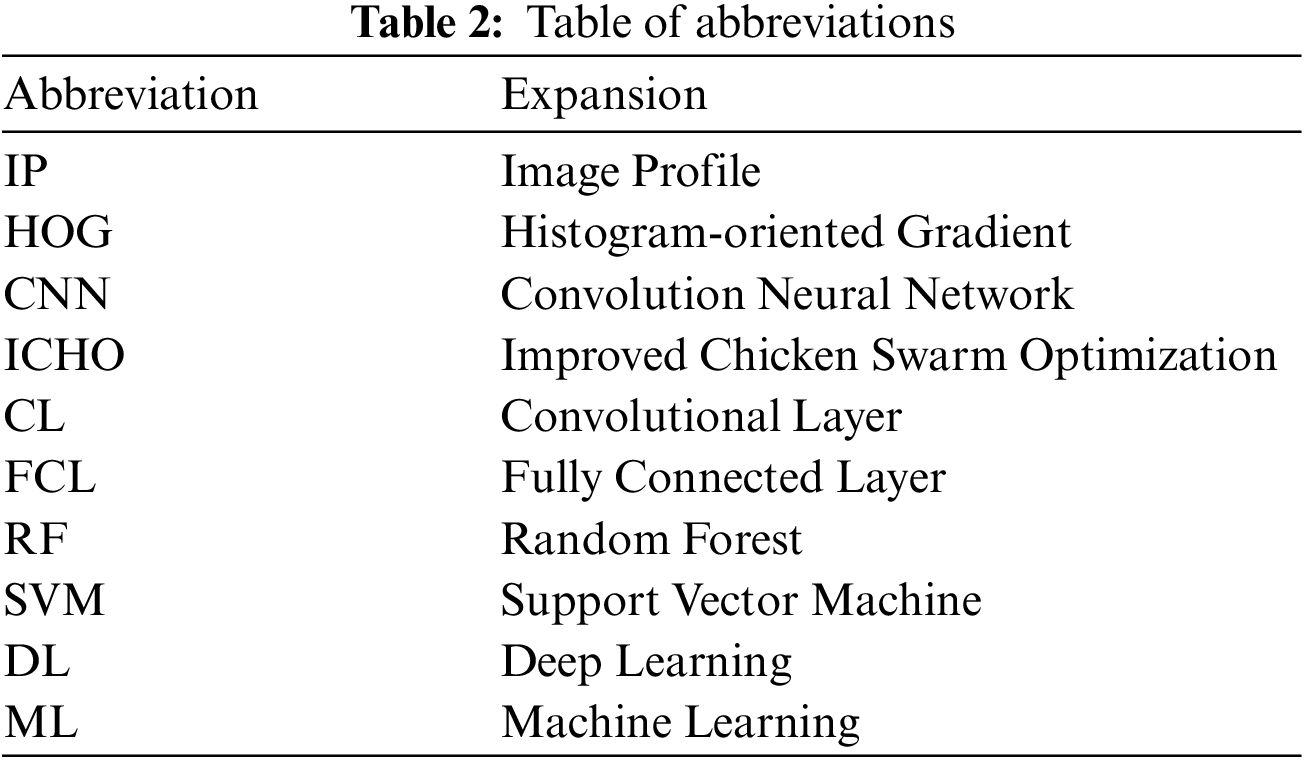
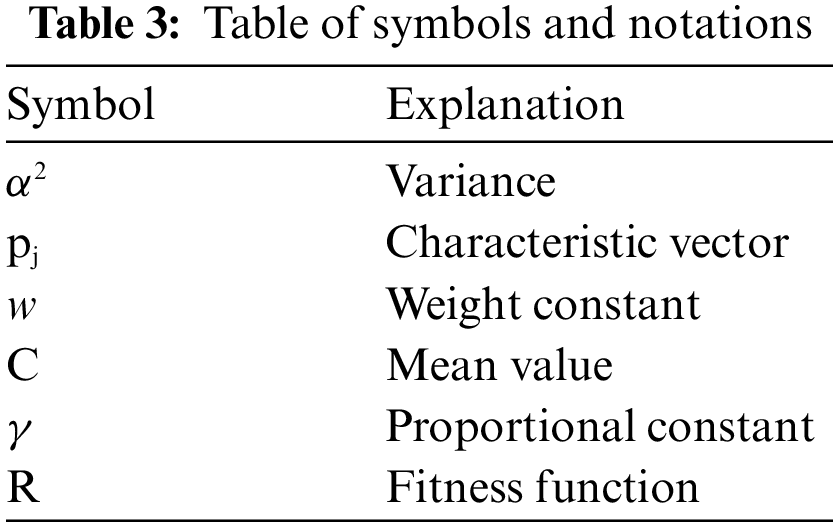
Tables 2 and 3 provide the abbreviations and notations used in the proposed methodology.
In this paper, the HSDC classification model is developed for the identification and severity estimation of COVID-19 from CT-scan and X-ray images. The HSDC model diagram is shown in Fig. 1. It contains HSDC-CT and HSDC-X algorithms for classification. The lung region of the CT-scan image is segmented using the ICHSeg algorithm. Fused statistical and shape (F-ST-SH) FVs are extracted from the segmented lung images. The F-ST-SH FV is then classified using the HSDC-CT algorithm as severe, moderate, and severe. The X-ray images are preprocessed using the existing MADF technique. After the preprocessing step, the FHI FVs are used for training the model. The HSDC-X algorithm classifies images of the X-ray as whether it’s COVID-19 or else pneumonia and its normal condition.
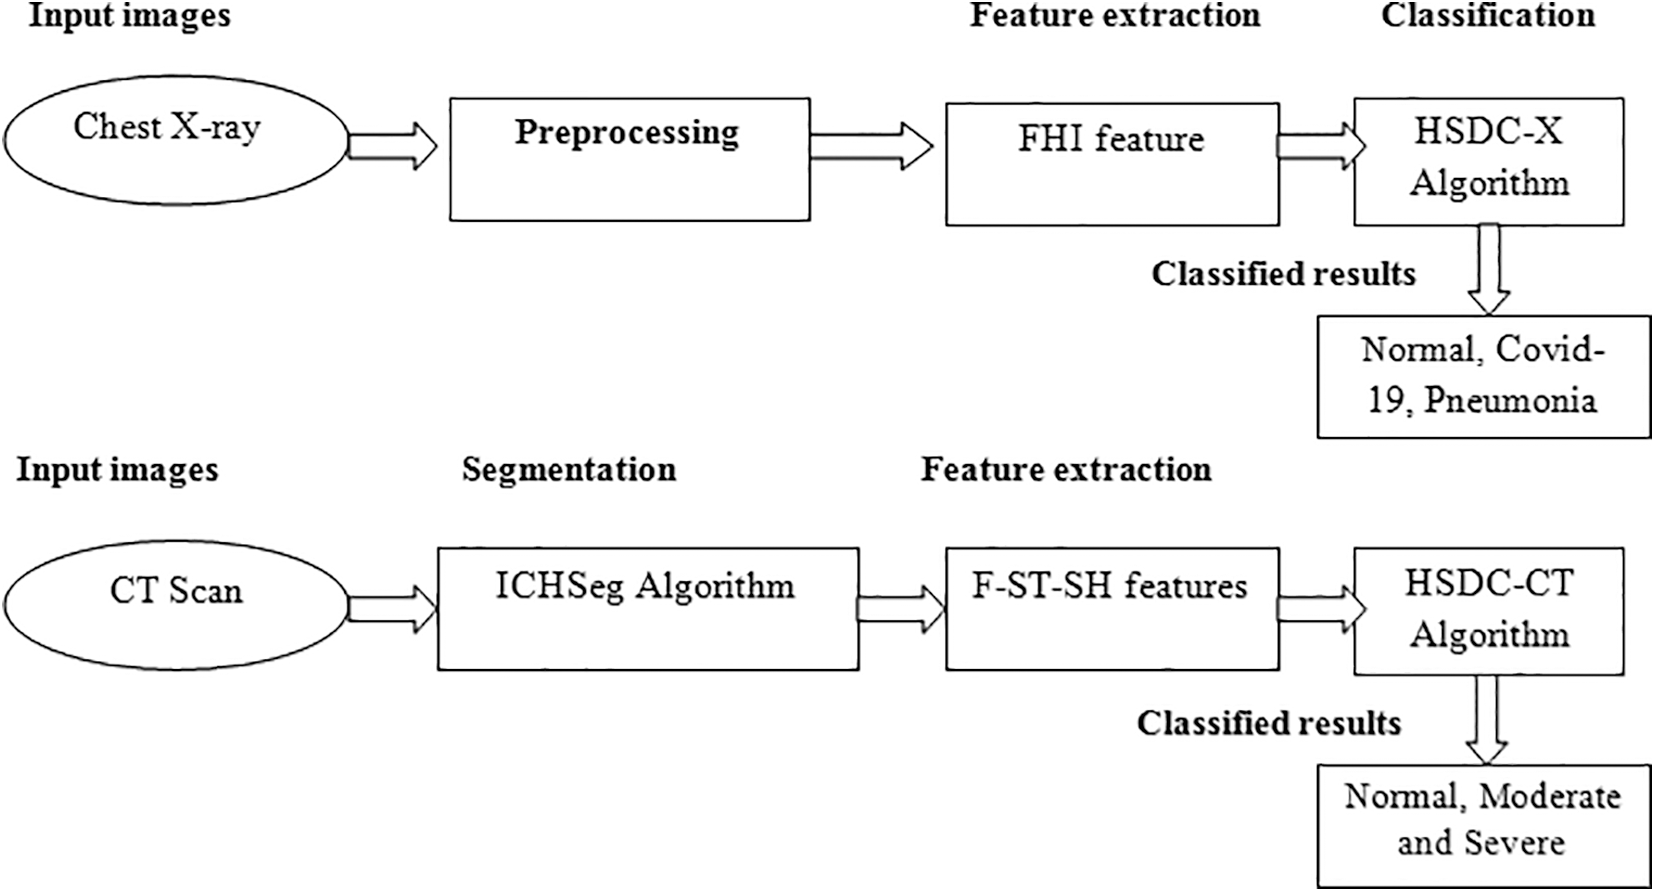
Figure 1: Proposed model
4.2 COVID-19 Classification of CT-Scan Images
4.2.1 ICHO-Based Segmentation (ICHSeg)
Preprocessing is the preliminary phase in image processing which consists of Histogram and morphological techniques. The Lung CT scan image has four regions (i) Black background, (ii) a dark grayed circular area, (iii) a bright area (iv) darker gray-shaded lungs. Since the lung portion has to be segmented, the first two regions should be removed.
In this technique, the image’s Histogram is constructed and analyzed to pick up a threshold, which detects and removes the image’s outer portion. Let Im denotes the preprocessed CT image of size MxN. From Im, the histogram H is estimated using the step value k, from which the threshold is estimated.
Then the resultant image (ImR) after removing the background is given by
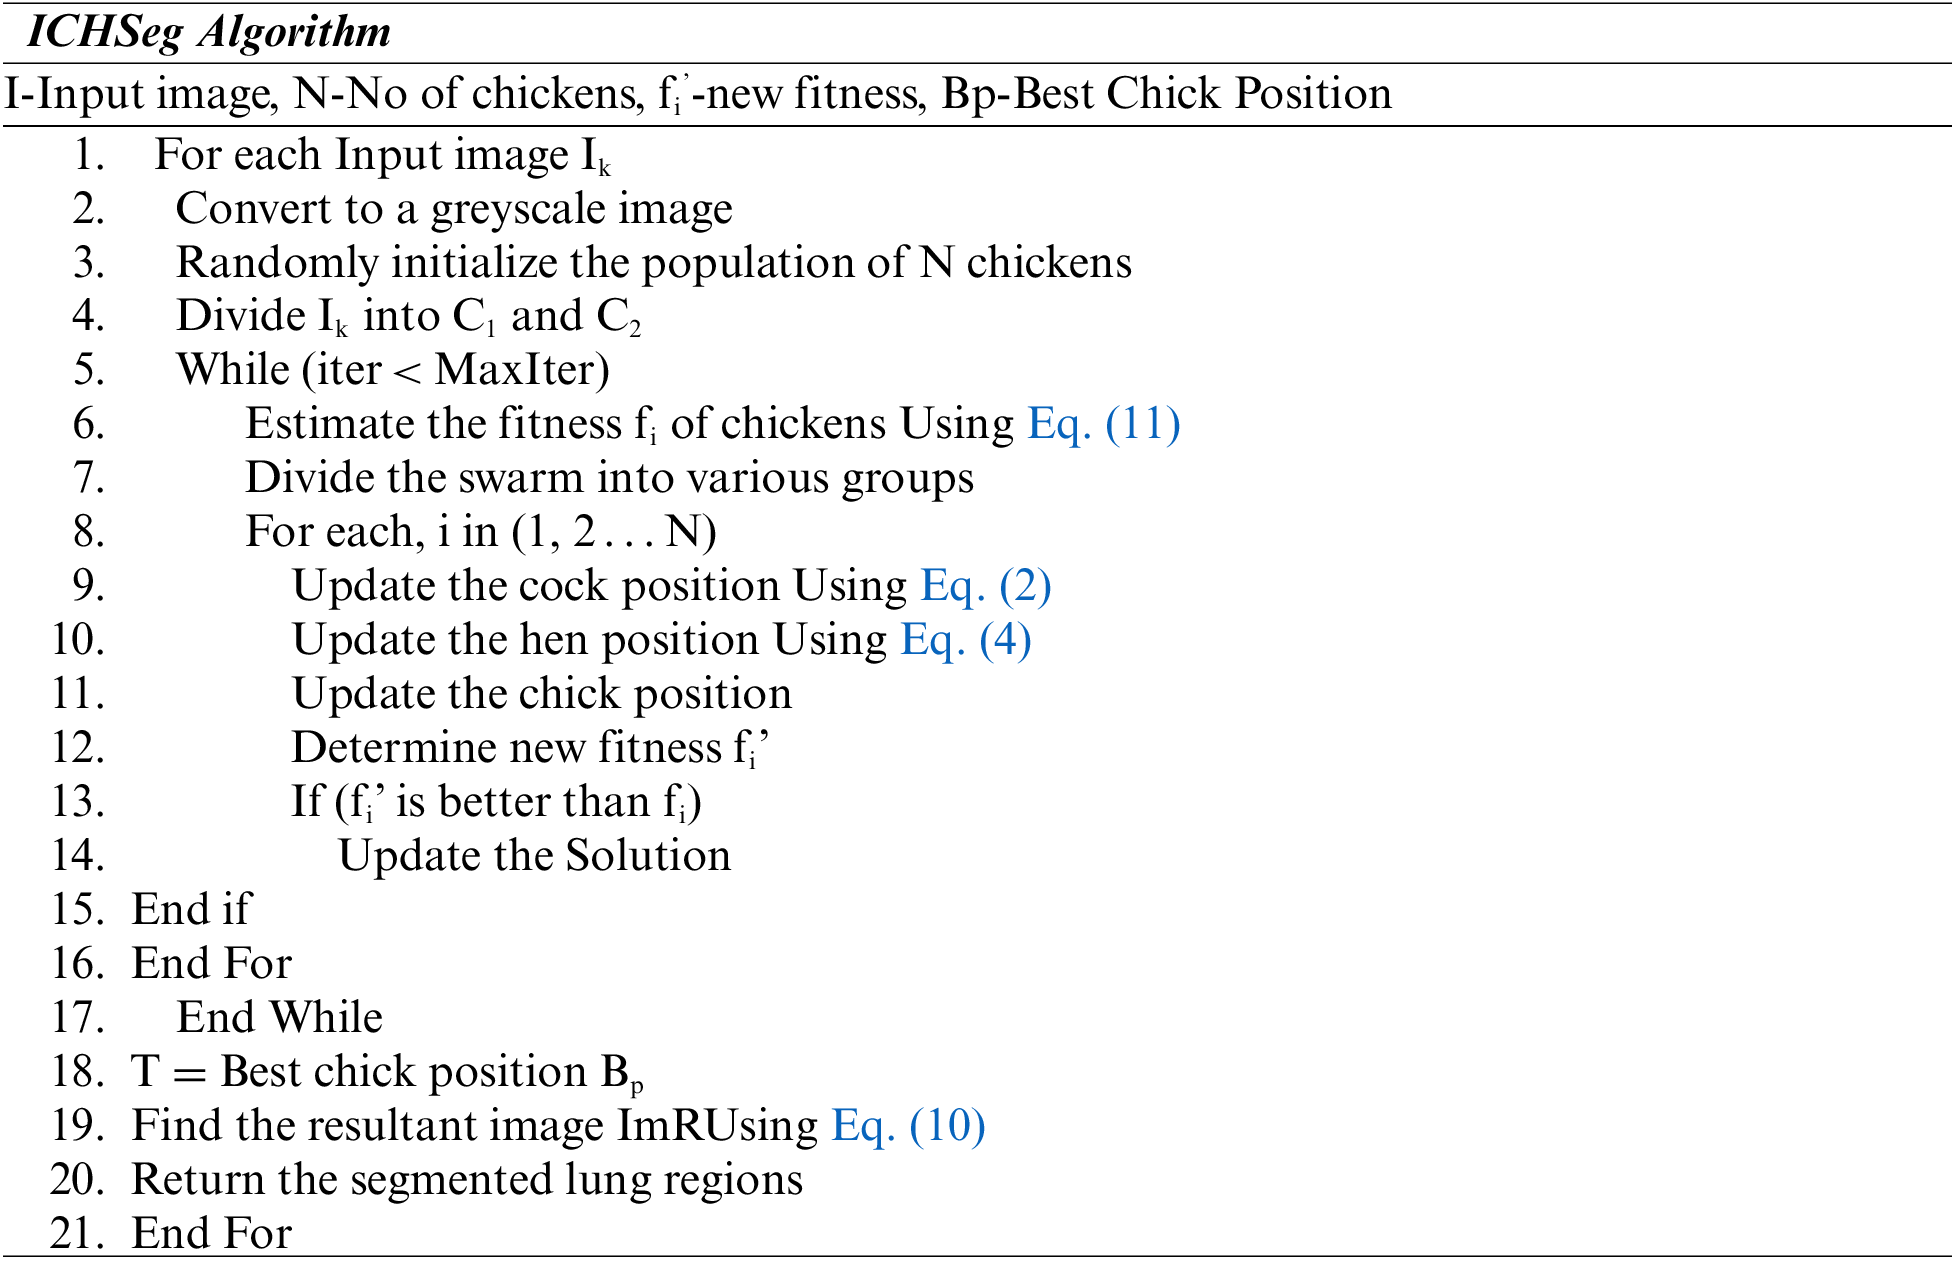
The Otsu threshold T for each slice is computed Using the ICHSeg algorithm.
The Fitness function of ICHSeg is derived as
where A(T), B(T) and G(T) are the threshold selection parameters defined by Eq. (1) and w1, w2 and w3 are weighting constants such that w1 + w2 + w3 = 0.
Then segmentation is performed using the ICHSeg algorithm, which is illustrated below:
Feature extraction is a key area for the classification of image properties. Moreover, it is utilized to enhance detection accuracy by choosing significant features. In [20], in the FSHFST feature extraction phase, various shape and statistical features are extracted and fused from the segmented lung regions.
Lets {x1, x2, x3,…, xn} be the centers of the shapes which are fed as input to the region-growing method. It finds the associated n aspirant portions {B1, B2, B3,…, Bn}.
The statistical features are represented by
where F1av, F2Me, F3Mo, F4Va, and F5SD represent the statistical properties Average, Median, Mode, Variance, and Standard deviation, respectively. These properties of aspirant regions are extracted from each nodule element portion Bi in a slice Sj and fused to get an FVVi.
The shape feature is represented by
F6SCF has estimated from the lesion’s shape, and appearance in the image’s adjacent slices.
Then the FSHFST vector for the slice Sj is given by
4.2.3 Classification Using HSDC-CT
The extracted regions are classified using the HSDC-CT algorithm depending on the FV. The HSDC-CT classifier combines the advantages of SDC [SVM, DCNN] classifiers [21,22]. The database containing the extracted features is split into training and testing sets.
DCNN Architecture
DCNN applies filters on the image’s actual pixels to collect patterns’ details using a traditional neural network. The DCNN model proposed in this study is presented in Fig. 2. The layers of DCNN are described below:
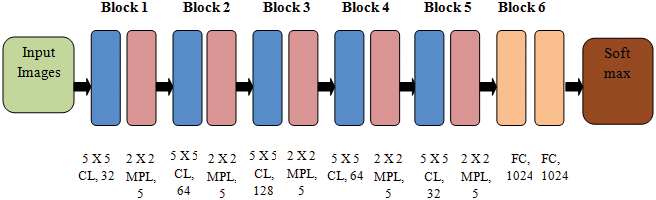
Figure 2: The DCNN model
Convolutional layer (CL): In this layer, n filters are applied to each detected feature map in the input. A Rectified Linear Unit (ReLU) activation function changes the network into a non-linear one.
Max Pooling layer (MPL): The conventional technique is to split and detect the feature mapped as sub-slices of size 2 × 2. It mainly retains the optimum values.
Fully Connected Layer (FCL): In FCL, the entire neurons of the previous layers are connected to the next ones. The labels are categorized depending on the outputs from CLs and reduced with MPL.
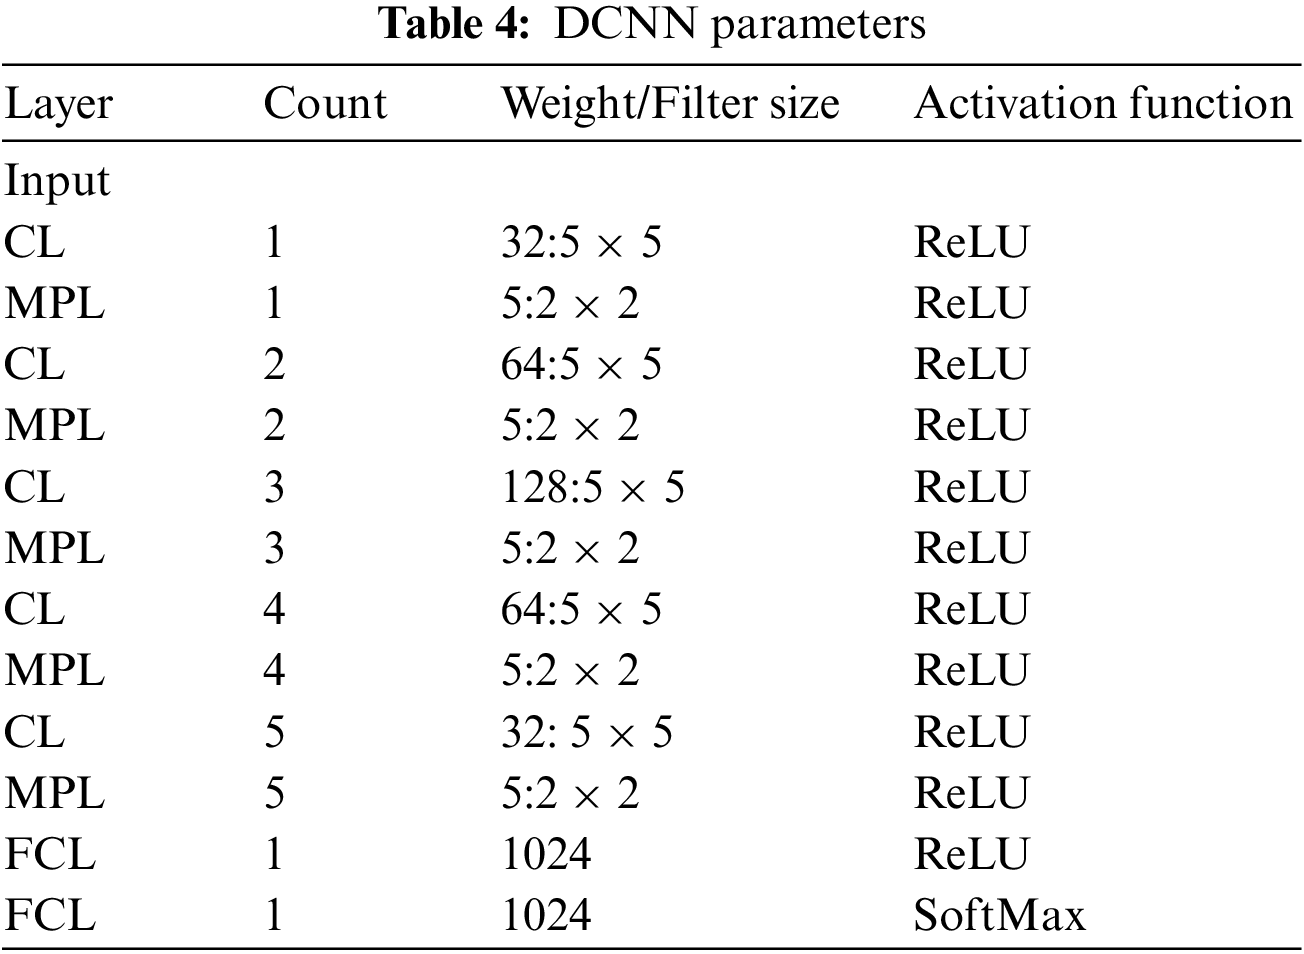
Table 4 describes the DCNN model depicted in Fig. 2.
The extracted FV is passed to the HSDC-CT algorithm, which detects the COVID-19-infected images and classifies them into normal, moderate, and severe. CNN is the primary DL model which can produce predictive FVs from labeled inputs. SVM is an unsupervised algorithm that learns a decision function for detection.
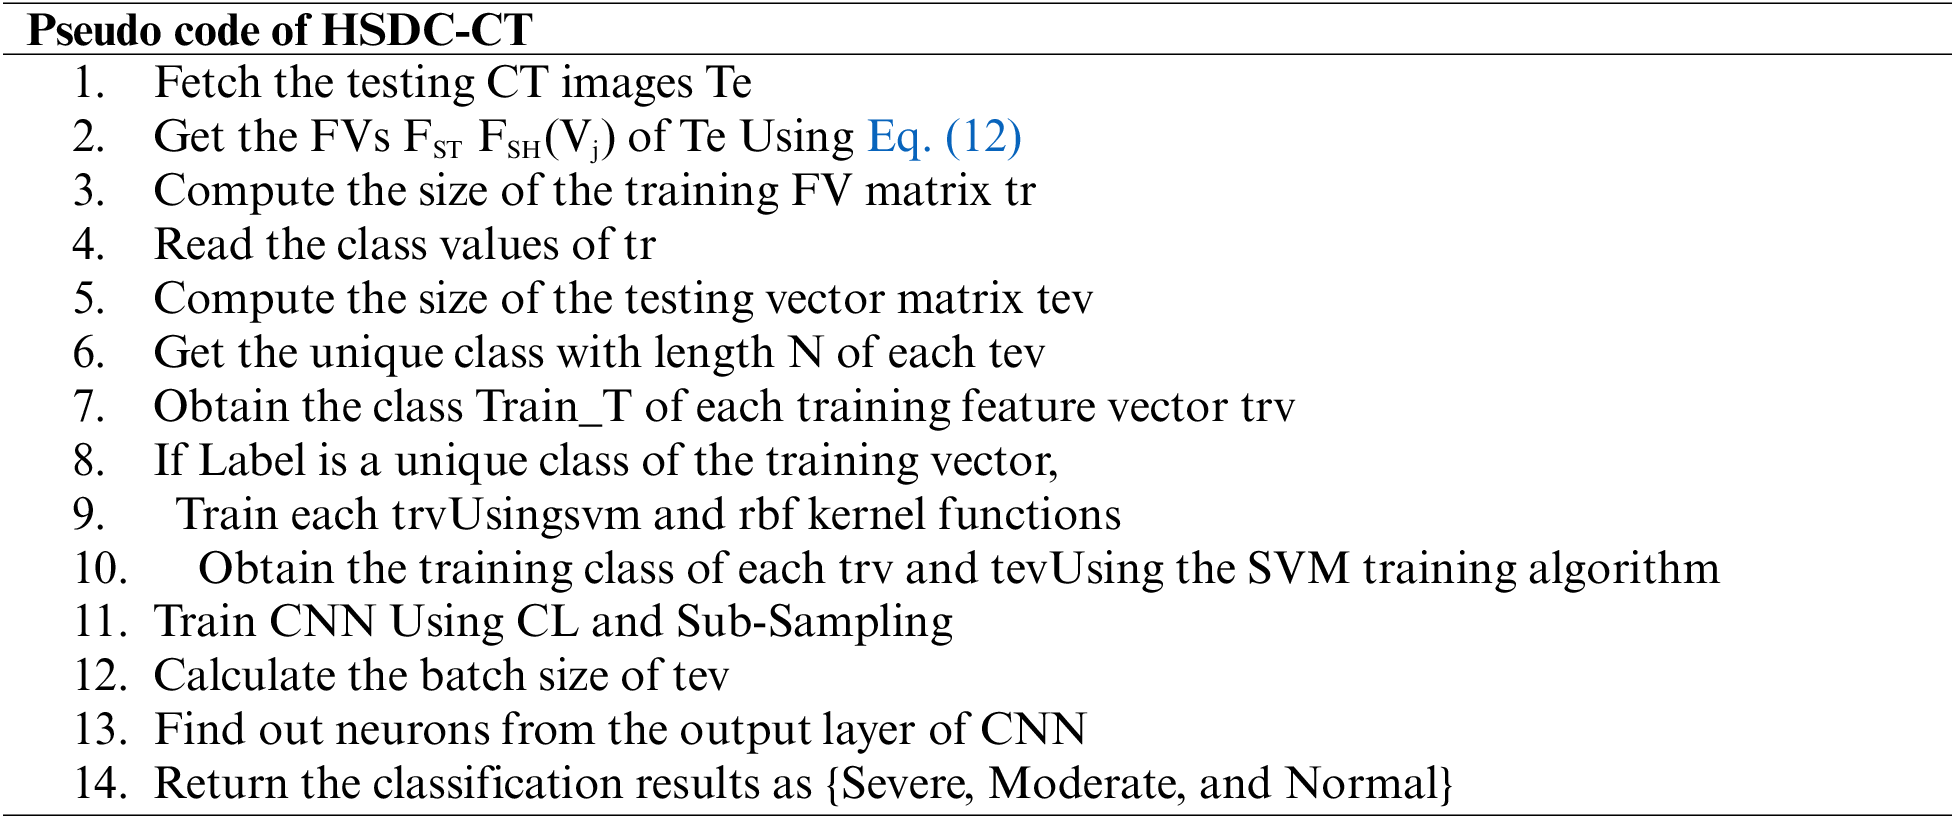
The steps involved in the Hybrid model are summarized in the following algorithm:
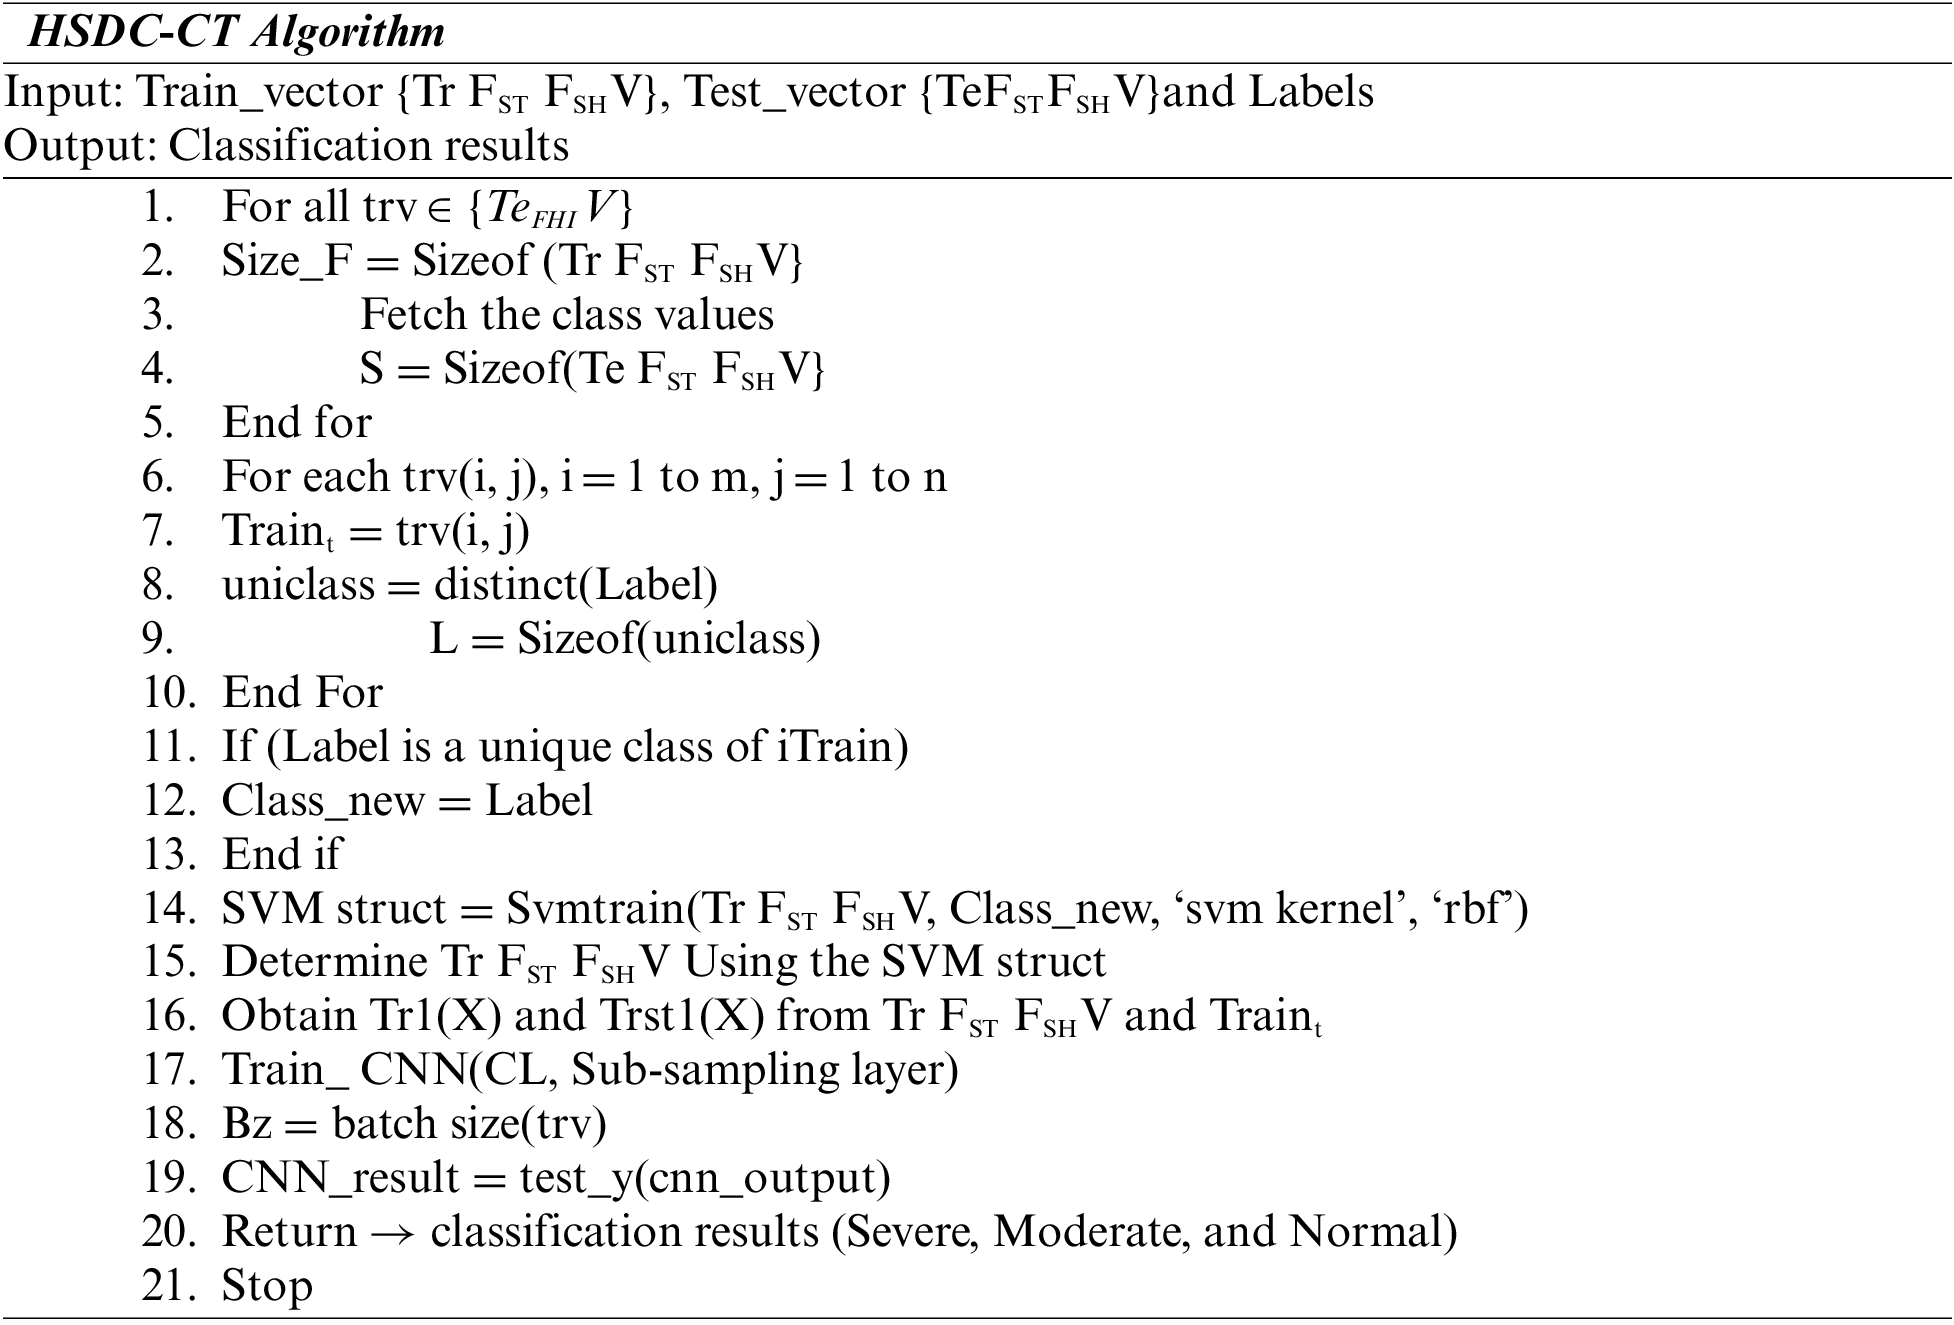
Each feature of the image is picked up from the test set of CT image features. The training determines the dimension of the feature matrix. Then SVM Struct Uses the SVM kernel and RBF functions. Then the SVM training algorithm estimates the training features. In the next phase, CNN is trained, and the batch size of the testing feature is computed. The neurons from the CNN output layer are returned as the classification results as severe, moderate, and very severe.
4.3 COVID-19 Detection from X-ray Images
This process has the FHI feature extraction and HSDC-X classification phases.
When the preprocessing procedure is completed, the HOG and IP features of images are extracted. Then they are fused into an FHI feature, resulting in a rich set of features for observation. The FHI features are fed as input to the training process during the classification process.
The steps involved in HOG feature extraction are described below:
Step-1: Get the Input X-ray Image
Step-2: Preprocess the image Using MADF as illustrated in Section 3.2
Step-3: Generate the Gradient Image
Step-4: Divide the Image window into cells and overlapping blocks
Step-5: Compute the HOG for each block and perform normalization
Step-6: Concatenate all normalized histograms
Step-7: Obtain the HOG feature vector
The features are obtained by extracting the IPs. The accuracy of rebuilt images is measured by inspecting the IPs of sharp edges.
The feature selection and fusion process was illustrated in the following equations [21]
Then fHOG and fIP are fused Using the concatenation operation given by
Eq. (24) denotes the FHI features.
Then HSDC algorithm classifies the X-ray chest images into different categories.
Here n = 3780 and m = 300. Hence 4080 fused FHI features are obtained in which 20% are selected, depending on the highest entropy value.
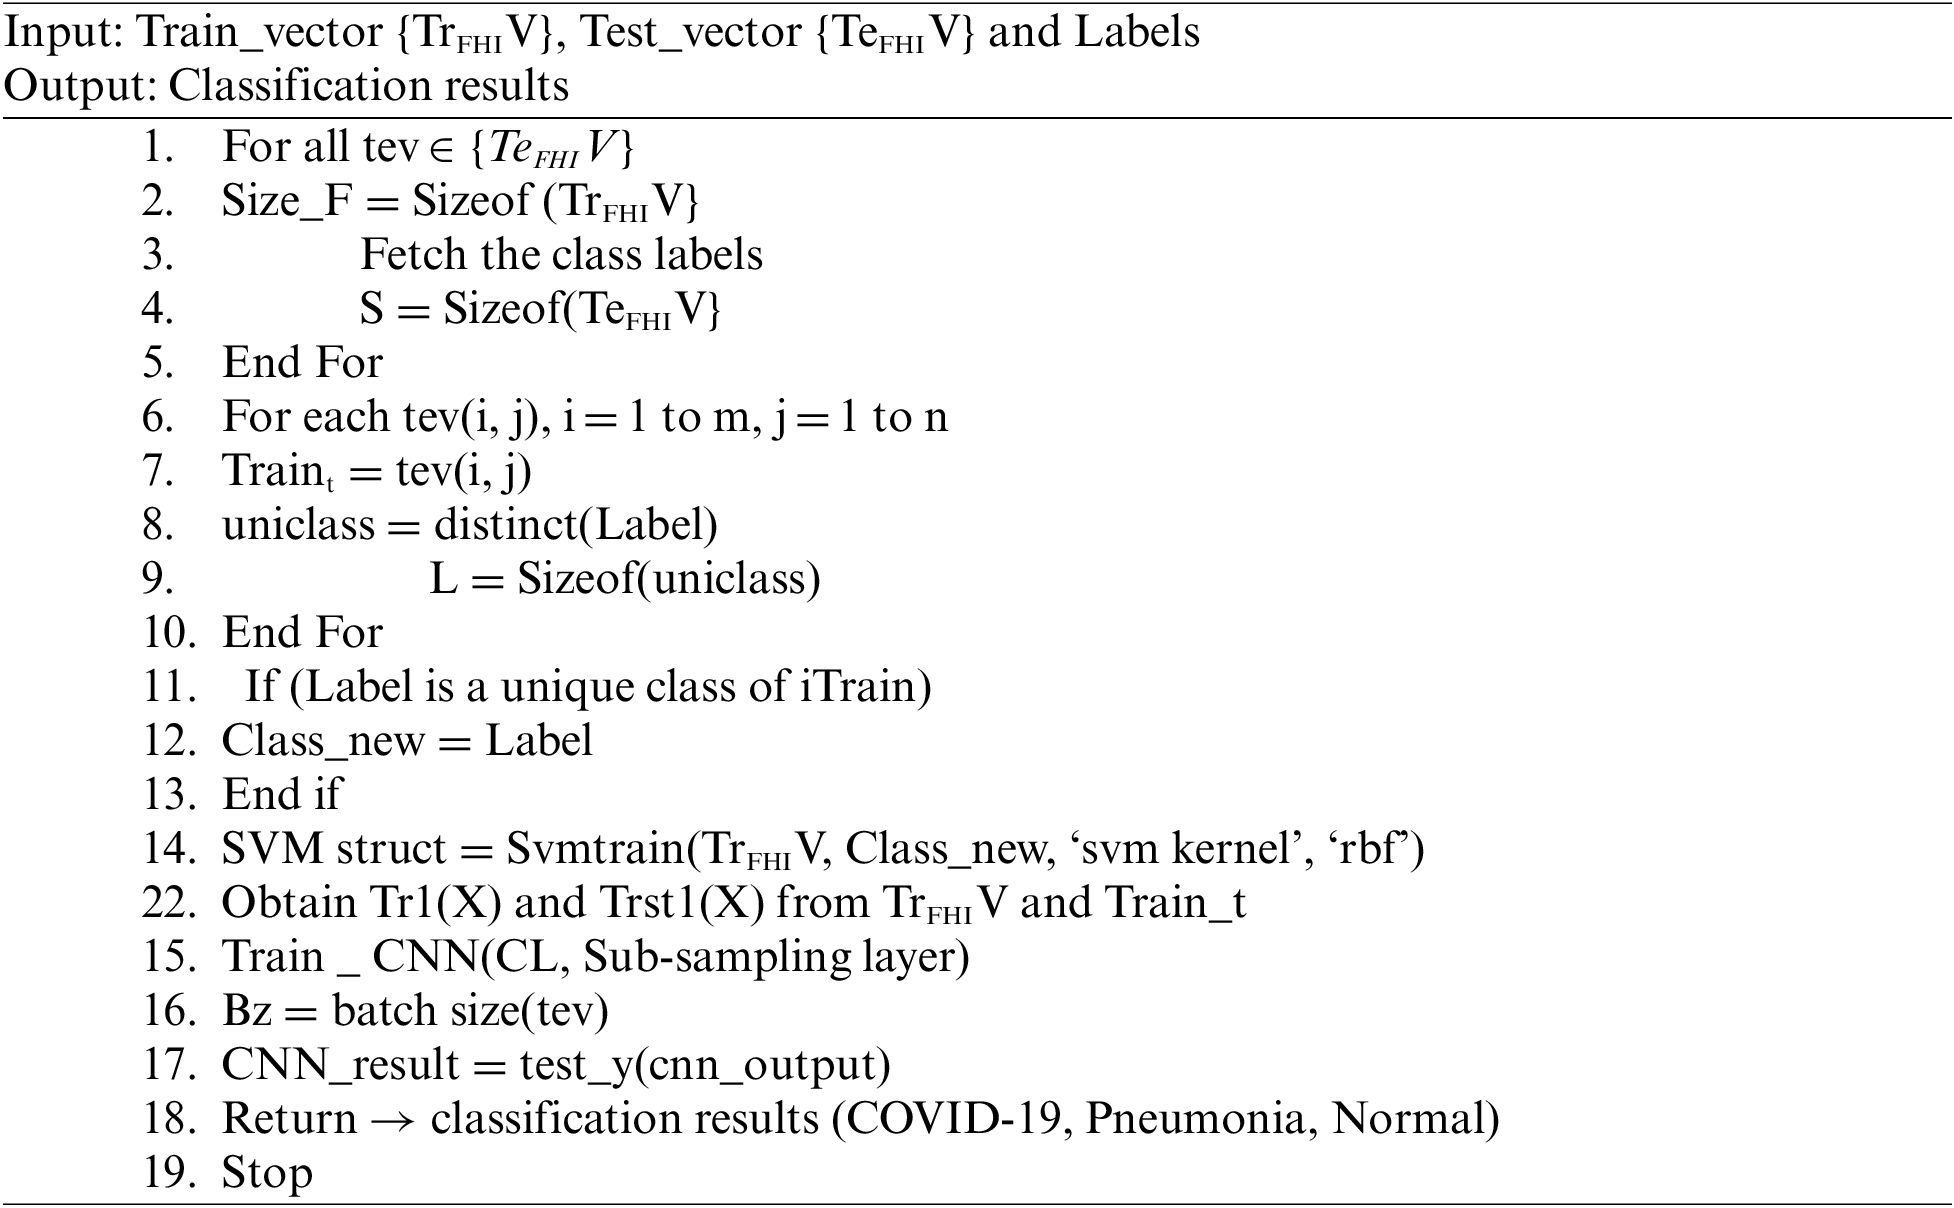
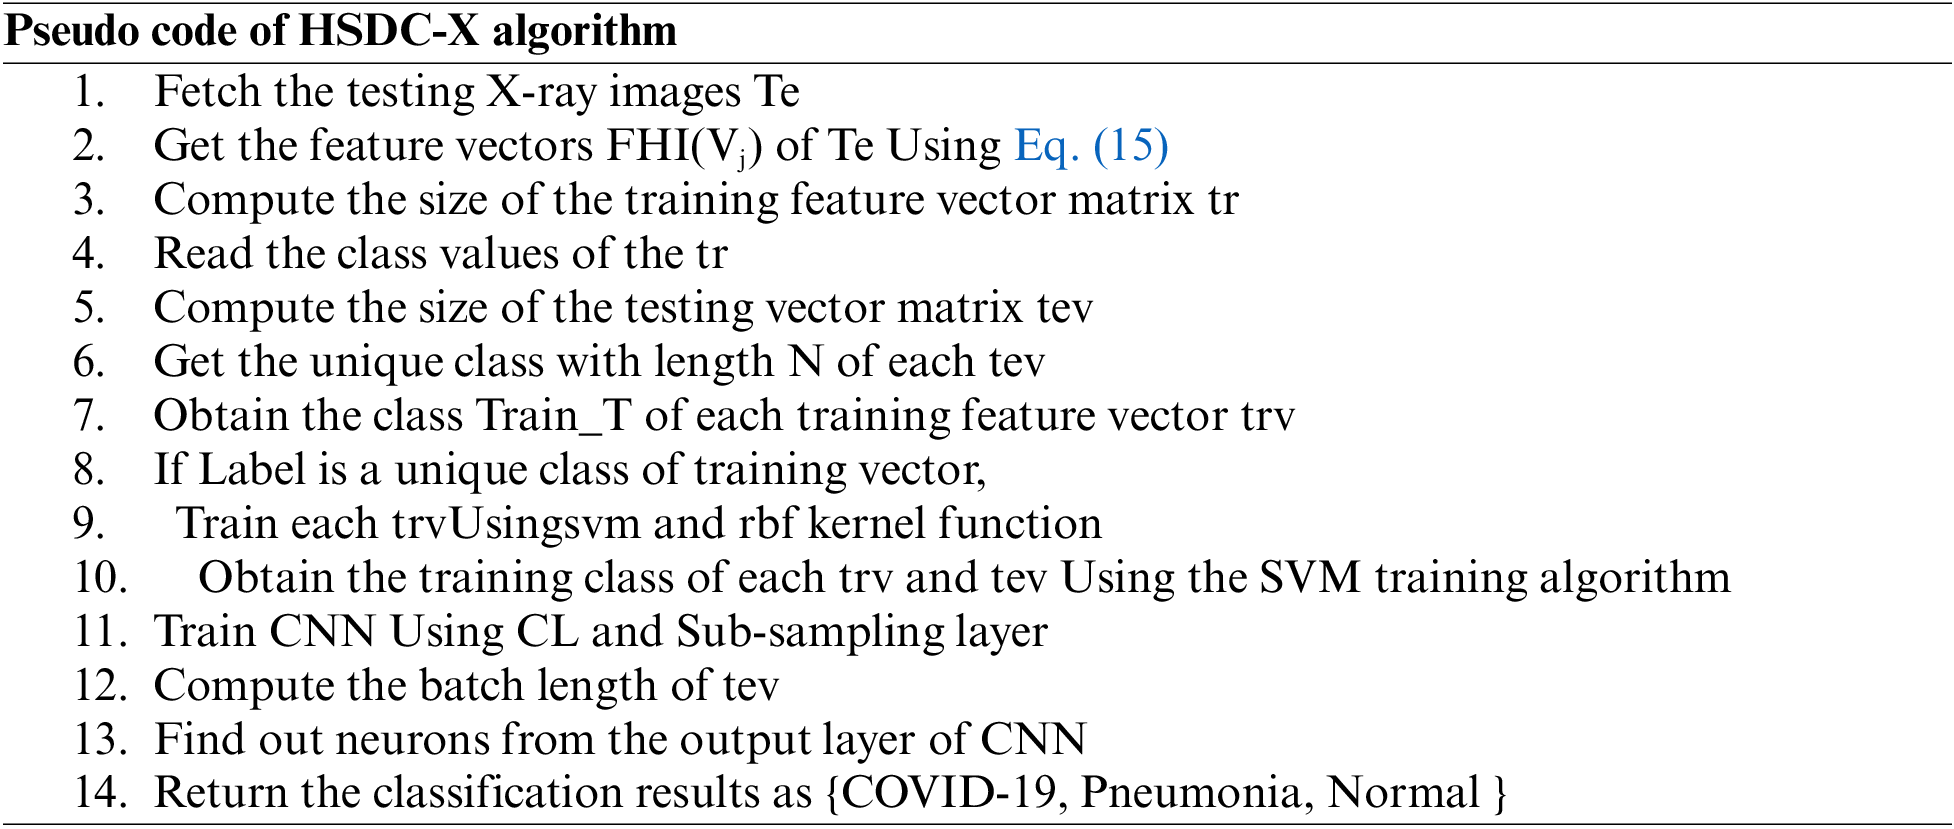
Each feature of the image is picked up from the test set of X-ray features. The dimension ofthe feature matrix is computed. Then the SVM Struct Uses the SVM kernel and RBF functions. Then the SVM training algorithm estimates the training features. In the next phase, CNN is trained, and the batch size of the testing feature is computed. The neurons from the CNN output layer are returned as the classification results as COVID-19, Pneumonia, and Normal.
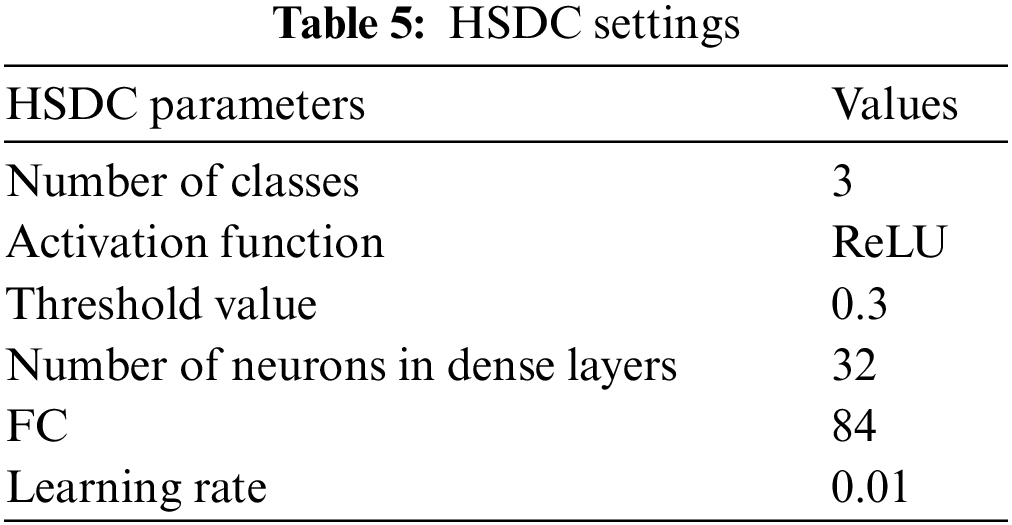
The proposed HSDC model was constructed in Python 8. The COVID-19 datasets for CT scan images are obtained from the Kaggle dataset [23]. The database of Wang et al. [24] was utilized for pneumonia and normal X-ray images. The accuracies of proposed classifiers are compared against DCNN, SVM, RF, K-Nearest Neighbor (KNN), AlexNet, VGG-16, and ResNet-50 classifiers by measuring the Accuracy, Precision, Recall, and F1-score metrics. Table 5 lists the settings used for HSDC classification.
In the CT scan images, 213 severe cases, 236 moderate cases, and 167 normal cases are taken for input. Fig. 3 shows some of the input images from normal, moderate, and severe categories.
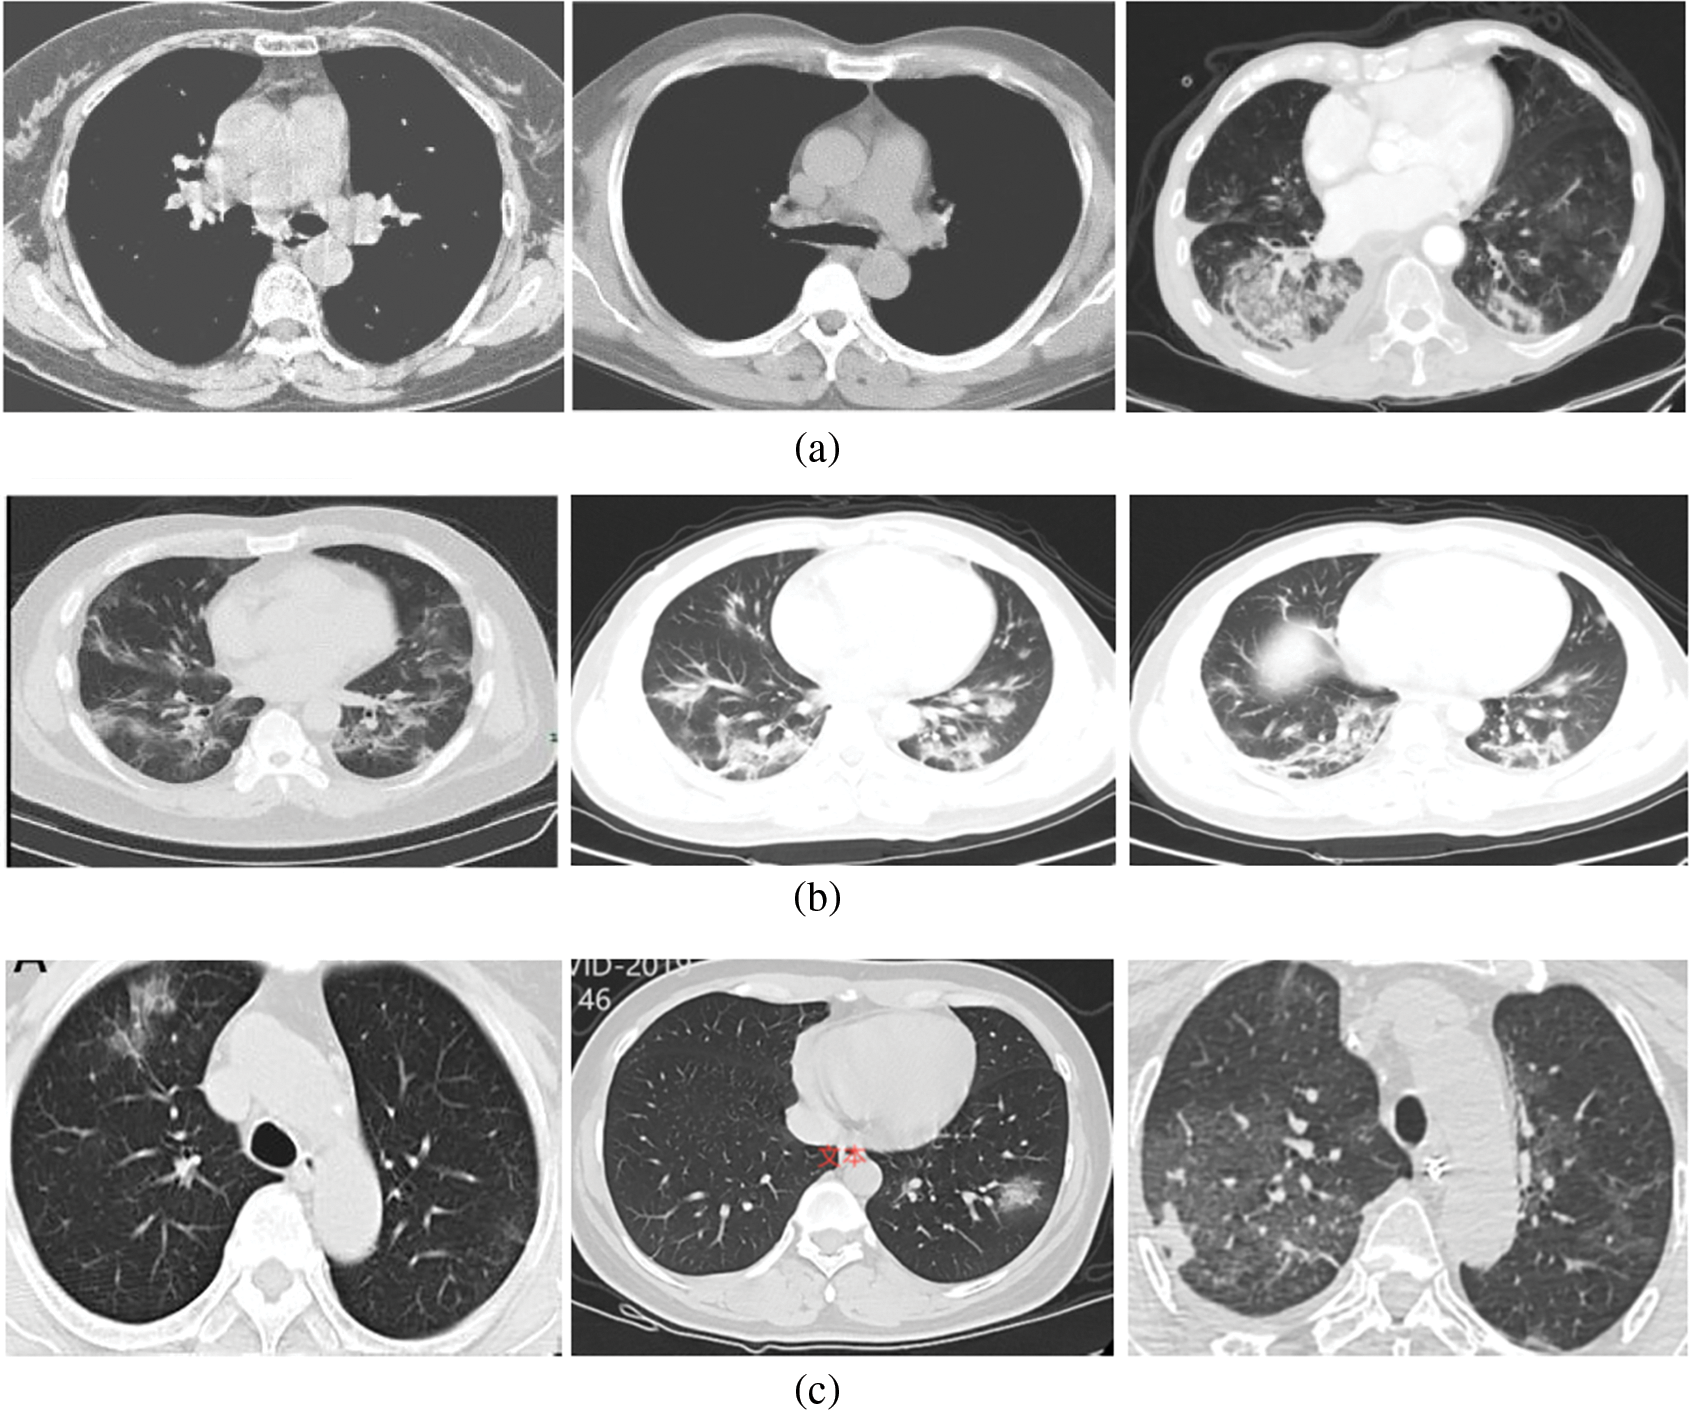
Figure 3: (a) Normal (No-COVID) cases (b) Moderate cases (c) Severe cases
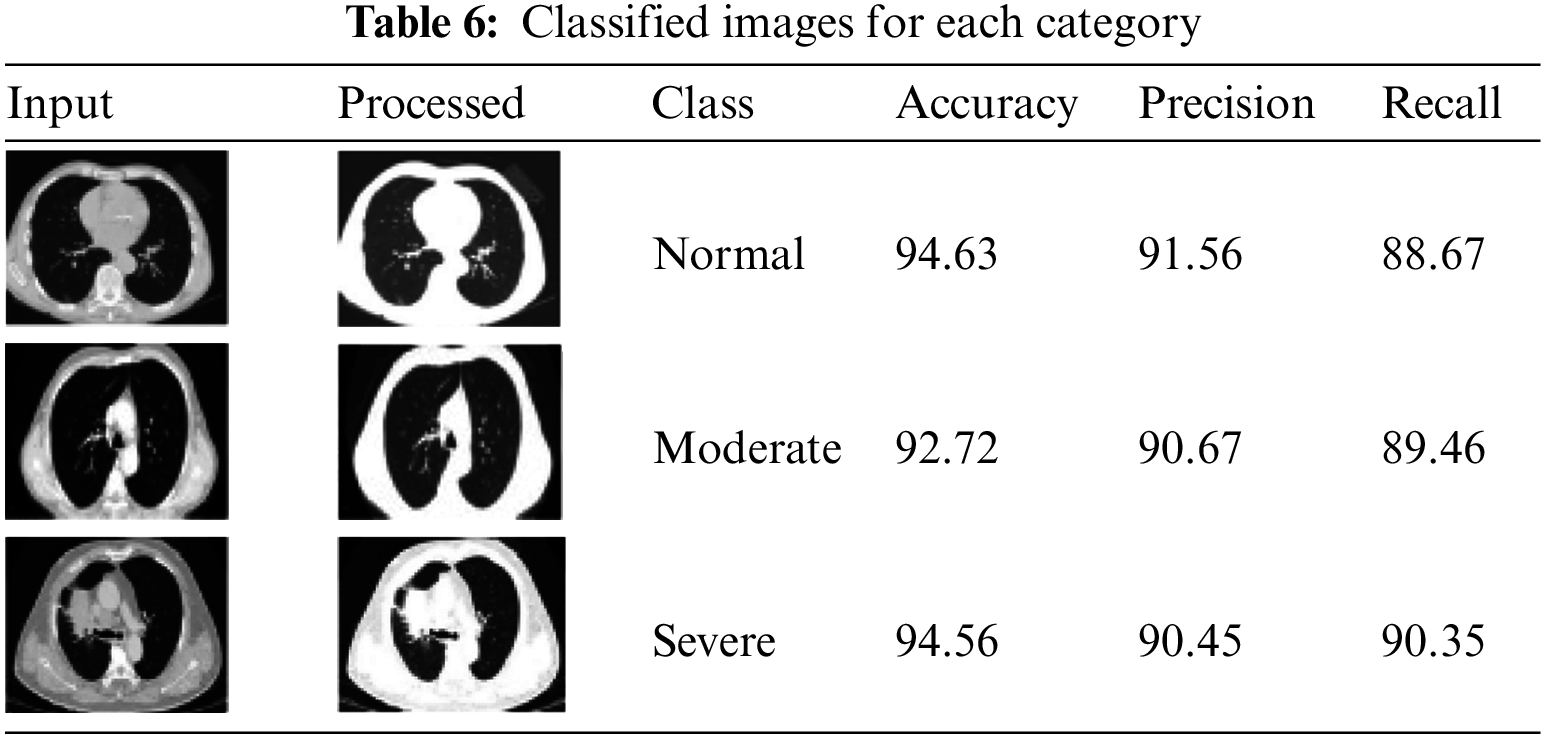
Table 6 shows each category’s classified images and their accuracy values.
It is natural to generate accuracy curves for an ML model on training and validation (TV) images during training. The training curve computed from the training dataset provides details about the accuracy of the HSDC-CT. The validation curve determined from a validation dataset includes information on obtained model accuracy. The TV loss and accuracy curves of HSDC-CT for 80 epochs are presented in Figs. 4a and 4b, respectively. The figure shows that the validation curve slightly differs from the training curve for higher epochs.
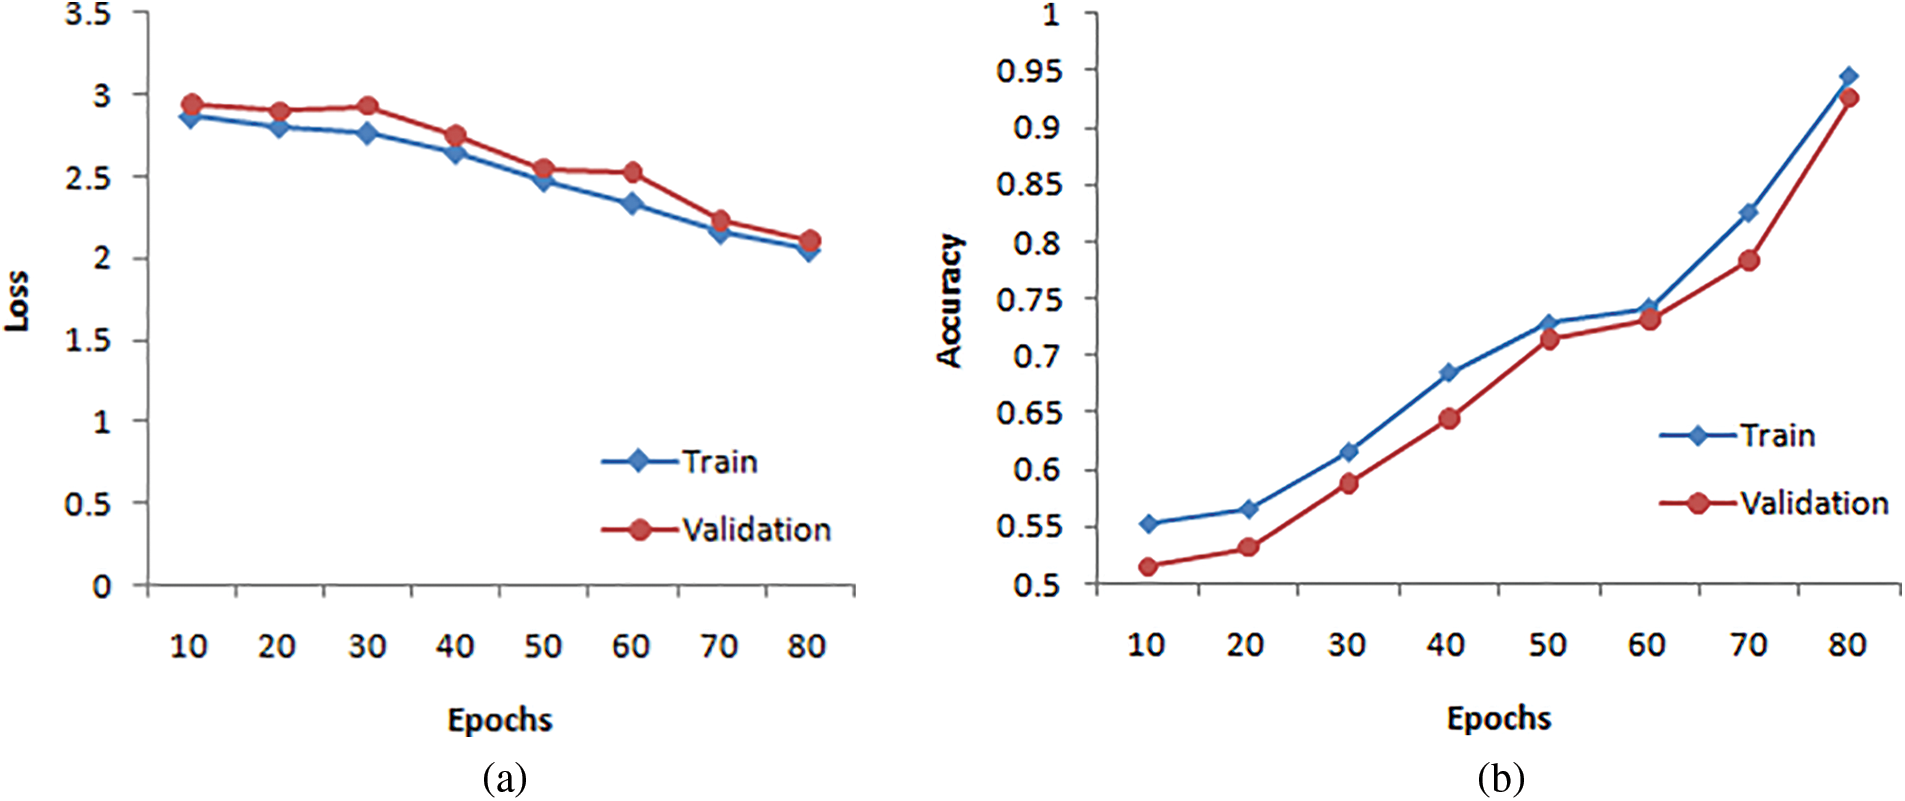
Figure 4: (a) Loss curves for HSDC-CT (b) Accuracy curves for HSDC-CT
Table 7 and Fig. 5 show the performance results for various classifiers.
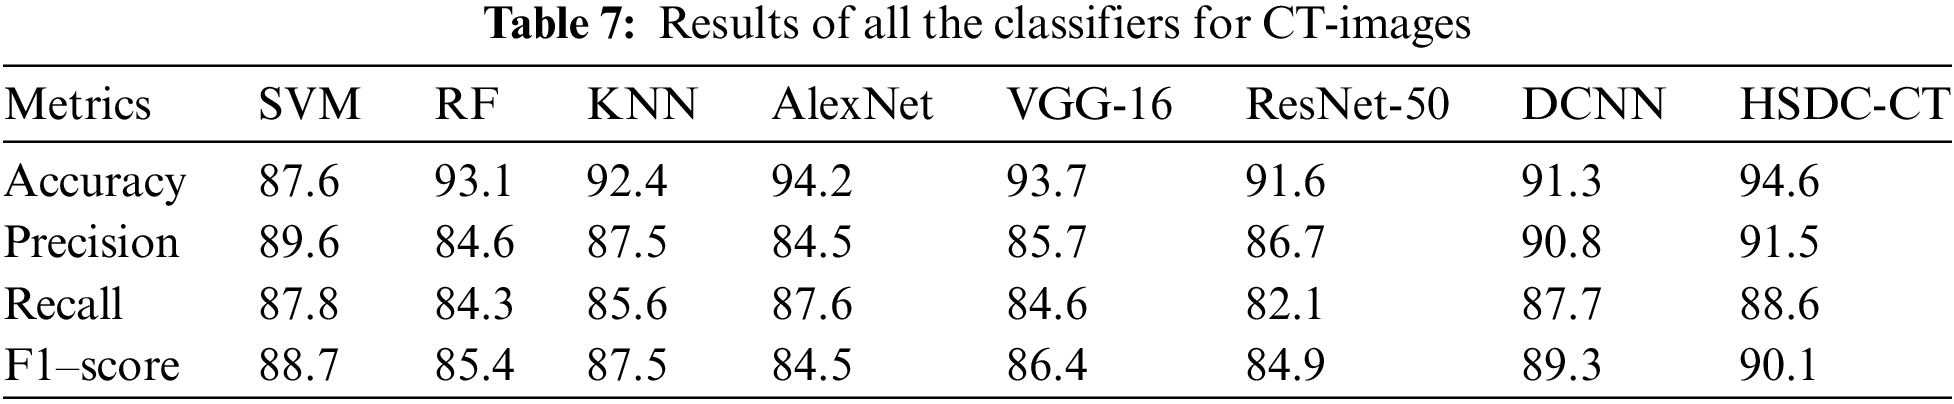
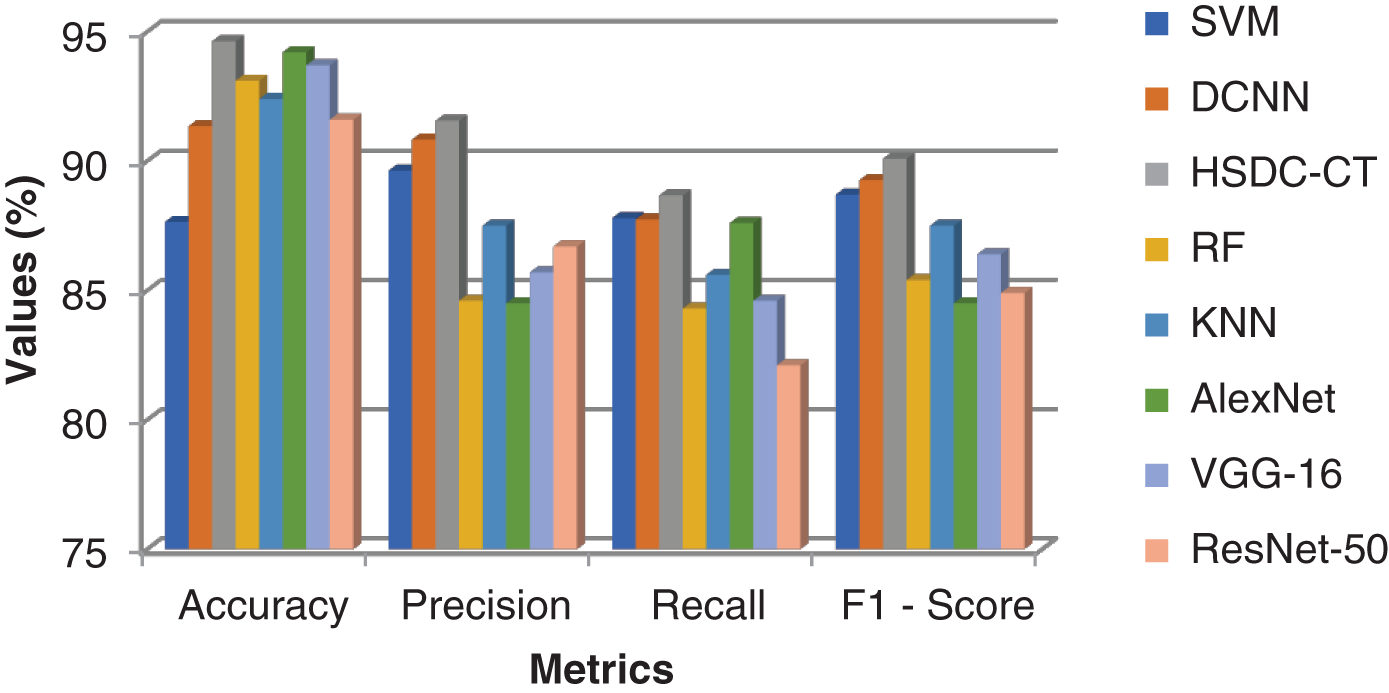
Figure 5: Comparison results of all classifiers for CT images
Fig. 5 shows that the accuracy of HSDC-CT is around 94.6, followed by other algorithms. Similarly, it outperforms the different techniques in terms of other metrics also.
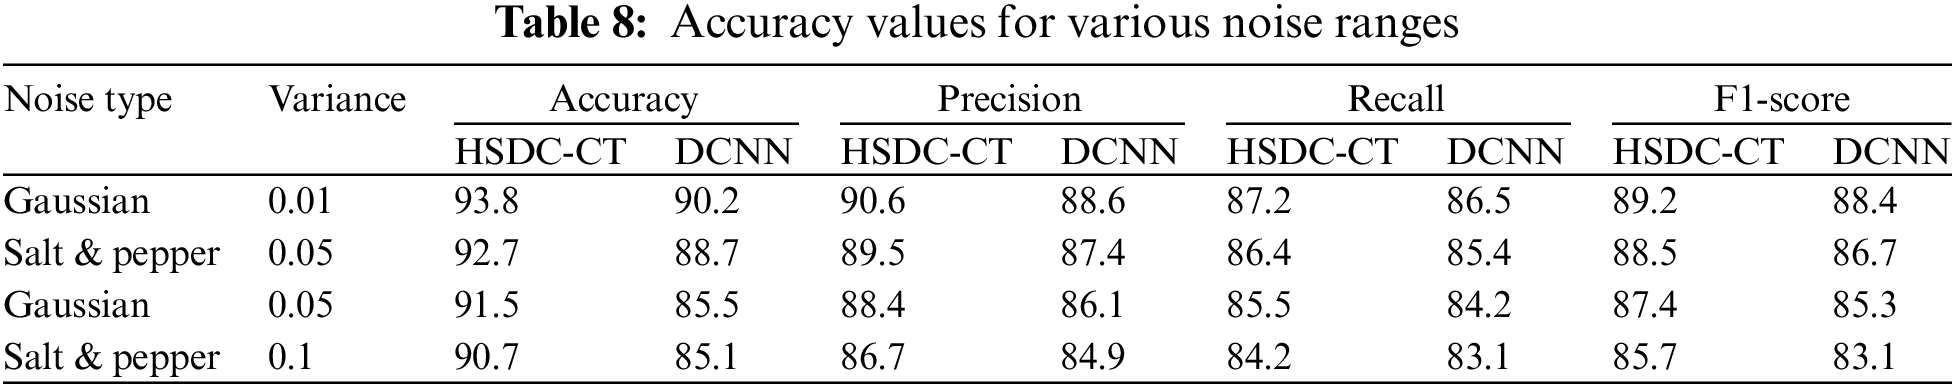
Impact of Noise
In the next experiment, the performance of HSDC-CT and DCNN classifiers is evaluated in the presence of noises. The input images are corrupted with Gaussian, salt, and pepper noises. Table 8 shows the results for different noise values.
Around 234 normal, 390 Pneumonia, and 267 COVID-19 X-ray images are considered as input. Fig. 6 contains the images of various categories. The preprocessing results of the MADF technique are demonstrated in Fig. 7.
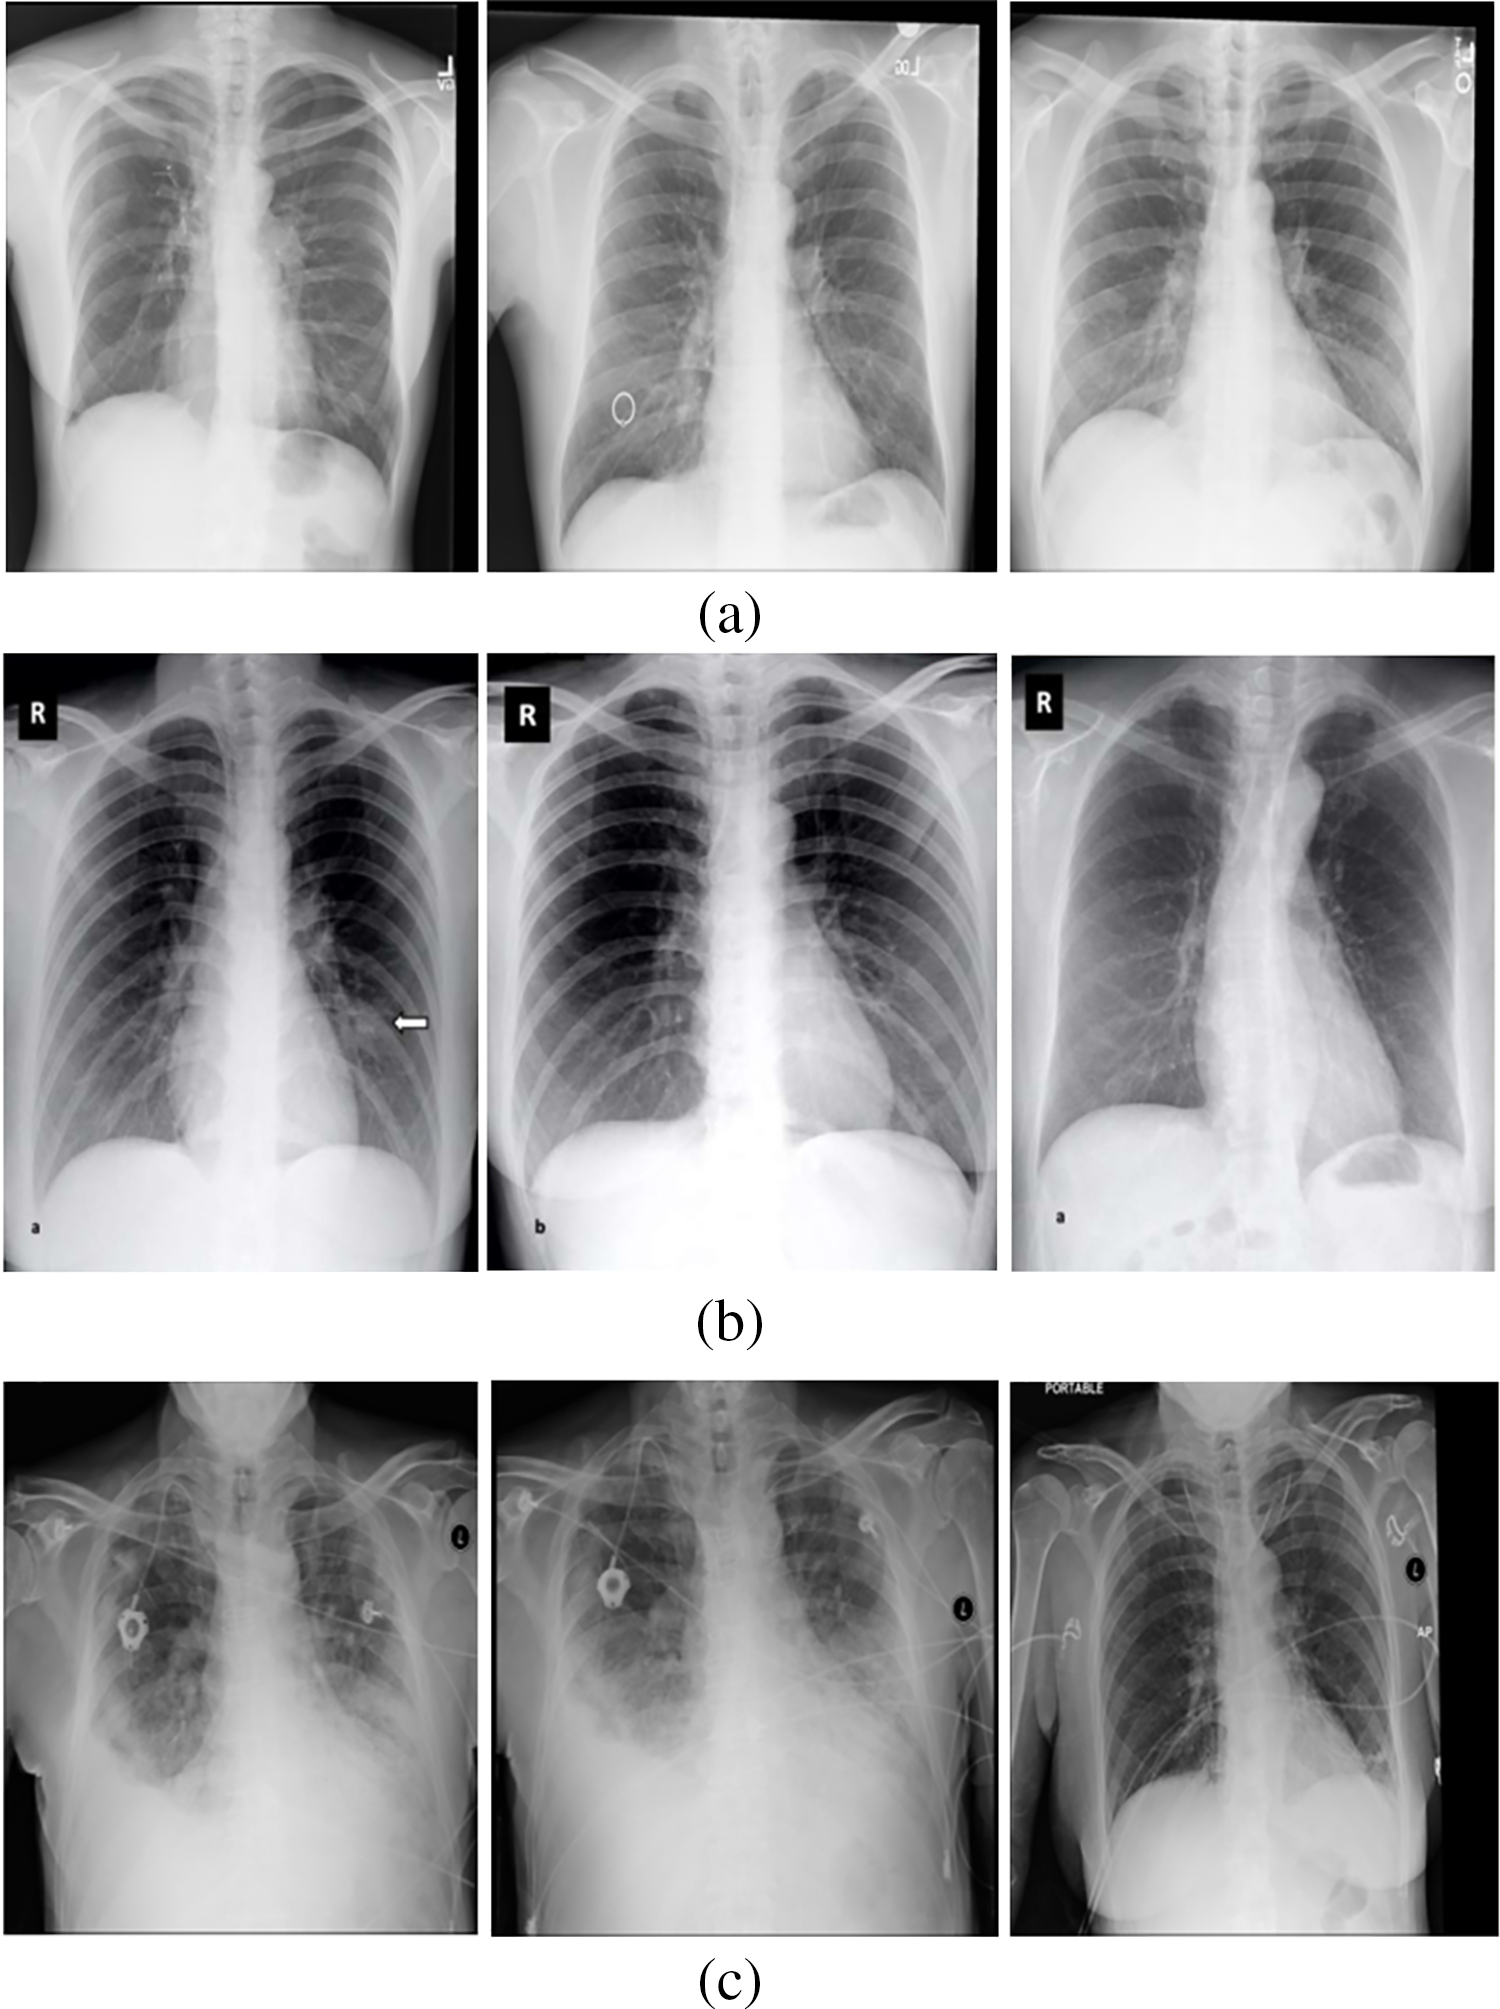
Figure 6: (a) Normal category (b) COVID-19 category (c) Pneumonia category
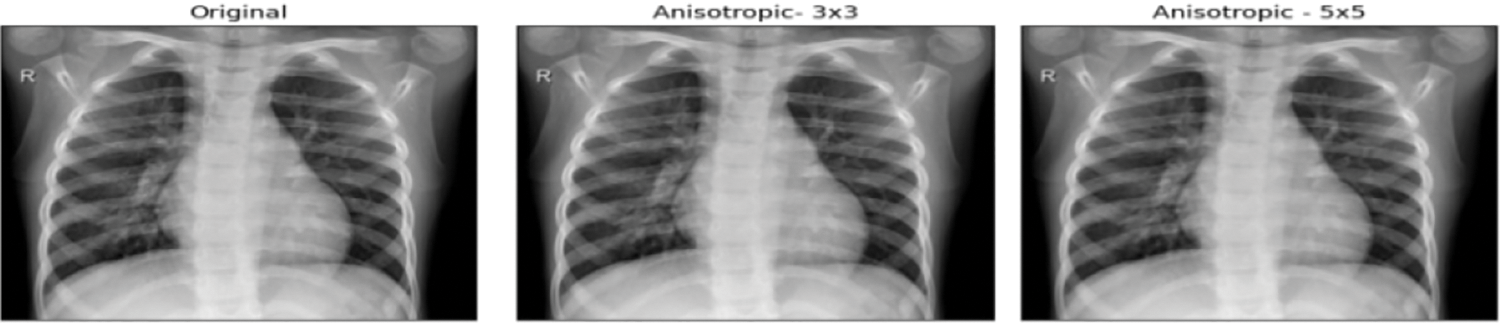
Figure 7: Preprocessed images
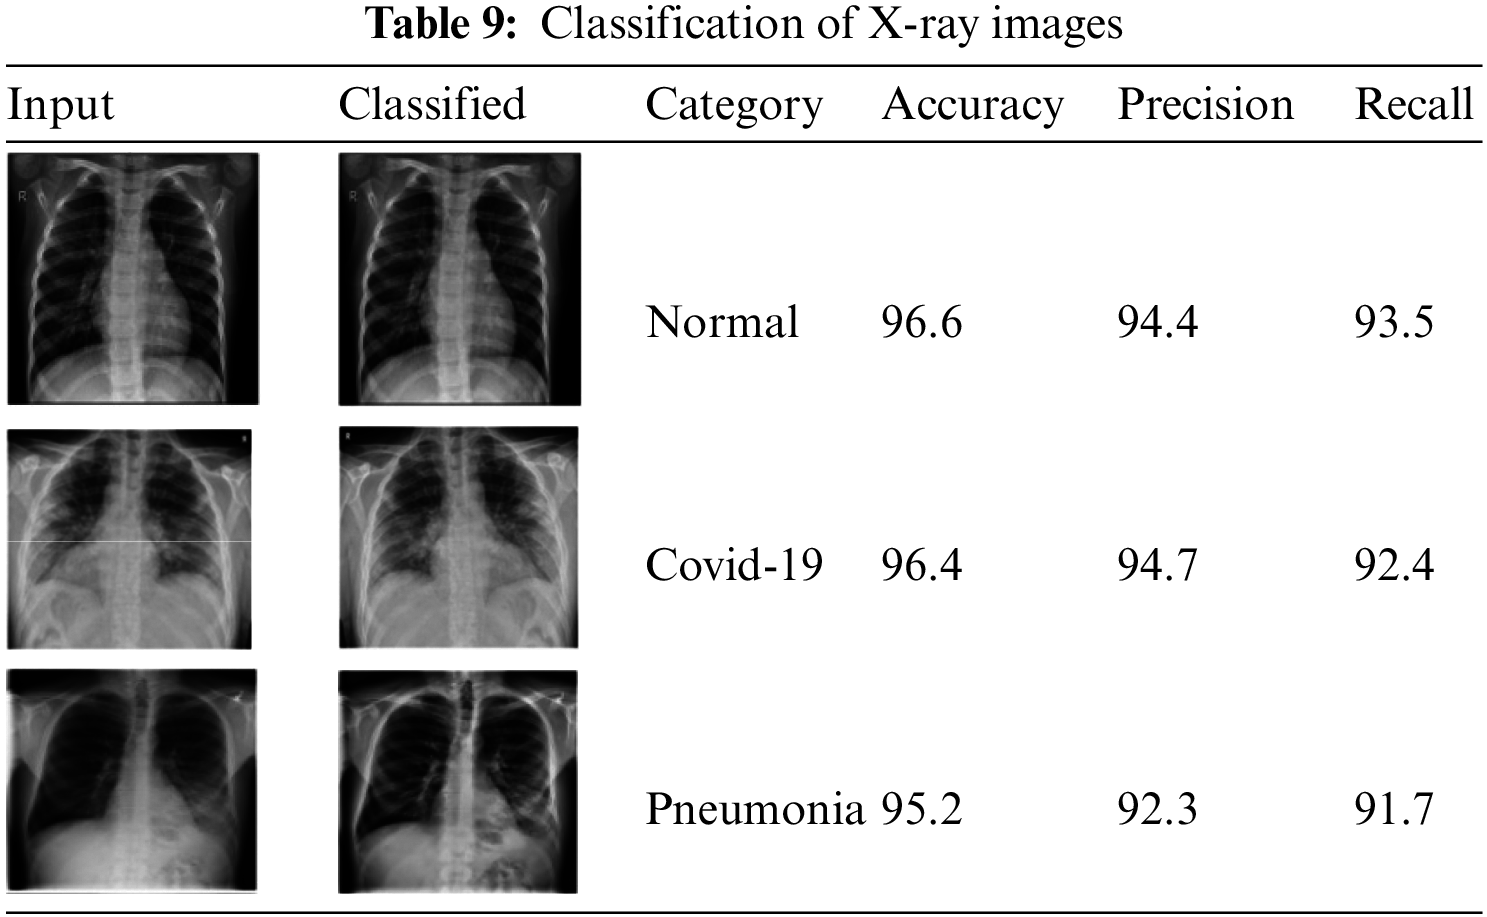
Table 9 shows the classified X-ray images.
The TV Loss and accuracy curves of HSDC-X for 80 epochs are presented in Figs. 8a and 8b, respectively. The figure shows that the validation curve has little deviation from the training curve for higher epochs.
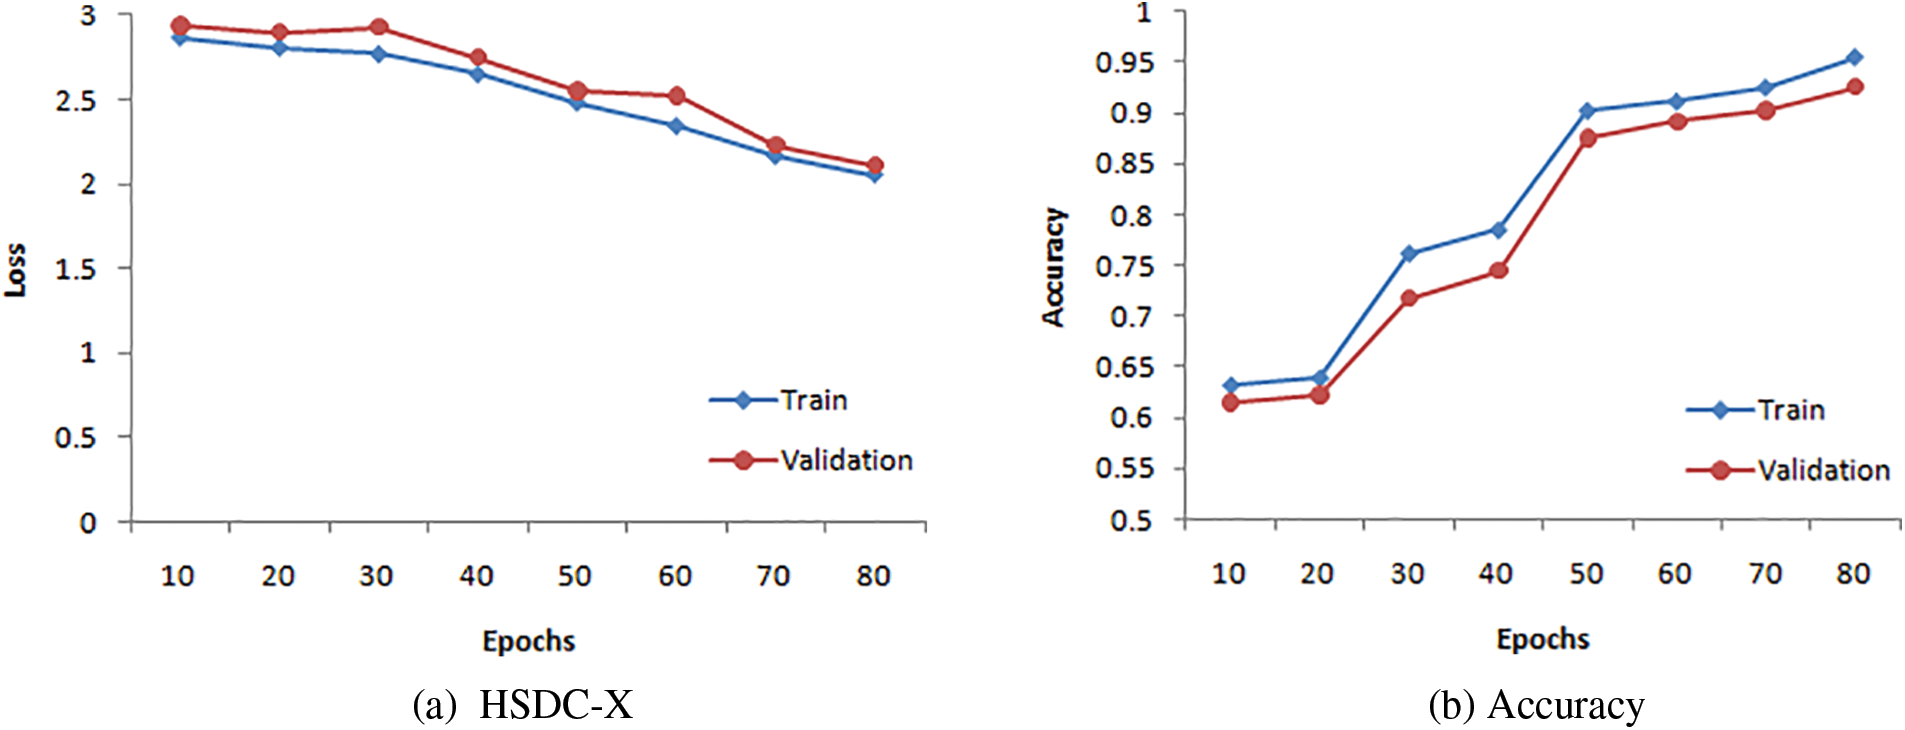
Figure 8: Training and validation curves for HSDC
Table 10 and Fig. 9 show the performance results of the algorithms.
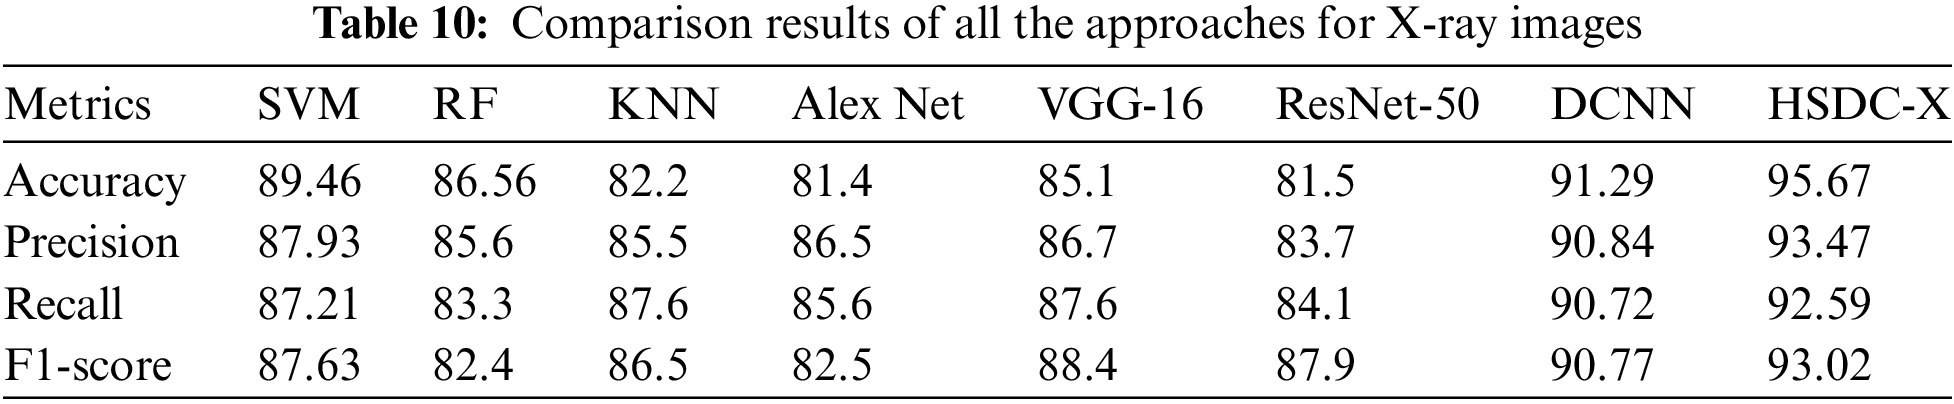
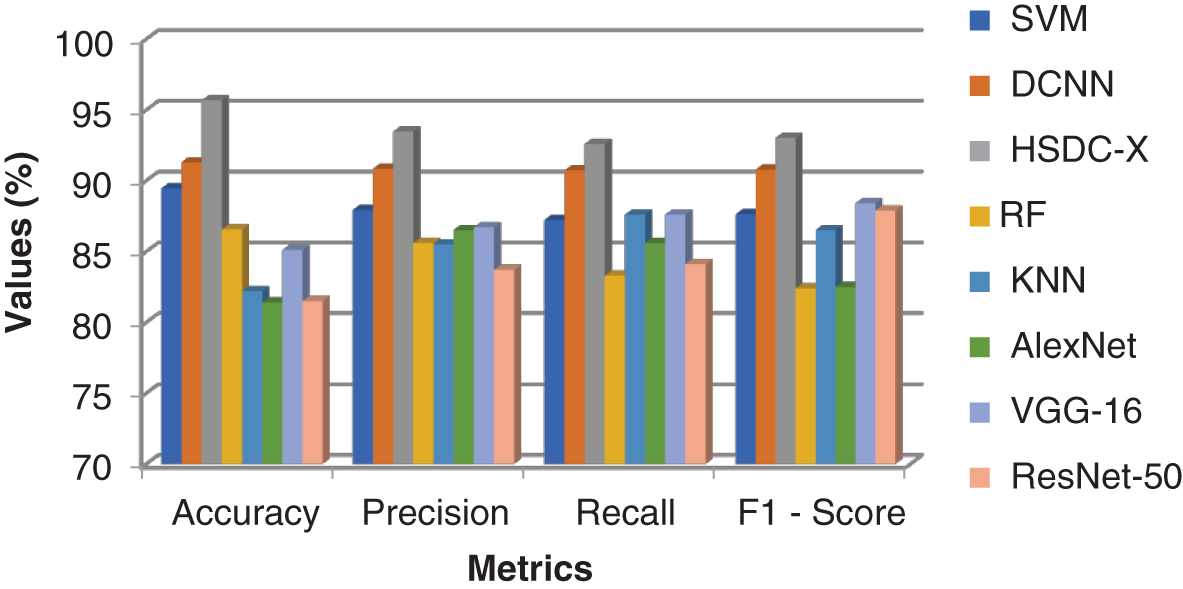
Figure 9: Comparison results of all the techniques for X-ray images
Since HSDC-X follows the training procedures of both SVM and CNN, it attains higher accuracy than the other two approaches. Fig. 9 shows that the accuracy of HSDC-X is around 95.6, followed by other algorithms. Similarly, it outperforms the different techniques in terms of other metrics also.
5.3 Convergence Time (CT) and Computational Complexity (CC)
The convergence time and computational complexities of the new and existing algorithms were analyzed on GPU settings, as shown in Table 11.
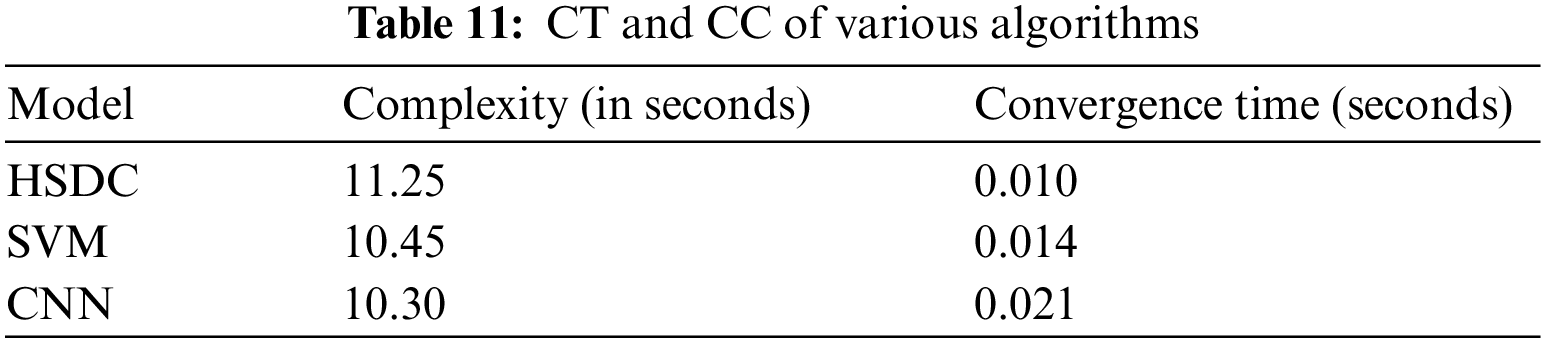
As depicted in Table 11, the proposed HSDC model has the least convergence time, around0.010 s which is lesser than SVM and CNN. But its computational complexity is slightly higher, around11.25 s, than SVM and CNN, due to the integration of SVM and CNN.
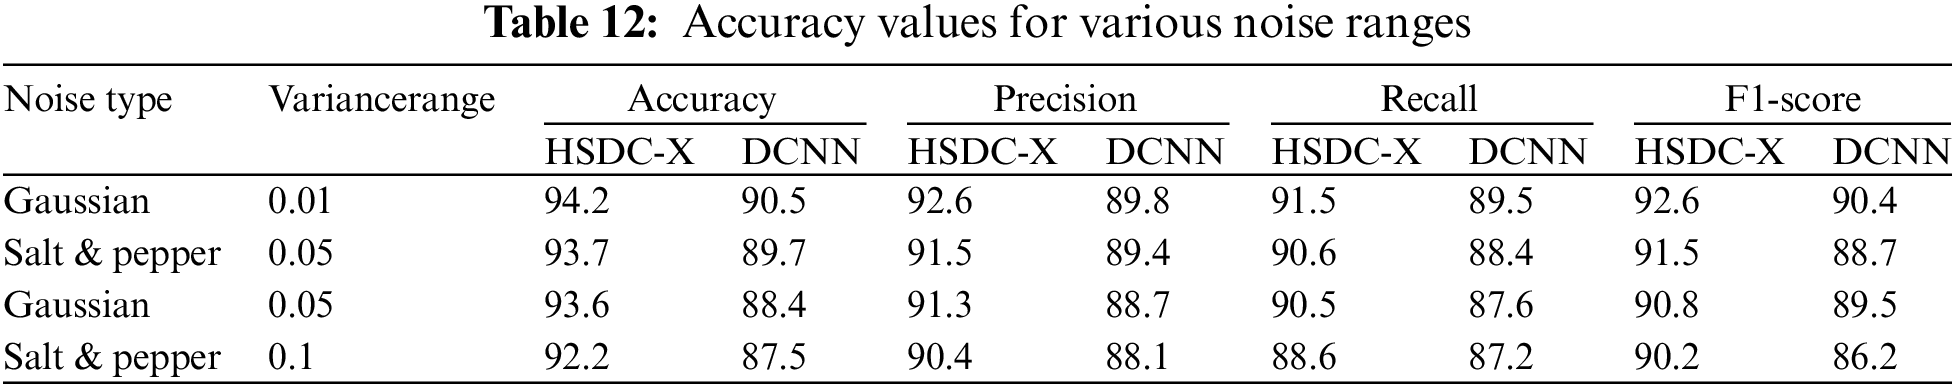
Impact of Noise
In the next experiment, the performance of HSDC-X and DCNN classifiers is evaluated in the presence of noises. Table 12 shows the results for different noise values.
In this paper, the HSDC model was proposed for COVID-19 detection and classification. For CT-scan Images, the histogram threshold is computed using the ICHSeg algorithm. The selected regions from the feature vector are classified using the HSDC-CT algorithm as normal, moderate, and severe. For X-ray images, the FHI features are used in the training process. The X-ray images are categorized Using the HSDC-X algorithm. The HSDC model has been implemented in Python. Experimental results have shown that the accuracy of the HSDC model attains the highest of 94.6 for CT scan images and 95.6 for X-ray images, than the other algorithms.
Limitations: Though this work predicts the severity of COVID-19 infection only from images, it could not be able to predict the death and survival rate of the patients.
Future work focuses on predicting the survival and death rate of COVID-19 patients from their case history database.
Funding Statement: The authors received no specific funding for this study
Conflicts of Interest: The authors declare that they have no conflicts of interest to report regarding the present study.
References
1. L. Brunese, F. Martinelli, F. Mercaldo and A. Santone, “Machine learning for coronavirus covid-19 detection from chest X-rays,” Procedia Computer Science, vol. 176, pp. 2212–2221, 2020. [Google Scholar]
2. M. M. Rahaman, C. Li, Y. Yao, F. K, M. A. Rahman et al., “Identification of COVID-19 samples from chest X-ray images using deep learning: A comparison of transfer learning approaches,” Journal of X-Ray Science and Technology, vol. 28, pp. 821–839, 2020. https://doi.org/10.3233/XST-200715 [Google Scholar] [PubMed] [CrossRef]
3. N. S. Shadin, S. Sanjana and N. J. Lisa, “COVID-19 diagnosis from chest X-ray images using convolutional neural network (CNN) and inceptionv3,” in Int. Conf. on Information Technology (ICIT), Amman, Jordan, 2021. [Google Scholar]
4. B. Sekeroglu and I. Ozsahin, “Detection of COVID-19 from chest X-ray images using convolutional neural networks,” SLAS Technology, vol. 25, no. 6, pp. 553–565, 2020. [Google Scholar] [PubMed]
5. S. Pradeep, C. Malathy, T. Vardhan and T. Sainadh, “Detection of malware from IoT devices using deep learning techniques,” Journal of Physics: Conference Series, 2021. https://doi.org/10.1088/1742-6596/1818/1/012219 [Google Scholar] [CrossRef]
6. R. Jayaram and T. Senthil Kumar, “Onboard cloud-enabled Parkinson disease identification system using enhanced grey wolf optimization,” Computing Technology and Information Management, vol. 18, pp. 1360–1372, 2021. [Google Scholar]
7. D. A. Garzón, J. A. Grisales, S. O. Arias, H. B. Ar Arteaga, M. A. Bravo-Ortiz et al., “COVID-19 detection in X-ray images using convolutional neural networks,” Machine Learning with Applications, vol. 6, no. 100138, 2021. https://doi.org/10.1016/j.mlwa.2021.100138 [Google Scholar] [PubMed] [CrossRef]
8. T. Ozturk, M. Talo, E. A. Yildirim, U. B. Baloglu, O. Yildirim et al., “Automated detection of COVID-19 cases using deep neural networks with X-ray images,” Computers in Biology and Medicine, vol. 121, no. 103792, 2020. https://doi.org/10.1016/j.compbiomed.2020.103792 [Google Scholar] [PubMed] [CrossRef]
9. M. Alotaibi and B. Alotaibi, “Detection of COVID-19 using ddeep learning on X-ray images,” Intelligent Automation & Soft Computing, 2021. https://doi.org/10.32604/iasc.2021.018350 [Google Scholar] [CrossRef]
10. M. Aminu, N. A. Ahmad and M. H. M. Noor, “COVID-19 detection via deep neural network and occlusion sensitivity maps,” Alexandria Engineering Journal, vol. 2021, no. 60, pp. 4829–4855, 2021. [Google Scholar]
11. R. Jain, M. Gupta, S. Taneja and D. Jude Hemanth, “Deep learning based detection and analysis of COVID-19 on chest X-ray images,” Applied Intelligence, vol. 51, pp. 1690–1700, 2021. [Google Scholar] [PubMed]
12. Y. Qiblaweya, A. Tahira, E. H. Muhammad, H. Chowdhurya, A. Khandakara et al., “Detection and severity classification of COVID-19 in CT images using deep learning,” MDPI, vol. 11, no. 5, 2021. https://doi.org/10.3390/diagnostics11050893 [Google Scholar] [PubMed] [CrossRef]
13. D. Müller, I. S. Rey and F. Kramer, “Robust chest CT image segmentation of COVID-19 lung infection based on limited data,” Informatics in Medicine, vol. 25, no. 100681, 2021. https://doi.org/10.1016/j.imu.2021.100681 [Google Scholar] [PubMed] [CrossRef]
14. M. O. Arowolo, R. O. Ogundokun, S. Misra, F. Kadri and T. O. Aduragba, “Machine learning approach using KPCA-SVMs for predicting COVID-19,” Healthcare Informatics for Fighting COVID-19 and Future Epidemics, vol. 1, pp. 193–209, 2022. [Google Scholar]
15. M. O. Arowolo, R. O. Ogundokun, S. Misra, B. D. Agboola and B. Gupta, “Machine learning-based IoT system for COVID-19 epidemics,” Computing, vol. 1, pp. 831–847, 2022. [Google Scholar]
16. M. O. Arowolo, M. O. Adebiyi, E. P. Michael, H. Eric Aigbogun, S. O. Abdulsalam et al., “Detection of COVID-19 from chest X-ray images using CNN and ANN approach,” International Journal of Advanced Computer Science and Applications, vol. 13, no. 6, pp. 754–759, 2022. [Google Scholar]
17. C. Huang, X. Li and Y. Wen,“AN OTSU image segmentation based on fruitfly optimization algorithm,” Alexandria Engineering Journal, vol. 60, pp. 183–188, 2021. [Google Scholar]
18. J. Wang, Z. Cheng, O. K. Ersoy, M. Zhang, K. Sun et al., “Improvement and application of chicken swarm optimization for constrained optimization,” IEEE Access, vol. 7, pp. 58053–58072, 2019. [Google Scholar]
19. N. Alam, M. Ahsan, M. A. Based, J. Haider and M. Kowalski, “COVID-19 detection from chest X-ray images using feature fusion and deep learning,” Sensors, MDPI, vol. 21, no. 4, 2021. https://doi.org/10.3390/s21041480 [Google Scholar] [PubMed] [CrossRef]
20. N. Khehrah, M. S. Farid, S. Bilal and M. H. Khan, “Lung nodule detection in CT images using statistical and shape-based features,” Journal of Imaging, MDPI, vol. 6, no. 2, 2020. https://doi.org/10.3390/jimaging6020006 [Google Scholar] [PubMed] [CrossRef]
21. M. J. J. Ghrabat, G. Ma, I. Y. Maolood, S. S. Alresheedi and Z. A. Abduljabbar, “An effective image retrieval based on optimized genetic algorithm utilized a novel SVM-based convolutional neural network classifier,” Human Centric Computing Information Sciences, vol. 9, no. 3, 2019. https://doi.org/10.1186/s13673-019-0191-8 [Google Scholar] [CrossRef]
22. M. Baskar, J. Ramkumar, R. Rathore and R. Kabra, “A deep learning based approach for automatic detection of bike riders with no helmet and number plate recognition,” International Journal of Advanced Science and Technology, vol. 29, no. 4, pp. 1844–1854, 2020. [Google Scholar]
23. 2020. https://www.kaggle.com/c/covidct/data?select=Train [Google Scholar]
24. 2017. https://Openaccess.thecvf.com/Content_cvpr_2017/Papers/Wang_ChestX-ray [Google Scholar]
Cite This Article
 Copyright © 2023 The Author(s). Published by Tech Science Press.
This work is licensed under a Creative Commons Attribution 4.0 International License , which permits unrestricted use, distribution, and reproduction in any medium, provided the original work is properly cited.
 Downloads
 Citation Tools