
 Submit a Paper
 Propose a Special lssue
 Open Access
ARTICLE

Stock Market Prediction Using Generative Adversarial Networks (GANs): Hybrid Intelligent Model
1 Department of Management Information Systems, Ataturk University, Erzurum, 25030, Turkey
2 Department of Management Information Systems, Karadeniz Technical University, Trabzon, 61080, Turkey
* Corresponding Author: Fares Abdulhafidh Dael. Email:
Computer Systems Science and Engineering 2023, 47(1), 19-35. https://doi.org/10.32604/csse.2023.037903
Received 21 November 2022; Accepted 09 February 2023; Issue published 26 May 2023
 View Full Text
 Download PDF
Abstract
The key indication of a nation’s economic development and strength is the stock market. Inflation and economic expansion affect the volatility of the stock market. Given the multitude of factors, predicting stock prices is intrinsically challenging. Predicting the movement of stock price indexes is a difficult component of predicting financial time series. Accurately predicting the price movement of stocks can result in financial advantages for investors. Due to the complexity of stock market data, it is extremely challenging to create accurate forecasting models. Using machine learning and other algorithms to anticipate stock prices is an interesting area. The purpose of this article is to forecast stock market values to assist investors to make better informed and precise investing decisions. Statistics, Machine Learning (ML), Natural language processing (NLP), and sentiment analysis will be used to accomplish the study’s objectives. Using both qualitative and quantitative information, the study developed a hybrid model. The hybrid model has been handled with GANs. Based on the model’s predictions, a buy-or-sell trading strategy is offered. The conclusions of this study will assist investors in selecting the ideal choice while selling, holding, or buying shares.Keywords
The stock market is an exchange where investors may buy and sell shares based on the availability of stocks. The earnings of stakeholders are influenced by stock market volatility. If stocks remain available and market prices continue to rise, investors will profit from their purchases. In the alternative, if stock values fall while the market is still open, stakeholders will suffer losses. To make a large profit, buyers purchase stocks at cheap prices and sell them at high prices. In a similar vein, retailers mark up their merchandise to maximize profit [1]. The Stock Market serves as a reliable marketplace for vendors and buyers. With its sophisticated qualities, advances in Artificial Intelligence (AI) support many aspects of life. There are several AI algorithms at work making predictions [2]. Machine learning is a type of artificial intelligence that lets us train machines with data and look into the future using test data. Algorithms are a set of standards that can be used to train machines. For businessmen, Stock Market Predictions can be quite helpful. Stock Market Predictions predict stock price trends based on historical data [3]. Investors can achieve success if they have access to future predictions. Capability risks in the corporate world can result in success.
Stock market participation by the general public has increased dramatically in the previous several decades [4]. This means that billions of dollars in assets are traded every day on the stock market [5], with investors aiming to make money on the market over a long time. Market participants, such as private or institutional investors, could routinely earn larger risk-adjusted returns than the market if they were able to precisely foresee the market’s behavior. As a result, more precise stock market forecasting models are being built using machine learning and computational intelligence techniques. Stock market forecasting models and systems have been developed in a large number of published studies [6,7] with some studies concluding they can make money [8,9]. One of the most important but also one of the most difficult tasks in financial research is stock market forecasting [10]. The efficient market hypothesis can be questioned even if an investor achieves long-term success in terms of risk-adjusted returns. The efficient market theory and the underlying concept of asset fair valuation are coming under increasing criticism [11]. Financial markets have shown both overreactions and underreactions in the past, as well as a lack of long-term momentum as well as excessive price volatility [12].
The stock market is notoriously unpredictable because of the myriad of circumstances that must occur before a stock may move in any given direction. In a market as financially volatile as the stock market, a very precise projection of a future trend is essential. In the current economic climate, having access to accurate stock valuation estimates is crucial. The media constantly covers stories related to the stock market. The media will cover the new highs and lows of the economy. Potentially increased short-term price forecasting accuracy would boost the stock market’s attractiveness as an investment and commercial venue.
This study will make use of statistical, ML, NLP, and sentiment analysis. The most recent developments in deep learning will be used to create a model that can forecast changes in stock price. Based on what the model predicts, a trading strategy is suggested, along with a recommendation to buy or sell. By presenting the idea of hybrid machine learning and deep learning models for stock prediction. The objectives of the study are: to combine several techniques for stock market forecasting and to provide a model with high accuracy and robustness to predict the stock market.
The paper is organized with Section 2 discussing relevant work, followed by Section 3 discussing methodology and the suggested research model. Section 4 presents and examines the study’s findings and concludes with a model evaluation. Section 5 concludes with the study’s findings, contributions, and limitations.
The fundamental analysis of a company, including its financial situation, quarterly balance, dividends, audit reports, sales data, import/export volume, and audit reports, is a part of stock market forecasting. This is just half of the picture; the other part consists of opinions and rumors about the company in the actual world, which are crucial because they might affect stock price changes. The hybrid approach based on a model integrates all market-influencing factors. To make use of the benefits of each model in predicting weekly stock values, [13] create a Proposed Hybrid Model (PHM) that combines three models: the Exponential Smoothing Method (ESM), Autoregressive Integrated Moving Average (ARIMA), and a Backpropagation Neural Network (BPNN) model. This study shows that the hybrid model outperforms all component sub-models and conventional models with a directional accuracy of 70.16% when tested on the Shenzhen Integrated Index and Dow Jones Industrial Average (DJIA).
A hybrid deep learning model that combines the well-known Deep Neural Network (DNN) architectures Long Short-Term Memory (LSTM) and Gated Recurring Units (GRU) was presented by [14]. The authors used a 66-year S&P 500 time series dataset to develop a prediction model (1950 to 2016). To get the first-level prediction, the technique comprises passing the input data to the LSTM network and then transferring the output of the LSTM layer to the GRU layer. The proposed network outperformed earlier neural network techniques, achieving a Mean Squared Error (MSE) of 0.00098.
Using information about the stock market, the model developed in [6] attempts to anticipate future prices. The accuracy of the model is evaluated by comparing it to comparable models and combining Adaline Neural Network (ANN) with modified Particle Swarm Optimization (PSO). In [15], a hybrid intelligent model employing an Adaptive Network-based Fuzzy Inference System (ANFIS) and quantum-behaved particle swarm optimization was presented. The model is used to estimate market prices in the future. Due to the random character of stock prices, the hybrid Bi-LSTM-GRU model and traditional statistical models presented in [16] do not perform well. Utilizing Bi-LSTM and GRU networks, the proposed model outperforms other models. In [17], a hybrid stock prediction model was presented. The model comprises a noise-filtering approach, unique features, and a prediction based on machine learning. The technique of noise filtering is utilized to smooth historical stock price data by eliminating the cyclic component of the time series. The new characteristics are utilized to forecast the stock price. Traditional and deep machine learning techniques for prediction are investigated using machine learning-based prediction. The study of [18], discovered that utilizing deep learning techniques and machine learning models, such as the LSTM models, with hybrid multilingual sentiment data (data that has been translated from non-native English-speaking countries into English), is a more accurate method of stock market forecasting than utilizing other models with various data types. Research [19] examined the use of Principal Component Analysis (PCA), Empirical Mode Decomposition (EMD), and LSTM to forecast Thailand’s stock values. Additionally, they utilized news sentiment analysis to see whether it would enhance the performance of the LSTM model. The study indicated that the suggested framework performed better than the baseline approaches and that news sentiment analysis enhanced the LSTM model’s performance. The model described in [20] consists of an LSTM-GRU network and 25 features. Indicators of performance demonstrate that the suggested model is more accurate than competing models. Reference [21] discusses the difficulties of forecasting stock performance and the superiority of the suggested ensemble ARIMA-LSTM technique. In [22], a hybrid approach for predicting financial time series was presented. LSTM, Polynomial Regression (PR), and Chaos Theory make up the model. The existence of chaos in the model is evaluated and then modeled. For the first forecasts, the model time series will be put into LSTM. The sequence of mistakes obtained from LSTM predictions is PR-appropriate for error forecasting. The final hybrid model forecasts are produced by using error forecasts and original model projections. In his research, [23] contributes in two ways. First, he introduced a unique and resilient deep convolutional GAN architecture that serves in both generative and discriminative networks for stock price forecasting. He also advised modifying the generator’s loss function by adding additional phrases to improve prediction.
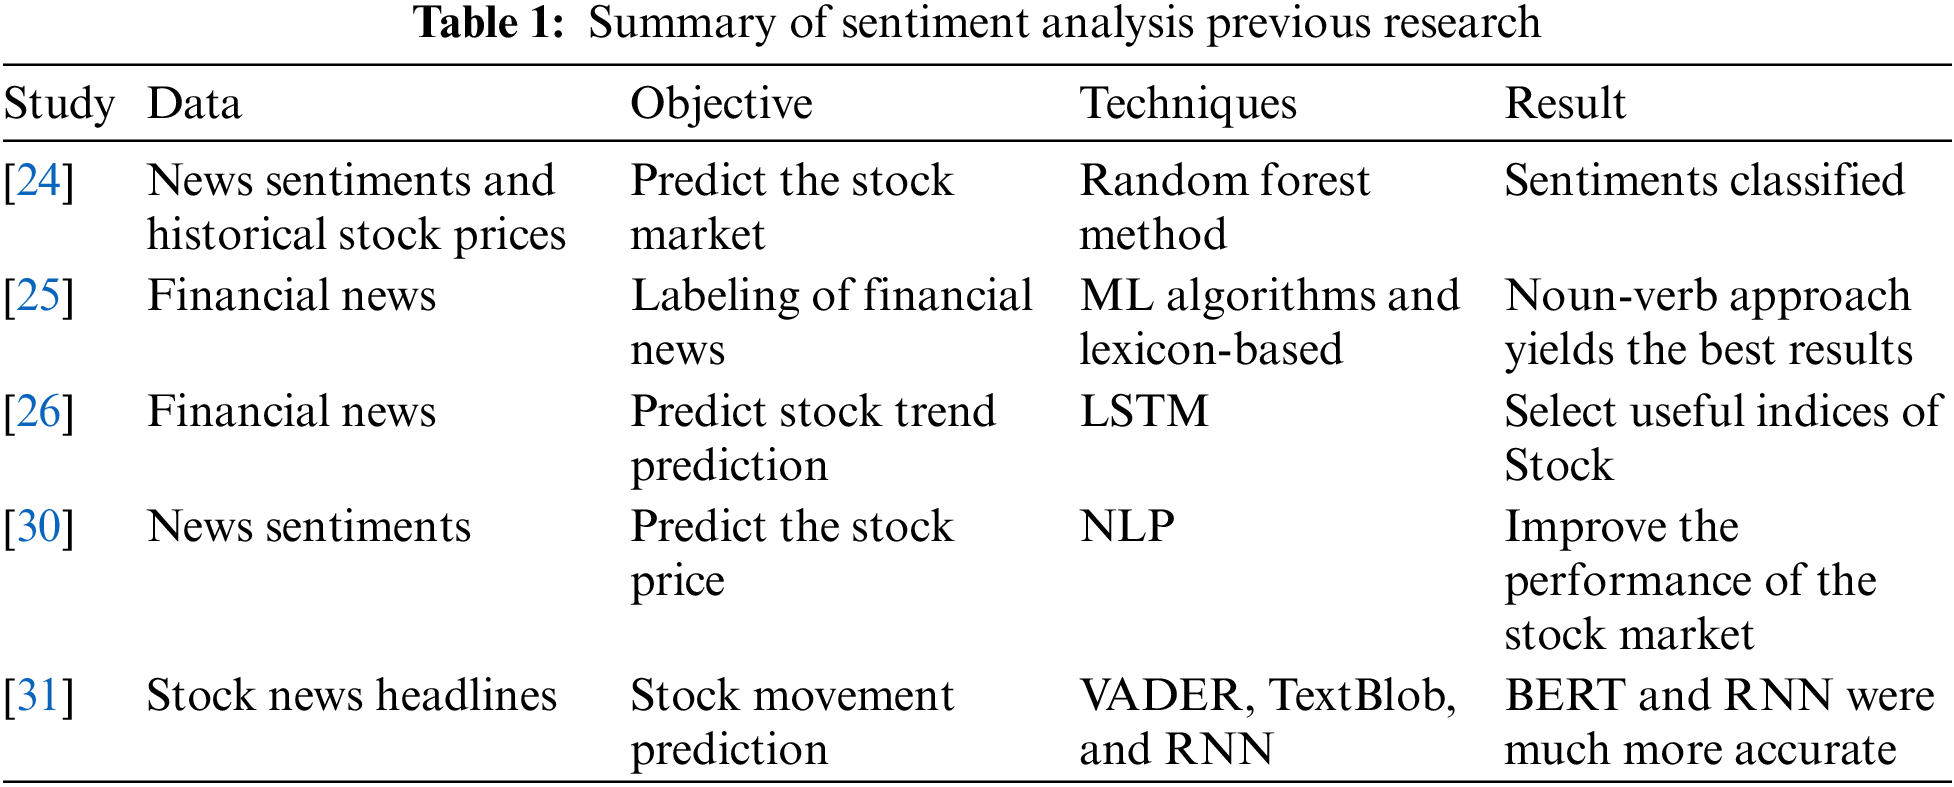
Sentiment analysis is a technique for analyzing research literature for the presence of underlying attitudes and emotions. It analyzes sentences to determine if they convey optimistic or pessimistic sentiments, which may be used for the task of predicting the stock market. Positive news can be given a value of 1 and bad news a value of 0 to help gauge attitude. Stock market forecasts have also benefited from the application of deep learning models, which use existing data to spot patterns, and lexicon-based techniques, which examine the prevalence of particular words to ascertain their emotions. The distance between market fluctuations and news feelings has also been closed with the use of text mining and natural language processing. Improved stock price forecasting is a primary motivation for the further development and investigation of these techniques [24–29]. Table 1 shows a Summary of the Sentiment analysis of previous research.
Through the above from previous studies, it is clear that the hybrid model can provide better results compared to the unilateral model. By combining quantitative and qualitative data in one model and employing artificial intelligence techniques, a model with a better effect can be provided. The goal of demonstrating that GANs can also give better results for financial time series forecasting (in contrast to more conventional approaches) remains unresolved, despite the recent demonstration of promising results in addressing numerous complex situations (e.g., realistic image and video generation, image-to-image, and text-to-image translation). This study uses GANs techniques by presenting a hybrid model for predicting stock markets.
To the best of our knowledge, no previous studies have combined news and tweet sentiment analysis, historical stock price data, and cost functions for managing the flow of data into a unified stock prediction system. Sequence prediction issues, which include time series problems like stock market forecasting, need careful attention to temporal dependencies. To fill these knowledge gaps, we have attempted to 1) An approach to data processing is provided, focusing on the integration of quantitative and qualitative information into the suggested model. 2) Using GANs networks in processing time series data which is not been utilized previously in this context. 3) To create a high-performing model, we fused two powerful networks (RNN-GRU and DL-CNN). 4) Data and model output prediction flow management using several cost functions (Sigmoid, ReLU, and Cross-Entropy).
The goal of the study is to be able to forecast the future trend of the stock market using the available data. Tweets and News were employed as qualitative data sources in the study, and NLP was used to process them. 35 quantitative parameters and qualitative data were combined in addition. Accuracy and error rate were two factors utilized in the system simulation to examine how well the model performed on the test data. The proposed model’s estimated price will be compared to the actual price to determine performance. The study was conducted in Python utilizing Google Colab as the platform for the execution of the data and model.
Data from social media (tweets): From the date 01-07-2016 to 30-06-2018, every tweet related to the chosen stock market of IBM is downloaded in an excel file and kept in its raw form. The file of raw tweets that you downloaded has the following three attributes: The sections known as “Source,” “Tweet Text,” and “Date” each provide information about the person who tweeted the original message, the text of the tweet, and the date it was sent, respectively. Stock information from Yahoo Finance: Yahoo Finance offers historical price data for equities. The specified period’s price data for the selected stock markets is acquired from Yahoo Finance in.csv file format. The following six characteristics of the downloaded data files: Date, High, Low, Open, Close, and Volume of IBM stock. Information about financial news: Four elements are included in the unprocessed news files: Source, Link, News Text, and Date. These features, in that order, display the news source, the link, the news headline, and the date of publication. This stage is unique in that it allows for the use of shorter text for news sentiment analysis by using short news headlines rather than news article bodies.
Historical data of the International Business Machines Corporation (IBM) stock has been used in a method of technical. In the sentiment analysis approach, data from social media (tweets) and financial news are analyzed with NLP to figure out whether the documents’ content makes people feel good, bad, or neutral and then used with historical data in one model. Fig. 1 shows the model that is suggested for predicting the IBM stock market.
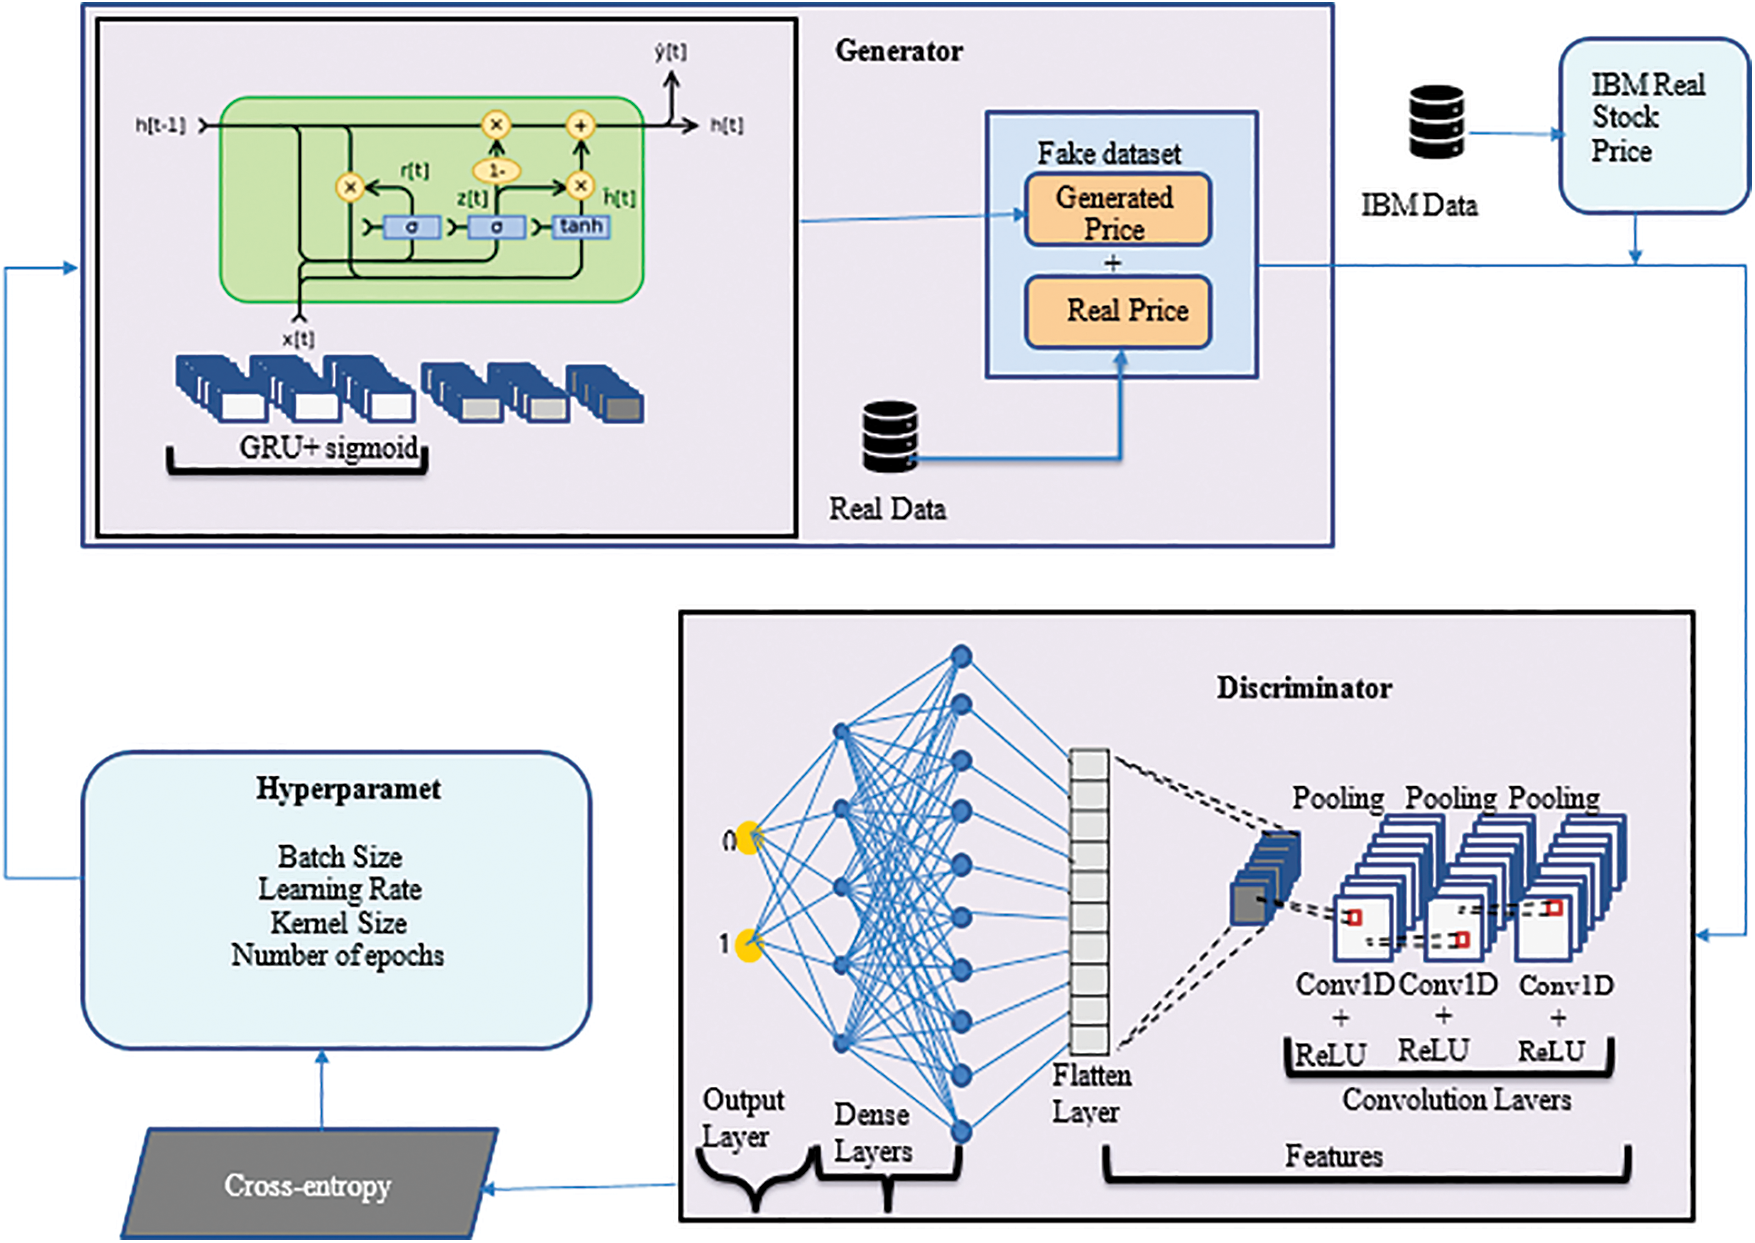
Figure 1: Proposed a details model of stock market prediction
The stock price and stock index data are taken from Yahoo Finance, while the news and tweets data are collected from different sources. The closing price of IBM stock serves as the model’s target stock price. The stock closing price is used to calculate the statistical statistics. The dataset has 36 variables and 482 total observations. There is a 7:3 split between the test and train data. Fourier transform has been used in this study. When the Fourier transform is applied to a function, the function is converted into a series of sine waves (with different amplitudes and frames). These sine waves, when combined, provide an effect that is identical to the original.
By using Fourier transforms, some of the background noise will be removed from the IBM stock and then extract both global and local patterns from it. Fourier transforms to extract both long-term and short-term trends will be employed, the transforms that have 3, 6, and 9 components respectively will be used in this study. Fig. 2 shows the result of the Fourier transforms output.
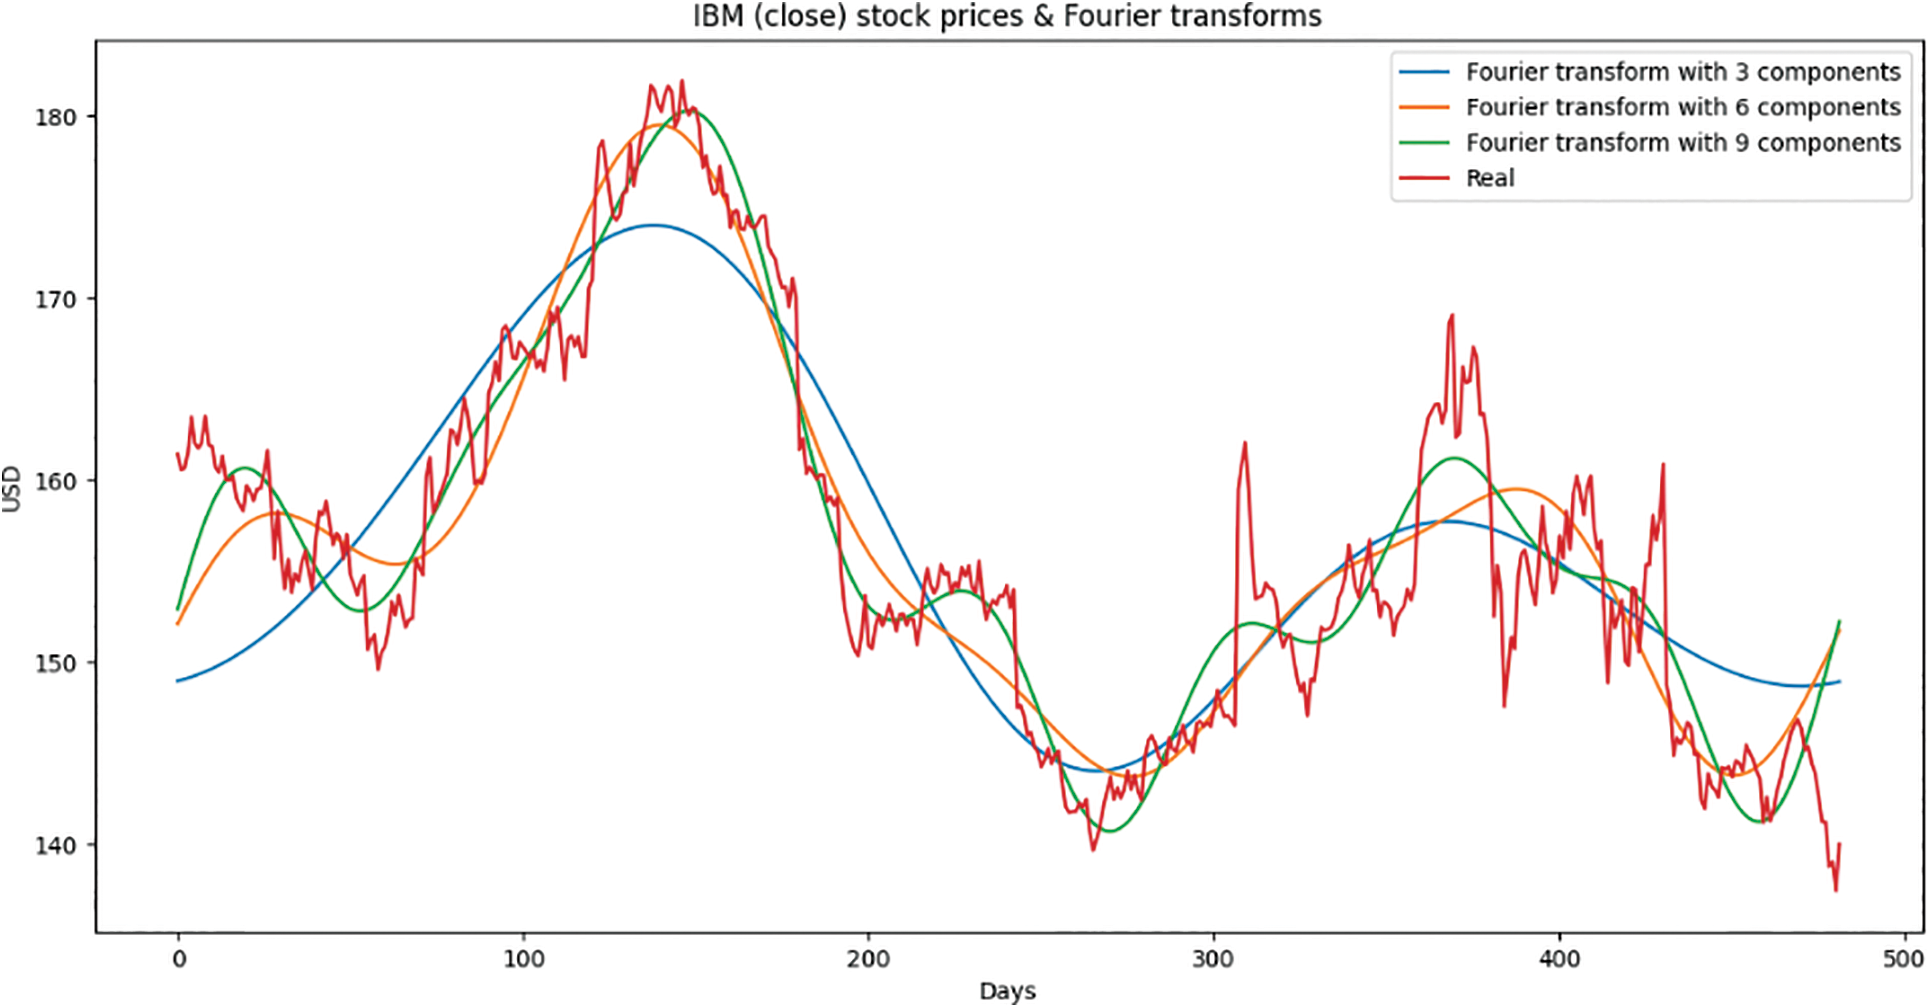
Figure 2: Result of Fourier transforms output compared with the real trend of the IBM stock market
The study calculated some technical indicators and derived some trend characteristics after downloading historical data for different assets. To calculate the sentiment ratings of significant news, and also use the NLP approach. The study identified the technical indicators that investors utilize most and found them to be as follows: Moving averages of 7 and 21 days, Bollinger bands, exponential moving average, momentum, and Moving Average Convergence/Divergence (MACD) are all used. Analysis of news sentiment: News may predict future shifts in stock values. NLP was used to categorize all of IBM’s daily news, score it from −1 to 1, and classify it as positive, neutral, or negative. Fourier transforms: To find both long- and short-term trends in the IBM stock, the study created Fourier transforms in addition to the daily closing price. The Fourier approach converts functions into sine waves that closely match the original function, which may increase the precision of the GRU network’s prediction trends.
The data processing process is depicted in the diagram below, along with how each stage will be handled and how the end product will be assessed as shown in Fig. 3.
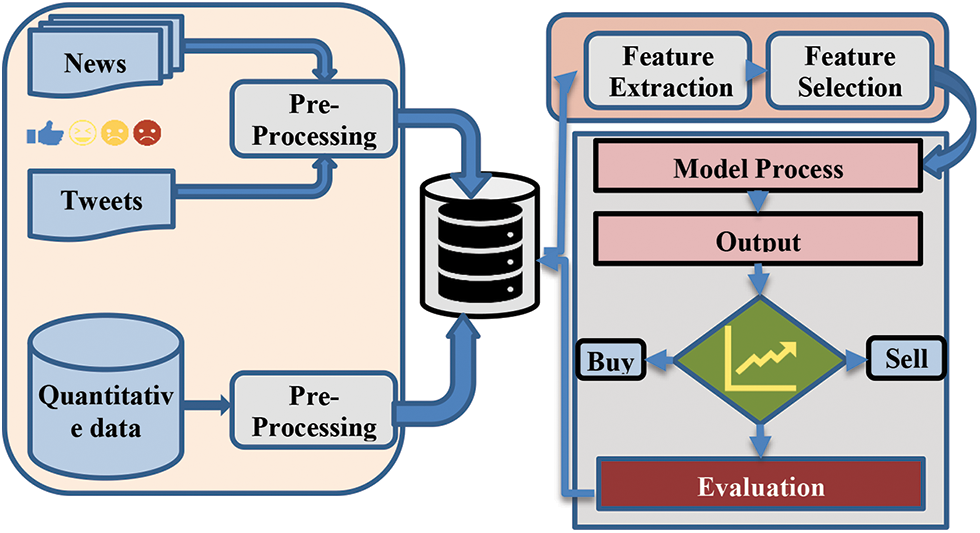
Figure 3: Flowchart of the data processing process
3.5 Processing of Sentimental Data
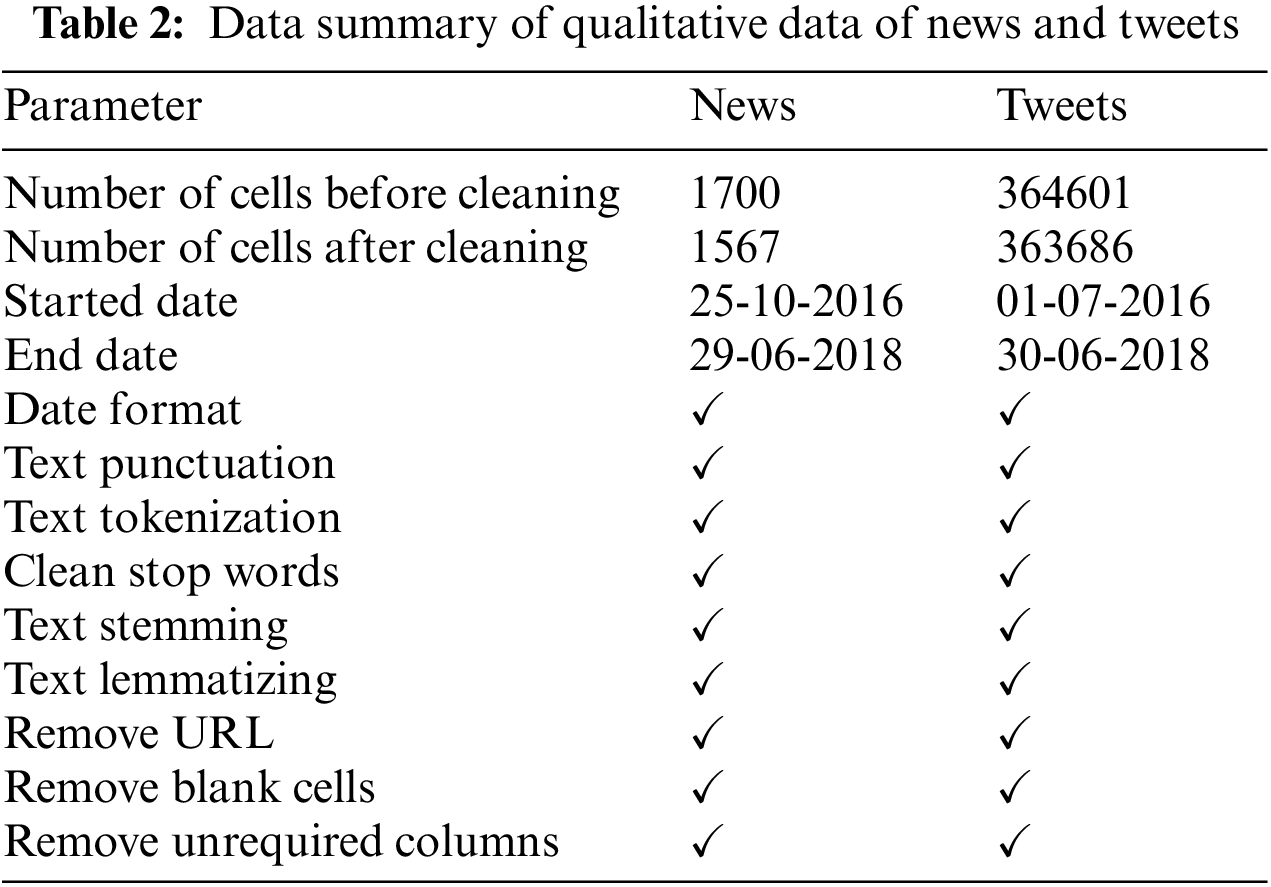
Before using machine learning algorithms, the downloaded tweets and news headlines must be preprocessed because they are in raw form. The following procedures are used to transform tweets and news headlines into a format that machine learning algorithms can understand. Table 2 shows data summary of qualitative data on news and tweets
1. News items and tweets are converted into word tokens.
2. Hashtags and other tags, including the @ author tag, are removed. Since these tags do not include any data that may help machine learning algorithms determine attitudes, they must be removed.
3. URLs are removed.
4. Stop words are also eliminated. These words, including “is,” “the,” “are,” and “an,” are often used in tweets and news headlines yet provide classifiers with no relevant information.
GANs have two neural networks in them. There is a Discriminator D(x) and a Generator G(x). They engage in competitive play. By creating data that are identical to those in the training set, the generator hopes to trick the discriminator. By distinguishing between phony and authentic data, the discriminator will attempt to avoid being duped. To learn and train complicated data, such as audio, video, or image files, they both work simultaneously. The Generator network creates a fictitious sample of data using a real sample as input. The Generator is trained to increase the likelihood of errors in the Discriminator network. The model is trained, the loss function at the end of the discriminator network is calculated, and the loss is backpropagated into the discriminator and generator models. It can be mathematically described by the formula below:
where G = Generator, D = Discriminator, Pdata(x) = distribution of real data, P(z) = distribution of generator, x = sample from Pdata(x), z = sample from P(z), D(x) = Discriminator network, G(z) = Generator network.
Because of its stability, the authors picked the GRU as the generator in our GAN model. Our dataset contains the stock price history from the preceding two years in addition to the following 36 features: Open, Low, High, Close, Nasdaq, New York Stock Exchange (NYSE), Financial Times Stock Exchange 100 Index (FTSE100), Standard and Poor’s 500 (S&P 500), Bombay Stock Exchange (BSE Sensex), Nikki225, Russell2000, SSE, Hang Seng, Crude Oil, USD index, Gold, Volatility Index (VIX), Amazon, Microsoft, Google, MA21, MA7, MACD, 20SD, upper band, log, lower band, and EMA because this investigation will include multi-step forward prediction, the study must define the input and output phases that the generator will involve. The generator will take the batch size, the input step, and the features as input data and will return the batch size and the output step as output data. The study deployed three layers of GRU with neuron counts of 1024, 512, and 256, followed by two layers of dense, with the final layer’s neuron count matching the output step study wanted to predict, to build a high-performance generator. The term “multi-steps-ahead prediction” describes the challenge of foreseeing a sequence of values in a time series. A common technique is a multi-stage prediction, which includes applying a predictive model incrementally and using the estimated value of the current time step to forecast its value in the next time step.
The discriminator in our GAN model was a convolution neural network, and it was used to determine whether or not the data that was being input was genuine or fabricated. The discriminator will get either the data in its original form or data that has been newly created by the generator. This discriminator model has comprised of a total of six layers: three 1D Convolution layers, each with 32, 64, and 128 neurons; three additional Dense layers, each with 220, 220, and 1 neuron at the very end; and three extra Dense layers. All of the layers’ activation functions have been modified to use the Leaky Rectified Linear Unit, except for the output layer, which employs the Sigmoid activation function for GAN and the linear activation function for Wasserstein GAN-Gradient Penalty (WGAN-GP). The output layer is the only layer to do so using Rectified Linear activation function (ReLU). The Sigmoid function has a single-scalar output that may either be 0 or 1, which corresponds to the values true and false, respectively.
To reduce the difference between two distributions during training, the GAN model uses cross-entropy loss, which is analogous to reducing the Kullback Leibler (KL)-Jensen-Shannon (JS) divergence. The loss function of the original GAN is based on KL-JS divergence. To achieve the best results during training, the loss function must always be minimized. The probability of labeling the samples correctly is the objective function that we train the discriminator to optimize in this study. The objective function that we define is:
and after that, we train the generator to minimize the following objective function:
where G(xi) is the created data (false target) from the generator and x is the input data for the generator, y is the target from the real dataset. In GAN, the loss function of the discriminator is calculated for the current situation is:
The loss function of the generator is:
Basic GAN’s discriminator is not strong enough. It is well known that the training process is unreliable and slow. It is suggested that WGAN-GP be used to aid stabilize and enhance GAN training. To address this issue, WGAN-GP proposed the Wasserstein distance. The Earth-Mover Distance, also known as the Wasserstein distance, is the minimal amount of mass that must be transported to convert one data distribution into another. The network does not have the sigmoid function; thus, it produces a scalar score rather than a probability, in contrast to the Basic GAN. The realness of the input data can be inferred from this score. The largest lower bound (infimum) for any transportation plan is defined mathematically as the Wasserstein distance between the real data distribution Pr and the generated data distribution Pg.
where Π (Pr, Pg) contains every conceivable transport plan γ, and (Pr, Pg) denotes the set of all joint distributions between Pr and Pg. The calculation can be made simpler by using the Kantorovich-Rubinstein duality, and it becomes:
where f is a 1-Lipschitz function and sup is the least upper bound according to the Lipschitz constraint:
The discriminator also makes use of a gradient penalty.
The model parameter values that a learning algorithm finally learns are defined by hyperparameters, which are variables whose values have an impact on the learning process.
GAN hyper-parameters can be summarized as Learning rate, Batch size, Generator optimizer, Number of layers, Number of epochs, Discriminator optimizer, Number of units in a dense layer, Loss function, and Activation function. After one hundred iterations of training, the GAN will record the Mean Absolute Error (MAE), which is the error function in the GRU, the (G), and feed it as a reward value to GP and GP will decide whether or not to adjust the hyperparameters or to continue training with the same set of hyperparameters.
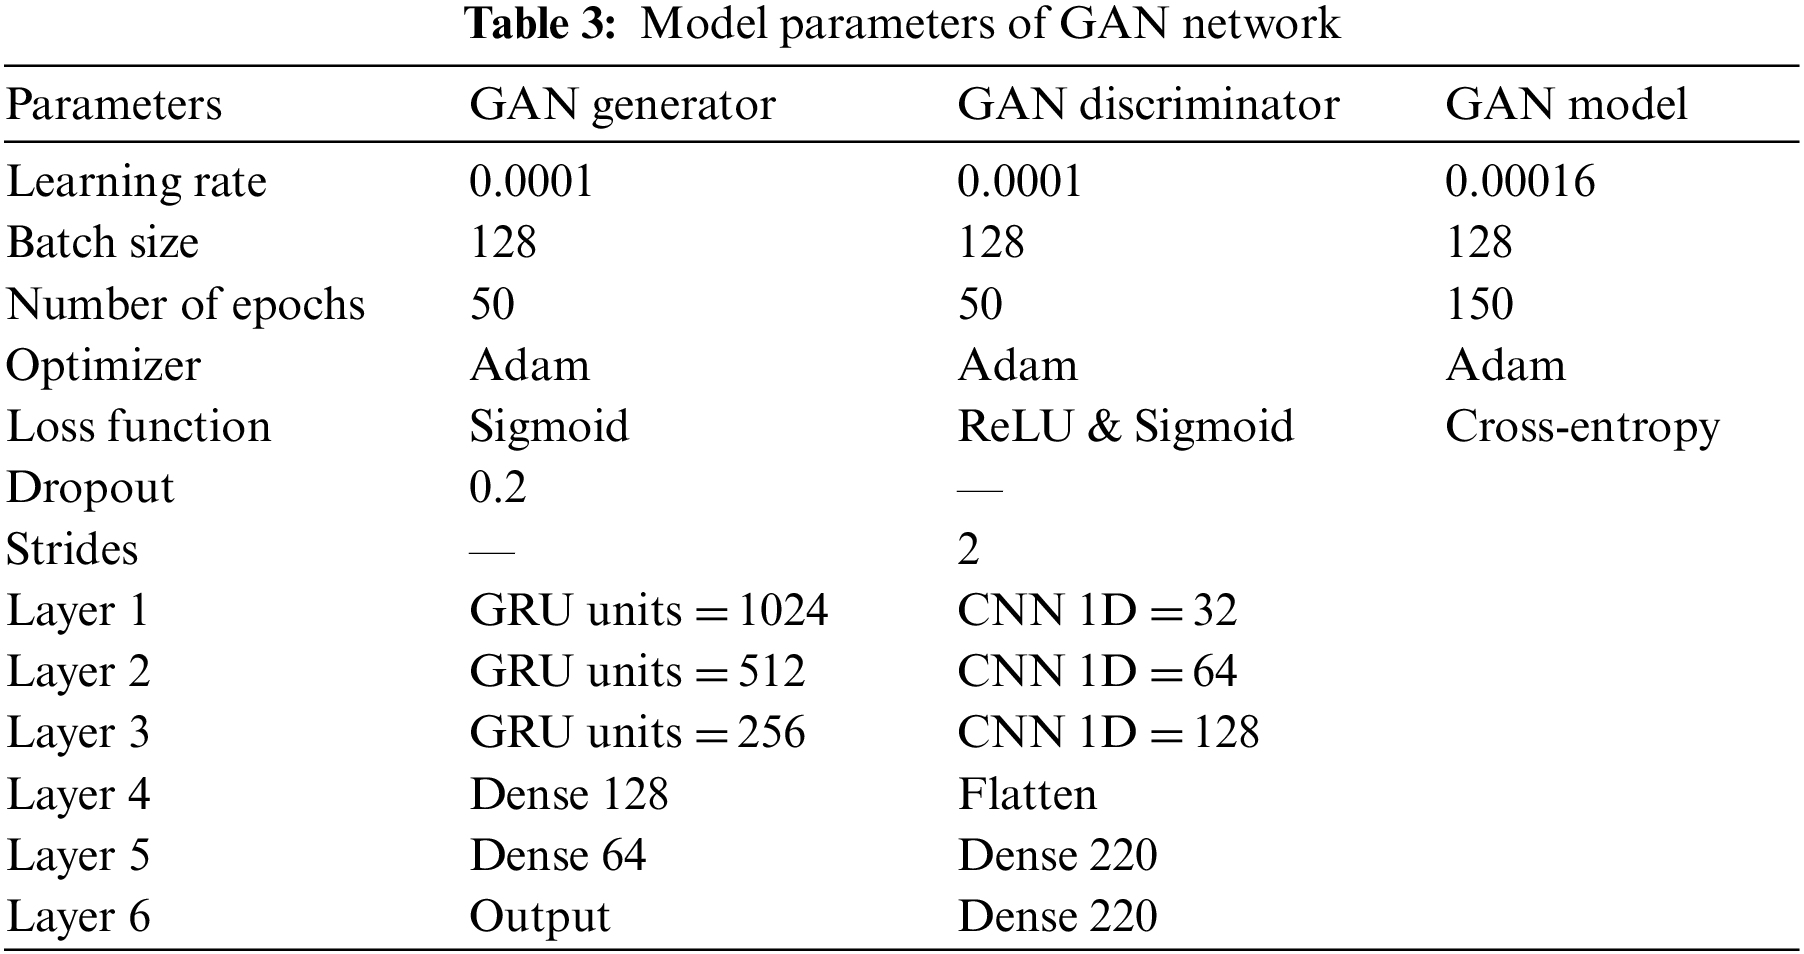
ADAM optimization is a technique for adaptive estimations of lower-order moments-based first-order optimization of stochastic objective functions. Adam is an optimizer. It performs better when the cost function is decreased during training (reaches a global minimum more rapidly and consistently). The binary cross-entropy loss, sometimes referred to as sigmoid cross-entropy loss, serves as the discriminator and generator loss functions. In other words, the values of other components have no bearing on the loss calculated for each vector component of the discriminator’s output. It is a Sigmoid activation plus a Cross-Entropy loss that is independent for each vector component (class). The relevant parameters for each GAN model are shown in Table 3.
An illustration of a correlation matrix that shows the relationship between various variables is called a correlation heatmap. Correlation can have any value between −1 and 1. It is not always the case that a correlation between two random variables or bivariate data indicates a causal connection. I have used correlations to identify the factors that are related. According to the result of 35 variables, many variables have a positive correlation with the close price of IBM stock. To eliminate the unnecessary variables or the drawback variables of our research I have run a test to set only the variables that have a positive correlation with the close price of IBM stock that is greater than 0.5. The result comes out with 16 variables out of 35 that have a positive correlation with the close price of IBM stock that is greater than 0.5 as Fig. 4 shows.
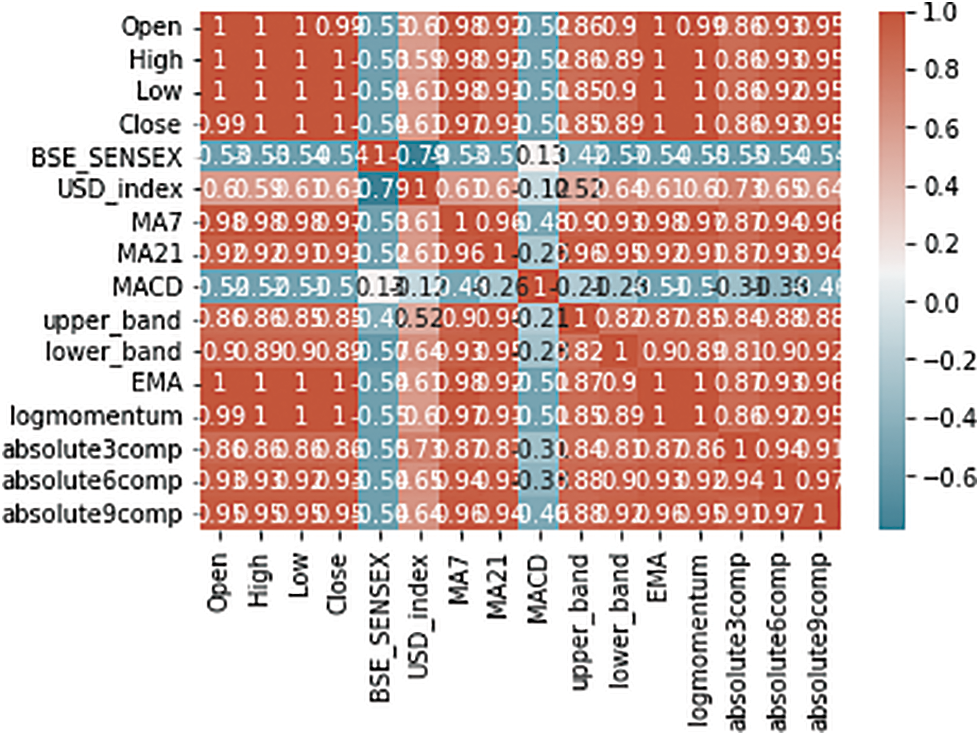
Figure 4: Illustration of a correlation matrix greater than 0.5 to IBM close price
The methods portion of this study included a proposal for the GAN model’s structure. The optimizer for this model is the Adam algorithm, which has a learning rate of 0.00016. The study trained the model on this dataset for 165 epochs with a batch size of 128.
Fig. 5 shows the validation loss which shows how well the model fits new data, whereas the training loss in Fig. 6 shows how well it matches the training data. For both the training and validation curves, the cost (loss) function is low and does get smaller as the number of iterations increases, which indicates the model is not underfitting nor has high bias.
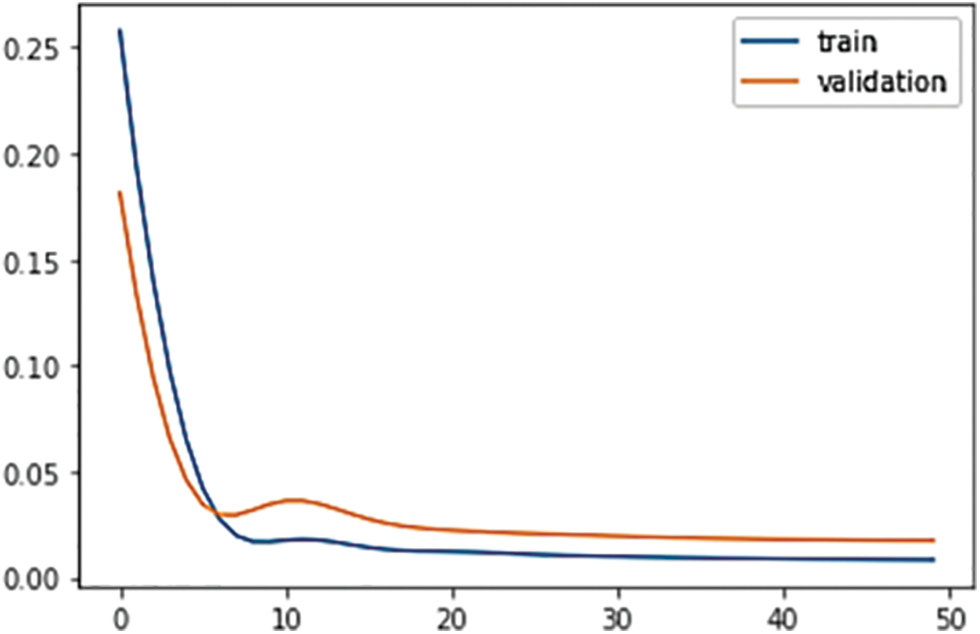
Figure 5: Basic GAN GRU model validation
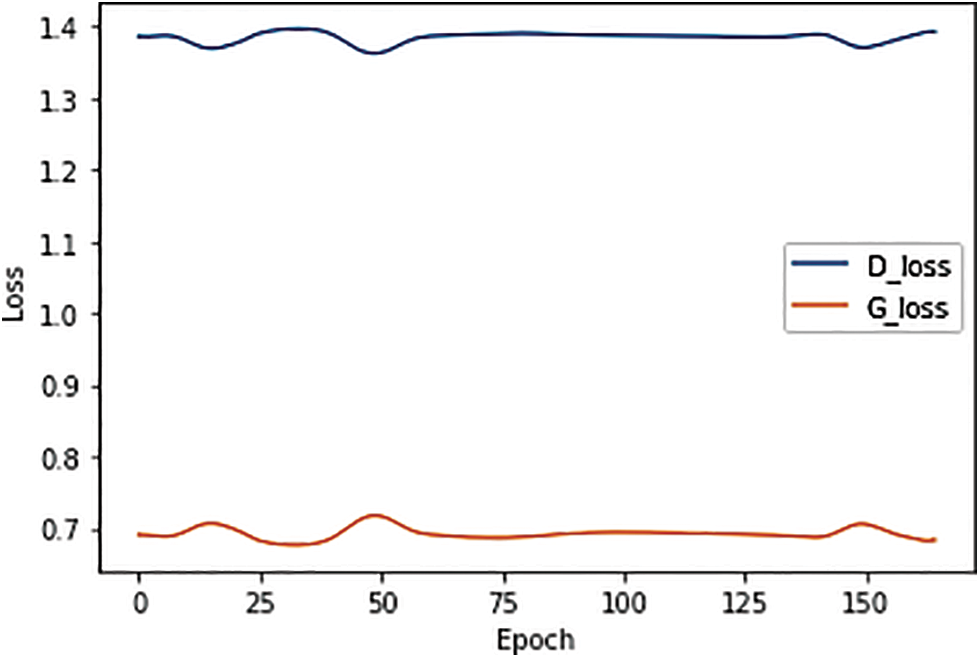
Figure 6: Result of discriminator and generator’s loss in GAN basic
The blue line represents the loss route of the discriminator, and the orange line represents the loss path of the generator. Fig. 7 shows the loss plot of the fundamental GAN model. Both loss trajectories are flattened out during testing, with the discriminator’s loss starting larger than the generator.
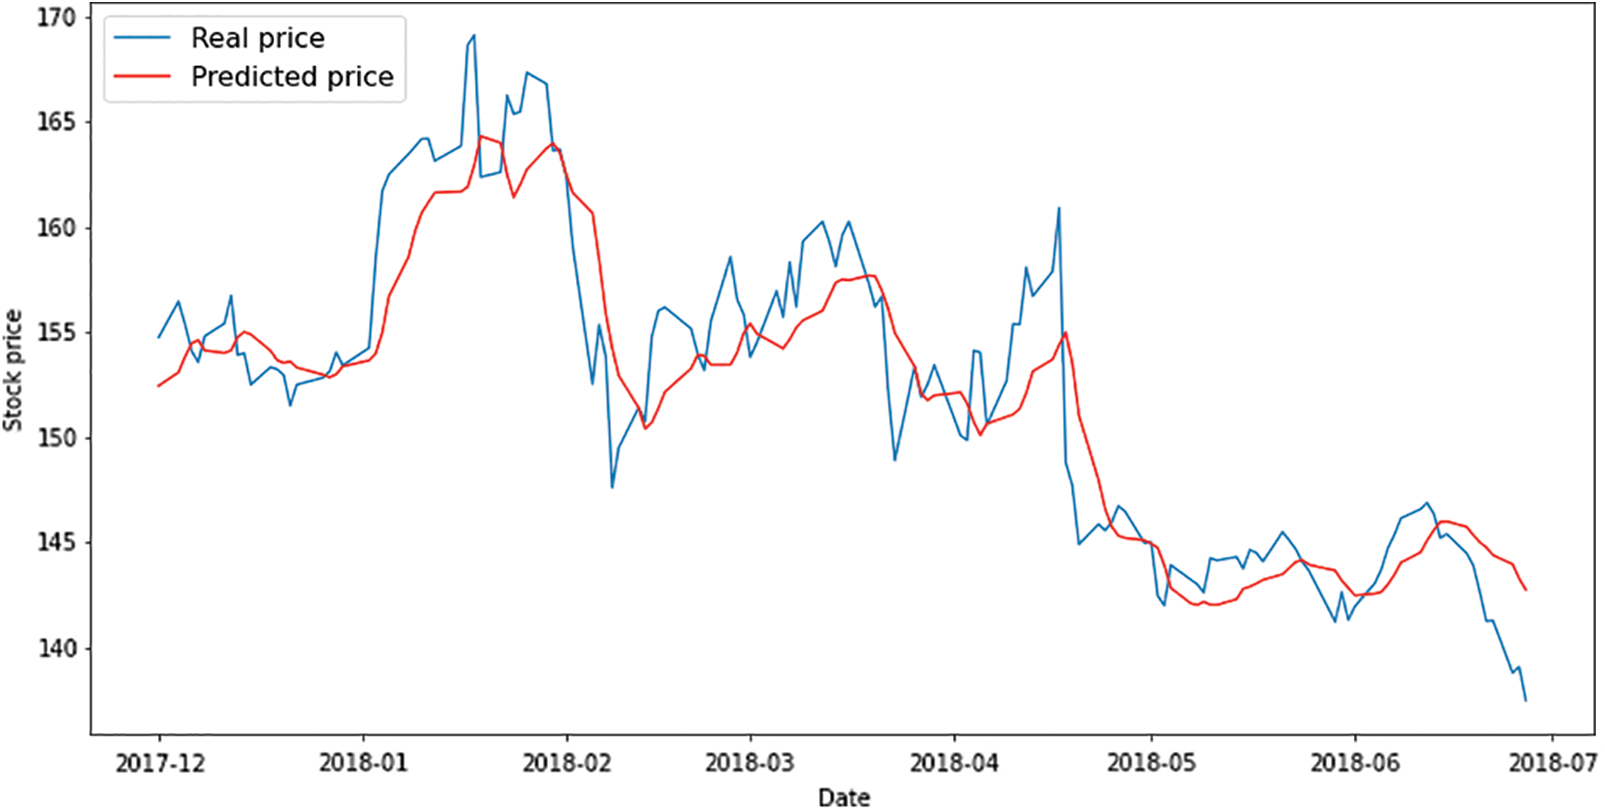
Figure 7: Output of testing model of GAN basic
The methods portion of this study includes a proposal for the WGAN-GP model’s structure. The optimizer in this model is the Adam algorithm, which has a learning rate of 0.0001. The study trained the model on this dataset for 150 epochs with a batch size of 128. Additionally, the study trained the generator three times and the discriminator once. In Fig. 8, The blue line represents the loss route of the discriminator, while the orange line represents the loss path of the generator loss plot for the WGAN-GP model. As it approaches 0, the discriminator loss diminishes. The discriminator in WGAN-GP learns better than the Basic GAN.
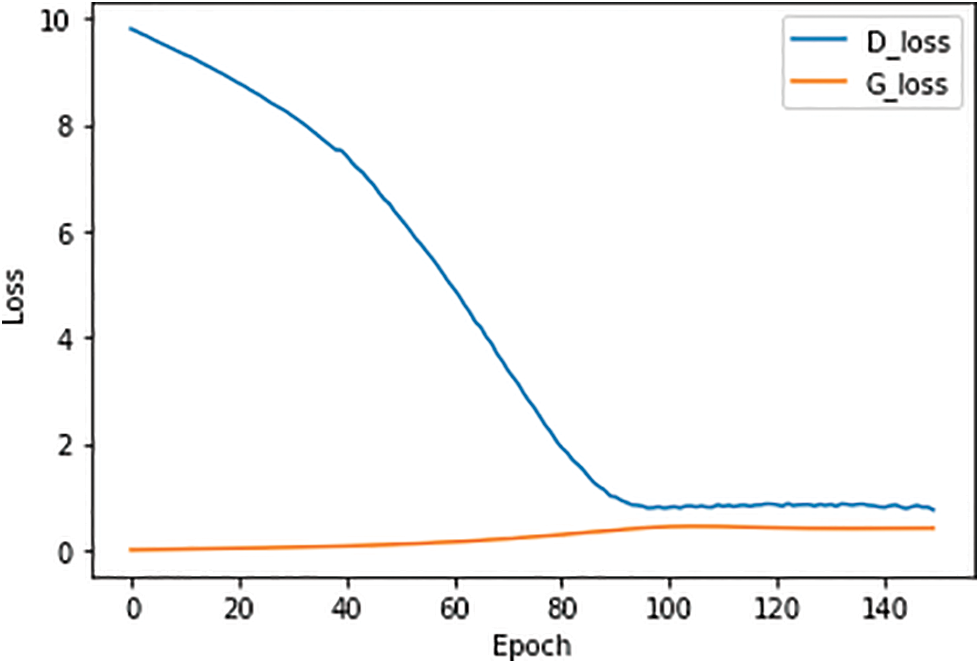
Figure 8: Result of discriminator and generator’s loss in WGAN-GP
The RMSE of 3.71 for WGAN-GP, the lowest among all the models, is the anticipated outcome of the WGAN-GP model for testing data, which is shown in Fig. 9. The WGAN-GP model performed worse than the GAN basic due to the difficulty of applying the Lipschitz constraint in WGAN-GP. Although clipping is easy, certain issues arise. This hyperparameter has a significant impact on the model’s performance, especially when it is not calibrated properly.
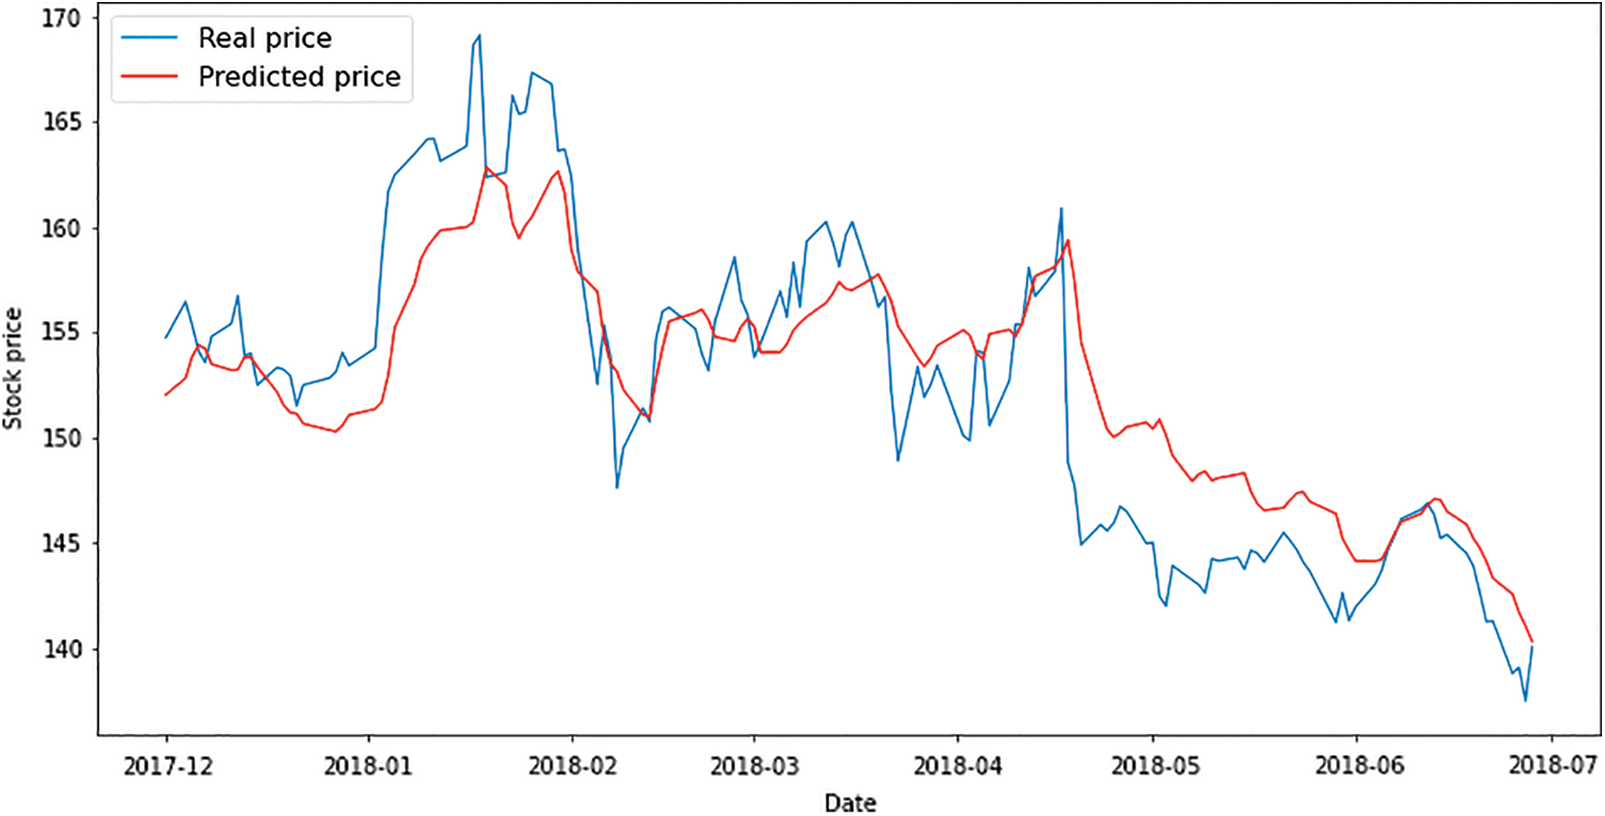
Figure 9: The output of the testing model of WGAN-GP
According to the result of RMSE, Mean Squared Error (MSE), and MAE in Table 4, it shows the RMSE of GAN basic has 1.13 for the training test which is much better compared to the RMSE of WGAN-GP for the training test which is 3.39. The training result of the model of both GAN basic and WGAN-GP reflects the result of the test of both outcomes. As Table 4 shows the GAN basic got RMSE 3.39 for test data which is slightly better than WGAN-GP which got RMSE 3.71 for testing data.

Basic GAN performs best on the training and testing data. According to our findings, GAN basic models perform better than WGAN-GP in general. However, both models show great results in terms of future prediction of time series forecasting for the stock market. The RMSE of GAN basic and WGAN-GP is very small compared to the finding of the previous studies with different models of prediction.
The goal of this study is how to employ artificial intelligence techniques to help make the right decision in the stock market. The study covered the most important factors affecting stock price fluctuations and tried to study and analyze them according to artificial intelligence algorithms. The study included 36 variables divided between quantitative and qualitative variables. 35 quantitative variables are distributed between the daily market value of the company, currency rates, competing companies, and global market indicators. And two qualitative variables were collected from Twitter and news sites talking about IBM.
This study covered previous studies in the field of financial stocks and the techniques used in stock market forecasts. The latest studies and artificial intelligence techniques in the stock market and the results of these studies were presented, and the shortcomings in these studies or how they were applied were reviewed. Statistical techniques were reviewed, as well as artificial intelligence techniques of all kinds, such as Machine Learning, Deep Learning techniques, and NLP. The latest models were reviewed by incorporating more than one technique or method and the results they reached.
This study proposed a GAN that uses Convolutional Neural Networks (CNN) as the discriminator and GRU as the generator and the outcome of the GAN network will go into hyperparameters for further tuning and control of model parameters. The study has shown some inferences based on the experimental findings. First, the GAN model can aid to improve the time series forecasting of the stock market. The GRU model in the generator of GAN has shown very good performance in terms of memorizing the sequences of time series and producing new data for the generator to be used in the GAN network. Both the basic GAN and the WGAN-GP model outperform in the area of time series forecasting. GAN basic has shown better performance with small MSE compared to WGAN-GP. The GAN model, which includes Recurrent Neural Network (RNN), is unstable; it is particularly challenging to adjust the hyperparameters for these models; without proper parameters, you risk getting poor results. The GRU model in the GANs’ Generator has shown very good performance in terms of remembering the sequences of time series. The GAN model can aid to improve the time series forecasting of the stock market. And that will enhance the efficiency of the decision-making of investors.
The findings of this study will assist investors in making the best choice when selling, holding, or purchasing shares. Additionally, it will serve as a guide for the researchers’ future work and a survey of the effectiveness of their chosen approaches. A comprehensive study of the current development in the stock market applied techniques. Including statistical, Machine learning (supervised and unsupervised), and hybrid techniques offering a way of data processing including quantitative and qualitative and how combined the data to work in harmony with the proposed model. Using GANs networks in processing time series data which is not been used before in this context. Combined two robust networks (RNN-GRU and DL-CNN) in one model to produce a high-performance model. Using multiple cost functions (Sigmoid, ReLU, and Cross-Entropy) to control the flow of the data and model output prediction. Proposed a highly efficient model to predict the stock market change.
Future research can be done on many techniques and methodologies. The researchers can use additional data as well as other processing and evaluation methods. Numerical and nominal data might be included for the stock market. To research the stock market, quantitative data can be combined with qualitative data. The creation of hyperparameter tweaking should be the focus of future studies. Authors feel the outcome would have been much improved if each parameter in the GAN model, in each layer, and for the entire model, could be set more precisely.
Acknowledgement: I am grateful to anonymous referees for their insightful suggestions.
Funding Statement: The authors received no specific funding for this study.
Conflicts of Interest: The authors declare that they have no conflicts of interest to report regarding the present study.
References
1. C. Lee, S. Ku, P. Cho and W. Chang, “Explaining future market return and evaluating market condition with common preferred spread index,” Physica A: Statistical Mechanics and its Applications, vol. 525, pp. 921–934, 2019. [Google Scholar]
2. F. A. Dael, U. Yavuz and A. A. Almohammedi, “Performance evaluation of time series forecasting methods in the stock market: A comparative study,” in 2022 Int. Conf. on Decision Aid Sciences and Applications (DASA), Chiangrai, Thailand, IEEE, pp. 1510–1514, 2022. [Google Scholar]
3. B. M. Henrique, V. A. Sobreiro and H. Kimura, “Literature review: Machine learning techniques applied to financial market prediction,” Expert Systems with Applications, vol. 124, pp. 226–251, 2019. [Google Scholar]
4. M. M. Kumbure, C. Lohrmann, P. Luukka and J. Porras, “Machine learning techniques and data for stock market forecasting: A literature review,” Expert Systems with Applications, pp. 116659, 2022. [Google Scholar]
5. E. Hoseinzade and S. Haratizadeh, “CNNpred: CNN-based stock market prediction using a diverse set of variables,” Expert Systems with Applications, vol. 129, pp. 273–285, 2019. [Google Scholar]
6. M. Sedighi, H. Jahangirnia, M. Gharakhani and S. Farahani Fard, “A novel hybrid model for stock price forecasting based on metaheuristics and support vector machine,” Data, vol. 4, no. 2, pp. 75, 2019. [Google Scholar]
7. Y. G. Song, Q. L. Cao and C. Zhang, “Towards a new approach to predict business performance using machine learning,” Cognitive Systems Research, vol. 52, pp. 1004–1012, 2018. [Google Scholar]
8. G. S. Atsalakis and K. P. Valavanis, “Forecasting stock market short-term trends using a neuro-fuzzy based methodology,” Expert Systems with Applications, vol. 36, no. 7, pp. 10696–10707, 2009. [Google Scholar]
9. B. Weng, M. A. Ahmed and F. M. Megahed, “Stock market one-day ahead movement prediction using disparate data sources,” Expert Systems with Applications, vol. 79, pp. 153–163, 2017. [Google Scholar]
10. Y. Chen and Y. Hao, “Integrating principle component analysis and weighted support vector machine for stock trading signals prediction,” Neurocomputing, vol. 321, pp. 381–402, 2018. [Google Scholar]
11. S. Borovkova and I. Tsiamas, “An ensemble of LSTM neural networks for high-frequency stock market classification,” Journal of Forecasting, vol. 38, no. 6, pp. 600–619, 2019. [Google Scholar]
12. B. Malkiel, S. Mullainathan and B. Stangle, “Market efficiency versus behavioral finance,” Journal of Applied Corporate Finance, vol. 17, no. 3, pp. 124–136, 2005. [Google Scholar]
13. J. J. Wang, J. Z. Wang, Z. G. Zhang and S. P. Guo, “Stock index forecasting based on a hybrid model,” Omega, vol. 40, no. 6, pp. 758–766, 2012. [Google Scholar]
14. M. A. Hossain, R. Karim, R. Thulasiram, N. D. Bruce and Y. Wang, “Hybrid deep learning model for stock price prediction,” in 2018 IEEE Symp. Series on Computational Intelligence (SSCI), Bangalore, India, IEEE, pp. 1837–1844, 2018. [Google Scholar]
15. A. Bagheri, H. M. Peyhani and M. Akbari, “Financial forecasting using ANFIS networks with quantum-behaved particle swarm optimization,” Expert Systems with Applications, vol. 41, no. 14, pp. 6235–6250, 2014. [Google Scholar]
16. M. Karim, M. Foysal and S. Das, “Stock price prediction using Bi-LSTM and GRU-based hybrid deep learning approach,” in Proc. of Third Doctoral Symp. on Computational Intelligence, Singapore, Springer, pp. 701–711, 2023. [Google Scholar]
17. Q. M. Ilyas, K. Iqbal, S. Ijaz, A. Mehmood and S. Bhatia, “A hybrid model to predict stock closing price using novel features and a fully modified hodrick–Prescott filter,” Electronics, vol. 11, no. 21, pp. 3588, 2022. [Google Scholar]
18. Y. L. Lin, C. J. Lai and P. F. Pai, “Using deep learning techniques in forecasting stock markets by hybrid data with multilingual sentiment analysis,” Electronics, vol. 11, no. 21, pp. 3513, 2022. [Google Scholar]
19. K. Srijiranon, Y. Lertratanakham and T. Tanantong, “A hybrid framework using PCA, EMD and LSTM methods for stock market price prediction with sentiment analysis,” Applied Sciences, vol. 12, no. 21, pp. 10823, 2022. [Google Scholar]
20. G. R. Patra and M. N. Mohanty, “An LSTM-GRU based hybrid framework for secured stock price prediction,” Journal of Statistics and Management Systems, vol. 25, no. 6, pp. 1491–1499, 2022. [Google Scholar]
21. S. Verma, S. Prakash Sahu and T. Prasad Sahu, “Ensemble approach for stock market forecasting using ARIMA and LSTM model,” in Proc. of Third Int. Conf. on Intelligent Computing, Information and Control Systems, Singapore, Springer, pp. 65–80, 2022. [Google Scholar]
22. M. Durairaj and K. M. BH, “Statistical evaluation and prediction of financial time series using hybrid regression prediction models,” International Journal of Intelligent Systems and Applications in Engineering, vol. 9, no. 4, pp. 245–255, 2021. [Google Scholar]
23. A. Staffini, “Stock price forecasting by a deep convolutional generative adversarial network,” Frontiers in Artificial Intelligence, vol. 5, pp. 1–16, 2022. [Google Scholar]
24. A. Bhardwaj, Y. Narayan and M. Dutta, “Sentiment analysis for Indian stock market prediction using sensex and nifty,” Procedia Computer Science, vol. 70, pp. 85–91, 2015. [Google Scholar]
25. A. Yadav, C. K. Jha, A. Sharan and V. Vaish, “Sentiment analysis of financial news using unsupervised approach,” Procedia Computer Science, vol. 167, pp. 589–598, 2020. [Google Scholar]
26. X. Jiawei and T. Murata, “Stock market trend prediction with sentiment analysis based on LSTM neural network,” in Int. Multiconf. of Engineers and Computer Scientists, Hong Kong, pp. 475–479, 2019. [Google Scholar]
27. P. Mehta, S. Pandya and K. Kotecha, “Harvesting social media sentiment analysis to enhance stock market prediction using deep learning,” PeerJ Computer Science, vol. 7, pp. e476, 2021. [Google Scholar] [PubMed]
28. T. B. Shahi, A. Shrestha, A. Neupane and W. Guo, “Stock price forecasting with deep learning: A comparative study,” Mathematics, vol. 8, no. 9, pp. 1441, 2020. [Google Scholar]
29. K. S. Rekha and M. K. Sabu, “A cooperative deep learning model for stock market prediction using deep autoencoder and sentiment analysis,” PeerJ Computer Science, vol. 8, pp. e1158, 2022. [Google Scholar] [PubMed]
30. J. L. Seng and H. F. Yang, “The association between stock price volatility and financial news–A sentiment analysis approach,” Kybernetes, vol. 48, no. 8, pp. 1341–1365, 2017. [Google Scholar]
31. L. Nemes and A. Kiss, “Prediction of stock values changes using sentiment analysis of stock news headlines,” Journal of Information and Telecommunication, vol. 5, no. 3, pp. 375–394, 2021. [Google Scholar]
Cite This Article
 Copyright © 2023 The Author(s). Published by Tech Science Press.
This work is licensed under a Creative Commons Attribution 4.0 International License , which permits unrestricted use, distribution, and reproduction in any medium, provided the original work is properly cited.
 Downloads
 Citation Tools