
 Submit a Paper
 Propose a Special lssue
 Open Access
ARTICLE
Hybridized Intelligent Neural Network Optimization Model for Forecasting Prices of Rubber in Malaysia
1 Faculty of Electrical and Electronic Engineering, Universiti Tun Hussein Onn Malaysia, Parit Raja, 86400, Malaysia
2 School of Mathematical Sciences, Universiti Sains Malaysia, Penang, 11800, Malaysia
3 School of General & Foundation Studies, AIMST University, Bedong, 08100, Malaysia
* Corresponding Author: Saratha Sathasivam. Email:
Computer Systems Science and Engineering 2023, 47(2), 1471-1491. https://doi.org/10.32604/csse.2023.037366
Received 01 November 2022; Accepted 02 February 2023; Issue published 28 July 2023
 View Full Text
 Download PDF
Abstract
Rubber producers, consumers, traders, and those who are involved in the rubber industry face major risks of rubber price fluctuations. As a result, decision-makers are required to make an accurate estimation of the price of rubber. This paper aims to propose hybrid intelligent models, which can be utilized to forecast the price of rubber in Malaysia by employing monthly Malaysia’s rubber pricing data, spanning from January 2016 to March 2021. The projected hybrid model consists of different algorithms with the symbolic Radial Basis Functions Neural Network k-Satisfiability Logic Mining (RBFNN-kSAT). These algorithms, including Grey Wolf Optimization Algorithm, Artificial Bee Colony Algorithm, and Particle Swarm Optimization Algorithm were utilized in the forecasting data analysis. Several factors, which affect the monthly price of rubber, such as rubber production, total exports of rubber, total imports of rubber, stocks of rubber, currency exchange rate, and crude oil prices were also considered in the analysis. To evaluate the results of the introduced model, a comparison has been conducted for each model to identify the most optimum model for forecasting the price of rubber. The findings showed that GWO with RBFNN-kSAT represents the most accurate and efficient model compared with ABC with RBFNN-kSAT and PSO with RBFNN-kSAT in forecasting the price of rubber. The GWO with RBFNN-kSAT obtained the greatest average accuracy (92%), with a better correlation coefficient R = 0.983871 than ABC with RBFNN-kSAT and PSO with RBFNN-kSAT. Furthermore, the empirical results of this study provided several directions for policymakers to make the right decision in terms of devising proper measures in the industry to address frequent price changes so that the Malaysian rubber industry maintains dominance in the international markets.Keywords
Natural rubber is an extraordinary agricultural commodity in Malaysia and has been expanding for more than three decades [1]. Today, Malaysia is the third-biggest rubber producer, the fifth-leading rubber consumer, and a major rubber exporter, among other countries around the globe and over 300 businesses operate in the rubber sector. Latex products like gloves, household items, tires, foam products, and footwear are all examples of Malaysian rubber products [2]. Due to its toughness, elasticity, and durability, rubber is a commercially essential component in the production of various products in different sectors, including transportation, industrial, and the medical sector [3]. Malaysia’s rubber industry continues to contribute significantly to its export revenues. In 2014, Malaysia produced a triple gain of RM15.2 bn compared with 2000 with a production ofRM5.5 bn [4]. This expansion has been supported by Malaysia, which is the world’s largest exporter of latex gloves, with RM12.2 bn in exports in 2014, or 80.3% of the country’s total rubber exports [5]. Given the challenges that the Malaysian rubber sector faces, a variety of approaches were developed to ensure long-term viability. In 2010 and 2011, the Malaysian Rubber Board (MRE) developed and released the most recent initiative to achieve a national shift by 2020 and 2022 because Malaysia has been striving to become a nation of high income, with farmers playing an important role in the transformation era [4]—440,000 families still rely on rubber as their primary income source [5]. Together with Malaysia’s significant palm oil industry, the rubber industry has gained substantial consideration. By 2020, Malaysia’s rubber industry is projected to contribute to the country’s gross national revenue from RM18.9 bn in 2009 to RM52.9 bn [4]. Malaysia is a major producer of natural rubber and an exporter of rubber products. Malaysia is the largest supplier and manufacturer of rubber goods in the world, such as threads, gloves, and catheters [2]. In 2001, Malaysia exported rubber-based goods worth RM4.51 bn to more than 190 countries. Japan, the US, and the UK represent the top three rubber buyers from Malaysia. Nowadays, Malaysia leads the world of rubber goods, accounting for 60 percent of the worldwide rubber-glove marketplace [6]. One of the main goals of the country’s agricultural program involves boosting revenues by expanding exports of rubber products. The monthly prices of rubber varied considerably, as shown in many studies [1–3], leading to uncertainty in earnings, and thereby affecting Malaysia’s rubber-based income. Accordingly, a precise forecasting model is essentially required to support the Malaysian Rubber Board in devising effective plans to avoid losing revenues from exports. It is, therefore, important to observe the behavior of the rubber price, as well as several influential factors, which play a key role in maintaining a steady rubber price to make the right decisions. To forecast the fluctuation in the price of rubber, it is essential to examine the factors of price fluctuations. Previous research examined some forecasting strategies, which used traditional forecasting methods, including a nonlinear model [7] and combined methods [8], or the multiple linear regression analysis models to [9] obtain the most accurate prediction by using a forecasting model.
This study aims to propose the logic mining method in examining the behavior of the price of rubber. A different approach is proposed in this work for identifying the association between monthly price characteristics and the impact on the production of rubber. This can be accomplished by combining multiple algorithms with the logic mining technique and the Artificial Neural Network (ANN). Despite the advantages of ANN, it is quite hard to build an efficient network for a specific application due to its architecture (the number of layers, the number of units in each layer, together with certain links among these units), the transfer function selection of output and intermediate units, the training algorithm design, the starting weight selection, and the stopping criteria specification [10]. A three-layer feedforward neural network with a logistic transfer function in the hidden layer is commonly recognized [11].
In this work, a single hidden layer feedforward network called Radial Basis Function Neural Network (RBFNN) has been utilized because it is a widely recognized forecasting network [12,13]. RBFNN is the first implemented feed-forward neural network according to Moody et al. [14], who confirmed that RBFNN can learn faster compared to a multilayer perceptron (MLP). RBFNN has been widely used in various disciplines because of its easier network construction and quicker studying speed, in addition to its higher estimation skills [15]. RBFNN can be used to solve a variety of issues in business, industry, and science. Besides, time series forecasting is one of the main applications of RBFNN [16]. Numerous studies proposed that RBFNN can be used by scholars and practitioners [17]. Traditional RBFNN aims to determine the network’s parameters, while input variables, as well as numbers of the hidden neurons, are kept fixed, then the given trial-and-error technique can be used for selecting the number of hidden neurons [18]. RBFNN-kSAT logic mining helps estimate the parameters of the hidden layer and the number of hidden neurons due to its ability to extract the logical rule between neurons [19].
If fresh data are added to a database, data sets can be updated with new additional data. Thus, the power of logic mining will be modified according to the data’s new association or trend. During the training of RBFNN-kSAT, optimum findings will be guaranteed by applying an optimization algorithm, which can find the linear output of the RBFNN-kSAT weights in a shorter period [20]. In this study, the Grey Wolf Optimization algorithm (GWO), the Artificial Bee Colony algorithm (ABC), and the Particle Swarm Optimization algorithm (PSO) were used to train the RBFNN-kSAT logic mining to find the most effective algorithm. Based on NFL, i.e., (No Free Lunch theorem), no algorithm has ever been able to perform better than every other algorithm in every optimization problem [21]. The benefits of metaheuristics algorithms include elasticity, self-adaptation, theoretical naivety, and the capacity to seek a global optimum compared with a local one [22–24].
This paper aims to propose hybrid intelligent models, which can be utilized to predict the rubber price in Malaysia. The proposed models depend on RBFNN-kSAT logic mining using three optimization algorithms, including GWO, ABC, and PSO. PSO has attracted several scholars. It is the most frequently utilized algorithm for finding the best values to reduce the expectations as a specific function [22]. ABC is utilized for providing the finest solution in training RBFNN, and it replicates the honeybee swarms’ intelligent foraging character. PSO is a robust, straightforward, and population-based stochastic optimization algorithm [23]. GWO is another example of a metaheuristic optimization technique. This algorithm has been widely applied in many industries due to its robustness and simple implementation [24]. In this work, hybrid models or combined techniques are employed to forecast the price of rubber in Malaysia. Therefore, three different individual models are used, namely GWO with RBFNN-kSAT, ABC with RBFNN-kSAT, and PSO with RBFNN-kSAT.
Combined techniques are applied in various fields. However, they have not been used for forecasting the rubber price in Malaysia. This study aims to provide major novelties. According to the available literature and the authors’ best knowledge, previous studies that examined the price of rubber in Malaysia by using different attributes are still limited. In this work, new attributes are used to understand the rubber price behavior, as well as several influencing attributes to guarantee steady future prices and make wise decisions, accordingly. The factors of price fluctuation attributes should be examined to forecast the fluctuating prices of rubber. This can be accomplished by applying ANN and the logic mining method with different algorithms, focusing on the strategy of optimization according to different attributes. Being robust, fast, and simple, GWO has been used to train RBFNN-kSAT based on logic mining. The required GWO computing memory is small for updating the location of the individuals because no prior knowledge is required from the previous location or the speed of individuals. With these benefits, utilizing GWO to optimize the RBFNN-kSAT parameters can produce the best results and reveal associations between the qualities, thereby predicting the price of Malaysian rubber. Moreover, the performance assessment metrics have been used for assessing the applied algorithms’ efficiency in RBFNN-kSAT training with a varied number of neurons. The best algorithm to predict the price of Malaysian rubber has been determined by comparing the output of each algorithm. Malaysia is a major exporting country of natural rubber. Therefore, the findings of this study are expected to provide insights into maintaining Malaysia’s global competitiveness in the rubber industry.
This study employs logic mining to understand the performance of the price of Malaysian rubber. Moreover, an innovative method is introduced in this work to determine the association between attributes of monthly rubber prices and how the Malaysian rubber industry output is affected. To this end, the Radial Basis Function Neural Network, as well as the logic mining method are used. Several contributions are provided in this work, such as converting the data set of the price of Malaysian rubber to a specific systematic form according to 2 Satisfiability (2SAT) logic, applying the 2 Satisfiability Reverse Analysis (2SATRA) technique as another method to extract associations among the attributes or factors and forecast the price of Malaysian rubber in the future, assessing the ability and accuracy of 2SATRA based on the RBFNN, and utilizing different algorithms, such as ABC, PSO, and GWO for identifying relationships among the attributes or factors and predicting the price of Malaysian rubber in the future.
The structure of this paper is arranged as follows: the rationale and contribution of the study are presented and discussed in Section 1. Section 2 provides and discusses the k-Satisfiability (kSAT), followed by the Malaysian rubber dataset in logic mining 2SAT. Section 3 presents the methodology of this study. Section 4 presents the experimental setup in this work. Section 5 presents and discusses the results. Finally, Section 6 provides the conclusion and recommendations for further studies.
2 Logic Programming k Satisfiability (kSAT)
The Logic Programming k Satisfiability representation consists of strictly k literals per clause [25]. Randomized kSAT considers bipolar value for the variables individually,
1) Given the set for the m logical variables,
2) Consists of a given set of logical literals, corresponding to m variables. Specifically, the literal comprises a positive logical variable
3) Comprises the specified set of the n different clauses:
The logical value of every variable has been set as −1 (False) and 1 (True). An explicit definition of the kSAT formula is denoted as
Hence, a clear-cut definition of
For example, the logical representation when
In addition, the generalized form of
Therefore, the logical formula generated when
This study focuses on the 2SAT logic programming when k = 2. This paper aims to provide the properties of the Malaysian rubber pricing datasets, which are related to variables P2SAT with the symbolic rule of ANN. The logic mining approach via 2-Satisfiability and RBFNN provides a solid logical rule in mapping the rubber data set’s monthly price to boost the rubber trade, as shown in Fig. 1 according to logic mining of 2SAT in Eq. (3).
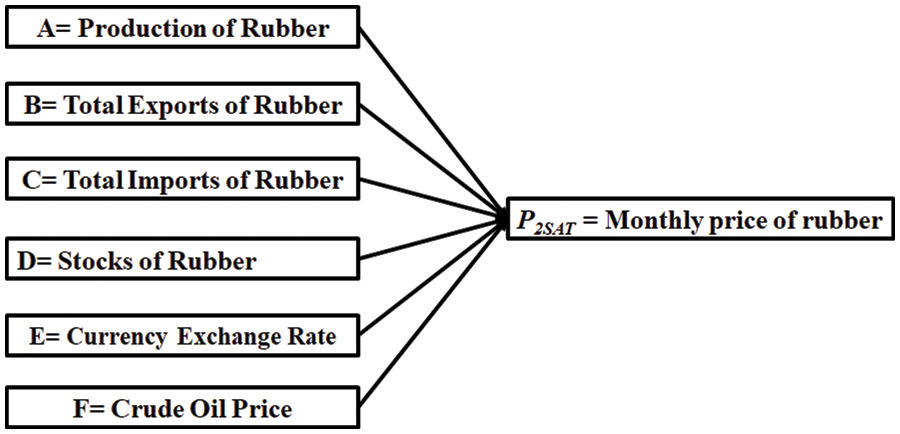
Figure 1: The data set of rubber description
The rubber data set is a set of information gathered from Malaysia’s rubber business. In this regard, reference [28] considered only several variables without studying other significant variables, which might influence the price of rubber production, total exports and imports of rubber, rubber stocks, as well as crude oil price, and the currency exchange rate. This paper aims to bridge the gap in the available literature regarding several factors, including the production of rubber, its total exports, and imports, rubber stocks, crude oil price, as well as rates of currency exchange to examine the behavior of the monthly price of Malaysian rubber. The rubber price data were obtained from the Malaysian Rubber Board in Malaysia. The independent variables data were gathered from the Malaysian Rubber Board, Department of Statistics of Malaysia online. A total of six factors were used to select the variables based on previous studies that investigated Malaysia’s natural rubber [3–6], whereby researchers used the univariate method to forecast the rubber price. A multivariate method has been used in this work, whereby several different explanatory variables can be implemented to forecast fluctuations in the monthly price of rubber in Malaysia.
In this study, GWO, PSO, and ABC algorithms were used with RBFNN-kSAT for enhancing the export performance of Malaysian rubber and forecasting the prospects of the monthly price of rubber in Malaysia. A comprehensive flowchart, as shown in Fig. 2, demonstrates the methodology of this study.
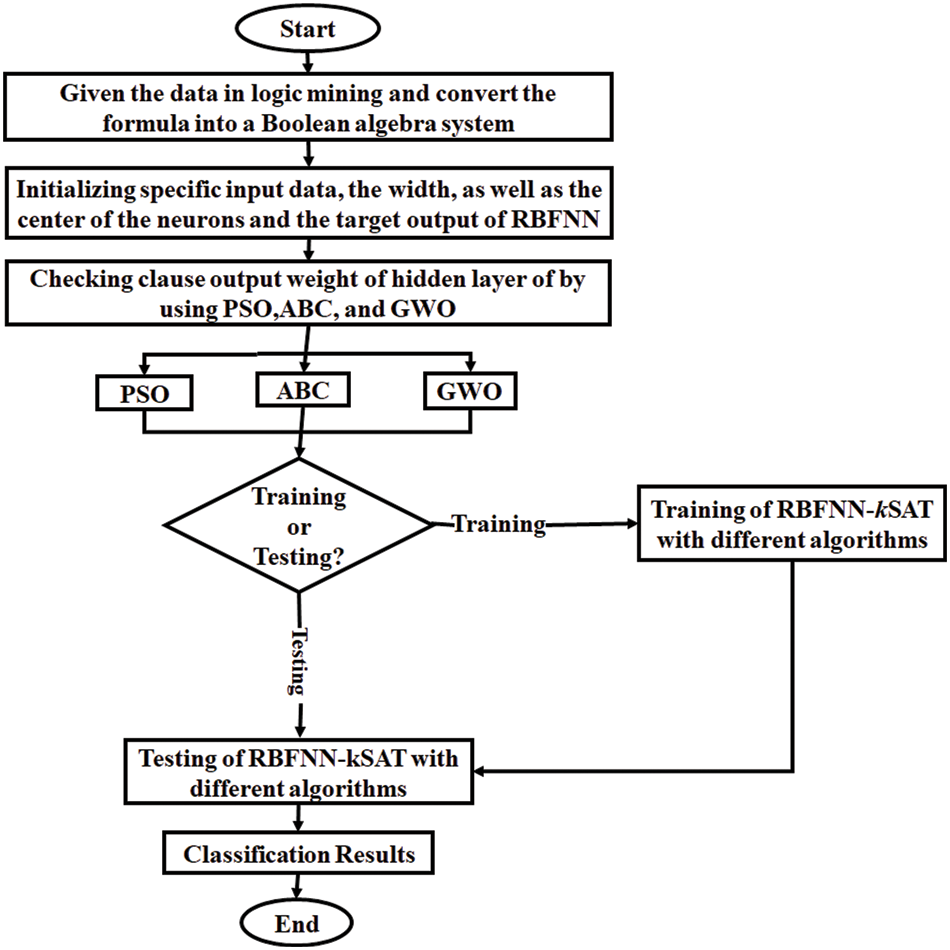
Figure 2: Methodology flowchart of the proposed hybridizations
Further details of the proposed algorithms are presented and discussed as follows:
3.1 Radial Basis Function Neural Network (RBFNN) with 2SAT
RBFNN represents an especially designed feed-forward neural network [29,30], which has 3 layers, involving an input layer, a hidden layer, as well as an output layer. The parameters of width and center can be determined in the RBFNN’s hidden layer in the given process of training, whereas the output weight can be determined in the RBFNN’s output layer computed using the acquired parameters. The important equations of RBFNN are presented as follows [31]:
where
wherein
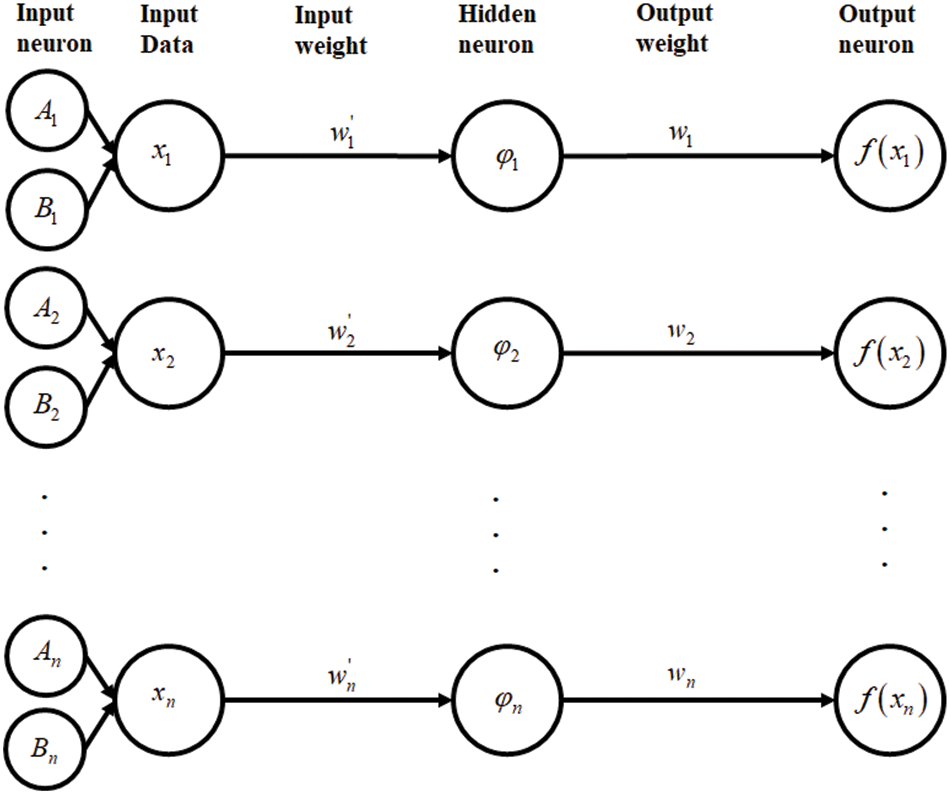
Figure 3: Architecture of RBFNN-kSAT
The RBFNN architecture when dealing with the satisfiability logic programming. The process of RBFNN involves an input neuron obtaining input data to go into the network via an input layer. Later, each of the neurons in the specified hidden layer determines the center, as well as the width for input data, whereby the prototype is stored within it by utilizing the Gaussian activation function, thereby obtaining the ideal output weight of an output layer. A new approach has been established in the current work so that the finest structure of RBFNN for the 2 Satisfiability can be identified.
wherein each variable state in the above equation is determined:
As observed,
wherein j refers to the hidden neuron number,
The distance
When applying the specified distance in the above equation, the width for each of the hidden neurons in the given hidden layer:
Depending on the
When applying
wherein
3.2 Particle Swarm Optimization (PSO) Algorithm
The PSO algorithm, first described by [32] signifies a popularly used swarm intelligence-based metaheuristic method. It has been inspired by how fish swim in schools and flocks of birds as they soar. This can be used to solve complex mathematical issues. PSO began the process with a random population that was improved with each succeeding generation, much like natural, evolutionary algorithms. The PSO algorithm does not include evolutionary operators like crossover and mutation. The PSO algorithm’s parameters can find the latest position by using the present best particle in the domain. PSO is useful when used to solve several optimization issues, including ANNs, mechanical engineering design [33] as well as chaotic systems [34]. For PSO, achieving high accuracy is quite easy with fast convergence [35]. PSO has been frequently implemented in lots of problems of real-life optimization in different domains [36]. In this paper, PSO is used to find the optimized RBFNN-kSAT output weight, thus decreasing the training error to examine the determinants of the price of Malaysian rubber, thereby forecasting the prospect of the rubber price in the future. This algorithm can keep updating parameter values until a suitable solution can be found. The PSO algorithm’s process is given in Fig. 4 for this investigation.
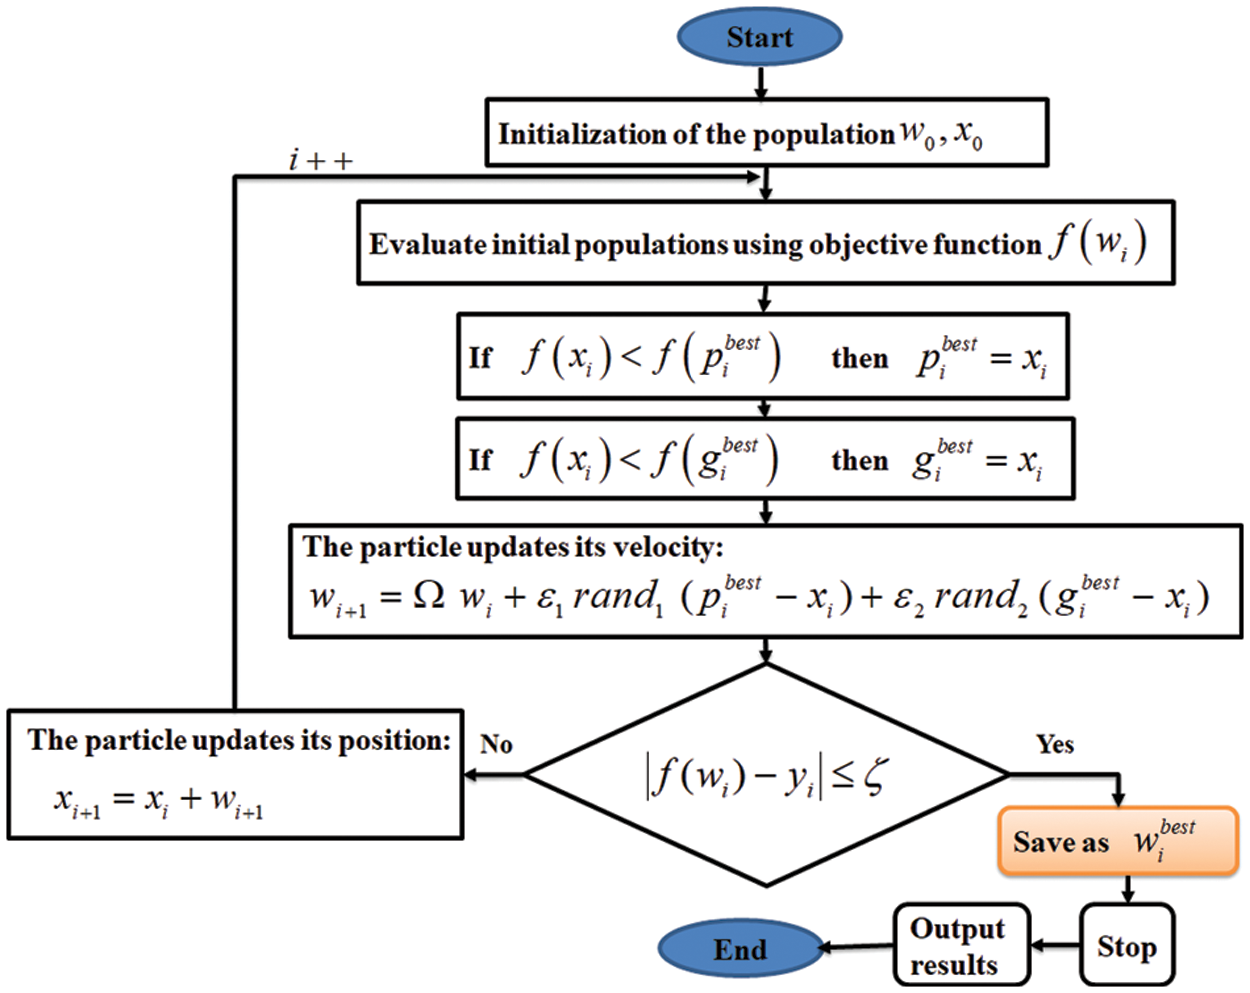
Figure 4: PSO algorithm in training RBFNN-kSAT logic mining
3.3 Artificial Bee Colony (ABC) Algorithm
Artificial intelligence involves establishing optimization algorithms by employing swarm intelligence stimulated by nature. ABC has established itself as an effective tool for tackling optimization problems [37]. It is stimulated by bees’ quest for different sources of food. Apart from finding suitable food sources, ABC can also define food source exploitation, as well as abandonment based on the behavior of bee colonies. Both continuous and discrete optimization problems can benefit from swarm intelligence [38]. The honey amount in the given food source can correspond to the relevant solution quality (i.e., qualification) in the ABC algorithm and the food source location indicates a feasible solution to solve a certain optimization problem. The main objective of ABC is to construct a system, which is characterized as multi-factor (an artificial bees’ colony) that can adapt the principles employed by bees during the process of honey collection to find the best solutions to hybrid optimization challenges. ABC algorithm is generally made up of several individuals. A specified search space is scoured by artificial bees, looking for potential solutions. Independent and artificial bees cooperate to exchange information to find the finest potential solution. Utilizing collective knowledge with shared information, these artificial bees concentrate on promising areas and, therefore, gradually depart regions that are not promising. Therefore, solutions are collectively enhanced [39]. The algorithm continues to search until pre-determined ending criteria are met. Based on the ABC algorithm, bees in their population can be divided into 3 groups: working, onlooker, and scout bees. Working bees usually receive honey from the discovered honey sources and use the waggle dance to communicate with onlooker bees, which assess the sources and select the best honey source based on certain characteristics like the distance from the hive, honey source richness, honey flavor, and ease or difficulty of honey extraction. Although various factors affect the chosen honey source quality, it can be expressed using one variable only [39]. Scout bees often discover new sources of honey. By searching the surroundings, their memory can recall this new source of honey as soon as they discover it. If the new source of honey is more plentiful compared to the previous honey source, bees will recall the new source, and they will forget the previous source. When they return to their hive, these scout bees use the waggle dance to tell other bees about the discovered honey d source. Fig. 5 illustrates the ABC algorithm procedure.
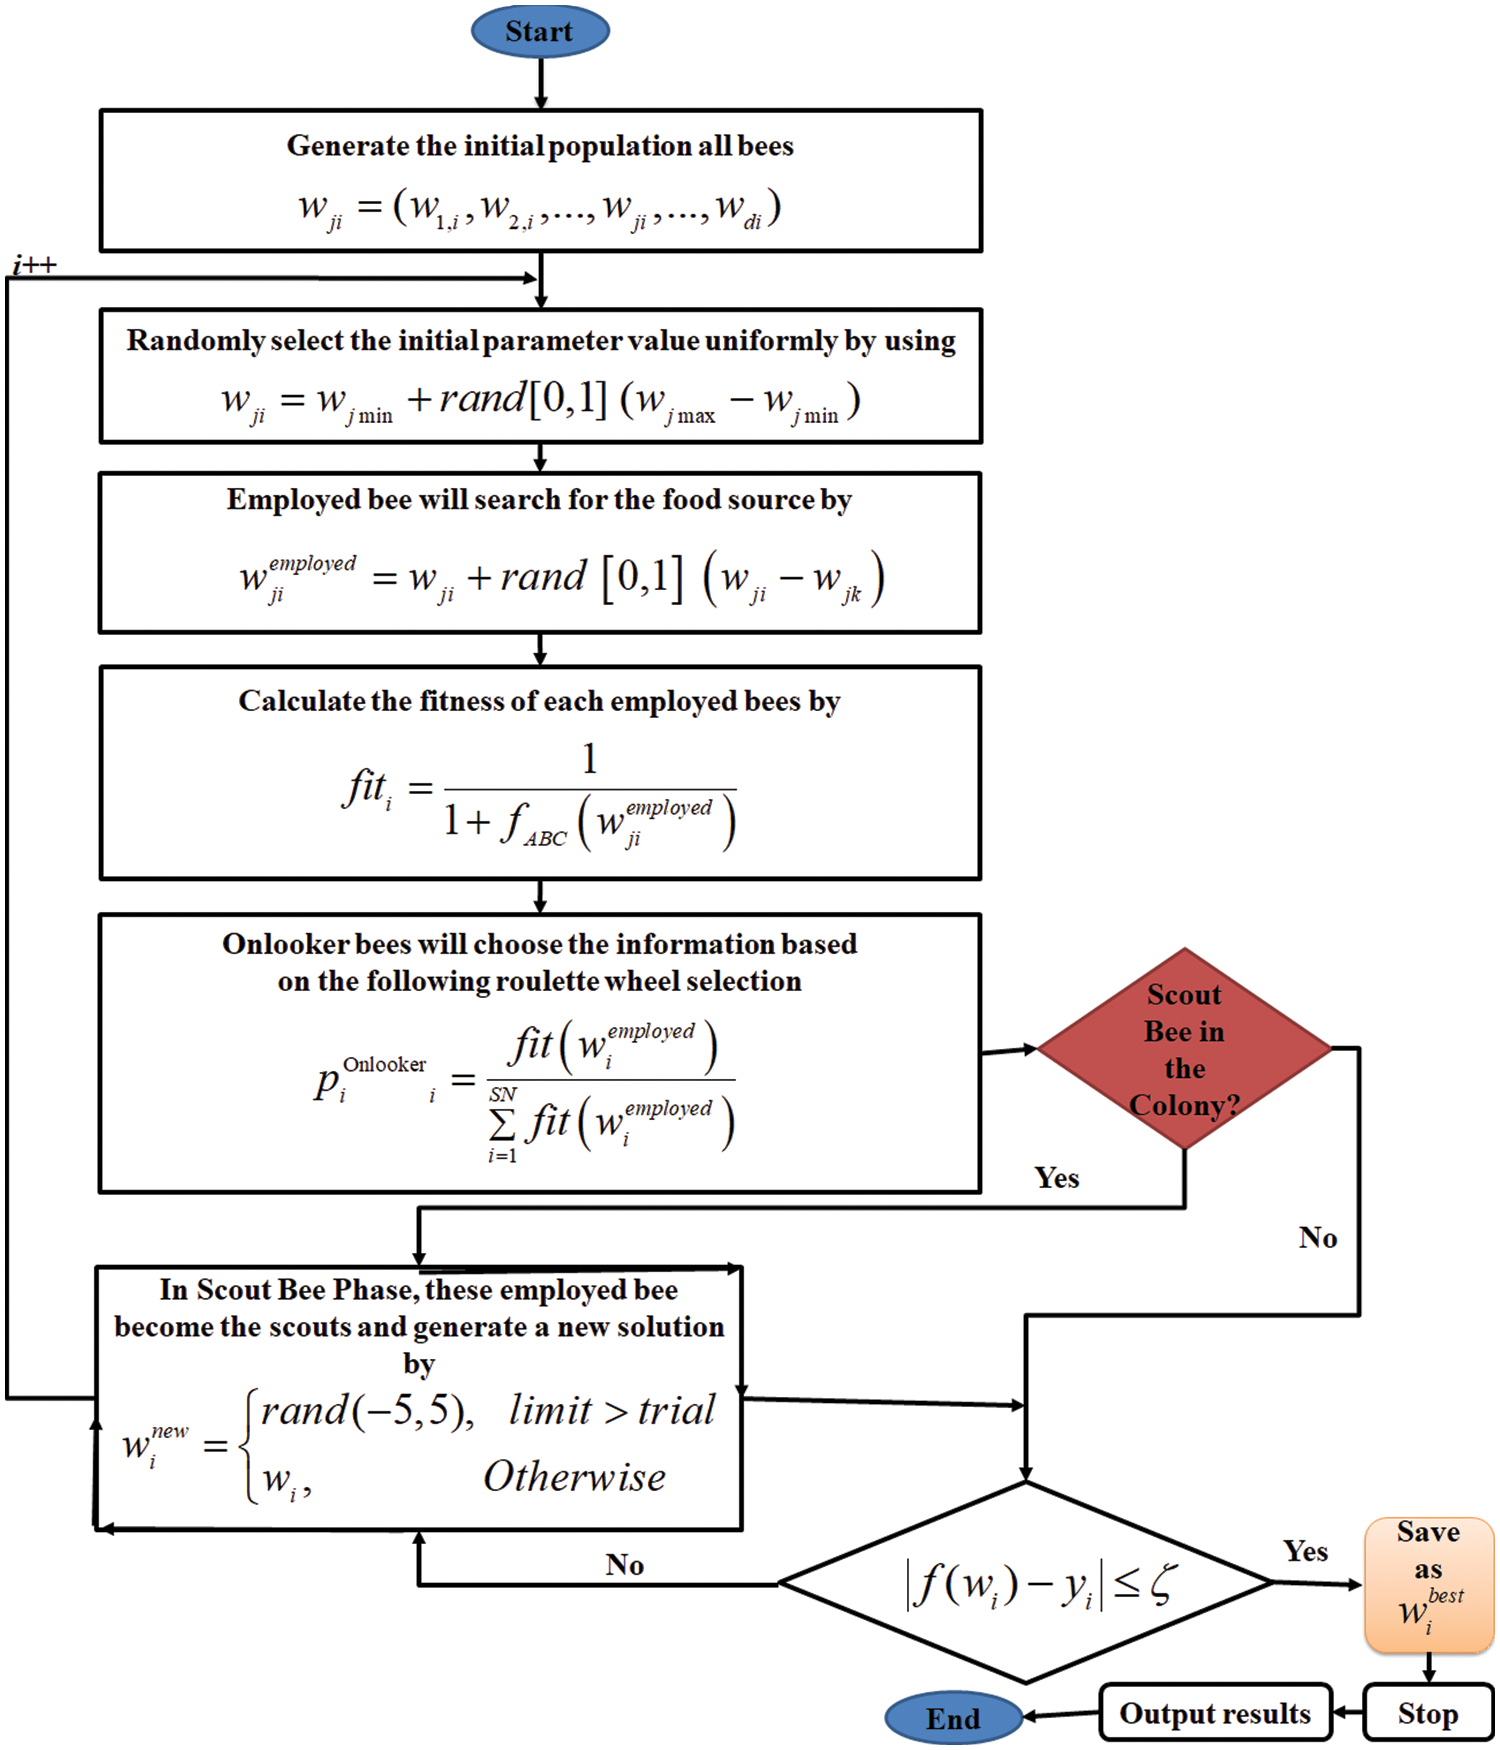
Figure 5: ABC algorithm in training RBFNN-kSAT logic mining
3.4 Grey Wolf Optimization (GWO) Algorithm
The GWO algorithm has been recently introduced by researchers [40]. The GWO follows the same phases as other population-based algorithms in the process of optimization. The GWO’s main concept has been stimulated by grey wolves’ real behavior in nature. This algorithm works on simulating a leadership hierarchy of the predatory behavior of wolves. It uses the capabilities of grey wolves in searching, preying, and encircling in the hunting process for optimization [41]. The algorithm of the RBFNN-kSATGWO model is made up of three distinct wolf groups, including alpha wolves, beta wolves, and omega wolves. The alpha wolves make hunting decisions, which are directed to the pack. Often, the alpha wolves are not the strongest pack members, however, they show great capability of directing the members. This demonstrates that the pack’s association and self-restraint are more important than its physical power [42]. Beta wolves who support alpha wolves in decision-making and other tasks such as supervising lower-level wolves and discipline ranked in the second position in the organization. The alpha wolves should be respected. Omega wolves are the smallest-ranking wolves because they act as a scapegoat, and wolves must be submissive to the omega. The omega wolves can only eat when all wolves finish their meal. Although these wolves look weak and passive, their absence creates internal conflict in the pack because they can help satisfy the pack and maintain dominance. Sometimes, the omega wolves act as babysitters. Group hunt down is also a fascinating social characteristic of grey wolves, together with their social hierarchy [43]. The grey wolves’ major hunting phases include [44]:
1) Follow, pursue, and get close to the prey.
2) Follow, surround, and torment until the prey cannot move.
3) Go after the prey
The GWO algorithm was utilized in RBFNN-kSAT to minimize the training error. By minimizing the training error, the optimized output weight of RBFNN-kSAT to obtain the premier logic mining for the rubber price data set in Malaysia can be obtained. The application of GWO in RBFNN is described as RBFNN-kSATGWO. The following describes the function to be optimized:
where
where
where t denotes the current iteration,
where r1 is a random number in the interval of [0,1]. Set A is a convergence factor given as:
where r2 is a random number in the interval of [0,1]. Set a is a controlling factor, which is linearly decreased from 2 to 0 throughout iterations, that is
The positions of the wolves as they approach their prey are as follows:
The flowchart of implementing GWO in RBFNN (RBFNN-kSATGWO) is given in Fig. 6.
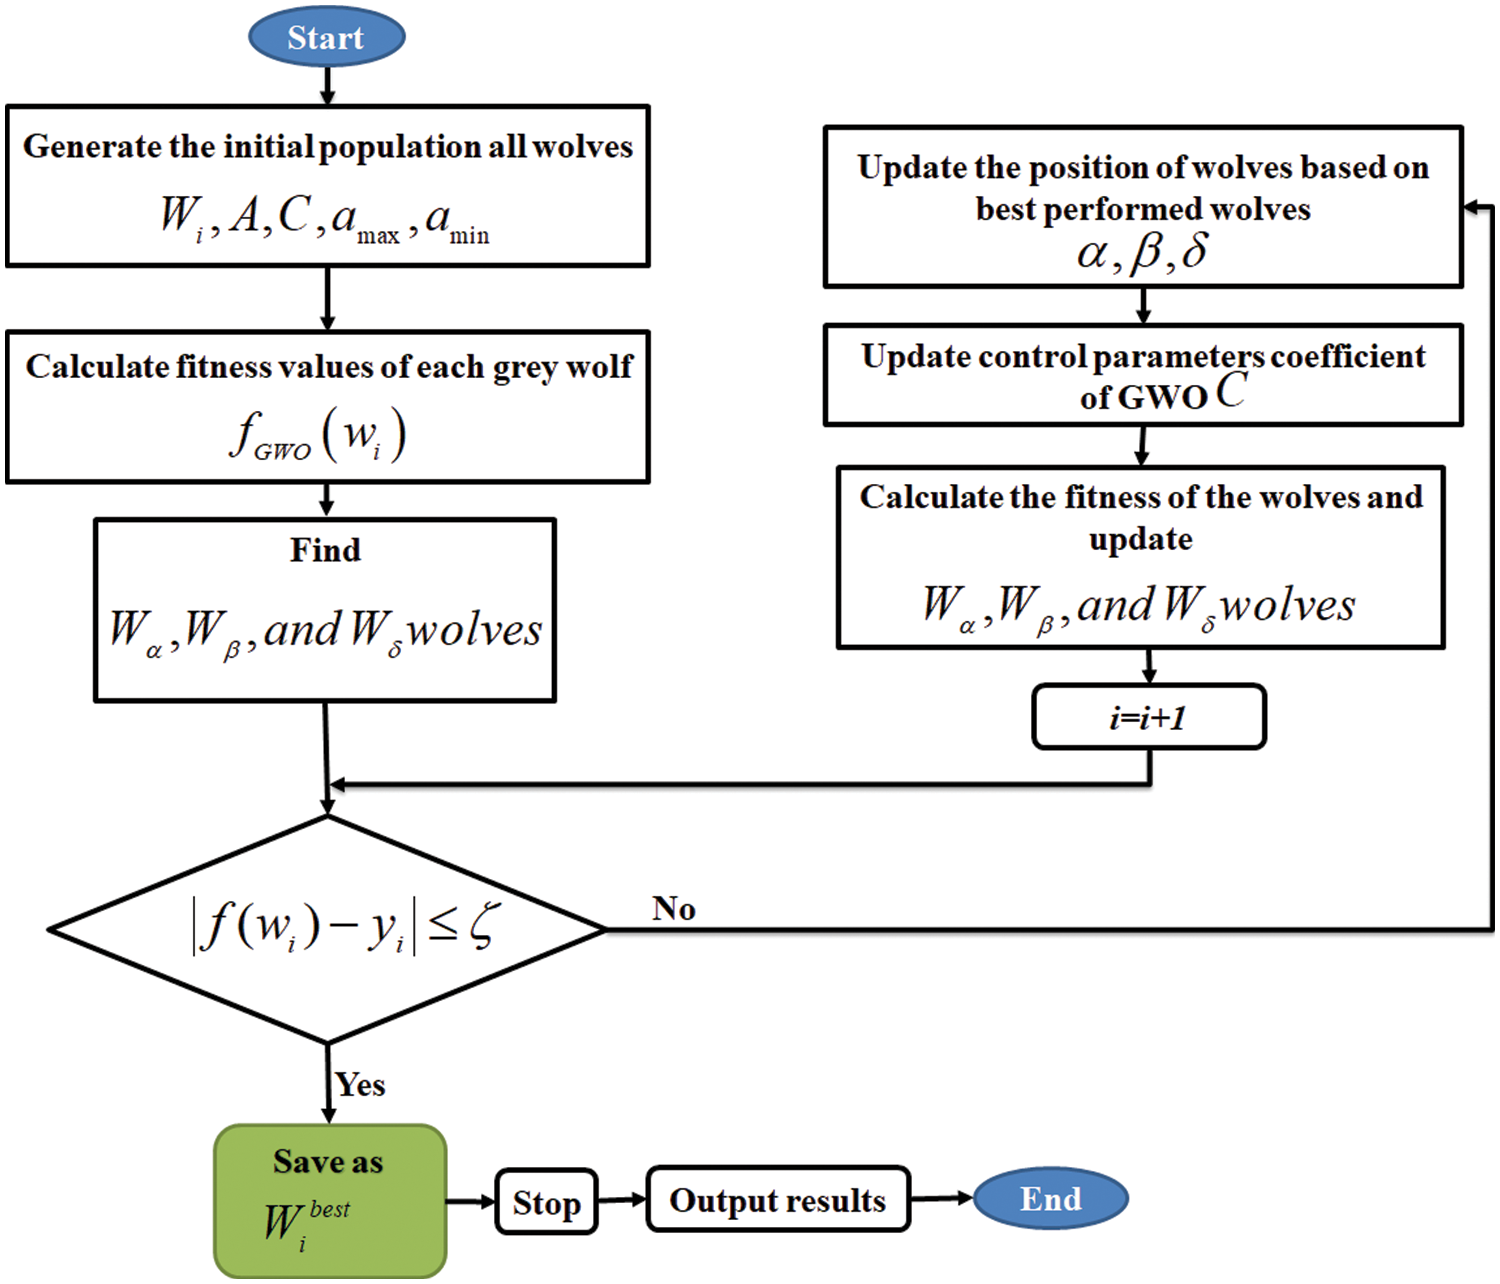
Figure 6: GWO algorithm in training RBFNN-kSAT logic mining
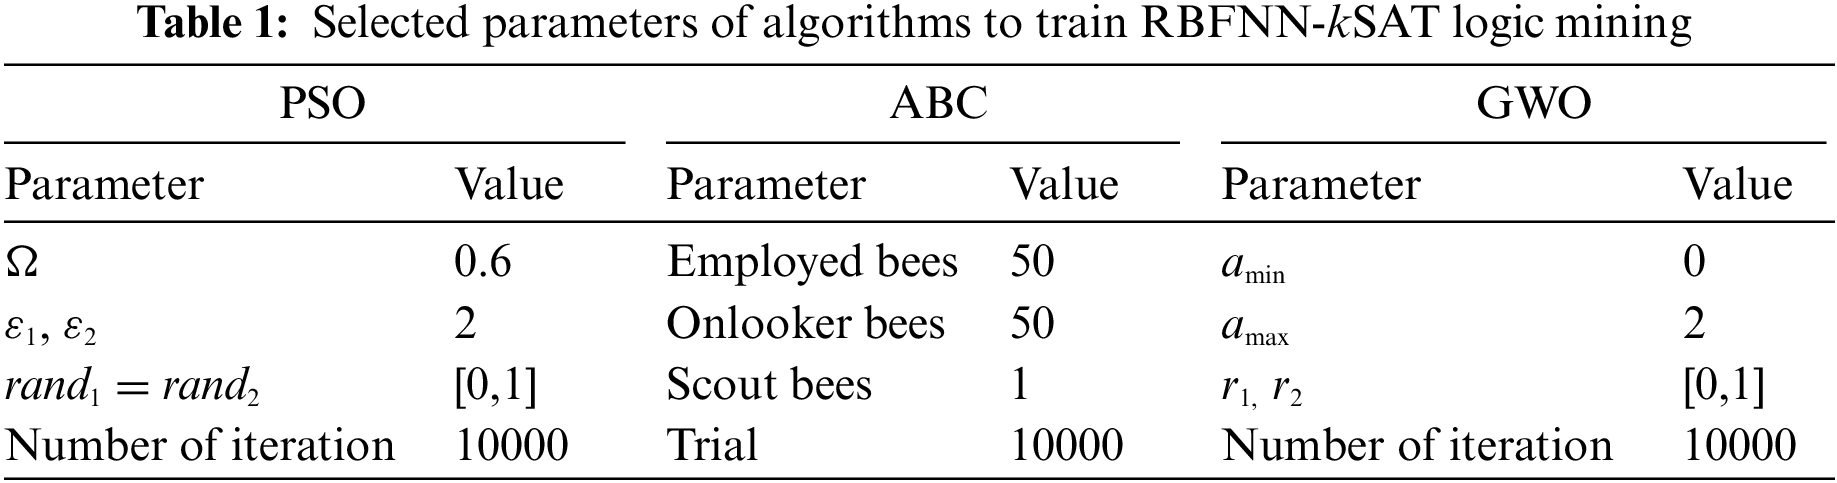
The simulation has been enhanced to evaluate the performance of the algorithms in training RBFNN-kSAT logic mining. Thus, the data set of the real world for the monthly price of Malaysian rubber with six variables were used in this study’s logic mining. In this study, the multivariate technique was employed to forecast changes in the monthly price of rubber in Malaysia using some creative explanatory variables between January 2016 and Mar 2021 as seen in Fig. 2. As training requires more data than testing does to build an ideal learning network, the dataset for Malaysian rubber prices was split into 60% for training and 40% for testing. Besides, Alzaeemi et al. [13] and Abubakar et al. [45] also used the same splitting ratio, whereas 60%:40% has been utilized in this work for data set entries when training and assessing the best learning network. In the training, the network demands further entries compared to testing. This 60%:40% proportion agrees with Sathasivam et al. [19] and Zamri et al. [46]. k Mean clustering [47] is applied to transform the dataset into a specified binary representation. Thus, the developed method of k-Means by MacQueen [47], is the most broadly utilized non-hierarchical procedure among others. The developed method of k-Means represents a partitioning technique suitable for enormous data amounts. Firstly, a specified initial partition with the k clusters (i.e., a given number of clusters) is generated. After that, starting with the initial object in the initial cluster, the distances of Euclidean for the entire objects for the entire cluster foci are computed—if a certain object whose distance to the gravity center for its cluster is bigger than the distance to the gravity center (the centroid) of a different cluster, the given object can be transferred to another cluster. Lastly, the two changed clusters of centroids are also estimated because the compositions can change here. The above-mentioned steps are repeated until every object can be in a specified cluster with the slightest distance to the centroid. This simulation is applied in Microsoft Visual C++ software employing Microsoft Windows 7, 64-bit, 3.40 GHz processor 4096 MB RAM, and 500 GB of the hard drive. Utilizing C++ helps users to control memory management. The entire simulations are completed in the same device to avoid potential biases. Table 1 illustrates the parameters applied in every algorithm.
The effectiveness of the training algorithms was evaluated using various neuronal counts. In this study, six distinct metrics that are Root Mean Square Error (RMSE), Mean Bias Error (MBE), Mean Absolute Percentage Error (MAPE), Systematic Error (SD), Accuracy, the correlation coefficient (R), and Central Process Unit time (CPU time) were used to evaluate the performance of the algorithms for training RBFNN-kSAT logic mining networks.
A particular standard error estimator frequently used in forecasting and classifications is the RMSE [13]. During the learning proses, RMSE calculates the standard deviation between the predicted output,
MBE measures the average difference in the expected value
MAPE [48] measures the percentage difference between the predicted value
Lower SD designated better values [48].
CPU time calculates the needed time by RBFNN-kSAT models in training and testing as given in below [45]. A shorter CPU time indicates better performance [45]:
The algorithm’s capacity to test the Malaysian Rubber Price dataset depends on the accuracy and the correlation coefficient (R). The equations of Accuracy and R are as follows [13,49]:
wherein n indicates the data set size,
The results of the three algorithms, including PSO, ABC, and GWO in training RBFNN-kSAT are summarized in Figs. 7–11 and Table 2. The models stated above were utilized to create a logic rule that examines the link between the candidate’s features and helps to properly predict changes in the price of rubber in Malaysia over time. The model not only helps the Malaysian rubber sector export more effectively but also predict future price. The best algorithm, according to the experimental findings, is GWO based on RBFNN-kSAT, which can classify data according to logic mining utilizing the lowest possible values of RMSE, MBE, MAPE, SD, and CPU time. GWO is the best algorithm as it gives the smallest errors with the number of neurons as shown in Figs. 7–11. GWO performance is due to discovery, manipulation, local optima avoidance, and convergence. GWO algorithm can produce very aggressive accuracy in training RBFNN-kSAT logic mining in this study. GWO algorithm performs better than PSO and ABC algorithms in training RBFNN-kSAT logic mining in terms of exploration.
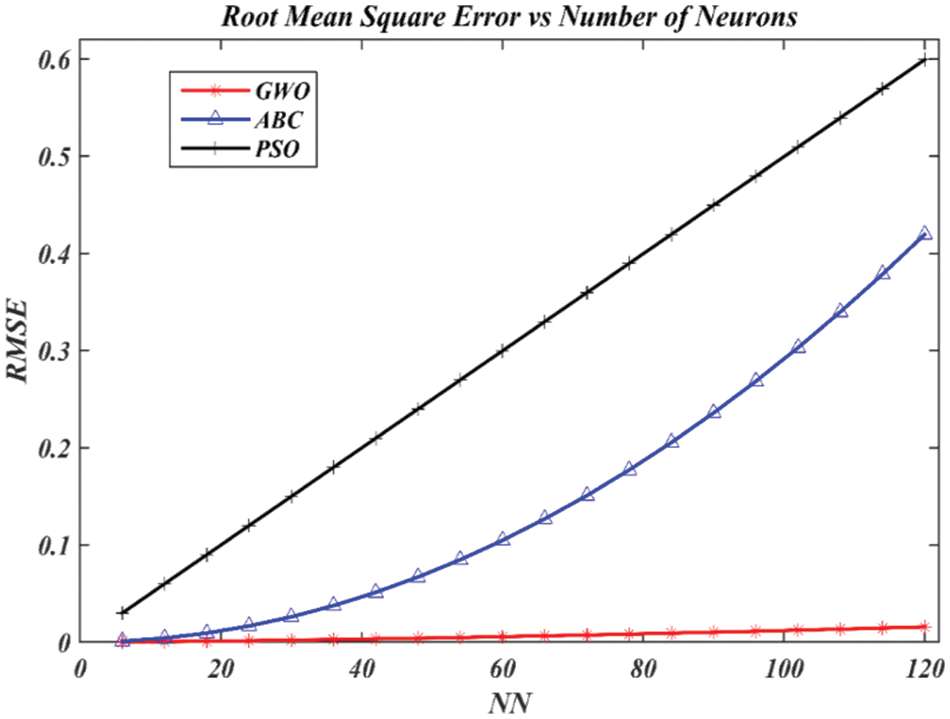
Figure 7: RMSE assessment for predicting rubber price using ABC, PSO, and GWO algorithms
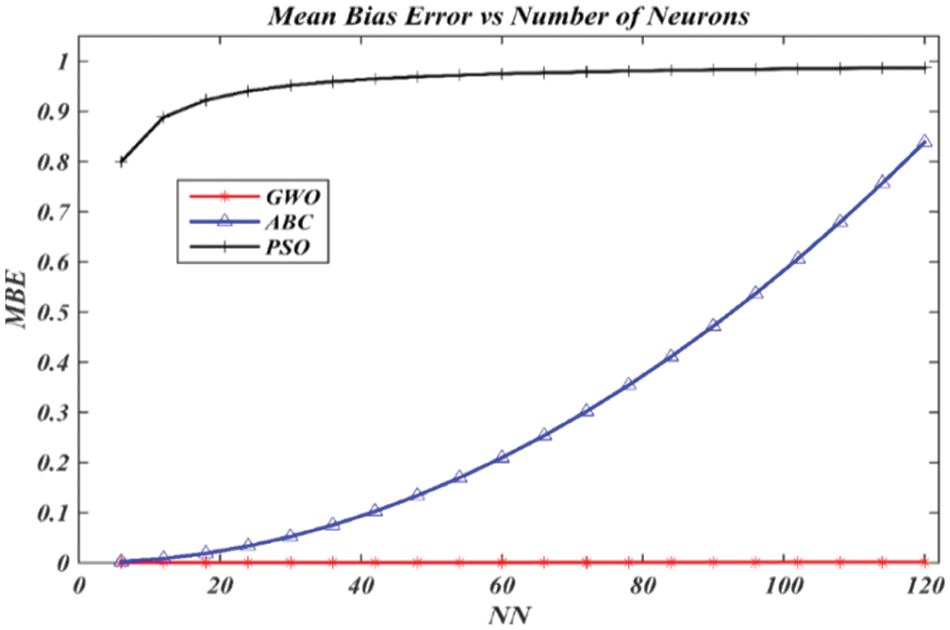
Figure 8: MBE assessment for predicting rubber price using ABC, PSO, and GWO algorithms
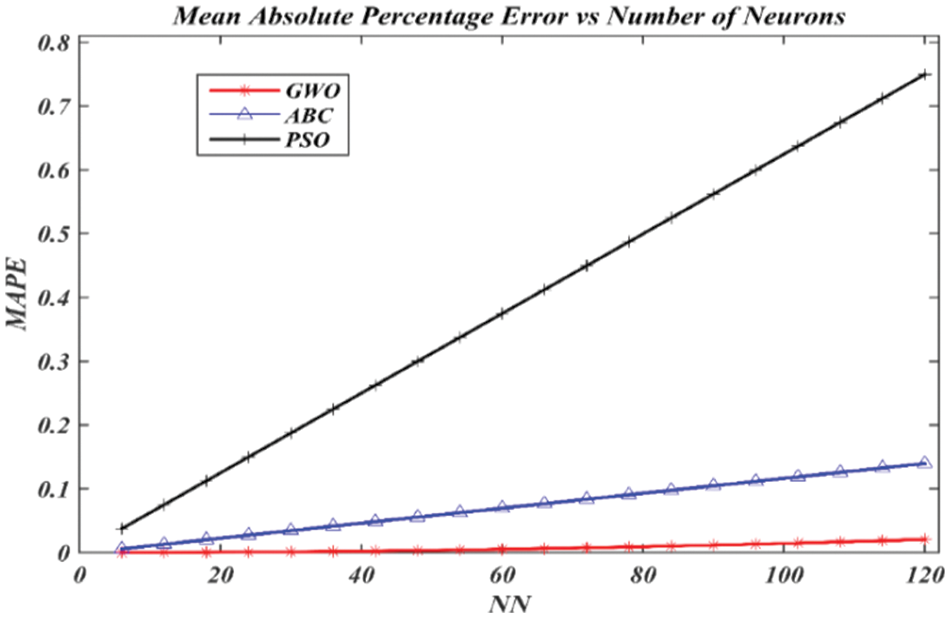
Figure 9: MAPE assessment for predicting rubber price using ABC, PSO, and GWO algorithms
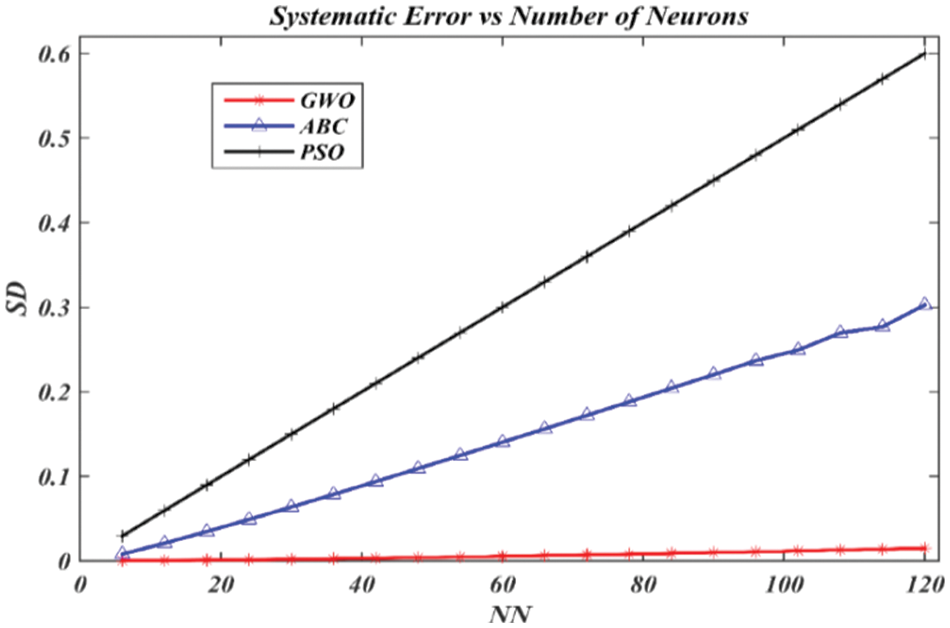
Figure 10: SD assessment for predicting rubber price using ABC, PSO, and GWO algorithms
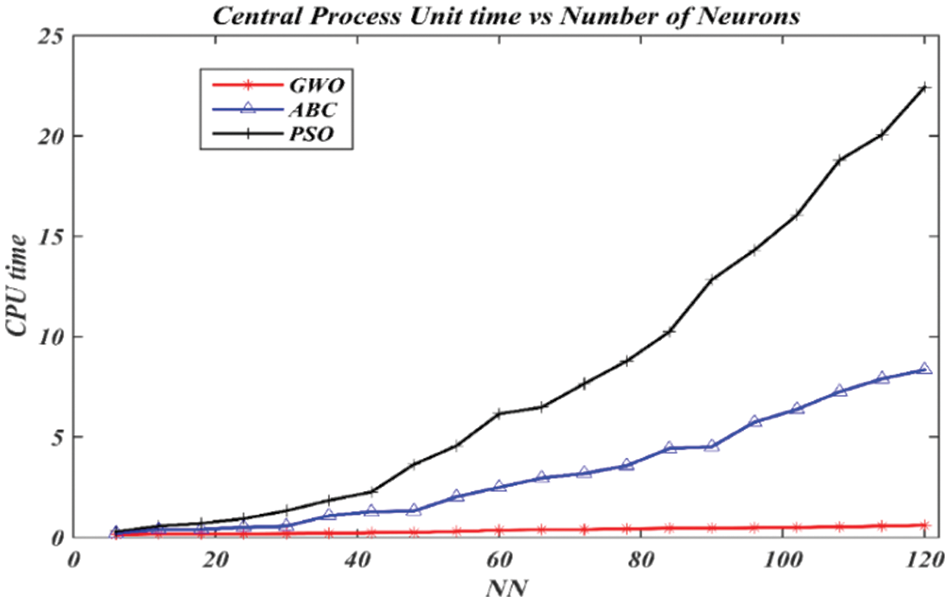
Figure 11: CPU time assessment for predicting rubber price using ABC, PSO, and GWO algorithms
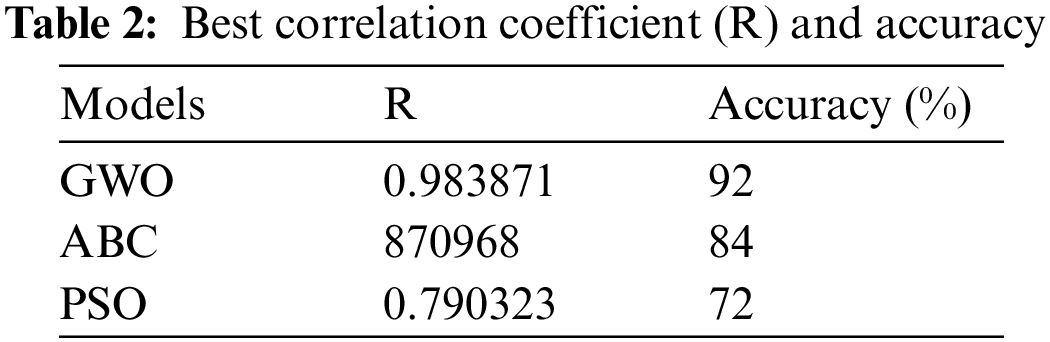
Fig. 7 shows the effectiveness of RMSE in the training of the GWO, ABC, and PSO algorithms to RBFNN-kSAT to obtain the best logic mining for the price of rubber in Malaysia. Comparatively, the GWO algorithm performed significantly better than ABC and PSO algorithms. This is due to the optimization operator into the GWO, particularly during the process of wolves encircling. The stochastic crossover has improved this solution into global solutions, avoiding the use of the trial-and-error stage.
Fig. 8 reveals the results of MBE in the training of the GWO, ABC, and PSO algorithms to RBFNN-kSAT to get the finest logic mining for the price of rubber in Malaysia. The GWO algorithm performed better than the ABC and PSO algorithms. A reduced value of MBE offers compelling proof that the GWO algorithm performed well when used with RBFNN-kSAT logic mining. The MBE percentage described minimum values compared with the ABC and PSO algorithms. It is the finding of searching, as well as updating the operator in the GWO algorithm, which imitated the grey wolf’s hunting method in nature.
MAPE in Fig. 9 proves that the GWO algorithm obtained the lowest values with the numbers of neurons if compared to ABC and PSO algorithms. On the other hand, MAPE for the ABC and PSO algorithms dramatically shot up until the last simulations. The operators in the GWO algorithm can prevent local optima successfully and swiftly converge to the optimum rapidly thus leading to smaller MAPE.
Similar results were found for SD values in Fig. 10 when comparing the GWO, ABC, and PSO algorithms.SD, which evaluates the accuracy of forecasting, has been widely applied by researchers to examine solution accuracy. As shown in Fig. 10, GWO has a sturdier ability to train Malaysia’s rubber data set in comparison with ABC and PSO because of the SD lower values. Regarding the CPU time, the GWO algorithm is the fastest if compared with the remaining algorithms as demonstrated in Fig. 11.
The ABC and PSO algorithms are more likely to become stuck in a state of trial-and-error if NN > 40 as seen in Figs. 7–11. In contrast to the ABC algorithm, the PSO algorithm has a quite large training error due to the inclusion of particles in the algorithm. The ABC algorithm with RBFNN-kSAT obtains a relative training error. This is because, throughout the bee phase, the algorithm’s time has been squandered without achieving obvious improvement. After a particular count “limit” of failed attempts, the phase of the scout bee stopped this algorithm from being trapped at local minima. The ABC algorithm took several rounds to generate superior results (output weight). The studies showed that the GWO algorithm, which can achieve global convergence in lesser iterations, can be successfully utilized to extract the greatest logic during the training of RBFNN-kSAT. This led to the lowest possible error. The training mechanism of logic mining to obtain the optimal logic for mapping the relationship between the characteristics of RBFNN-kSAT with GWO is adequate, thereby relating to the collected performance evaluation metrics throughout the simulation. The GWO algorithm with RBFNN-kSAT logic mining is the best model because it can classify test samples with a higher accuracy percentage (92%) than the ABC algorithm with RBFNN-kSAT logic mining model (84%) and the PSO algorithm with RBFNN-kSAT logic mining model (72%). The findings demonstrated that the optimum model for establishing a specified logical rule and classifying the association among the attributes of the candidate is the GWO algorithm with RBFNN-kSAT logic mining. This helps to achieve a greater level of accurate anticipating price changes for rubber. According to the results, the GWO algorithm is the best model in RBFNN-kSAT logic mining as a long-term relationship between the provided variables was confirmed, demonstrating that all the independent factors were crucial in determining the behavior or movement of the rubber price.
Based on the results in Table 2, the optimum model is GWO with RBFNN-kSAT which has a correlation coefficient R = 0.983871 and can classify 92% of the test samples with a better degree of accuracy than the ABC with RBFNN-kSAT and PSO with RBFNN-kSAT models. Thus, the GWO algorithm with the RBFNN-kSAT logic mining model is the finest logic mining procedure for forecasting the monthly prices of Malaysian rubber by accurately constructing the required monthly price trend. The results revealed that the most influencing variables are rubber manufacturing, total exports of rubber, total imports of rubber, stocks of rubber, currency exchange rate, and crude oil prices. This result demonstrated that rubber goods had a benefit in preserving the stability of the Malaysian currency market. Crude oil prices negatively affect the price of natural rubber. This data can be utilized by the government, as well as policymakers to expand the rubber industry in Malaysia. For forecasting, The GWO algorithm with the RBFNN-kSAT logic mining model is anticipated to be the finest forecasting algorithm for the price of Malaysian rubber. The rubber price fluctuations may assist the government to alter the budgetary plans to achieve further investment incentives and grants in the rubber industry.
Currently, the price of rubber in Malaysia is being instability by influencing variables manufacturing such as total exports of rubber, total imports of rubber, stocks of rubber, currency exchange rate, and crude oil prices, which directly affects earnings and influences Malaysia’s rubber-based income and income of working individual. Therefore, strengthening the management of the price of rubber in Malaysia has become a top priority. The main goal of this paper involved the monthly price prediction of rubber in Malaysia. To analyze the factors influencing Malaysia's rubber pricing and predict future prices, three distinct models were used in this study. The GWO algorithm with the RBFNN-kSAT logic mining model is the most optimized logic mining technique for forecasting the monthly price of Malaysian rubber by accurately constructing the required monthly price trend. The results revealed that the most influencing variables are rubber manufacturing, total exports of rubber, total imports of rubber, stocks of rubber, currency exchange rate, and crude oil prices. This result demonstrated that rubber goods had a benefit in preserving the stability of the Malaysian currency market. Crude oil prices negatively affect the price of natural rubber. This data can be utilized by the government, as well as policymakers to expand the rubber industry in Malaysia. For forecasting, The GWO algorithm with the RBFNN-kSAT logic mining model is anticipated to be the finest forecasting algorithm for the price of Malaysian rubber. The rubber price fluctuations may assist the government to modify the budgetary plans to achieve further investment incentives and grants in the rubber industry.
The main goal of this paper involved the monthly price prediction of rubber in Malaysia. To analyze the factors influencing Malaysia's rubber pricing and predict future prices, three distinct models were used in this study. According to the evaluation, the GWO algorithm is the finest logic mining technique in training RBFNN-kSAT for predicting the Malaysian monthly price of rubber as it achieved 92% accuracy compared to ABC and PSO algorithms were 84% and 74%, respectively. The experimental findings show that the intended monthly price trend for Malaysian rubber has been determined with the greatest degree of accuracy. The government and decision-makers may boost Malaysia’s rubber business with the help of such information. To increase investment in the rubber market, it is advised that training and seminars be provided for the staff of the export department. It is advised that more research focus on two crucial factors for future study. First, various data mining tasks like time series forecasting and regression can be examined using the proposed GWO algorithm with the RBFNN-kSAT logic mining model. Second, further research is advised to determine the effectiveness of the GWO algorithm when combined with the RBFNN-kSAT logic mining model to tackle classical optimization problems, involving the problem of the N queen and the problem of a traveling salesman. Accordingly, further research is required to study some computational intelligence procedures, which can be employed for solving certain issues like the MBO, i.e., the monarch butterfly optimization, EWA, i.e., the earthworm optimization, EHO, in other words, the elephant herding optimization, MS, i.e., the moth search, SMA, i.e., the slime mold, in addition to HHO, that is, the Harris hawks’ optimization.
Acknowledgement: We would like to thank the Ministry of Higher Education Malaysia and Universiti Sains Malaysia.
Funding Statement: This research is supported by the Ministry of Higher Education Malaysia (MOHE) through the Fundamental Research Grant Scheme (FRGS), FRGS/1/2022/STG06/USM/02/11 and Universiti Sains Malaysia.
Conflicts of Interest: The authors declare that they have no conflicts of interest to report regarding the present study.
References
1. F. Z. Zahari, K. Khalid, R. Roslan, S. Sufahani, M. Mohamad et al., “Forecasting natural rubber price in Malaysia using Arima,” Journal of Physics: Conference Series, IOP Publishing, vol. 995, no. 1, pp. 012013, 2018. [Google Scholar]
2. N. MdLudin, S. Applanaidu and H. Abdullah, “An econometric analysis of natural rubber market in Malaysia,” International Journal of Environmental and Agriculture Research, vol. 2, no. 6, pp. 1850–2454, 2016. [Google Scholar]
3. S. Sharib and A. Halog, “Enhancing value chains by applying industrial symbiosis concept to the Rubber City in Kedah, Malaysia,” Journal of Cleaner Production, vol. 141, pp. 1095–1108, 2017. [Google Scholar]
4. M. F. Basri, M. S. Hapka, M. N. Jaafar and A. A. Muhamat, “Determinants of the price of natural rubber in Malaysia,” International Journal of Business & Management, vol. 6, no. 12, pp. 50–54, 2018. [Google Scholar]
5. I. M. Azmi and R. Alavi, “Patents and the practice of open science among government research institutes in Malaysia: The case of Malaysian Rubber Board,” World Patent Information, vol. 35, no. 3, pp. 235–242, 2013. [Google Scholar]
6. H. H. Goh, K. L. Tan, C. Y. Khor and L. Ng, “Volatility and market risk of rubber price in Malaysia: Pre-and post-global financial crisis,” Journal of Quantitative Economics, vol. 14, no. 2, pp. 323–344, 2016. [Google Scholar]
7. S. A. Hamid and Z. Iqbal, “Using neural networks for forecasting volatility of S&P 500, index future prices,” Journal of Business Research, vol. 57, no. 10, pp. 1116–1125, 2004. [Google Scholar]
8. Y. F. Wang, “Mining stock price using fuzzy rough sets system,” Expert Systems with Applications, vol. 24, no. 1, pp. 13–23, 2003. [Google Scholar]
9. V. Asipi and B. Duraković, “Performance analysis of B2B and B2C companies in Northern Macedonia and Serbia,” Heritage and Sustainable Development, vol. 2, no. 2, pp. 89–99, 2020. [Google Scholar]
10. S. Kareem, Z. J. Hamad and S. Askar, “An evaluation of CNN and ANN in prediction weather forecasting: A review,” Sustainable Engineering and Innovation, vol. 3, no. 2, pp. 148–159, 2022. [Google Scholar]
11. S. A. Alzaeemi and S. Sathasivam, “Artificial immune system in doing 2-satisfiability based reverse analysis method via a radial basis function neural network,” Processes, vol. 8, no. 10, pp. 1–28, 2020. [Google Scholar]
12. G. Zhang, B. E. Patuwo and M. Y. Hu, “Forecasting with artificial neural networks: The state of the art,” International Journal of Forecasting, vol. 14, no. 1, pp. 35–62, 1998. [Google Scholar]
13. S. A. Alzaeemi and S. Sathasivam, “Examining the forecasting movement of palm oil price using RBFNN-2SATRA metaheuristic algorithms for logic mining,” IEEE Access, vol. 9, pp. 22542–22557, 2021. [Google Scholar]
14. J. Moody and C. J. Darken, “Fast learning in networks of locally tuned processing units,” Neural Computation, vol. 1, no. 2, pp. 281–294, 1989. [Google Scholar]
15. T. N. Pandey, A. K. Jagadev, S. Dehuri and S. B. Cho, “Prediction of exchange rate using improved particle swarm optimized radial basis function networks,” International Journal of Advanced Intelligence Paradigms, vol. 23, no. 3–4, pp. 332–356, 2022. [Google Scholar]
16. N. Kanazawa, “Radial basis functions neural networks for nonlinear time series analysis and time-varying effects of supply shocks,” Journal of Macroeconomics, vol. 64, pp. 103210, 1–49, 2020. [Google Scholar]
17. S. Goudarzi, W. Haslina Hassan, A. H. Abdalla Hashim, S. A. Soleymani, M. H. Anisi et al., “A novel RSSI prediction using imperialist competition algorithm (ICAradial basis function (RBF) and firefly algorithm (FFA) in wireless networks,” PLoS One, vol. 11, no. 7, pp. e0151355, 2016. [Google Scholar] [PubMed]
18. M. Gan, H. Peng and X. P. Dong, “A hybrid algorithm to optimize RBF network architecture and parameters for nonlinear time series prediction,” Applied Mathematical Modelling, vol. 36, no. 7, pp. 2911–2919, 2012. [Google Scholar]
19. S. Sathasivam, S. A. Alzaeemi, M. T. Ismail and V. V. Pachala, “Palm oil price forecasting in Malaysia using 2 satisfiability based reverse analysis method via radial basis function neural network,” Solid State Technology, vol. 63, no. 1s, pp. 334–339, 2020. [Google Scholar]
20. B. Yu and X. He, “Training radial basis function networks with differential evolution,” in Proc. of the Institute of Electrical and Electronics Engineers (IEEE) Int. Conf. on Granular Computing, 10–12 May 2006, Atlanta, GA, USA, pp. 157–160, 2006. [Google Scholar]
21. Y. C. Ho and D. L. Pepyne, “Simple explanation of the no free lunch theorem of optimization,” Cybernetics and Systems Analysis, vol. 38, no. 2, pp. 292–298, 2002. [Google Scholar]
22. N. Zeng, Z. Wang, H. Zhang and F. E. Alsaadi, “A novel switching delayed PSO algorithm for estimating unknown parameters of lateral flow immunoassay,” Cognitive Computation, vol. 8, no. 2, pp. 143–152, 2016. [Google Scholar]
23. M. S. M. Kasihmuddin, A. Mansor, S. A. Alzaeemi and S. Sathasivam, “Satisfiability logic analysis via radial basis function neural network with artificial bee colony algorithm,” International Journal of Interactive Multimedia & Artificial Intelligence, vol. 6, no. 6, pp. 1–10, 2021. [Google Scholar]
24. A. Alzaqebah, I. Aljarah, O. Al-Kadi and R. Damaševičius, “A modified grey wolf optimization algorithm for an intrusion detection system,” Mathematics, vol. 10, no. 6, pp. 999, 2022. [Google Scholar]
25. S. Sathasivam, M. Mamat, M. S. M. Kasihmuddin and M. A. Mansor, “Metaheuristics approach for maximum k satisfiability in restricted neural symbolic integration,” Pertanika Journal of Science & Technology, vol. 28, no. 2, pp. 545–564, 2020. [Google Scholar]
26. Z. Zhang, D. Xu and J. Zhou, “A structural entropy measurement principle of propositional formulas in the conjunctive normal form,” Entropy, vol. 23, no. 3, pp. 1–15, 2021. [Google Scholar]
27. S. A. Alzaeemi, S. Sathasivam and M. Shareduwan, “Maximum 2-satisfiability in radial basis function neural network,” Journal of Quality Measurement and Analysis, vol. 16, no. 1, pp. 107–115, 2020. [Google Scholar]
28. M. F. Basri, M. S. Hapka, M. N. Jaafar and A. A. Muhamat, “Determinants of the price of natural rubber in Malaysia,” International Journal of Business & Management, vol. 6, no. 12, pp. 50–54, 2018. [Google Scholar]
29. D. Lowe, “Adaptive radial basis function nonlinearities and the problem of generalization,” in 1989 First IEE Int. Conf. on Artificial Neural Networks, Conf. Publ. No. 313, Hong Kong, pp. 171–175, 1989. [Google Scholar]
30. H. Yu, T. Xie, S. Paszczyñski and B. M. Wilamowski, “Advantages of radial basis function networks for dynamic system design,” IEEE Transactions on Industrial Electronics, vol. 58, no. 12, pp. 5438–5450, 2011. [Google Scholar]
31. S. B. Roh, S. K. Oh, W. Pedrycz, K. Seo and Z. Fu, “Design methodology for radial basis function neural networks classifier based on locally linear reconstruction and conditional fuzzy C-means clustering,” International Journal of Approximate Reasoning, vol. 106, no. 4, pp. 228–243, 2019. [Google Scholar]
32. J. Kennedy and R. Eberhart, “Particle swarm optimization,” in Proc. of ICNN’95-Int. Conf. on Neural Networks IEEE, vol. 4, pp. 1942–1948, 1995. [Google Scholar]
33. S. H. Atawneh, W. A. Khan, N. N. Hamadneh and A. M. Alhomoud, “Application of metaheuristic algorithms for optimizing longitudinal square porous fins,” CMC-Computers, Materials & Continua, vol. 67, no. 1, pp. 73–87, 2021. [Google Scholar]
34. F. Ahmad, A. Farooqi, J. Zhang and N. Ali, “Steady flow of a power law fluid through a tapered non-symmetric stenotic tube,” Applied Mathematics and Nonlinear Sciences, vol. 4, no. 1, pp. 249–260, 2019. [Google Scholar]
35. H. Ling, T. Zhu, W. He, H. Luo, Q. Wang et al., “Coverage optimization of sensors under multiple constraints using the improved PSO algorithm,” Mathematical Problems in Engineering, vol. 2020, no. 2, pp. 1–10, 2020. https://doi.org/10.1155/2020/8820907 [Google Scholar] [CrossRef]
36. K. A. Rashedi, M. T. Ismail, N. N. Hamadneh, S. Wadi, J. J. Jaber et al., “Application of radial basis function neural network coupling particle swarm optimization algorithm to the classification of Saudi Arabia stock returns,” Journal of Mathematics, vol. 2021, no. 5, pp. 1–8, 2021. https://doi.org/10.1155/2021/5593705 [Google Scholar] [CrossRef]
37. L. T. Le, H. Nguyen, J. Dou and J. Zhou, “A comparative study of PSO-ANN, GA-ANN, ICA-ANN, and ABC-ANN in estimating the heating load of buildings’ energy efficiency for smart city planning,” Applied Sciences, vol. 9, no. 13, pp. 1–23, 2019. [Google Scholar]
38. D. Karaboga and B. Basturk, “A powerful and efficient algorithm for numerical function optimization: Artificial bee colony (ABC) algorithm,” Journal of Global Optimization, vol. 39, no. 3, pp. 459–471, 2007. [Google Scholar]
39. D. Karaboga and B. Akay, “A comparative study of artificial bee colony algorithm,” Applied Mathematics and Computation, vol. 214, no. 1, pp. 108–132, 2009. [Google Scholar]
40. S. Mirjalili, S. M. Mirjalili and A. Lewis, “Grey wolf optimizer,” Advances in Engineering Software, vol. 69, pp. 46–61, 2014. [Google Scholar]
41. Z. J. Teng, J. L. Lv and L. W. Guo, “An improved hybrid grey wolf optimization algorithm,” Soft Computing, vol. 23, no. 15, pp. 6617–6631, 2019. [Google Scholar]
42. J. Agarwal, G. Parmar, R. Gupta and A. Sikander, “Analysis of grey wolf optimizer based fractional order PID controller in speed control of DC motor,” Microsystem Technologies, vol. 24, no. 12, pp. 4997–5006, 2018. [Google Scholar]
43. P. Meiwal, H. Sharma and N. Sharma, “Fully informed grey wolf optimizer algorithm,” in Int. Conf. on Information Management & Machine Intelligence, Singapore, Springer, pp. 497–512, 2019. [Google Scholar]
44. C. Muro, R. Escobedo, L. Spector and R. P. Coppinger, “Wolf-pack (Canis lupus) hunting strategies emerge from simple rules in computational simulations,” Behavioural Processes, vol. 88, no. 3, pp. 192–197, 2011. [Google Scholar] [PubMed]
45. H. Abubakar, A. Muhammad and S. Bello, “Ants colony optimization algorithm in the Hopfield neural network for agricultural soil fertility reverse analysis,” Iraqi Journal for Computer Science and Mathematics, vol. 3, no. 1, pp. 32–42, 2022. [Google Scholar]
46. N. E. Zamri, M. Mansor, M. S. Mohd Kasihmuddin, A. Alway, S. Z. Mohd Jamaluddin et al., “Amazon employees resources access data extraction via clonal selection algorithm and logic mining approach,” Entropy, vol. 22, no. 6, pp. 596, 2020. [Google Scholar] [PubMed]
47. J. MacQueen, “Some methods for classification and analysis of multivariate observations,” in Proc. of the Fifth Berkeley Symp. on Mathematical Statistics and Probability, Berkeley, University of California Press, vol. 1, pp. 281–297, 1967. [Google Scholar]
48. T. Kato, “Prediction of photovoltaic power generation output and network operation,” In: Integration of Distributed Energy Resources in Power Systems, Elsevier: Academic Press, pp. 77–108, 2016. [Google Scholar]
49. H. Quan, S. Dong, D. Zhao, H. Li, J. Geng et al., “Generic AI models for mass transfer coefficient prediction in amine-based CO2 absorber, part II: RBFNN and RF model,” AIChE Journal, vol. 69, no. 1, pp. e17904, 2022. [Google Scholar]
Cite This Article
 Copyright © 2023 The Author(s). Published by Tech Science Press.
This work is licensed under a Creative Commons Attribution 4.0 International License , which permits unrestricted use, distribution, and reproduction in any medium, provided the original work is properly cited.
 Downloads
 Citation Tools