
 Submit a Paper
 Propose a Special lssue
 Open Access
ARTICLE
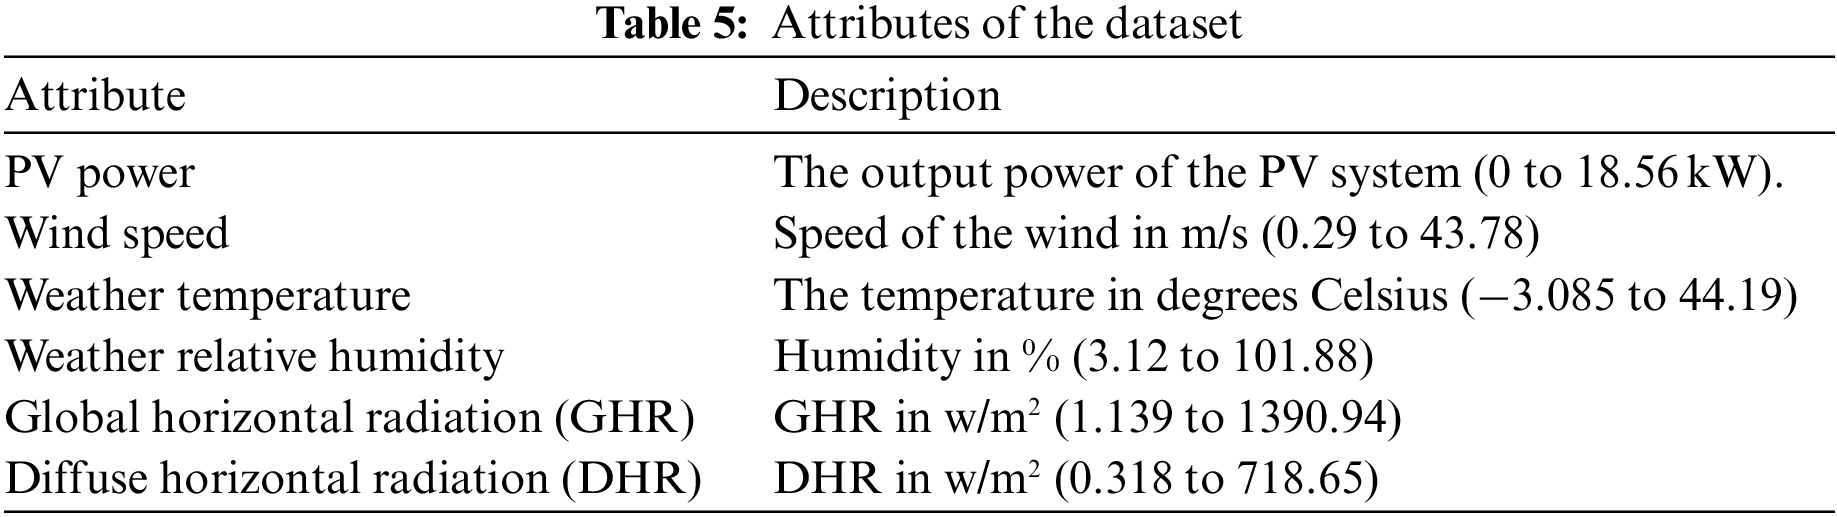
CT-NET: A Novel Convolutional Transformer-Based Network for Short-Term Solar Energy Forecasting Using Climatic Information
1 Department of Software Convergence, Sejong University, Seoul, 143-747, Korea
2 Department of Convergence Engineering for Intelligent Drone, Sejong University, Seoul, 143-747, Korea
* Corresponding Author: Sung Wook Baik. Email:
Computer Systems Science and Engineering 2023, 47(2), 1751-1773. https://doi.org/10.32604/csse.2023.038514
Received 15 December 2022; Accepted 20 April 2023; Issue published 28 July 2023
 View Full Text
 Download PDF
Abstract
Photovoltaic (PV) systems are environmentally friendly, generate green energy, and receive support from policies and organizations. However, weather fluctuations make large-scale PV power integration and management challenging despite the economic benefits. Existing PV forecasting techniques (sequential and convolutional neural networks (CNN)) are sensitive to environmental conditions, reducing energy distribution system performance. To handle these issues, this article proposes an efficient, weather-resilient convolutional-transformer-based network (CT-NET) for accurate and efficient PV power forecasting. The network consists of three main modules. First, the acquired PV generation data are forwarded to the pre-processing module for data refinement. Next, to carry out data encoding, a CNN-based multi-head attention (MHA) module is developed in which a single MHA is used to decode the encoded data. The encoder module is mainly composed of 1D convolutional and MHA layers, which extract local as well as contextual features, while the decoder part includes MHA and feedforward layers to generate the final prediction. Finally, the performance of the proposed network is evaluated using standard error metrics, including the mean squared error (MSE), root mean squared error (RMSE), and mean absolute percentage error (MAPE). An ablation study and comparative analysis with several competitive state-of-the-art approaches revealed a lower error rate in terms of MSE (0.0471), RMSE (0.2167), and MAPE (0.6135) over publicly available benchmark data. In addition, it is demonstrated that our proposed model is less complex, with the lowest number of parameters (0.0135 M), size (0.106 MB), and inference time (2 ms/step), suggesting that it is easy to integrate into the smart grid.Keywords
Integrated renewable energy sources such as wind and solar have played a significant role in the production of green and unpolluted energy around the world [1]. Solar energy is easily accessible and provides energy without burning increasingly scarce and toxic fossil fuels [2]. Several laws have been proposed to improve the power generation rate of PV panels to meet the demand from consumers and establish an efficient management system [3]. However, their strong reliance on weather conditions makes it hard to smoothly transmit PV power (PVP) in smart grids. The impact of uncertain weather due to climatic changes on the generation of solar power significantly reduces their reliability and economic profits [4]. Therefore, strategies to mitigate the impact of weather uncertainties are crucial for ensuring the continued effectiveness and economic viability of solar power.
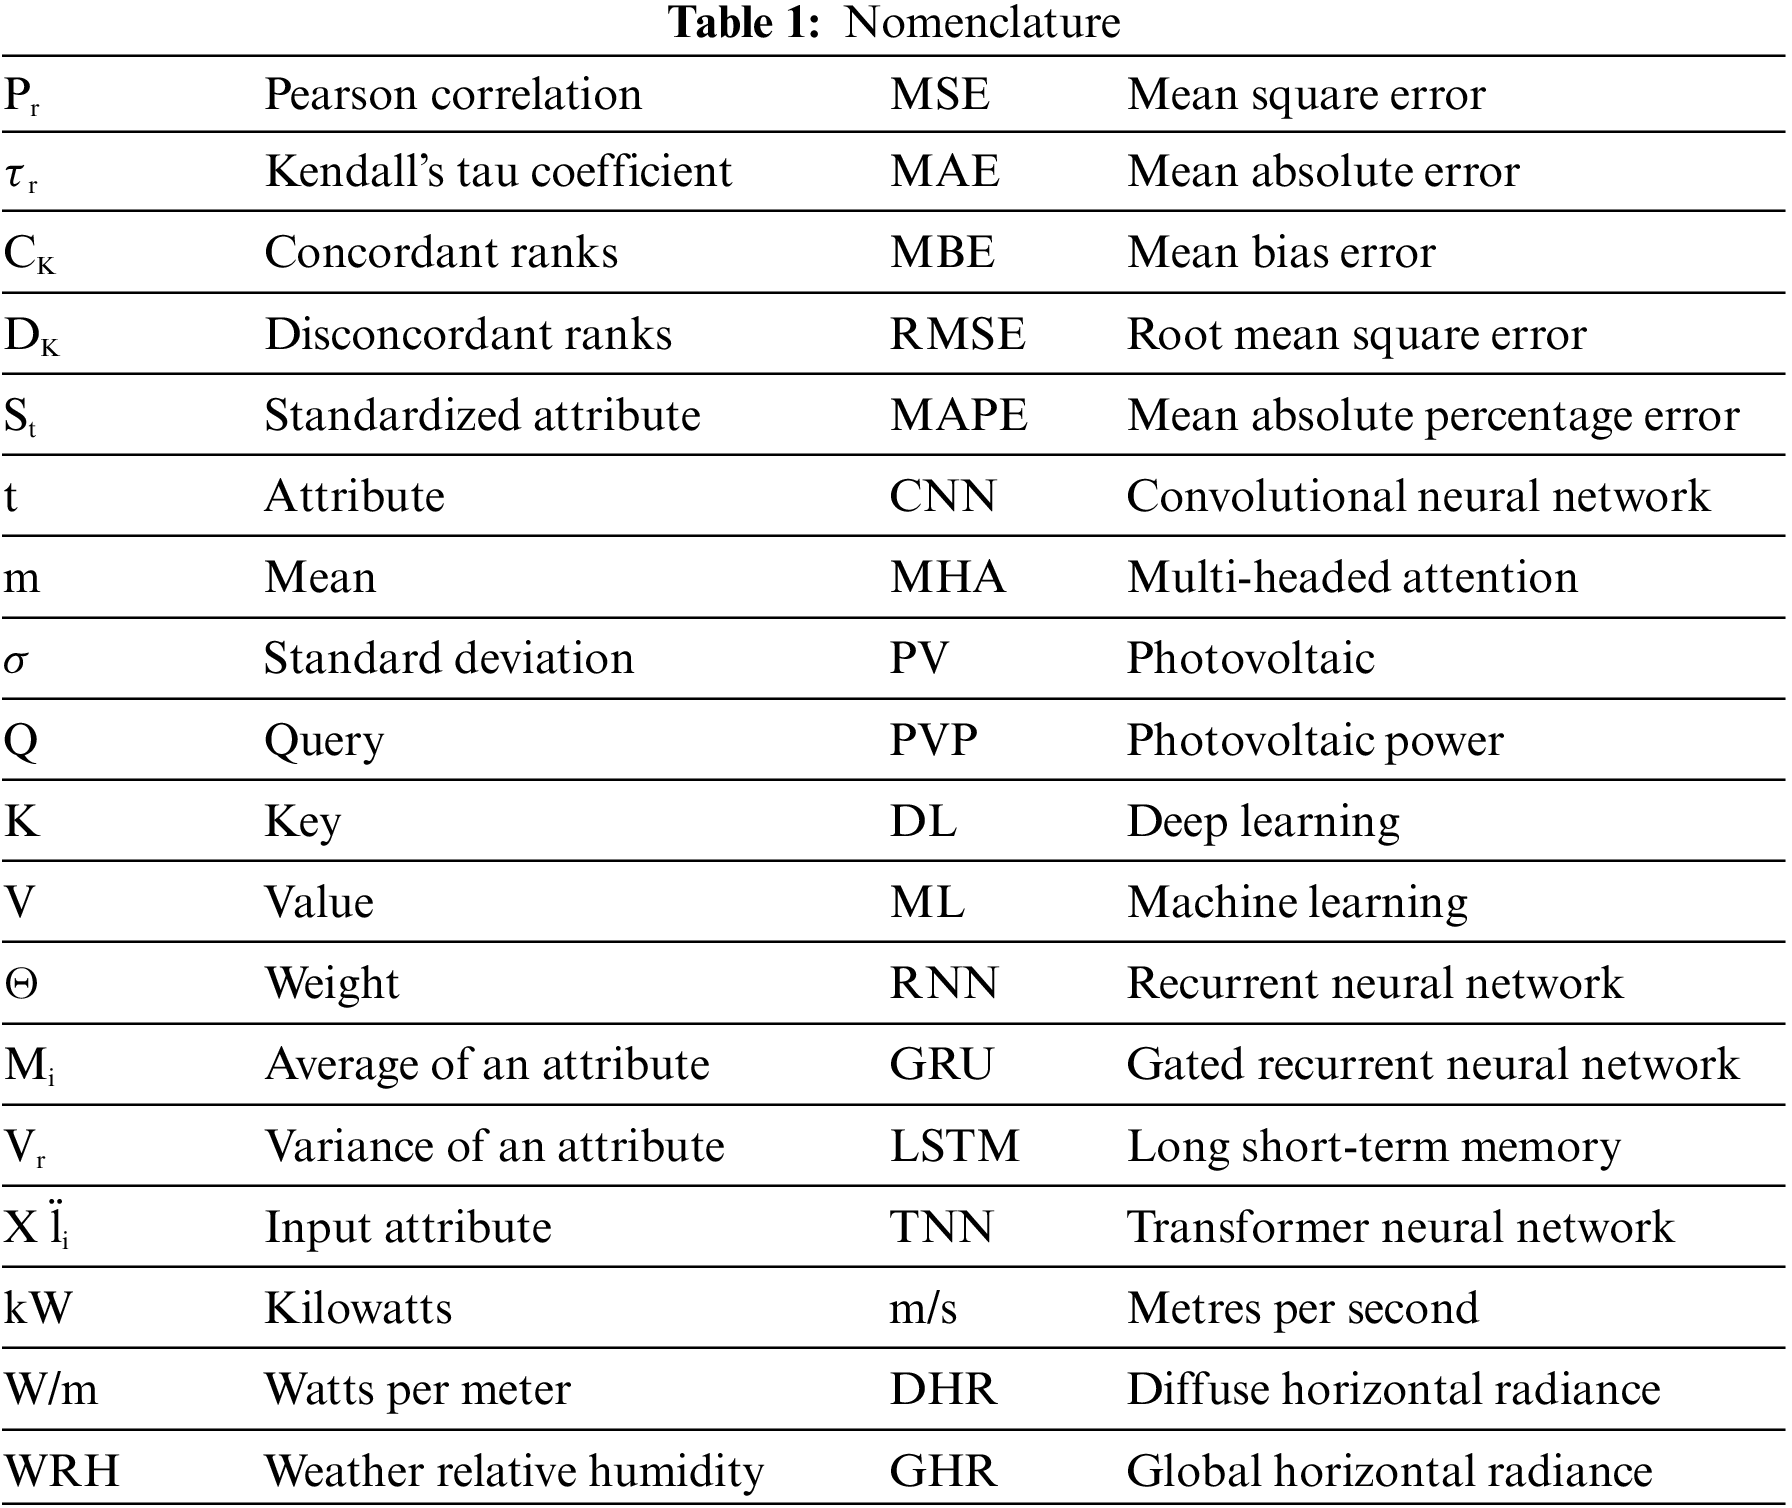
Recently, automatic power forecasting methods have emerged as tools to solve the problem of power management, to mitigate the fluctuating effect of PVP on the entire power system [5]. Furthermore, smart meters and weather prediction devices are now commonly utilized and are playing a significant role in data recording and the development of more trustworthy power forecasting methods. All acronyms used throughout this study defined in the Table 1.
Efficient PV power generation forecasting has a wide range of applications [6–8], for example in PV energy storage systems [9,10], real-time charging of electric vehicles (EVs) [11], and planning of future PV projects [12,13]. Regarding energy storage systems, PVP forecasting is used to improve PV grid operations by precisely estimating future energy demand, carrying out management, and issuing real-time alerts to the departments concerned if required by the storage system [14]. EVs rely on efficient forecasting for effective scheduling of charging to avoid energy shortages. In addition, power management departments around the globe are now planning to launch further projects involving PV plant installation [15,16]; however, these are facing numerous challenges including the nonlinear, complex relationships between PVP generation and weather-related conditions due to global warming. It is therefore highly desirable to find an artificial intelligence (AI)-based model which can efficiently extract more discriminative patterns to overcome the performance, and complexity and can improve the energy supplier system to meet consumer demand.
Recent developments in AI-assisted techniques such as deep learning (DL) and other hybrid models have high learning potential when applied to data with complex and nonlinear associations [17–20]. Several researchers have made contributions by utilizing DL techniques for PV power forecasting [21]. For instance, Wang et al. [22] introduced a hybrid model that combined two different DL modules, in which spatial and temporal features were extracted from meteorological data with the assistance of a CNN and long short-term memory (LSTM). To further improve the performance of PV power forecasting, another hybrid technique developed in [23] combined bi-directional LSTM (Bi-LSTM) with a genetic algorithm (GA) and achieved satisfactory prediction performance. A hybrid mechanism was later developed by Abdel-Basset et al. [24] in which a CNN was incorporated with a gated recurrent unit (GRU) module to extract more discriminative and robust features from the input attributes to minimize the error. Transformer-based models have also been used for various purposes; in the energy domain, these include the model in [25], which was used for multi-energy load forecasting and achieved high efficiency. However, mainstream PV power forecasting techniques are still unable to achieve high levels of efficiency and accuracy.
There are several challenges to achieving accurate, efficient PVP forecasting and modeling. These motivated the contributions of this study. They include the high variability of solar power output due to changing weather conditions, the difficulty of accurately modeling the nonlinear and non-stationary features of PV power generation, and problems with uncertainty quantification in forecasting and inaccuracies in the input data, such as the need for manual calculation of solar irradiance and temperature, which lead to poor forecasting performance. To tackle these problems, sequential network-based PV power forecasting techniques based on a recurrent neural network (RNN), LSTM, or GRU has been applied, although additional flaws and limitations have arisen. For instance, sequential networks are subject to the vanishing gradient problem during sequence processing. Even an LSTM model tries to avoid the vanishing gradient problem using forget and memory gates but fails. Although RNN-based models are good at finding a particular type of distinct correlation that matches their sequential structure however, they ignore associations that do not correspond to this structure. In addition, the intrinsic sequence processing behavior of these models forms a significant obstacle to the parallelization of the training and inference of a model in terms of processing sequential data. Hence, these types of conventional methods are unable to extract various types of relationships that are not only highly dependent on near time stamps but also on the far previous and upcoming samples in the full sequence of data.
To overcome these problems, there is a need for a network that can resolve various problems specifically related to sequential modeling. Researchers have introduced several different approaches, such as skip connection and attention-based methods for instance, a transformer neural network (TNN) model uses a spatial type of attention that focuses on the couplings between features without considering or processing data in a sequential manner. This core ability of a TNN can overcomes the limitations of sequential modeling by replacing it with an attention mechanism that can process data in a parallel fashion. In addition, a TNN has an abstract architecture, strong correlations, lower complexity, and more universal fitting abilities than conventional sequential DL models. Attention-based models have achieved excellent performance in various domains [26] including natural language processing [27], image processing [28], audio analysis [29], and computer vision [30,31]. Similarly, they have been applied to time series data [32–35], including energy data; for instance in [25] used a transformer-based model for multi-energy load forecasting and achieved high efficiency and accuracy. Inspired by these advantages and keeping challenges in consideration in terms of accurate and efficient PVP forecasting, this article proposes a transformer-based network, CT-NET. The network comprises an encoder and decoder blocks. The encoder employs 1D CNN layers to extract spatial features, followed by an MHA to focus attention on the coupling between the most influential features in a sequence of data, resulting in high efficiency and accuracy. The decoder, comprising an MHA and feed-forward dense layer, enables the most accurate and efficient short-term PVP forecasting by considering only the meteorological data of the corresponding PV. Moreover, the proposed model encoder can maintain sufficient nonlinear fitting to adapt to various situations and fluctuations. The core contributions of this work are summarized as follows:
• Existing PVP generation forecasting techniques are sensitive to weather features, resulting incorrect predictions. To reduce the error rate and produce accurate future power generation predictions, we propose an intelligent network CT-NET uses a CNN and a transformer model for short-term solar power generation forecasting.
• Early researchers developed sequential learning models for PVP forecasting purposes that were unable to utilize hardware efficiently due to their complex and sequential mathematical formulation. Another important aspect is that the output sequence relies entirely on the previous timestamp output during the learning procedure. To ensure optimal use of the hardware (at both the training and prediction stages) for PVP forecasting, an attention-based model is proposed that does not require sequential processing of input data for output generation. In addition, such a model can easily be parallelized on multiple cores to speed up the process further and take full advantage of state-of-the-art hardware.
• Recent contributions of researchers to power generation forecasting have focused on either contextual or local features while extracting features from input sequences. In view of this, we integrate a CNN with MHA layers that take into consideration both the local and the contextual discriminative features in a short sequence of PVP data.
• To verify the performance of CT-NET, extensive empirical results are generated using various strategies over PVP data from Eco-Kinetics. In addition, numerous weather analyses are performed to analyze model performance and computational complexity (size and parameters). The proposed method outperforms other state-of-the-art methods, in terms of lower error rates based on the MSE (0.0471), RMSE (0.2167), and MAPE (0.6135). In addition, the final model has the lowest number of parameters (0.0135 M), size (0.106 MB), and inference (2 ms/step).
The rest of the paper is organized as follows: a brief description of related work is provided in Section 2, technical information about the proposed CT-NET is given in Section 3. Section 4 presents comprehensive empirical results generated based on the Eco-Kinetics dataset. Finally, conclusion and future research directions are specified in Section 5.
Substantial research efforts have been made toward efficient and accurate energy management [36] and forecasting based on the categorization of prediction horizons into three types [37]: short, medium, and long-term. Long-term forecasting refers to prediction over the month or year ahead, and is beneficial for long-term management, future decision-making, and the reliable transmission, generation, and distribution of energy to the local smart grid. Medium-term prediction looks forward one week, and facilitates accurate decision-making over this duration, while short-term models consider a range of up to one day or one hour ahead and can support the enhanced and reliable operation of a power management system. PVP forecasting methods can be further narrowed down in terms of the nature of the proposed techniques, based on a classification [38] into the three subcategories of (a) physical, (b) statistical, and (c) AI-based approaches, as discussed below.
2.1 Physical Model-Based Approaches
PVP forecasting methods based on physical models do not require historical data or learnable parameters, as they mainly use physical parameters and predicted weather conditions [6,38]. For instance, in [39] proposed a short-term PV forecasting method for a regional energy distribution grid without considering historical data, by utilizing medium-term forecasts of region-specific irradiance from a European center. Similarly, Wolff et al. [40] developed a model that integrated various factors such as cloud motion vectors and irradiance predictions. Their empirical results were compared with a machine learning (ML) method called support vector regression (SVR), and comparable prediction scores were obtained. Another comparative study exploring input parameters was conducted by Mayer et al. [38], in which 16 PV plants were analyzed to predict short-term PVP based on nine physical parameters. The authors concluded that irradiance transposition and separation were the two most influential factors affecting PVP generation forecasts.
2.2 Statistical and Machine-Learning-Based Approaches
Unlike a physical model, a statistical forecasting model relies on high-quality historical data and pure mathematical formulations to find patterns and correlations among the given input data and output parameters, such as PV power forecasting from irradiance data [41]. Statistical methods may be based on traditional or ML models, including regression methods (RMs) [42], autoregressive integrated moving average (ARIMA) [41,43], extreme learning machine (ELM) [44], autoregressive moving average (ARMA) [45], SVR and random forest regressor (RFR) [33]. Statistical models can give more accurate performance than physical models, as they use historical data and learned weights to forecast PVP [46]. The authors of [47] developed a method based on a combination of ANN and analog ensemble (AnEn) models, in which ANN and AnEn were used both individually and together for PVP forecasting from weather conditions for solar power plants in Italy. The results showed that a combination of ANN and AnEn outperformed both single models. However, these authors evaluated their technique on synthetic data, which is not considered a good approach. The methods discussed above have several limitations; for example, they are unable to extract meaningful deep features since most of them process direct numerical data rather than carrying out end-to-end feature extraction and predict output values by computing pattern similarities.
Several researchers have applied DL techniques for PVP forecasting; for instance, intending to improve the performance of PVP forecasting, a hybrid technique was developed by Zhen et al. [23] Most studies have used traditional sequential models such as LSTM or Bi-LSTM to extract patterns from a sequence of dependent features and to predict PVP, with satisfactory results. For instance, in [22], the authors presented a network based on a combination of LSTM and CNN, in which the CNN module was used to learn temporal patterns and LSTM to extract temporal features. It was shown that the forecasting accuracy of their hybrid model was better than that of a single model. Similarly, Zhen et al. [23] developed a hybrid network consisting of Bi-LSTM followed by a GA that achieved a low error rate. Another novel network called PV-Net was developed by Abdel-Basset et al. [24] for short-term PVP forecasting, in which GRU was used to extract sequential patterns from the input data, and these authors reported convincing accuracy. Recently, popular generation models called generative adversarial networks (GANs) have been developed and used to tackle the problem of sample shortage in data. GANs apply a generation and discrimination strategy via self-learning to generate new patterns that are similar to those in the data sample and have the same characteristics [48]. GANs have also been used by researchers to predict PVP; for instance, Wei et al. [49] used a variant of a GAN to learn local and temporal features from input data for PVP generation forecasting, and their network showed improved efficiency for power management systems. For higher performance, Wang et al. [48] designed a climatic condition classification model based on a GAN and a CNN, and the performance of the proposed model indicated that it could generate new data samples by observing only the initial samples. In [50], the authors proposed a cascade DL framework for day-ahead PVP forecasting. They combined both numerical weather observations and numerical weather prediction modules into one method, which was called cascaded multi-fidelity DL (CMF-DL). Their method consisted of two DL models, CMF-LSTM and CMF-GRU and achieved convincing performance compared to basic LSTM or GRU models. However, this approach is resource-hungry and computationally expensive, making it unable to provide a response in real time for real-world grids.
Existing approaches have many limitations: physical models are unable to deal with dynamic conditions, while statistical and machine learning models mostly rely on the use of hand-crafted features and cannot extract robust patterns from real scenarios. In addition, DL models such as advanced GANs also have disadvantages, such as their high computational complexity and the huge amounts of data needed to train them to produce accurate data samples [51]. Hence, these models are not recommended for use in critical conditions, for instance in energy management for residential and industrial areas. In addition, GANs are not able to learn sequential patterns, making it necessary to attach a sequential model such as LSTM, RNN, or GRU to learn sequential patterns [52]. However, these sequential models follow a complex sequential mathematical formulation, meaning that sequential vanishing and gradient problems occur frequently. These types of models are also unable to carry out parallel processing due to their inherited sequential formulations.
These drawbacks have been overcome by the introducing of different approaches such as skip connection and attention-based methods. Recently, transformer models have yielded excellent performance [26] in various AI domains such as natural language processing [27], image processing [28], audio analysis [29], computer vision [30,31], and time series data [32–35]. These TNN models use a spatial type of attention that focuses on certain features without the need to consider or process data in sequence [53]. The nature of a TNN overcomes the limitations of the sequential model by replacing it with an attention mechanism that can process data in a parallel fashion. A TNN, therefore, has a comparatively abstract architecture, strong correlations, less complexity, and greater generalisability than other DL models such as LSTM and RNNs and has the potential to achieve efficient and accurate results for PV power forecasting.
3 Proposed Novel Convolutional Transformer-Based Method
Efficient and accurate PV power prediction is a challenging task for smart grids. A variety of methods exist in the literature for the management of power forecasting problems through conventional ML and modern DL techniques. ML methods such as SVR and RFR are unable to extract complex hidden features among the input sequence as they rely on handcrafted or direct numerical features. DL models such as sequential models are computationally expensive, and their performance is affected by memory loss and vanishing gradient problems arising from their internal complex mathematical formulations. In contrast, a convolutional TNN-based architecture has a strong ability to extract deep features via a learning-based feature extraction using a CNN and then feeds these to the attention module to learn the attention-based coupling among the extracted features. The proposed method can learn the hidden relationships in the input sequence in parallel, without the need to process the data sequentially, which makes the entire model efficient in terms of processing. The structure of CT-NET is presented in Fig. 1, and the details of each module are explained in the following sections.
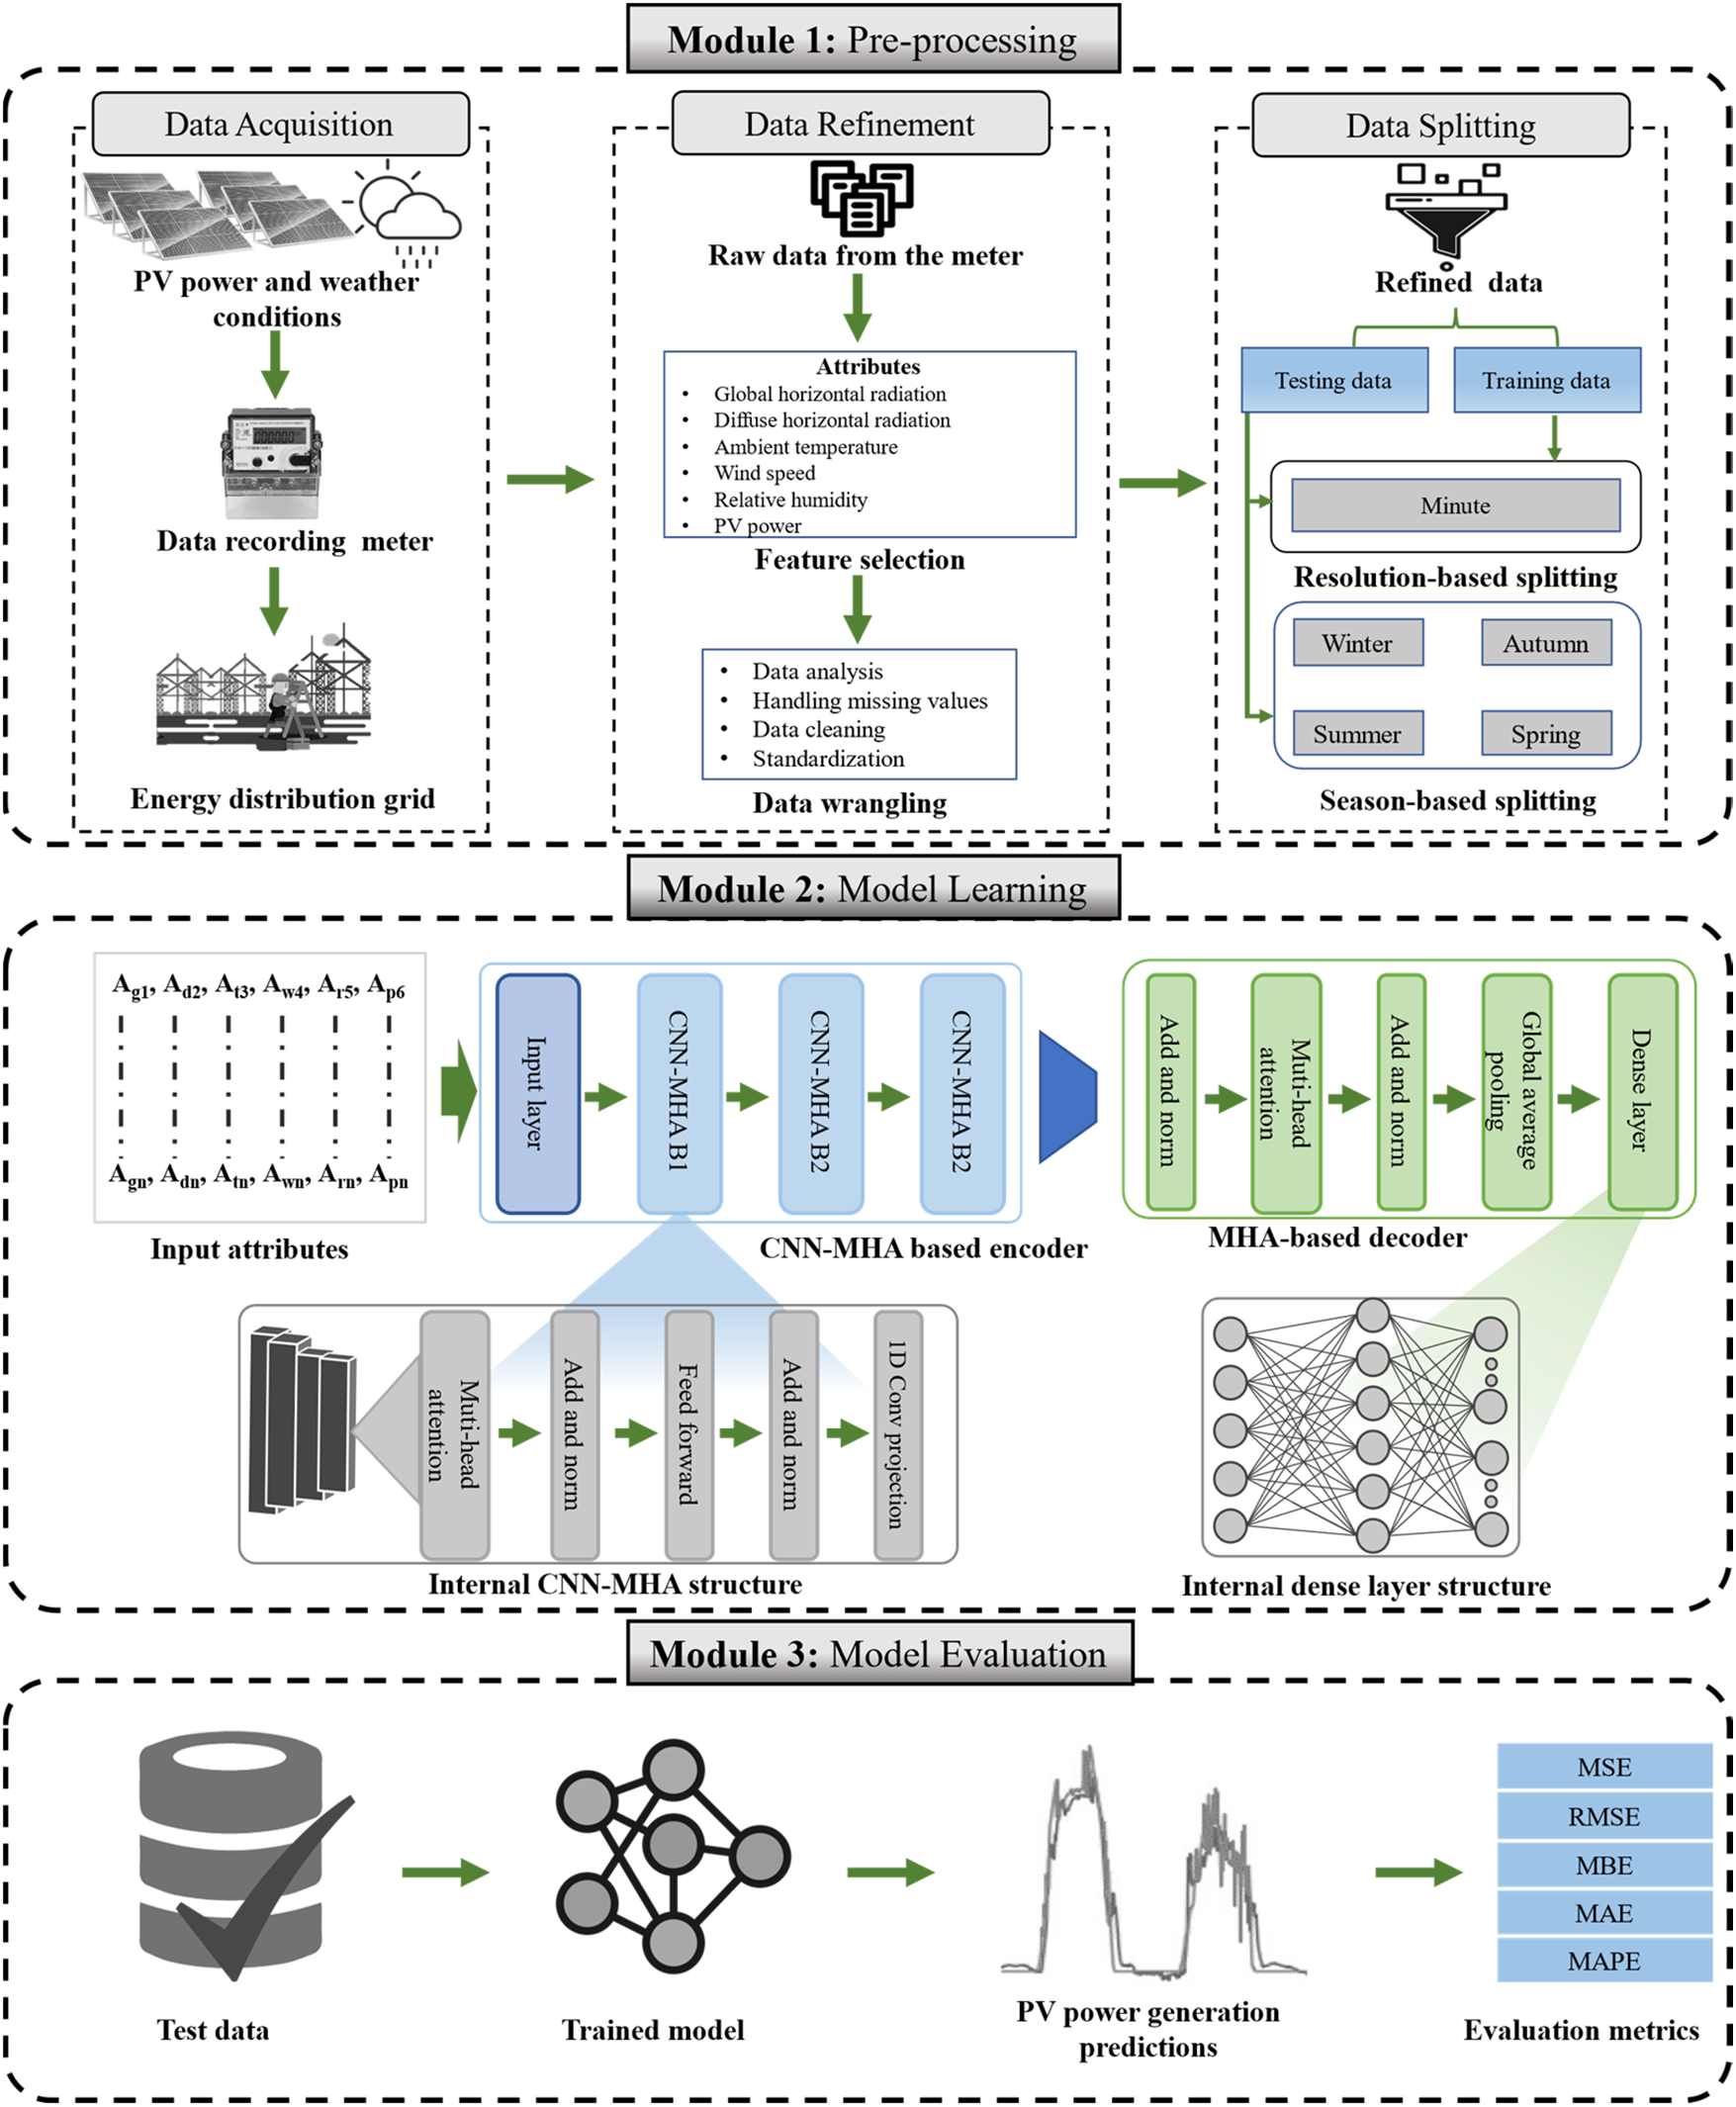
Figure 1: Structure of the proposed CT-NET is composed of three modules: (i) data preparation including data acquisition, pre-processing, and splitting; (ii) model learning based on an encoder and decoder; (iii) evaluation of testing data
3.1 Data Acquisition and Pre-Processing
In this subsection, the data acquisition and pre-processing steps are briefly explained. PV power has a strong direct relationship with weather conditions such as temperature, wind speed, and strength of irradiance. In this work, we consider power generation data collected from a PV system called DKASC in Alice Springs, Australia. More details about the attributes of the dataset are provided in the results section. These data are passed through certain stages, including attribute refinement and selection, to enable smooth training of the proposed network based on only those weather attributes which have a direct or inverse relation to some extent with PVP. Although the actual data have many attributes, in this study we considered PVP, wind speed, weather temperature, weather relative humidity (WRH), global horizontal radiation (GHR), and DHR, among others. After measuring different types of linear (Pearson’s) and monotonic (Kendall’s) correlation coefficients, two standard methods were used to find an accurate relationship between the input and output variables. Pearson and Kendall’s coefficients were calculated using Eqs. (1) and (2), respectively, where Pr, xi,
Values between one and −1 represent some correlation between the input variables and the ultimate output variable. To improve the selection of input attributes, we calculate the average of both correlation coefficients and select the ranges [0.35, 1] for positive and [−1, −0.35] for inverse relationships. The refined input attributes and their correlations based on these criteria are given in Table 2.
The selected attributes are then forwarded to another pre-processing step to address the problem of missing values. As it is well-known that no power is generated by PV panels at night, zero values should be recorded during this period, and these are therefore filled with zeros. The problem of missing values during the day is tackled using a moving average technique. Furthermore, to avoid the huge differences between recorded values that occur due to uncertain weather, a standardization method is applied. In this study, the standard scalar approach is used, as shown in Eq. (3), where t represents an input attribute, and m and σ denote the average value and standard deviation of this attribute, respectively. The original and refined data for several input attributes are shown in Fig. 2.
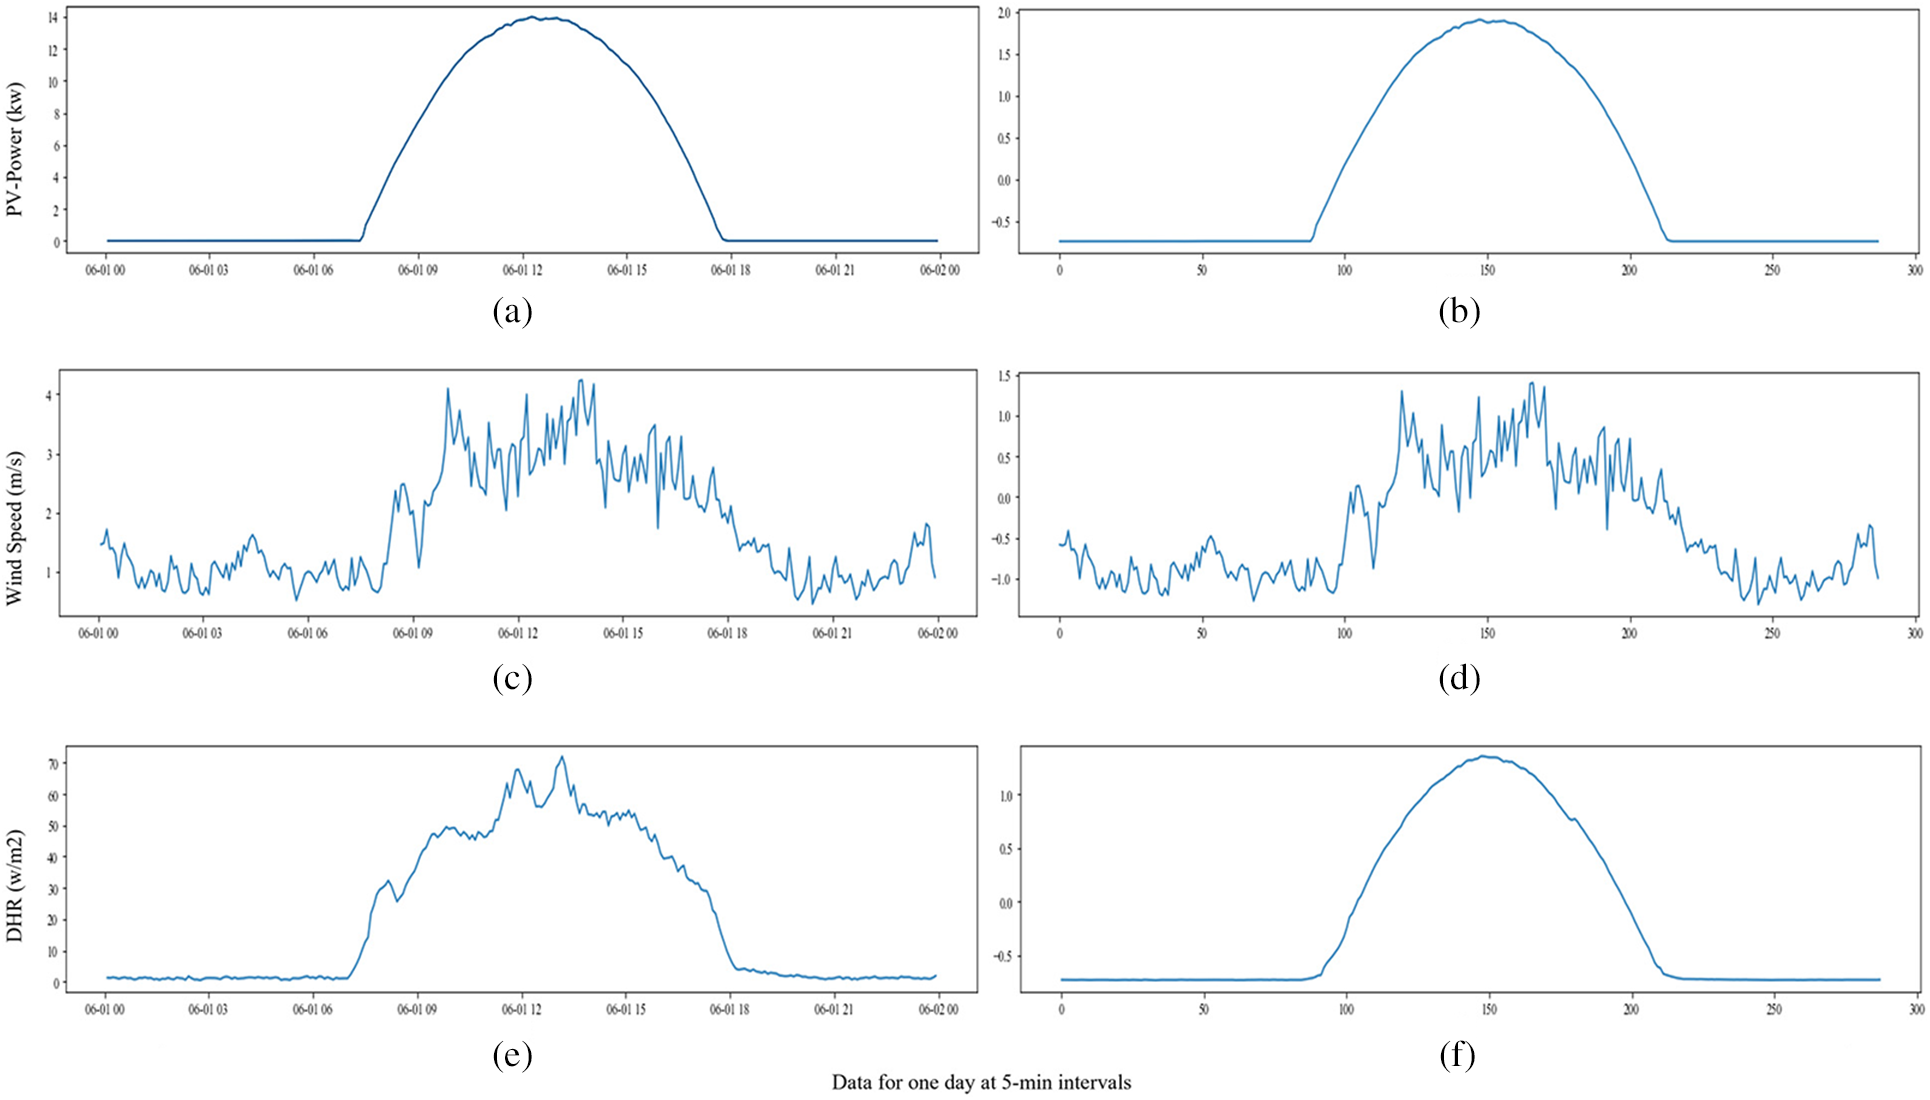
Figure 2: Graphs of original and subsequent standardized attribute values: (a), (c), (e) show original data, (b), (d), (f) show standardized graphs for PV power, wind speed, and diffused horizontal attributes, respectively, for one day (data sampled at 5-min intervals)
Furthermore, to facilitate the training and evaluation schemes, the acquired data are pre-processed to create features and labels for the supervised training of the model. This is done by splitting the data into chunks of 12 consecutive records, each representing a one-hour duration with data sampled at 5 min intervals. The label for each one-hour chunk of data is the value of the PVP for the next hour. The data are then split using a 50:50 ratio for training and testing purposes. The model is trained by providing it pre-processed data containing sequences where each sequence is one hour long. The performance of the model is then evaluated on the testing data using the same method. Additional details of the training and evaluation steps can be found in the results section.
In this subsection, we discuss the technical details of the two most significant components that play a key role in power generation forecasting. In the literature, researchers have used various sequential models (RNN, LSTM, and GRU) and conventional models for time series data prediction. An RNN has certain problems, as it uses an internal inherited mathematical sequential formulation where a time stamp waits for the output of the previous time stamp before further processing is started. This type of model is unable to carry out parallel processing and cannot exploit the full potential of powerful modern GPUs. In addition, a sequential learning model has memory loss and is subject to vanishing and exploding gradient problems. Sequential and CNN-based models are also unable to extract global and local attention from input values simultaneously. In this study, we propose CT-NET, a variant of the standard transformer with multiple stacked encoder layers that includes a CNN module. This CNN sub-module is used to extract local features, while MHA is applied to find global attention features. The MHA-based encoder and decoder are shown in Fig. 3.
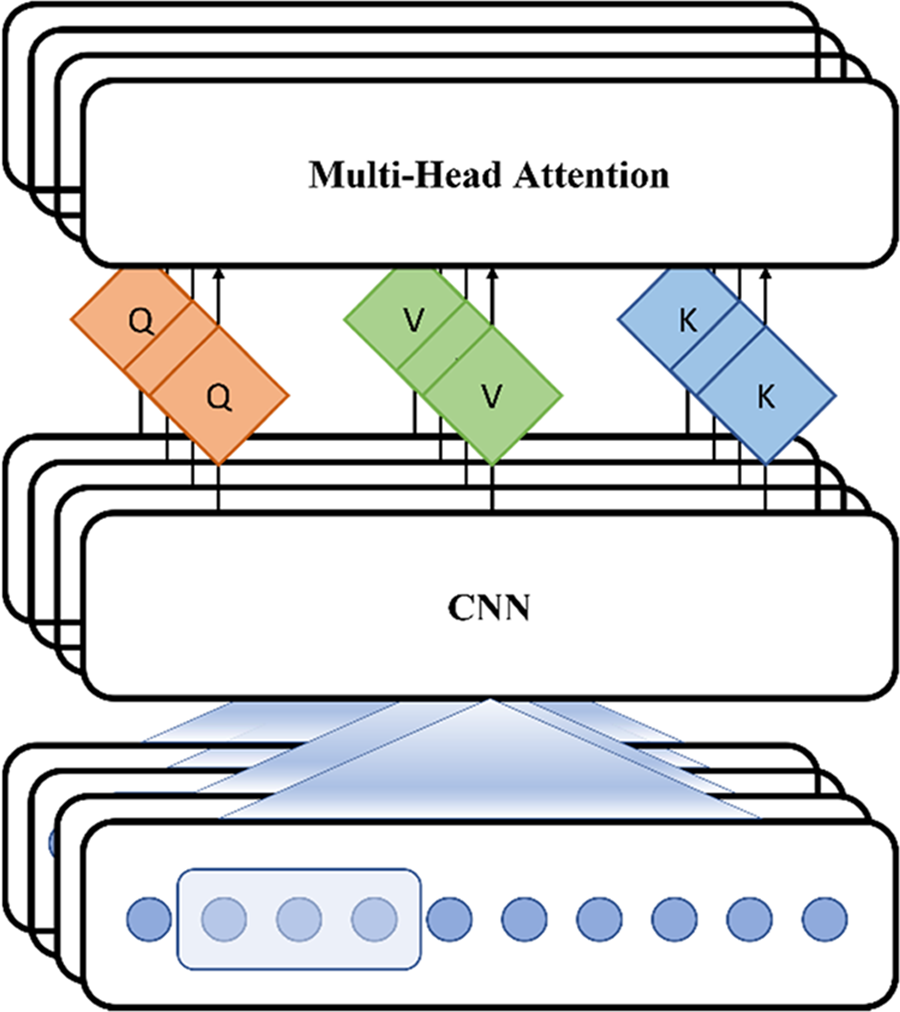
Figure 3: Structure of the encoder, based on an integrated version of CNN and a multi-head attention module
The encoder module intelligently encodes the input meteorological attributes discussed in the data acquisition and pre-processing subsection. As shown in Fig. 1, the encoder includes multiple CNN-MHA blocks, each of which contains identical modules including CNN layers, MHA, skip connections, normalization, and feedforward layers. The mechanism of operation of a CNN with an MHA layer is shown in Fig. 3, where three consecutive one-dimensional convolutional neural networks (1DCNN) layers are combined to extract deep spatial features. Finally, a projection of 1DCNN layers is utilized with 12 filters, each with a size of (
Fig. 4 shows that the encoder module consists of many skip connections and normalization layers. The skip connection layer is used to avoid the vanishing gradient problem via simple mathematical addition of the actual input values of sequence attributes with the output matrix from the MHA. Normalization is applied to scale the residual output to avoid fluctuations in the learning process.
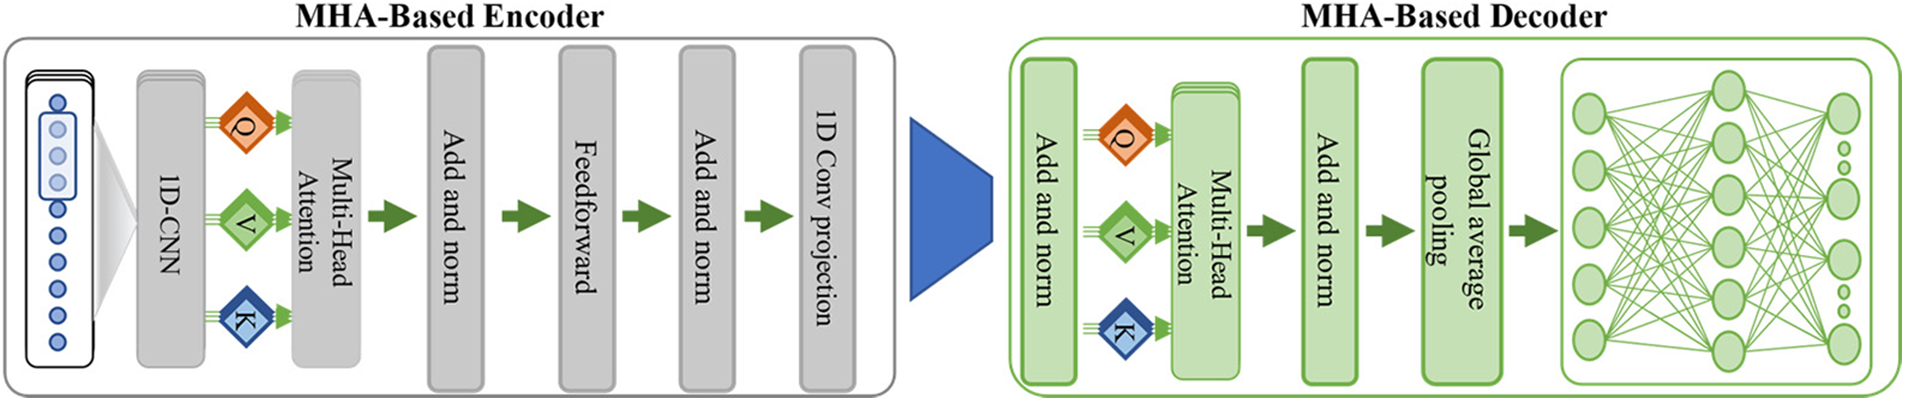
Figure 4: Structure of the proposed encoder and decoder modules
The mathematical formulae applied in the normalization layers are shown in Eqs. (8) and (9), where Mi and Vr denote the mean and variance of sample Xi. Each sample is then converted to a mean of one and a variance of zero by using Eq. (10), where the epsilon term ε is used to avoid the zero denominator condition.
Finally, the normalized version of the output
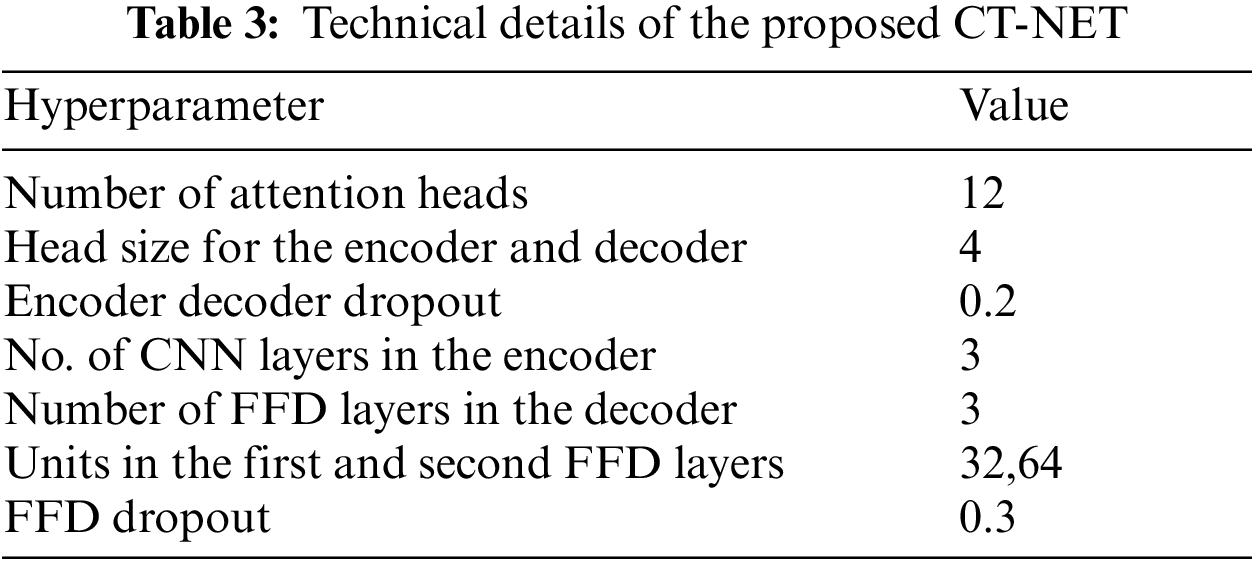
The decoder module of the proposed CT-NET also consists of multiple components, as shown in Fig. 1. It includes the MHA layer, as briefly described in the encoder section, except that in this case, the encoded features are given as input instead of the original input attributes. So, the encoder’s last layer CNN-projection becomes Q, K, and V for the decoder. Following this, global average pooling (GAP) is applied to calculate the average of all the concatenated heads of the MHA layer and to create a vector to pass to the feedforward dense (FFD) layers for final forecasting. In the decoder, three FFD layers are used, which are input, output, and hidden layers. The decoding module does not use the concept of natural language processing for decoding, but instantly predicts a full sequence of values for one hour, with a five-minute time resolution. A factorial representation of the decoder is shown in Fig. 4, and the details of the layers and hyperparameters of the model are given in Table 3.
In this section, we briefly discuss the implementation details and the system configuration and present a comprehensive set of empirical results. For ease of understanding, this section is divided into four subsections covering the experimental settings, the data exploration stage, the evaluation metrics used, and the ablation studies. The performance of the proposed CT-NET model is evaluated from several perspectives and is compared with recent state-of-the-art models. Finally, a computational complexity analysis is conducted based on various hybrid models.
All of the experiments were carried out on a computer with the Windows operating system, equipped with a GeForce RTX 2080 Ti GPU, an Intel(R) Core(TM) i9–900KFCPU, and 64 GB onboard memory. The model was developed in Python (version 3.7.13) and the TensorFlow-GPU (2.1.0) with the front end of the Keras-GPU (2.3.1) library. To select optimal values for the hyperparameters, extensive experiments were conducted, and we finally set the learning rate to 0.0001, the batch size to 128, and the epochs for training to 100.
4.2 Description of the Dataset
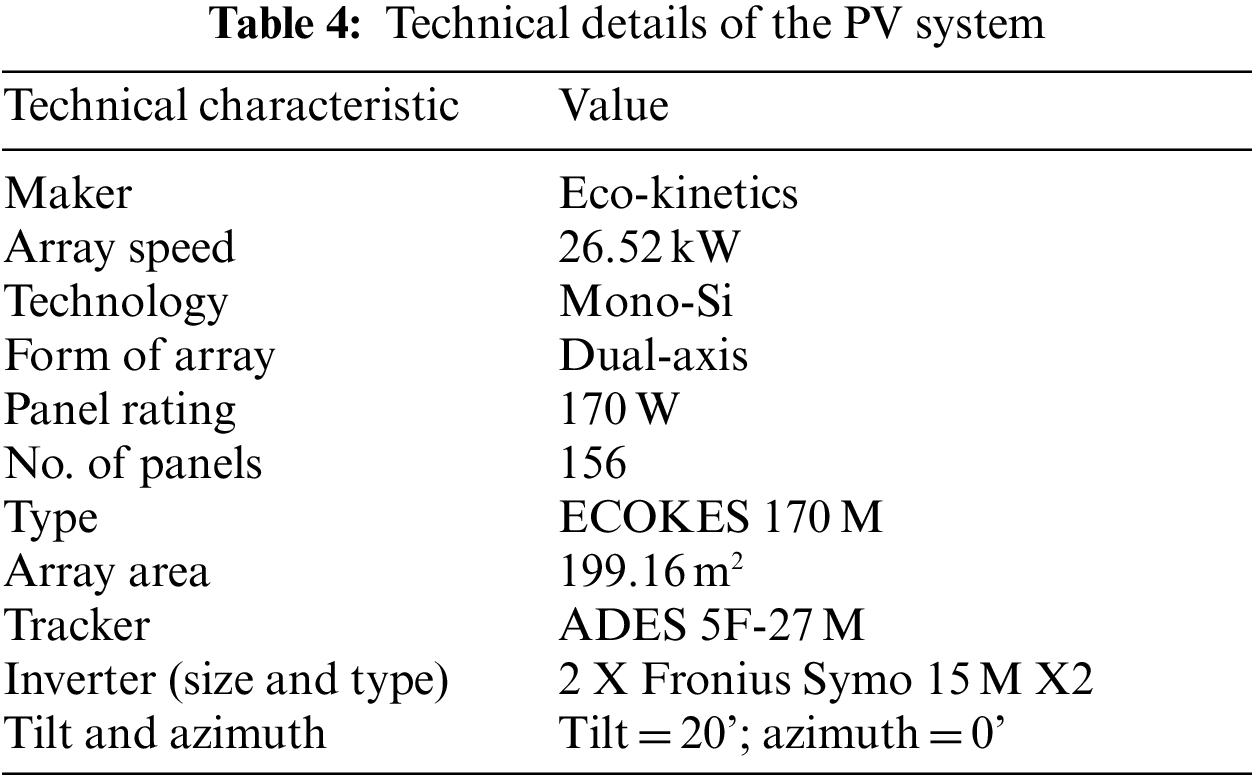
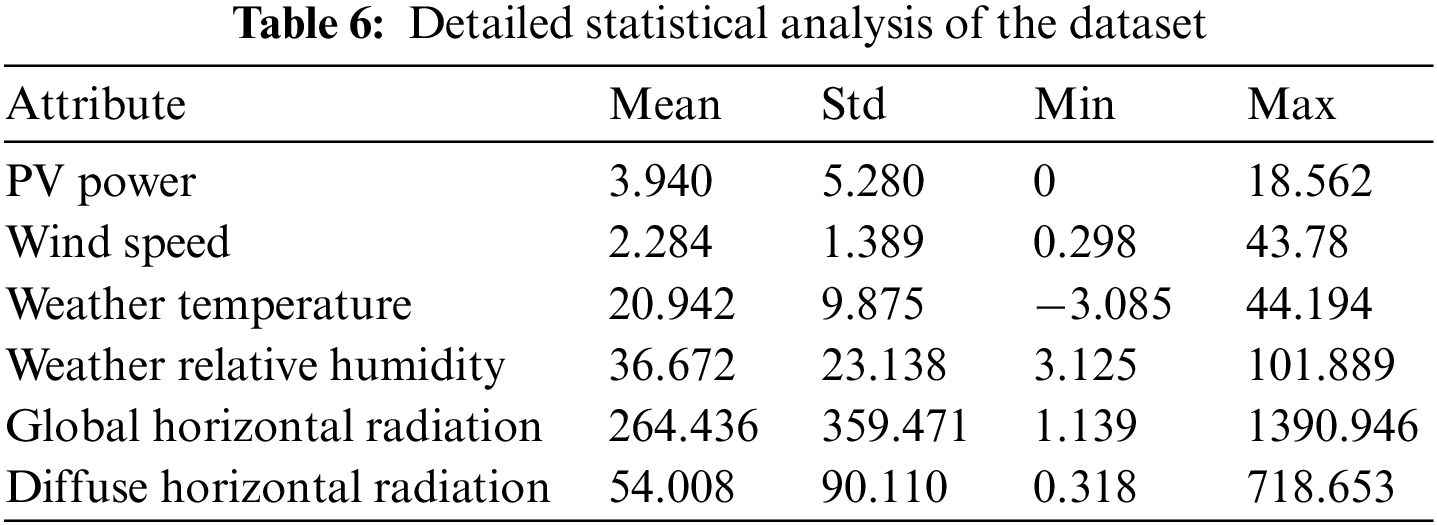
To evaluate the proposed CT-NET model, we used a publicly available actual PV power generation dataset, which was collected by the authors of [54] from an Australian PV system called DKASC in Alice Springs. The data were sampled at an interval of 5 min, between 2010 and 2017, from a PV system made by Eco-Kinetics with a capacity of 26.5 kW. The technical details of the system are given in Table 4, and the attributes of the data are summarised in Table 5. The actual dataset has various problems, including inaccurate and missing values recording, and we, therefore, selected data from two years that were relatively complete and included all four seasons (winter, spring, summer, and autumn). For training, we used data covering a total duration of one year (1st June 2014 to 31st May 2015), while for testing, we used data from the following year (1st June 2015 to 12th June 2016). The results of a statistical analysis of the selected data are provided in Table 6.
The proposed CT-NET model was evaluated based on various error metrics that are commonly used for forecasting-related tasks [36], such as the MSE in Eq. (12), MAE in Eq. (13), MBE in Eq. (14), RMSE in Eq. (15), and MAPE in Eq. (16). The MSE, MAE, and RMSE represent the difference between the predicted and actual values, while the MAPE and MBE represent the percentage of false predictions and the direction of the deviation of the predicted graph as compared with the actual graph. In Eqs. (12) to (16),
In this section, we discuss the experimental results and carry out a comparative analysis by considering baseline models and state-of-the-art methods from various perspectives. Finally, an analysis of the computational complexity of the models is conducted to estimate the feasibility of using the proposed model in a real grid.
Ablation Study
To create an ultimately robust model, a study of the model was performed in which various combinations of encoder blocks, attention heads, and convolution layers were analyzed as shown in Table 7. It can be observed that increasing the number of the encoder and convolutional layers had a direct, positive impact on the ultimate performance of CT-NET. After conducting extensive experiments, we selected three encoder blocks for the model architecture, followed by four attention heads and three convolutional layers. This arrangement gave the lowest RMSE (0.2035) of all the attempts.

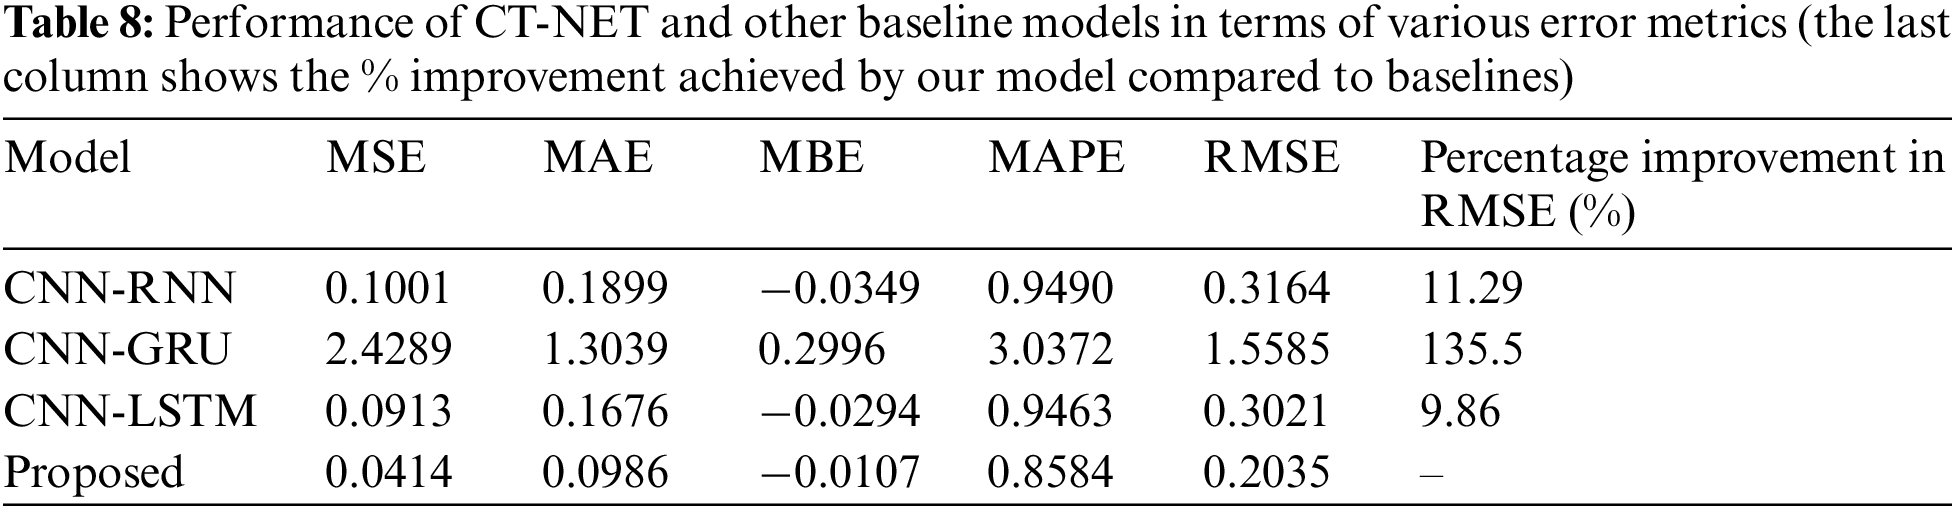
For further evaluation of the proposed CT-NET model, a comparative study with baseline models has been conducted that included variations of sequential models with the addition of CNN encoders to explore their effects on the sequential models. For this study, we considered three sequential models: RNN, GRU, and LSTM. The performance of each model in terms of errors is shown in Table 8, and we can see that CT-NET achieved the highest performance in terms of the lowest RMSE (0.2035), MAPE (0.8584), MAE (0.0986), and MSE (0.0414). For better understanding, the performance of the proposed model is compared to each of the other models in terms of %RMSE, as shown in the last column of Table 8. These results show that the proposed model outperformed the other models on the testing dataset. The CNN-RNN had the highest error score, which may be due to memory loss and other factors such as vanishing and exploding gradient problems. The key aspect that is responsible for the satisfactory results from the proposed model is the integration of CNN with attention mechanisms that avoid the vanishing gradient problem through the use of skip connections in the architecture.
The real-time performance of these models on the testing data is shown in Fig. 5. We can see that the proposed model achieved greater stability both during the day and at night, and the lowest rates of error between the actual values and the model predictions. The other models are both less stable and less accurate. Furthermore, we know that the power generated at night is zero, but these models still predict values other than zero (mostly between zero and one). The basic reason for this is that the actual data used for training contain some exceedingly small values for PVP, and the reason for this is not disclosed by the providers. The weights of the final models are influenced by these values, and hence all of the models predict some non-zero values. However, the proposed model is still more stable and accurate than the alternative models.
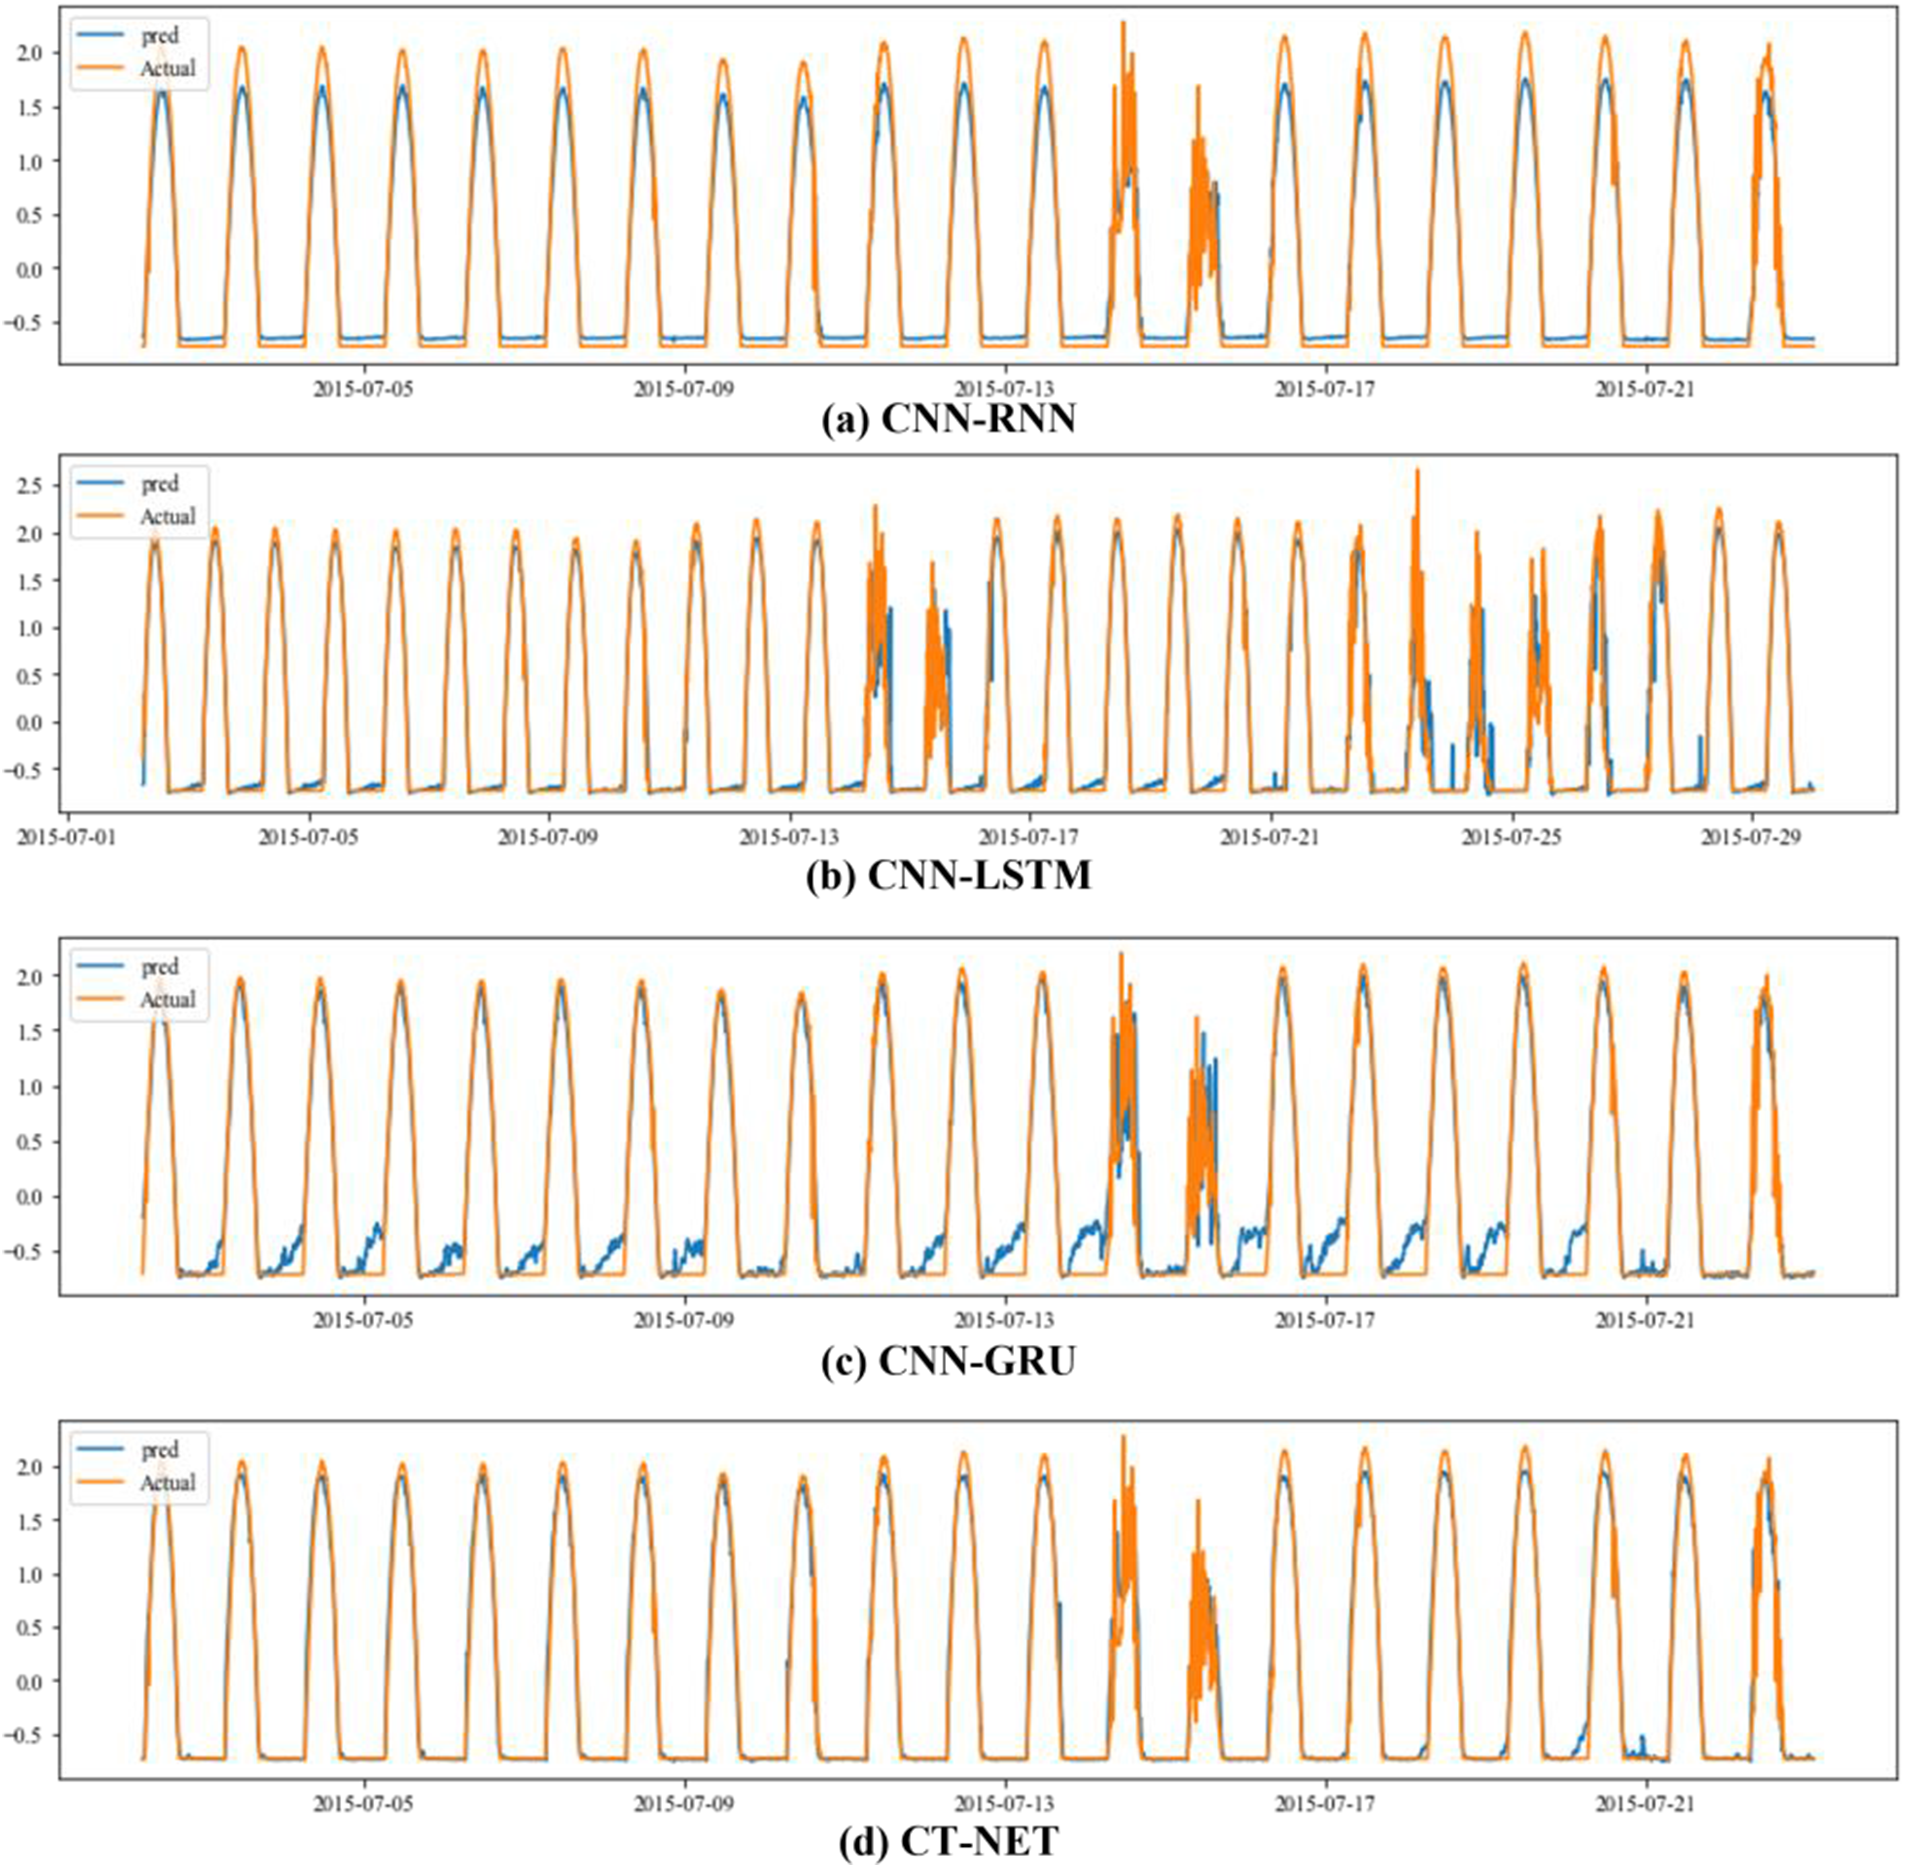
Figure 5: Actual and predicted values for PV power for day and night operation, from an evaluation of the CNN-RNN, CNN-LSTM, and CNN-GRU models and the proposed CT-NET on the test data
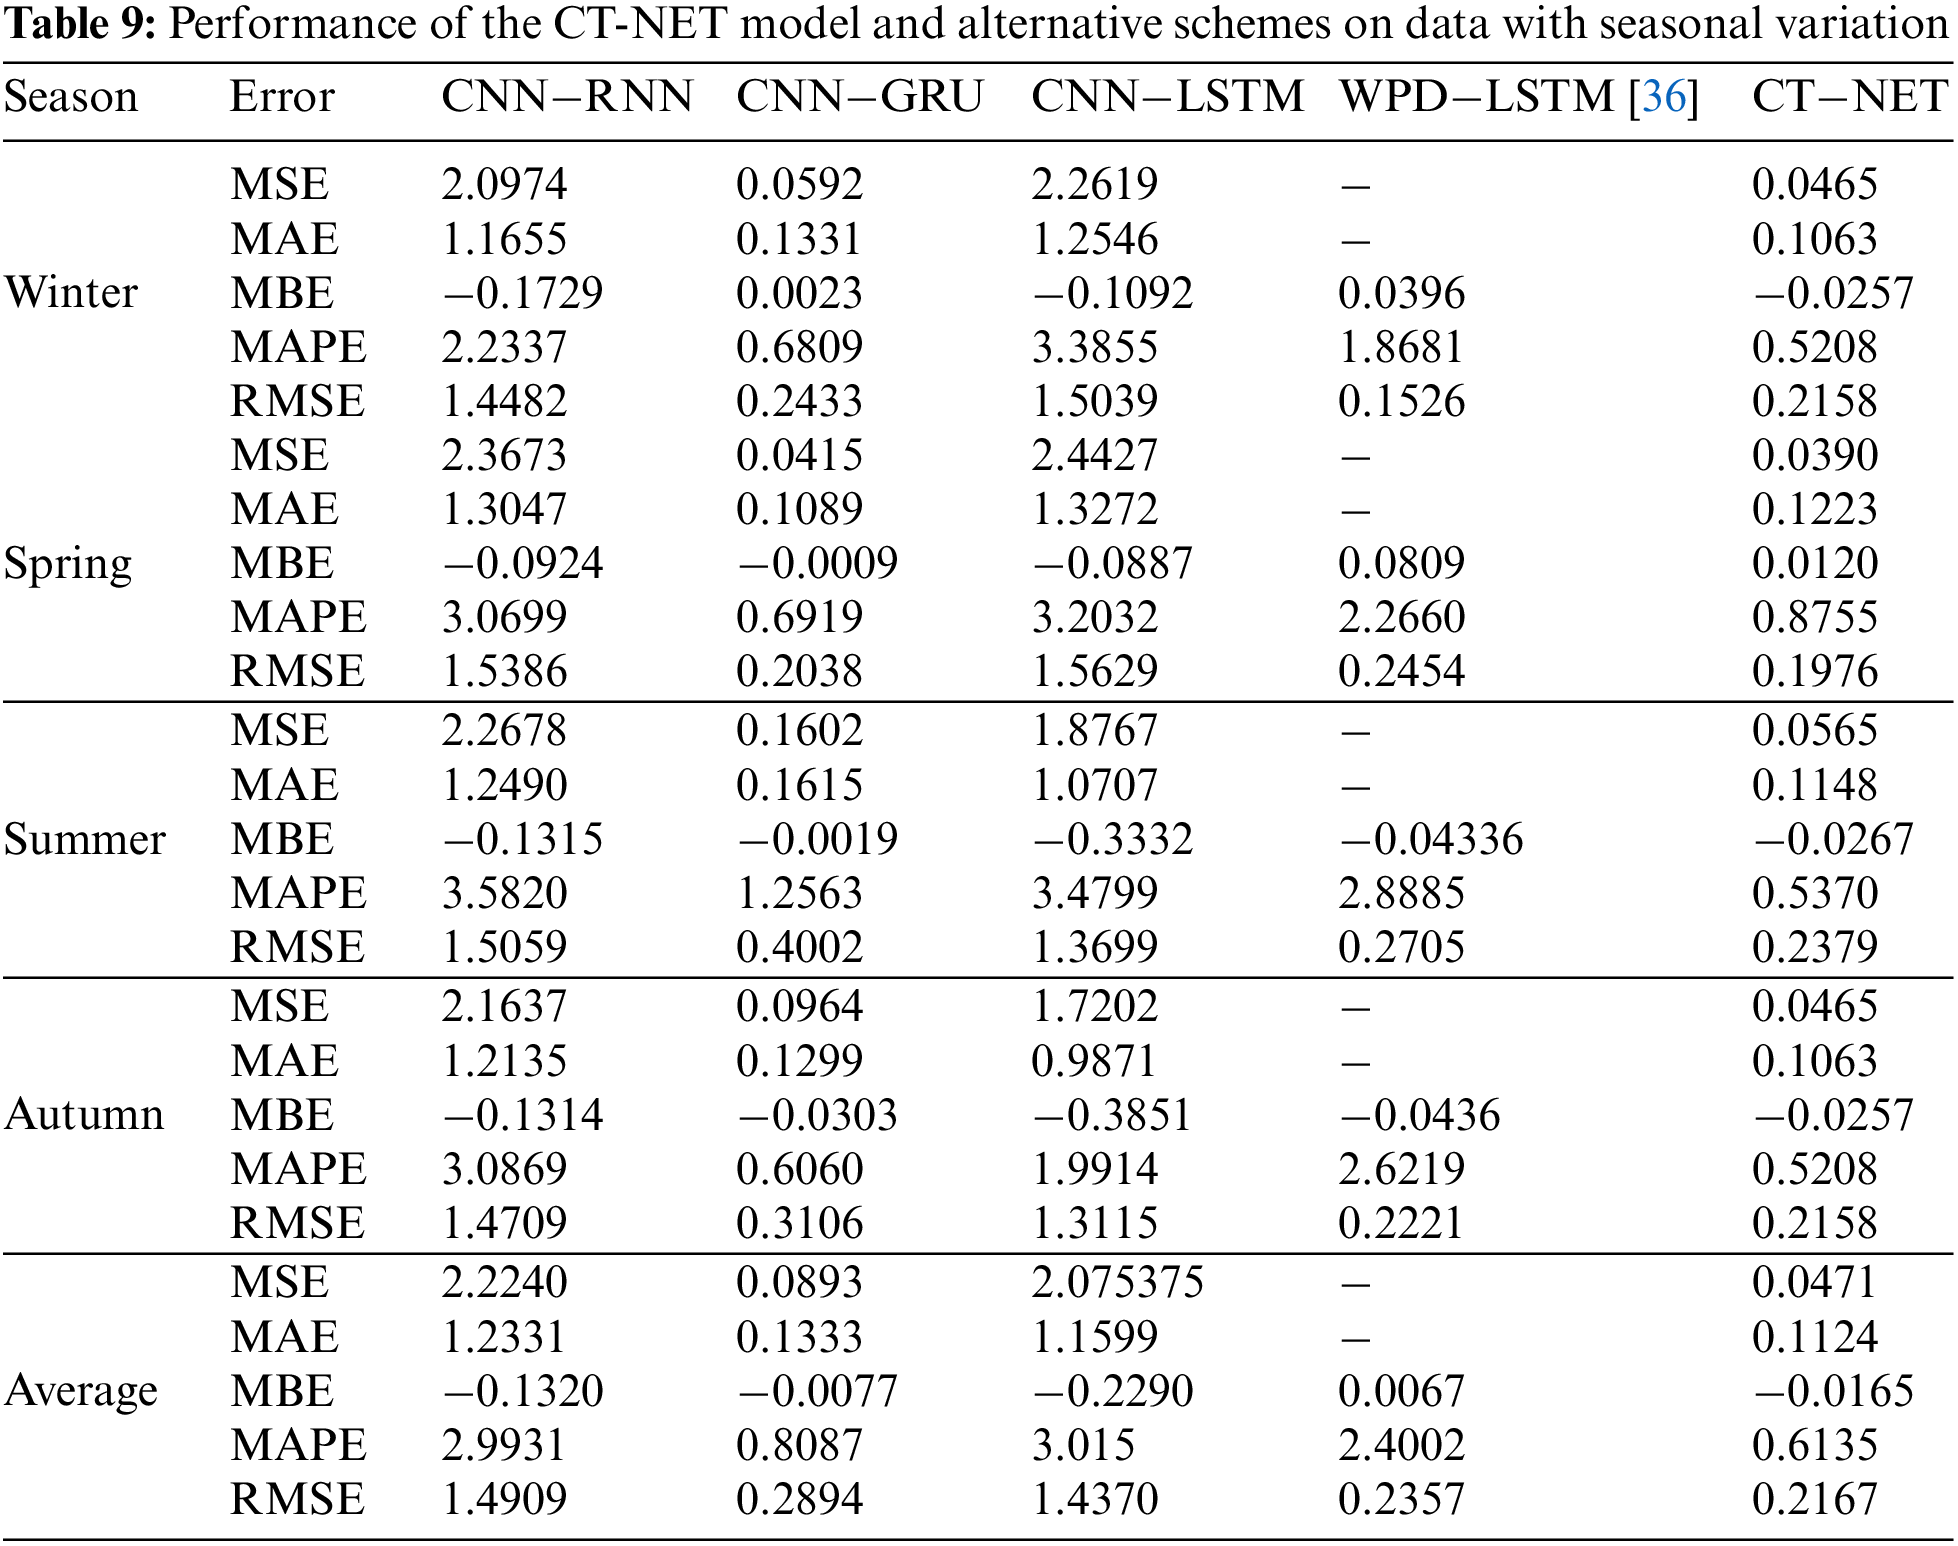
To carry out a further evaluation, we assessed the performance of the trained models on test data representing different seasons, to explore the effects of seasonal variations on the proposed CT-NET. For this evaluation, we considered a further state-of-the-art model called WPD-LSTM in addition to the other baseline models mentioned above. The results for the errors for the various seasons are given in Table 9, and it can be observed that the proposed model gave a better average performance in terms of RMSE, MAPE, MSE, and MAE. A value of 0.2167 was achieved for the RMSE, almost 0.023 lower than the next-best model. The proposed model also gave an average value of 0.6135 for the MAPE, which was better than the other state-of-the-art approaches. We can conclude that the proposed model is the best choice for accurate and stable PVP predictions. We also considered data from days with different weather conditions and plotted the results from the model in comparison to the actual values and the results from the other baseline models.
The overall results for these weather conditions are presented in Fig. 6. It can be seen that the proposed model achieves stable, accurate results under all conditions, including rainy, cloudy, and sunny days.
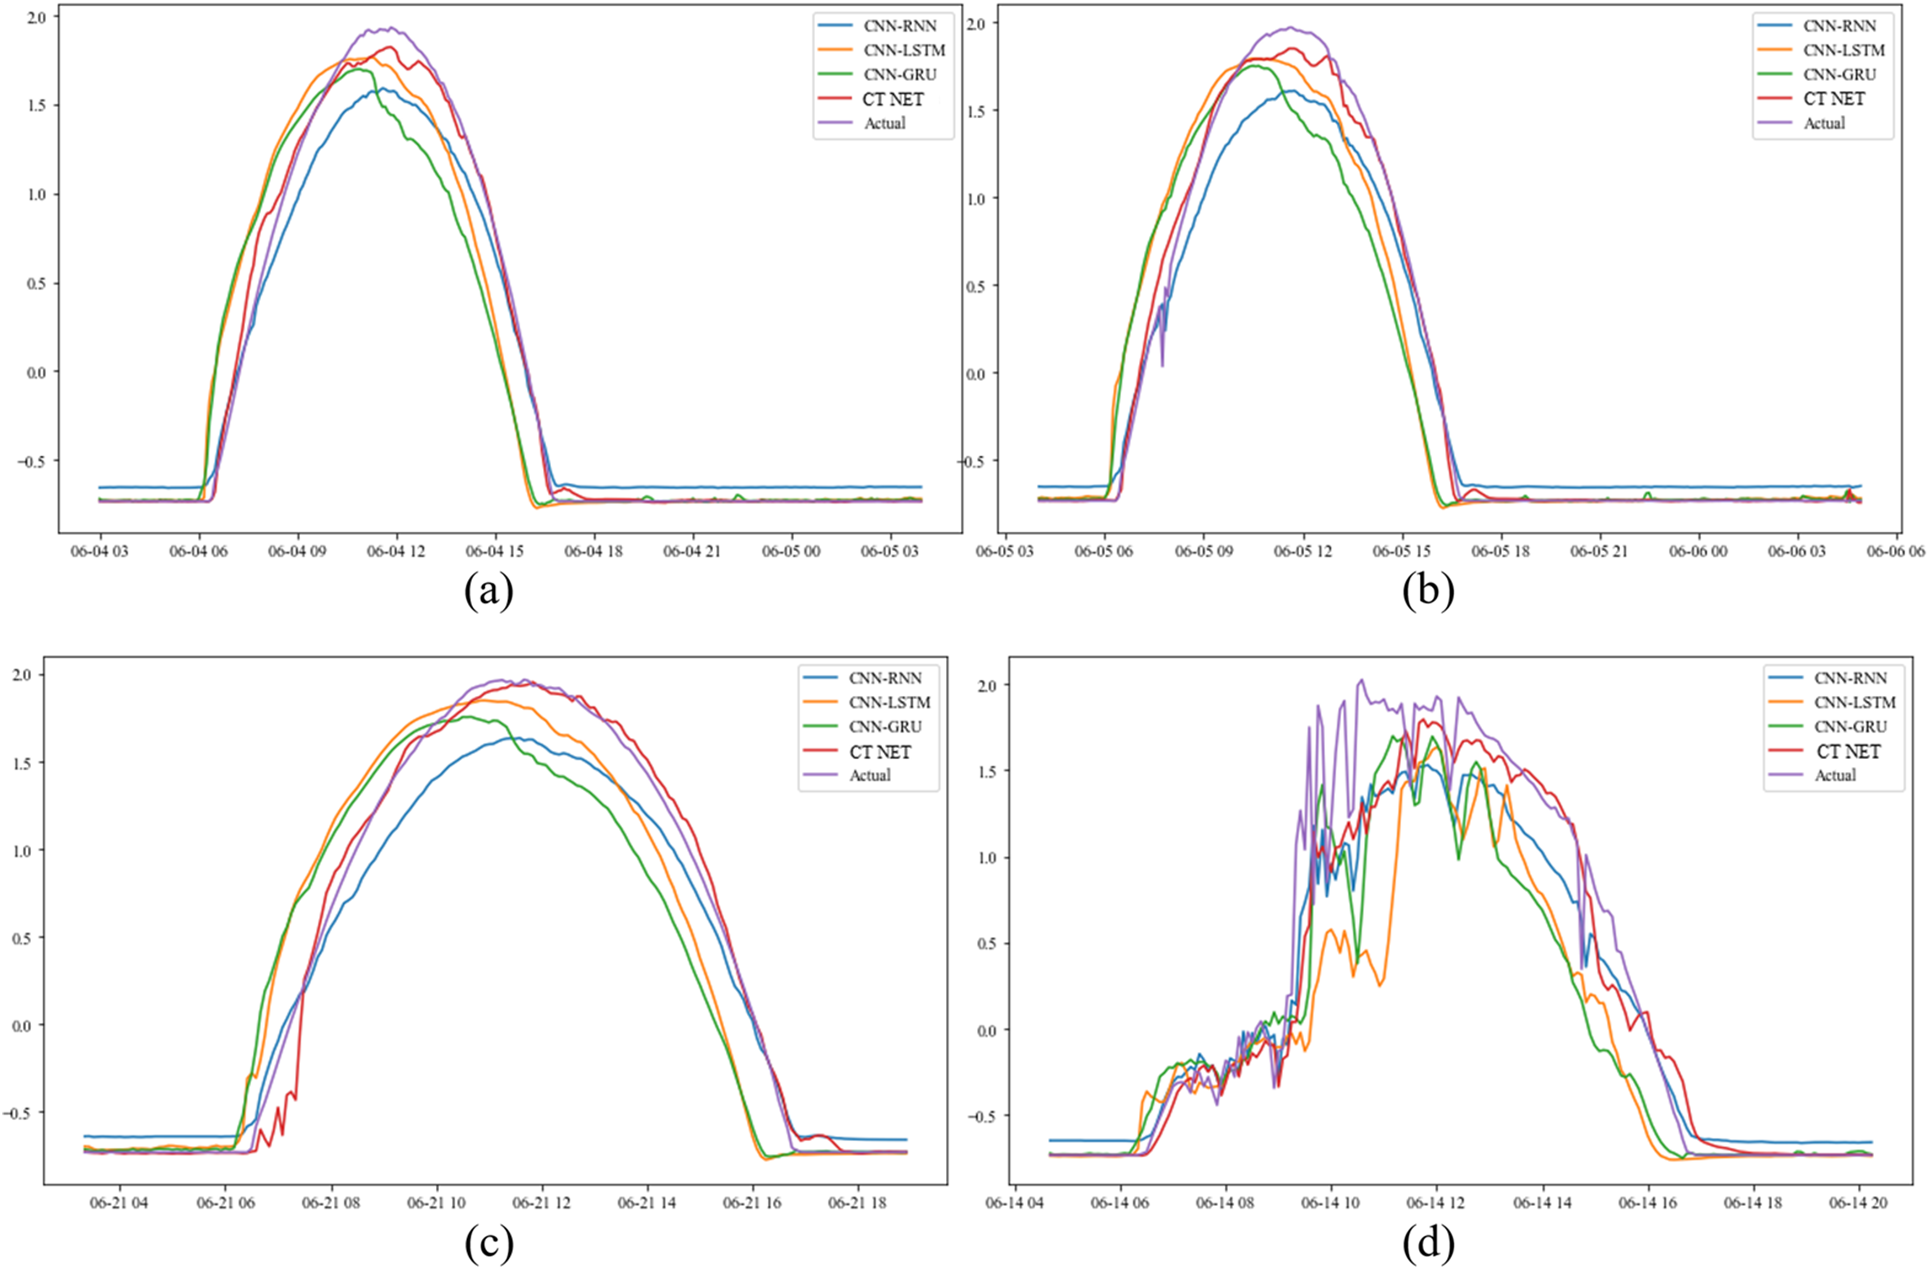
Figure 6: Performance of CT-NET under various weather conditions: (a) and (c) sunny days; (b) partially cloudy days; (d) rainy days
To explore the feasibility of deploying the proposed CT-NET model on edge devices, we analyzed our model from three perspectives: the size of the model, which is directly linked to the memory required on the host hardware; the number of parameters, which reflects the processing power required to make a prediction; and the training and prediction (inference) time, which provides insight into the processing potential of a model on certain hardware [55]. Fig. 7 shows the results of a complexity analysis of the proposed model and the alternatives. It can be observed that the CNN-LSTM model achieved the poorest performance, with the highest model size (7.98 MB), the highest number of parameters (0.6936 M), and long training, inference, and prediction times. In contrast, the proposed model achieved the lowest size of only 0.106 MB, contained up to 0.0135 M parameters, and had short training (2 s/epoch) and inference or prediction times (2 m/s). This analysis showed that our model is lightweight and more efficient than the other models. In addition, currently available resource-constrained devices such as the Raspberry Pi 4 and Jetson Nano can support up to 8 GB of memory and have enough processing speed to efficiently operate our proposed model [56] due to its low complexity.
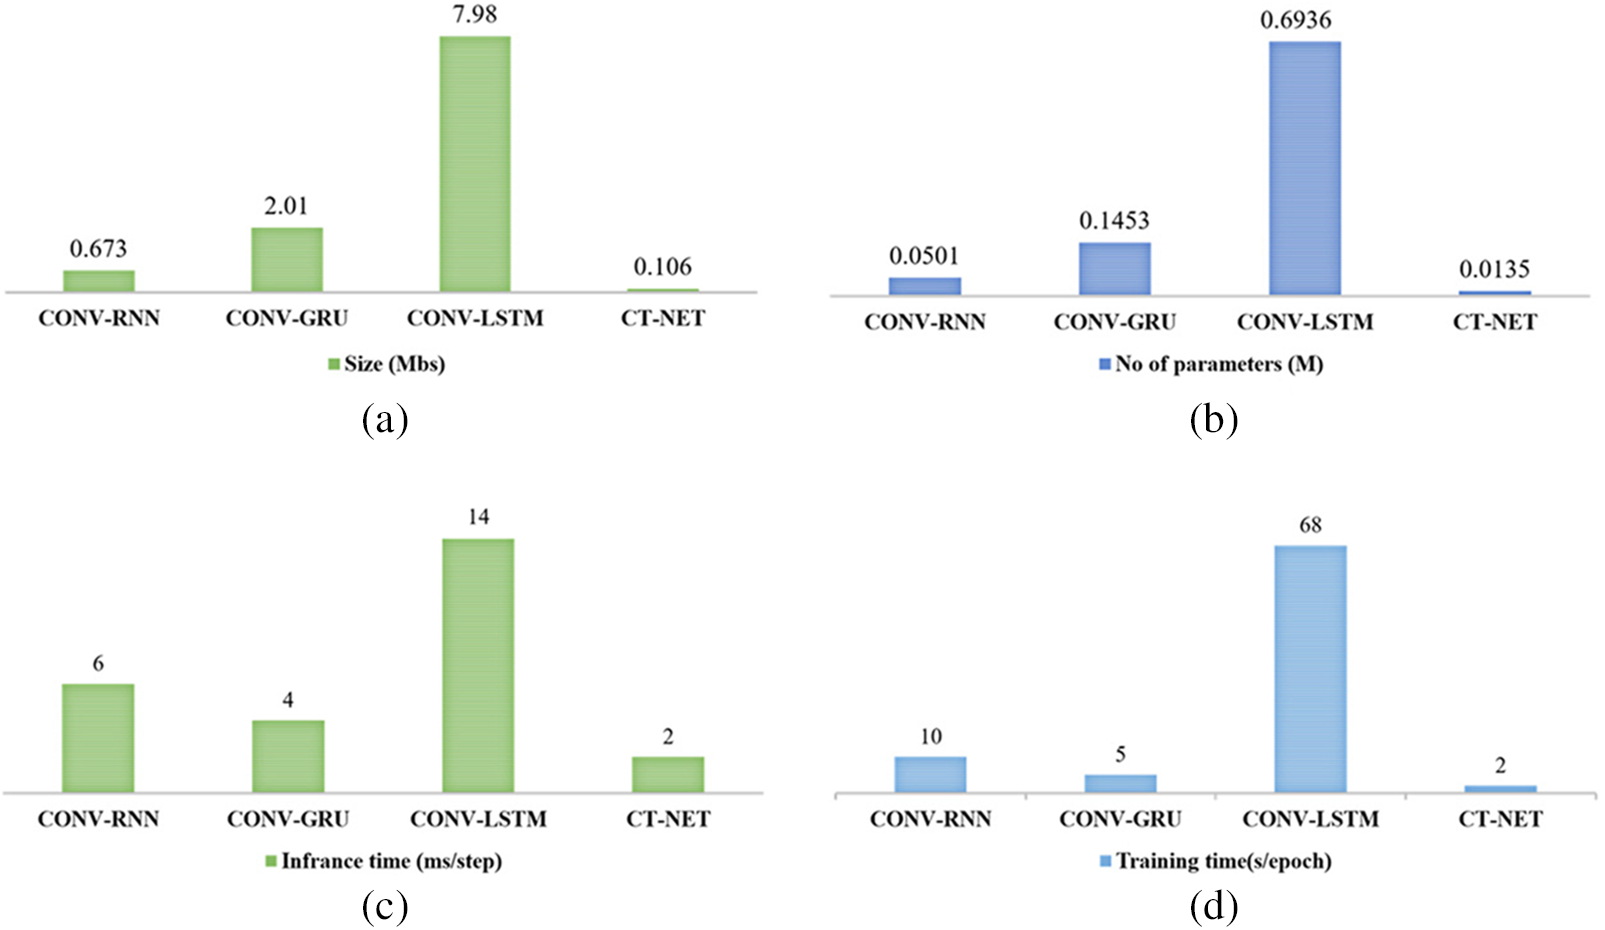
Figure 7: Results of a complexity analysis of the proposed CT-NET model and other baseline models: (a) size; (b) parameters; (c) inference time; (d) training time
In this article, we have proposed an efficient, accurate short-term PVP forecasting network based on the introduction of a novel convolutional transformer model. Our network mainly consists of a CNN-MHA-based encoder and an MHA-based decoder. The CNN module in the encoder is used to extract spatial features, while the MHA layer is used to extract contextual features from the input sequence. The decoder accepts the encoded output from the encoder and makes forecasts one hour ahead. Extensive experiments were performed, and the performance of model was compared with other state-of-the-art architectures; it was found that the proposed model outperformed the alternatives, with lower errors and better accuracy. Finally, a latency analysis of the model was conducted to assess its feasibility for deployment on the edge, and the proposed model was found to be both lightweight and efficient.
The current approach is suitable only for short-term forecasting and cannot be used for medium- and long-term predictions. To make it able for the use of medium- and long-term PVP forecasting, it would be necessary to train and fine-tune the model on large PV datasets. The performance could be further improved by using the proposed model in an ensemble manner to consider various levels of features and fuse the results at the end to create the final prediction. We did not evaluate the proposed model for use in real-world situations involving edge computing. In future, we will investigate the possibility of moving the proposed model to edge devices such as microcontrollers or Jetson Nanos for deployment in smart grids.
Acknowledgement: This work was supported by the National Research Foundation of Korea (NRF) grant funded by the Korean government (MSIT) (No. 2019M3F2A1073179).
Funding Statement: This work was supported by the National Research Foundation of Korea (NRF) grant funded by the Korean government (MSIT) (No. 2019M3F2A1073179).
Conflicts of Interest: The authors declare that they have no conflicts of interest to report regarding the present study.
References
1. N. Li, Z. Su, H. Jerbi, R. Abbassi, M. Latifi et al., “Energy management and optimized operation of renewable sources and electric vehicles based on microgrid using hybrid gravitational search and pattern search algorithm,” Sustainable Cities and Society, vol. 75, pp. 103279, 2021. [Google Scholar]
2. D. A. Wood, “Hourly-averaged solar plus wind power generation for Germany 2016: Long-term prediction, short-term forecasting, data mining and outlier analysis,” Sustainable Cities and Society, vol. 60, pp. 102227, 2020. [Google Scholar]
3. O. A. Al-Shahri, F. B. Ismail, M. Hannan, M. H. Lipu, A. Q. Al-Shetwi et al., “Solar photovoltaic energy optimization methods, challenges and issues: A comprehensive review,” Journal of Cleaner Production, vol. 284, pp. 125465, 2021. [Google Scholar]
4. J. Pascual, D. Arcos-Aviles, A. Ursúa, P. Sanchis and L. Marroyo, “Energy management for an electro-thermal renewable–based residential microgrid with energy balance forecasting and demand side management,” Applied Energy, vol. 295, pp. 117062, 2021. [Google Scholar]
5. F. Xiao and J. -q. Wang, “Multistage decision support framework for sites selection of solar power plants with probabilistic linguistic information,” Journal of Cleaner Production, vol. 230, pp. 1396–1409, 2019. [Google Scholar]
6. H. Wang, Y. Liu, B. Zhou, C. Li, G. Cao et al., “Taxonomy research of artificial intelligence for deterministic solar power forecasting,” Energy Conversion and Management, vol. 214, pp. 112909, 2020. [Google Scholar]
7. L. Tian, Y. Huang, S. Liu, S. Sun, J. Deng et al., “Application of photovoltaic power generation in rail transit power supply system under the background of energy low carbon transformation,” Alexandria Engineering Journal, vol. 60, no. 6, pp. 5167–5174, 2021. [Google Scholar]
8. A. Sohani, H. Sayyaadi, C. Cornaro, M. H. Shahverdian, M. Pierro et al., “Using machine learning in photovoltaics to create smarter and cleaner energy generation systems: A comprehensive review,” Journal of Cleaner Production, vol. 364, pp. 132701, 2022. [Google Scholar]
9. P. Mottaghizadeh, F. Jabbari and J. Brouwer, “Integrated solid oxide fuel cell, solar PV, and battery storage system to achieve zero net energy residential nanogrid in california,” Applied Energy, vol. 323, pp. 119577, 2022. [Google Scholar]
10. G. Fan, Z. Liu, X. Liu, Y. Shi, D. Wu et al., “Energy management strategies and multi-objective optimization of a near-zero energy community energy supply system combined with hybrid energy storage,” Sustainable Cities and Society, vol. 83, pp. 103970, 2022. [Google Scholar]
11. F. M. Eltoumi, M. Becherif, A. Djerdir and H. S. Ramadan, “The key issues of electric vehicle charging via hybrid power sources: Techno-economic viability, analysis, and recommendations,” Renewable and Sustainable Energy Reviews, vol. 138, pp. 110534, 2021. [Google Scholar]
12. A. S. Al-Sumaiti, M. H. Ahmed, S. Rivera, M. S. El Moursi, M. M. Salama et al., “Stochastic PV model for power system planning applications,” Institution of Engineering and Technology Renewable Power Generation, vol. 13, no. 16, pp. 3168–3179, 2019. [Google Scholar]
13. R. Iqbal, H. Mokhlis, A. S. M. Khairuddin, S. Ismail and M. A. Muhammad, “Optimized gated recurrent unit for mid-term electricity price forecasting,” Computer Systems Science and Engineering, vol. 43, no. 2, pp. 817–832, 2022. [Google Scholar]
14. S. Barja-Martinez, M. Aragüés-Peñalba, Í. Munné-Collado, P. Lloret-Gallego, E. Bullich-Massagué et al., “Artificial intelligence techniques for enabling big data services in distribution networks: A review,” Renewable and Sustainable Energy Reviews, vol. 150, pp. 111459, 2021. [Google Scholar]
15. X. Huang, Q. Li, Y. Tai, Z. Chen, J. Liu et al., “Time series forecasting for hourly photovoltaic power using conditional generative adversarial network and Bi-LSTM,” Energy, vol. 246, pp. 123403, 2022. [Google Scholar]
16. Z. Yu, S. -Y. Chou, P. N. K. Phuc and T. H. -K. Yu, “System dynamics forecasting on Taiwan power supply chain,” Computer Systems Science and Engineering, vol. 41, no. 3, pp. 1191–1205, 2022. [Google Scholar]
17. S. F. Abbasi, H. Jamil and W. Chen, “EEG-based neonatal sleep stage classification using ensemble learning,” Computers, Materials & Continua, vol. 70, pp. 4619–4633, 2022. [Google Scholar]
18. N. S. Muruganandam and U. Arumugam, “Dynamic ensemble multivariate time series forecasting model for PM2.5,” Computer Systems Science and Engineering, vol. 44, no. 2, pp. 979–989, 2023. [Google Scholar]
19. H. Khan, I. U. Haq, M. Munsif, S. U. Khan and M. Y. Lee, “Automated wheat diseases classification framework using advanced machine learning technique,” Agriculture, vol. 12, no. 8, pp. 1226, 2022. [Google Scholar]
20. S. Ul Amin, M. Ullah, M. Sajjad, F. A. Cheikh, M. Hijji et al., “EADN: An efficient deep learning model for anomaly detection in videos,” Mathematics, vol. 10, no. 9, pp. 1555, 2022. [Google Scholar]
21. A. Hussain, Z. A. Khan, T. Hussain, F. U. M. Ullah, S. Rho et al., “A hybrid deep learning-based network for photovoltaic power forecasting,” Complexity, vol. 2022, pp. 12, 2022. [Google Scholar]
22. K. Wang, X. Qi and H. Liu, “Photovoltaic power forecasting based LSTM-convolutional network,” Energy, vol. 189, pp. 116225, 2019. [Google Scholar]
23. H. Zhen, D. Niu, K. Wang, Y. Shi, Z. Ji et al., “Photovoltaic power forecasting based on GA improved Bi-LSTM in microgrid without meteorological information,” Energy, vol. 231, pp. 120908, 2021. [Google Scholar]
24. M. Abdel-Basset, H. Hawash, R. K. Chakrabortty and M. Ryan, “PV-Net: An innovative deep learning approach for efficient forecasting of short-term photovoltaic energy production,” Journal of Cleaner Production, vol. 303, pp. 127037, 2021. [Google Scholar]
25. C. Wang, Y. Wang, Z. Ding, T. Zheng, J. Hu et al., “A transformer-based method of multienergy load forecasting in integrated energy system,” IEEE Transactions on Smart Grid, vol. 13, no. 4, pp. 2703–2714, 2022. [Google Scholar]
26. A. Vaswani, N. Shazeer, N. Parmar, J. Uszkoreit, L. Jones et al., “Attention is all you need,” Advances in Neural Information Processing Systems, vol. 30, pp. 5998–6008, 2017. [Google Scholar]
27. T. Brown, B. Mann, N. Ryder, M. Subbiah, J. D. Kaplan et al., “Language models are few-shot learners,” Advances in Neural Information Processing Systems, vol. 33, pp. 1877–1901, 2020. [Google Scholar]
28. S. Borgeaud, A. Mensch, J. Hoffmann, T. Cai, E. Rutherford et al., “Improving language models by retrieving from trillions of tokens,” in Int. Conf. on Machine Learning, Baltimore, Maryland, USA, PMLR, pp. 2206–2240, 2022. [Google Scholar]
29. S. Kwon, “A CNN-assisted enhanced audio signal processing for speech emotion recognition,” Sensors, vol. 20, no. 1, pp. 183, 2019. [Google Scholar] [PubMed]
30. S. U. Khan, I. U. Haq, N. Khan, K. Muhammad, M. Hijji et al., “Learning to rank: An intelligent system for person reidentification,” International Journal of Intelligent Systems, vol. 37, no. 9, pp. 5924–5948, 2022. [Google Scholar]
31. M. Sajjad, S. Khan, Z. Jan, K. Muhammad, H. Moon et al., “Leukocytes classification and segmentation in microscopic blood smear: A resource-aware healthcare service in smart cities,” IEEE Access, vol. 5, pp. 3475–3489, 2016. [Google Scholar]
32. I. V. Tetko, P. Karpov, R. Van Deursen and G. Godin, “State-of-the-art augmented NLP transformer models for direct and single-step retrosynthesis,” Nature Communications, vol. 11, no. 1, pp. 1–11, 2020. [Google Scholar]
33. N. Khan, I. U. Haq, S. U. Khan, S. Rho, M. Y. Lee et al., “DB-Net: A novel dilated CNN based multi-step forecasting model for power consumption in integrated local energy systems,” International Journal of Electrical Power & Energy Systems, vol. 133, pp. 107023, 2021. [Google Scholar]
34. M. Sajjad, Z. A. Khan, A. Ullah, T. Hussain, W. Ullah et al., “A novel CNN-GRU-based hybrid approach for short-term residential load forecasting,” IEEE Access, vol. 8, pp. 143759–143768, 2020. [Google Scholar]
35. F. U. M. Ullah, A. Ullah, I. U. Haq, S. Rho and S. W. Baik, “Short-term prediction of residential power energy consumption via CNN and multi-layer bi-directional LSTM networks,” IEEE Access, vol. 8, pp. 123369–123380, 2019. [Google Scholar]
36. P. Li, K. Zhou, X. Lu and S. Yang, “A hybrid deep learning model for short-term PV power forecasting,” Applied Energy, vol. 259, pp. 114216, 2020. [Google Scholar]
37. F. Barbieri, S. Rajakaruna and A. Ghosh, “Very short-term photovoltaic power forecasting with cloud modeling: A review,” Renewable and Sustainable Energy Reviews, vol. 75, pp. 242–263, 2017. [Google Scholar]
38. M. J. Mayer and G. Gróf, “Extensive comparison of physical models for photovoltaic power forecasting,” Applied Energy, vol. 283, pp. 116239, 2021. [Google Scholar]
39. E. Lorenz, T. Scheidsteger, J. Hurka, D. Heinemann and C. Kurz, “Regional PV power prediction for improved grid integration,” Progress in Photovoltaics: Research and Applications, vol. 19, no. 7, pp. 757–771, 2011. [Google Scholar]
40. B. Wolff, J. Kühnert, E. Lorenz, O. Kramer and D. Heinemann, “Comparing support vector regression for PV power forecasting to a physical modeling approach using measurement, numerical weather prediction, and cloud motion data,” Solar Energy, vol. 135, pp. 197–208, 2016. [Google Scholar]
41. R. Ahmed, V. Sreeram, Y. Mishra and M. Arif, “A review and evaluation of the state-of-the-art in PV solar power forecasting: Techniques and optimization,” Renewable and Sustainable Energy Reviews, vol. 124, pp. 109792, 2020. [Google Scholar]
42. D. Markovics and M. J. Mayer, “Comparison of machine learning methods for photovoltaic power forecasting based on numerical weather prediction,” Renewable and Sustainable Energy Reviews, vol. 161, pp. 112364, 2022. [Google Scholar]
43. F. Wu, C. Cattani, W. Song and E. Zio, “Fractional ARIMA with an improved cuckoo search optimization for the efficient short-term power load forecasting,” Alexandria Engineering Journal, vol. 59, no. 5, pp. 3111–3118, 2020. [Google Scholar]
44. M. Hossain, S. Mekhilef, M. Danesh, L. Olatomiwa and S. Shamshirband, “Application of extreme learning machine for short term output power forecasting of three grid-connected PV systems,” Journal of Cleaner Production, vol. 167, pp. 395–405, 2017. [Google Scholar]
45. B. Singh and D. Pozo, “A guide to solar power forecasting using ARMA models,” in 2019 IEEE PES Innovative Smart Grid Technologies Europe (ISGT-Europe), Bucharest, Romania, IEEE, pp. 1–4, 2019. [Google Scholar]
46. M. Q. Raza, M. Nadarajah and C. Ekanayake, “On recent advances in PV output power forecast,” Solar Energy, vol. 136, pp. 125–144, 2016. [Google Scholar]
47. G. Cervone, L. Clemente-Harding, S. Alessandrini and L. Delle Monache, “Short-term photovoltaic power forecasting using artificial neural networks and an analog ensemble,” Renewable Energy, vol. 108, pp. 274–286, 2017. [Google Scholar]
48. F. Wang, Z. Zhang, C. Liu, Y. Yu, S. Pang et al., “Generative adversarial networks and convolutional neural networks based weather classification model for day ahead short-term photovoltaic power forecasting,” Energy Conversion and Management, vol. 181, pp. 443–462, 2019. [Google Scholar]
49. H. Wei, Z. Hongxuan, D. Yu, W. Yiting, D. Ling et al., “Short-term optimal operation of hydro-wind-solar hybrid system with improved generative adversarial networks,” Applied Energy, vol. 250, pp. 389–403, 2019. [Google Scholar]
50. X. Luo and D. Zhang, “A cascaded deep learning framework for photovoltaic power forecasting with multi-fidelity inputs,” Energy, vol. 268, pp. 126636, 2023. [Google Scholar]
51. B. Zhu, J. Jiao and D. Tse, “Deconstructing generative adversarial networks,” IEEE Transactions on Information Theory, vol. 66, no. 11, pp. 7155–7179, 2020. [Google Scholar]
52. L. Rossi, M. Paolanti, R. Pierdicca and E. Frontoni, “Human trajectory prediction and generation using LSTM models and GANs,” Pattern Recognition, vol. 120, pp. 108136, 2021. [Google Scholar]
53. M. Munsif, H. Khan, Z. A. Khan, A. Hussain, F. U. M. Ullah et al., “PV-ANet: Attention-based network for short-term photovoltaic power forecasting,” Korea Next Generation Computing Society Conference, vol. 2022, pp. 133–135, 2022. [Google Scholar]
54. mono-si, Dual, 2018. “Desert Knowledge Australia Centre. Download Data: Array eco-Kinetics, 26.5 kW”. [Online]. Available: https://dkasolarcentre.com.au/source/alice-springs/dka-m11-3-phase [Google Scholar]
55. N. Dilshad, A. Ullah, J. Kim and J. Seo, “LocateUAV: Unmanned aerial vehicle location estimation via contextual analysis in an iot environment,” IEEE Internet of Things Journal, vol. 10, pp. 4021–4033, 2022. [Google Scholar]
56. X. Wang, M. Magno, L. Cavigelli and L. Benini, “FANN-On-MCU: An open-source toolkit for energy-efficient neural network inference at the edge of the internet of things,” IEEE Internet of Things Journal, vol. 7, no. 5, pp. 4403–4417, 2020. [Google Scholar]
Cite This Article
 Copyright © 2023 The Author(s). Published by Tech Science Press.
This work is licensed under a Creative Commons Attribution 4.0 International License , which permits unrestricted use, distribution, and reproduction in any medium, provided the original work is properly cited.
 Downloads
 Citation Tools