
 Submit a Paper
 Propose a Special lssue
 Open Access
ARTICLE

Liver Tumor Segmentation Based on Multi-Scale and Self-Attention Mechanism
School of Computer Science and Cyber Engineering, Guangzhou University, Guangzhou, 510006, China
* Corresponding Author: Manlin Luo. Email:
Computer Systems Science and Engineering 2023, 47(3), 2835-2850. https://doi.org/10.32604/csse.2023.039765
Received 15 February 2023; Accepted 17 April 2023; Issue published 09 November 2023
 View Full Text
 Download PDF
Abstract
Liver cancer has the second highest incidence rate among all types of malignant tumors, and currently, its diagnosis heavily depends on doctors’ manual labeling of CT scan images, a process that is time-consuming and susceptible to subjective errors. To address the aforementioned issues, we propose an automatic segmentation model for liver and tumors called Res2Swin Unet, which is based on the Unet architecture. The model combines Attention-Res2 and Swin Transformer modules for liver and tumor segmentation, respectively. Attention-Res2 merges multiple feature map parts with an Attention gate via skip connections, while Swin Transformer captures long-range dependencies and models the input globally. And the model uses deep supervision and a hybrid loss function for faster convergence. On the LiTS2017 dataset, it achieves better segmentation performance than other models, with an average Dice coefficient of 97.0% for liver segmentation and 81.2% for tumor segmentation.Keywords
The liver is the largest organ in the abdomen of the human body, and its anatomical structure and vascular distribution are extremely complex. There are many types of liver diseases and tumors, which pose a great threat to human life, health, and safety [1]. According to statistics, liver cancer is the second most common cancer that causes death for men and the sixth most common cancer that causes death for women. Globally, men are twice as likely to suffer from liver cancer as women [2], In China, the incidence rate of liver cancer ranks second among all malignant tumors and the mortality rate ranks sixth [3]. CT imaging is commonly used to detect and diagnose liver tumors due to its high spatial resolution and fast scanning speed. As a result, doctors often rely on their ability to interpret CT images for the diagnosis of liver cancer in clinical settings [4]. Due to the varied shape and distribution of liver tumors and their low contrast with surrounding organs, identifying liver tumors visually can be challenging [5]. However, automatic segmentation methods based on neural networks can efficiently and accurately segment liver tumors [6]. Therefore, research in this area is of great significance for improving the treatment of liver tumors.
Traditional image segmentation methods mainly segment images by color, texture, and other image features. The common segmentation methods are mainly based on clustering [7–9], graph cut [10], region growing method [11,12], level set [13,14], and the active contour model [15,16]. Das et al. used a clustering method for liver tumor segmentation, combined with different image modalities and shape analysis techniques to improve the accuracy and stability of tumor segmentation [17]. Wu et al. used the boundary of the liver tumor region as the initial contour and employed the graph cut algorithm for further segmentation and optimization [18]. Abd-Elaziz et al. used region growing with automatic seed selection to segment liver tumors, using multiple feature parameters to guide the growth process for accuracy and robustness [19]. Xu et al. developed a liver tumor segmentation method based on a multi-scale region-based active contour model, which adaptively adjusts parameters for accurate segmentation. The method achieved high accuracy and efficiency on various CT datasets [20]. Because these methods require pre-defined rules for segmentation, so they consistently produce the same results for a given image. However, individual variations in the shape and distribution of liver tumors prevent them from being segmented effectively using a uniform set of rules [21]. Therefore, traditional methods cannot achieve full automatic segmentation of liver and tumor regions.
In recent years, thanks to the powerful computing ability of deep learning [22], deep learning has been applied in many basic fields and achieved very good results [23,24], and deep learning has been widely used in medical image segmentation due to its strong learning ability and good adaptability [25]. Ronneberger et al. constructed the first U-shaped network (Unet) for medical image segmentation using skip connections and achieved excellent results [26]. Since then, the U-shaped structure network has been widely used in the field of medical image segmentation [27]. Oktay et al. proposed Attention Unet improved segmentation accuracy by integrating the Attention gate module into Unet. The module highlighted salient features of local areas while suppressing irrelevant areas in the input image [28]. Jha et al. proposed ResUnet++ [29], which improved segmentation accuracy by adding residual connections, SE module [30], Attention gate, and ASPP module [31] to Unet. Despite increased complexity, but outperformed Unet in segmentation accuracy. Cao et al. proposed SwinUnet [32], a U-shaped network with a pure Transformer architecture for medical image segmentation. They enhanced the Transformer module, used mobile windows and displacement, and achieved good segmentation results. This study shows the feasibility of using Transformer modules in medical image segmentation. However, the Transformer module needs a lot of data to work well, making it challenging to use for medical image fields with limited data [33].
Considering the advantages and disadvantages of the above-mentioned networks, the paper proposes Res2SwinUnet, a U-shaped network that combines Res2Net and Swin Transformer for liver tumor segmentation. It uses deep supervision [34] and mixed loss functions to improve accuracy and achieves good results for liver and small tumor segmentation.
Improving the receptive field of the network is crucial to the recognition ability of the network, and the common methods include atrous convolution [35] and multi-scale technology, GoogleNet [36] uses convolution kernels of different sizes to extract information on different scales. Finally, the information on different scales is aggregated to reduce the computational load again, while improving the network’s expression ability. SPPNet [37] proposes spatial pyramid pooling (SPP). Different size inputs are convolved to obtain different-size feature maps, and then SPP is used to obtain a fixed output, which is used for the full connection layer calculation in the following order, avoiding computational redundancy and precision loss. DeepLabV3 [38] adds atrous convolution based on SPP and proposes atrous spatial pyramid pooling (ASPP), the receptive field of the convolutional kernel can be expanded without sampling, and the feature extraction ability of the model can be improved. It can be seen that for image recognition, it is very important to express features on multiple scales. So Gao et al. [39] proposed Res2Net. The author’s first group channels using 1 × 1 convolutions. In each group, feature maps with the same scale are used. The first group can be directly transmitted down, while the second group can extract features through a 3 × 3 convolutional kernel. This changes the receptive field in the branch, and so on. Finally, the feature maps are concatenated in the channel direction and passed through a 1 × 1 convolution. This technology uses multi-scale techniques to expand the receptive field of the convolutional kernel, allowing for the extraction of more semantic information from the image. It is widely used in the field of image recognition at present [40].
In liver tumor segmentation, the distribution of tumors is diffuse and the size is small, so it is easy to lose the semantic information of small objects after multiple single convolution operations, resulting in a decline in the accuracy of small object segmentation [41]. Inspired by Res2Net, this paper combines and integrates the Attention gate and Res2Net Block into Unet, splits the feature map into multiple channels, fuses the two adjacent feature maps, and then convolves them to increase the receptive field of the network. At the same time, the Attention gate is used to help the network suppress the feature information of unrelated areas, to enhance the segmentation of the network on the liver, and avoid the wrong segmentation of the liver region into tumors.
Vaswani et al. [42] first proposed the Transformer structure and replaced it with the RNN structure commonly used in the NLP field, which not only improves the accuracy of recognition but also greatly reduces the computational complexity. Thanks to the success of the Transformer in the NLP field, Dosovitskiy et al. [43] applied the Transformer structure to the image field and proposed a vision transformer, which has achieved good results in multiple image recognition tasks. Because Transformer needs a large amount of data to converge the network to achieve good results, Liu et al. [44] made some improvements and proposed the swin transformer, which uses mobile windows and mobile windows with displacement to partition, reducing the complexity of the network and accelerating the convergence of the model. Swin unet used a swin transformer to replace all convolution modules in Unet and used a pure Transformer model to achieve good results in brain tumor segmentation tasks, which proved that Transformer can also be applied to medical image segmentation.
Inspired by the above network model, this paper integrates the swin transformer into Unet, allowing the network to capture long-distance dependencies, while having the ability to model globally, effectively making up for the shortcomings of convolutional networks that can only focus on local information, to more accurately segment small tumors.
This paper uses the public data set LiTS2017 provided by MICCAI 2017 challenge to verify the algorithm [45]. This data set collected 201 abdominal-enhanced CT images from 6 medical institutions around the world, including 131 CT images with labels and 70 CT images without labels. There are 58638 CT slice images in total, and the resolution of the image cross-section is 512 × 512, but because the acquisition equipment and protocols used by different medical institutions are different, the resolution and imaging quality of these 201 CT images are also different. The intra-frame resolution range of CT images is 0.55~1.00 mm, and the inter-frame resolution range is 0.45~6.00 mm.
To better distinguish the liver from other abdominal organs, the gray threshold range of the original CT image was truncated to −200~200, and then the gray value was normalized. Because the original CT image contains too many slices, taking the complete CT image as the input will consume too much computing resources while taking a single slice as the input will lack the spatial information between slices. To reduce computing resources and make full use of the spatial information between slices, this paper uses the 2.5D [46] training method. The specific method is to take a single slice and its adjacent two slices as the input of the network, The output of the network is the prediction of the single slice. At the same time, to reduce the overfitting of the model, this paper randomly cuts the slice, the cutting size is 3 × 480 × 480. In the process of processing, the image is randomly flipped up and down and rotated left and right to expand the data set. The processed image is shown in Fig. 1. Finally, the pretreated data set is randomly divided, and the ratio of the training set and verification set is 7:3.
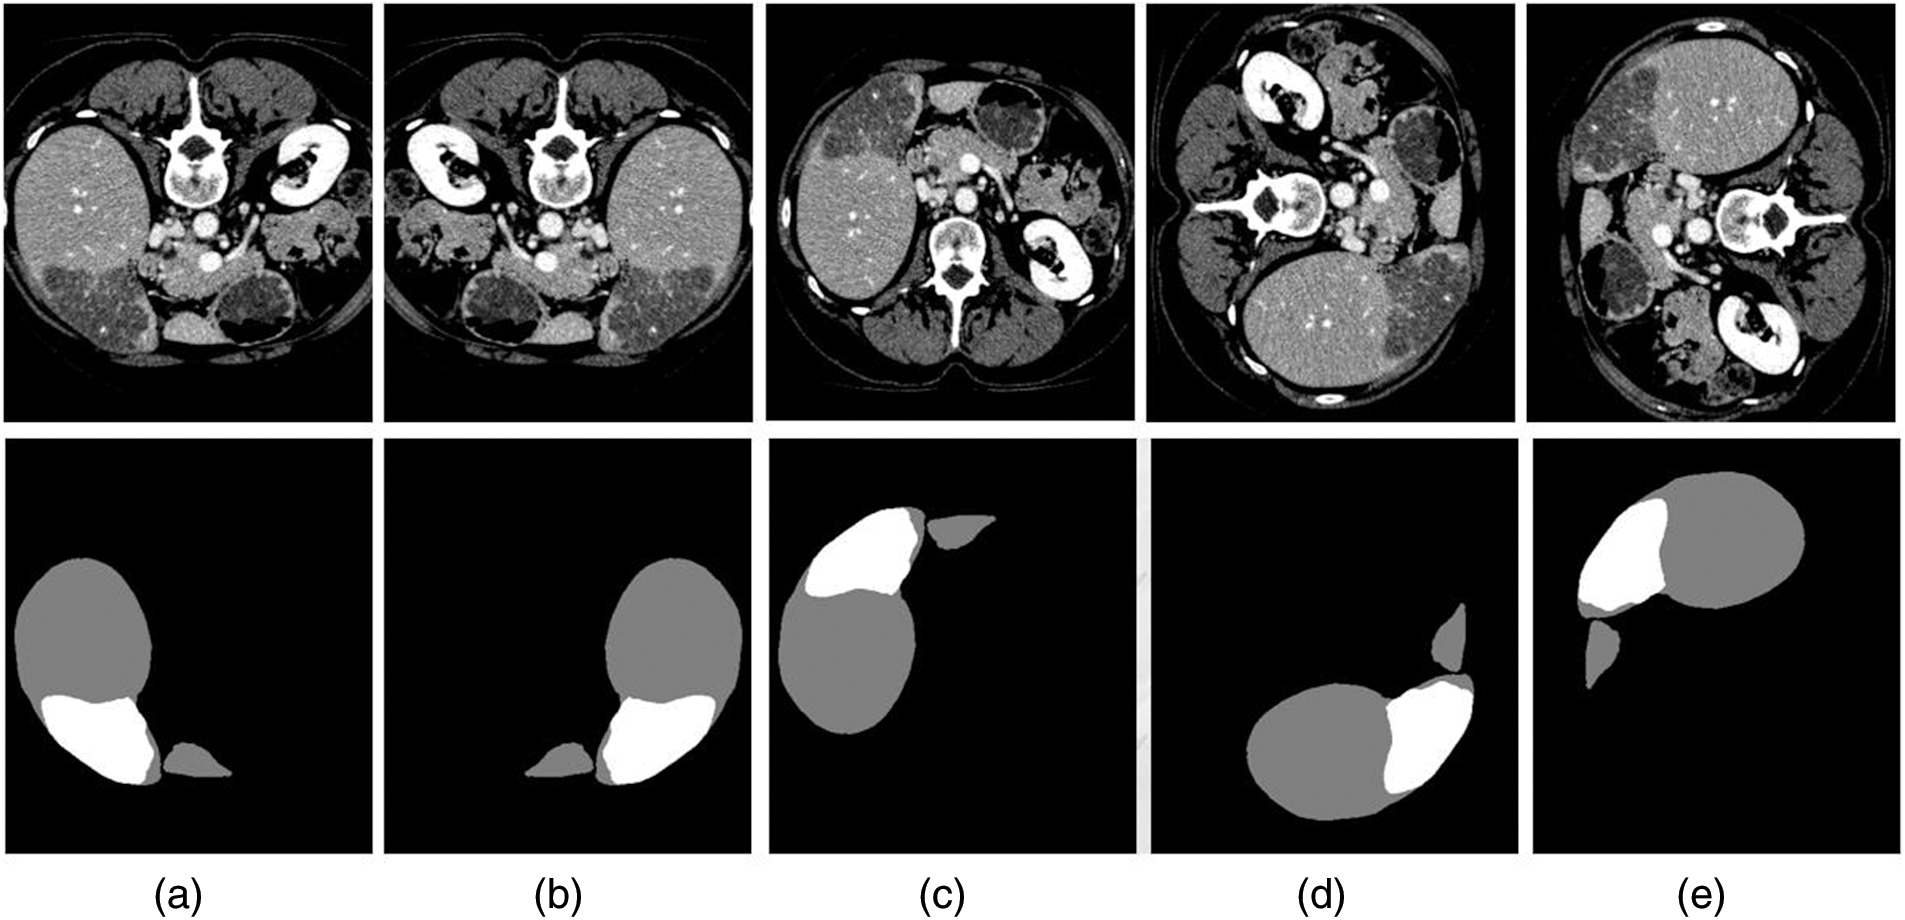
Figure 1: (a) Original image; (b) Flip horizontal; (c) Flip vertical; (d) Left rotation; (e) Right rotation
The algorithm in this paper is improved based on Unet neural network. The traditional Unet network is a U-shaped structure, which is mainly composed of three parts: encoder, decoder, and jump connection. The encoder is composed of five groups of convolution modules and down-sampling modules. The context information of the feature map can be extracted through convolution and down-sampling operations, while the decoder is composed of four groups of deconvolution modules and up-sampling modules. The resolution of the feature map can be recovered through deconvolution and up-sampling operations. Finally, each level of the encoder and decoder is connected through a skip connection. Because the feature map may lose some spatial information after multiple convolutions, the feature map rich in context information of the encoder can be combined with the feature map of the decoder through skip connection to reduce the loss of spatial information, thus improving the accuracy of semantic segmentation, Unet has become a U-shaped convolutional neural network widely used in medical image segmentation [47]. However, in the process of segmentation of the liver and tumor by Unet, because the tumor is diffuse and some tumors are relatively small, simple convolution operation cannot accurately segment all tumors, and segmentation of liver edge is not accurate enough.
To solve the above problems, this paper will replace the simple convolution module in Unet with the Res2Net module integrating multi-scale technology and the self-attention mechanism Transformer, and propose a U-like network structure Res2Swin Unet. The model is shown in Fig. 2. Res2Swin Unet adopts a U-shaped structure. The decoder consists of two 3 × 3 convolution modules and four Res2Swin Blocks. Res2Swin Block is composed of three 1 × 1 convolution modules, an Attention Res2 Module, and a SwinTransformer Module as shown in Fig. 3a. First of all, the feature map passes two 1 × 1 convolution kernels respectively to generate two feature maps, input Attention Res2 Module and Swin Transformer Module respectively, and then splice the output of the two feature maps and pass one 1 × 1 convolution kernel to make a fusion. Finally, the input feature map and the output feature map are added through residual connection to reduce the loss of spatial information.
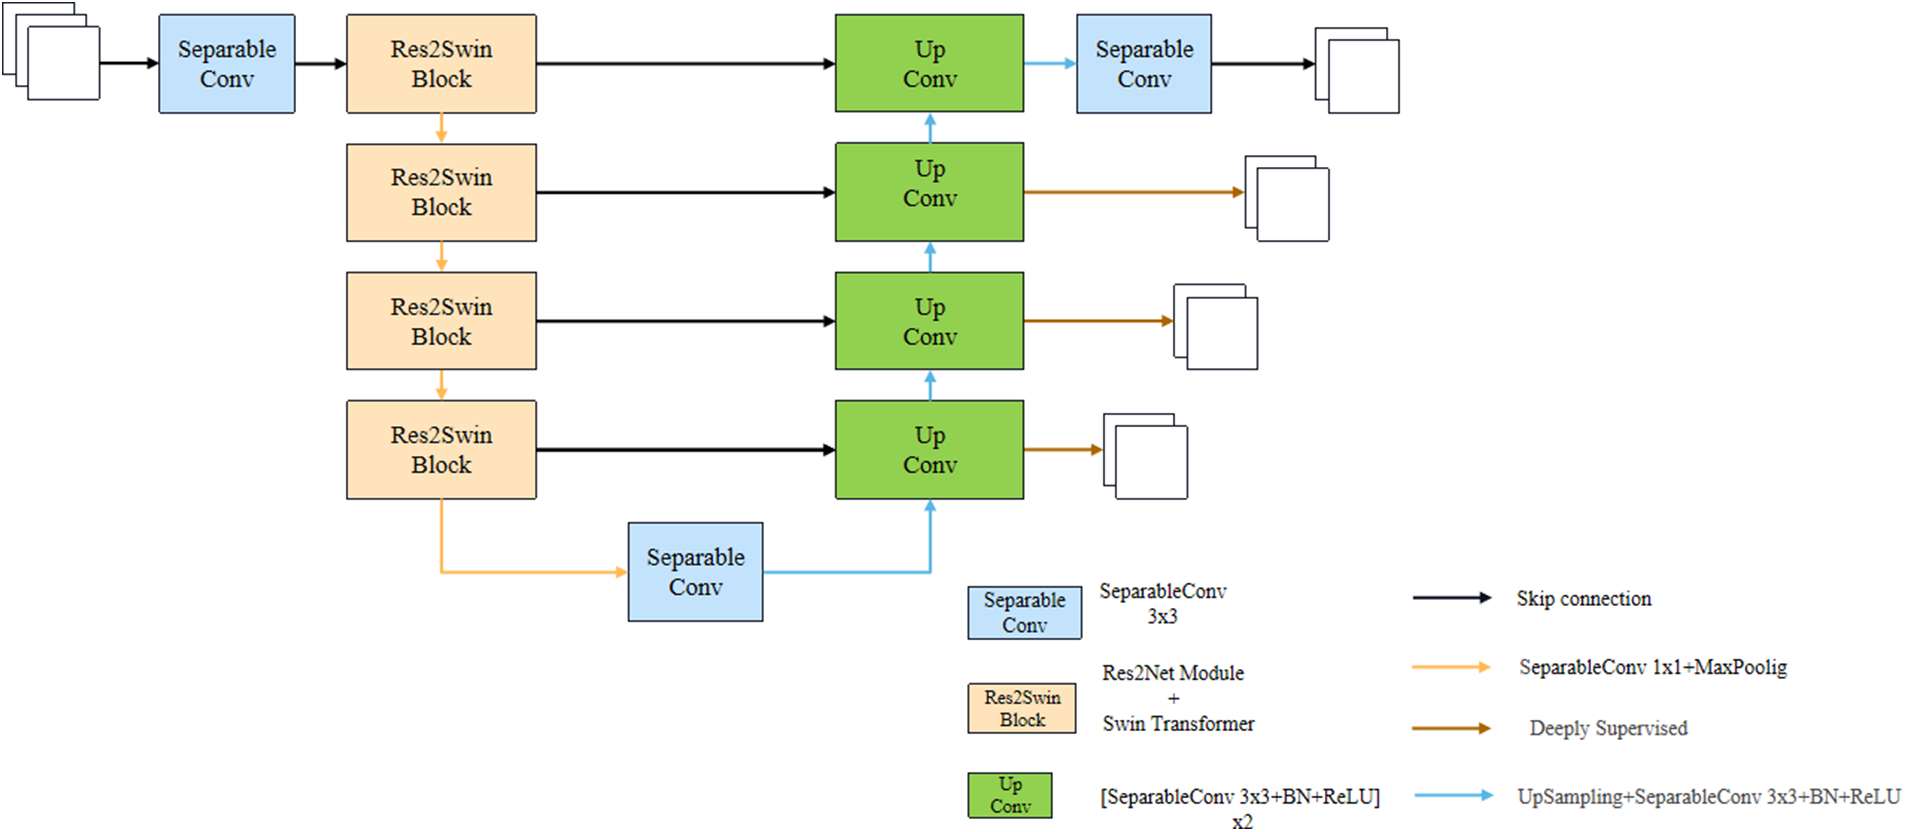
Figure 2: Res2Swin Unet structure
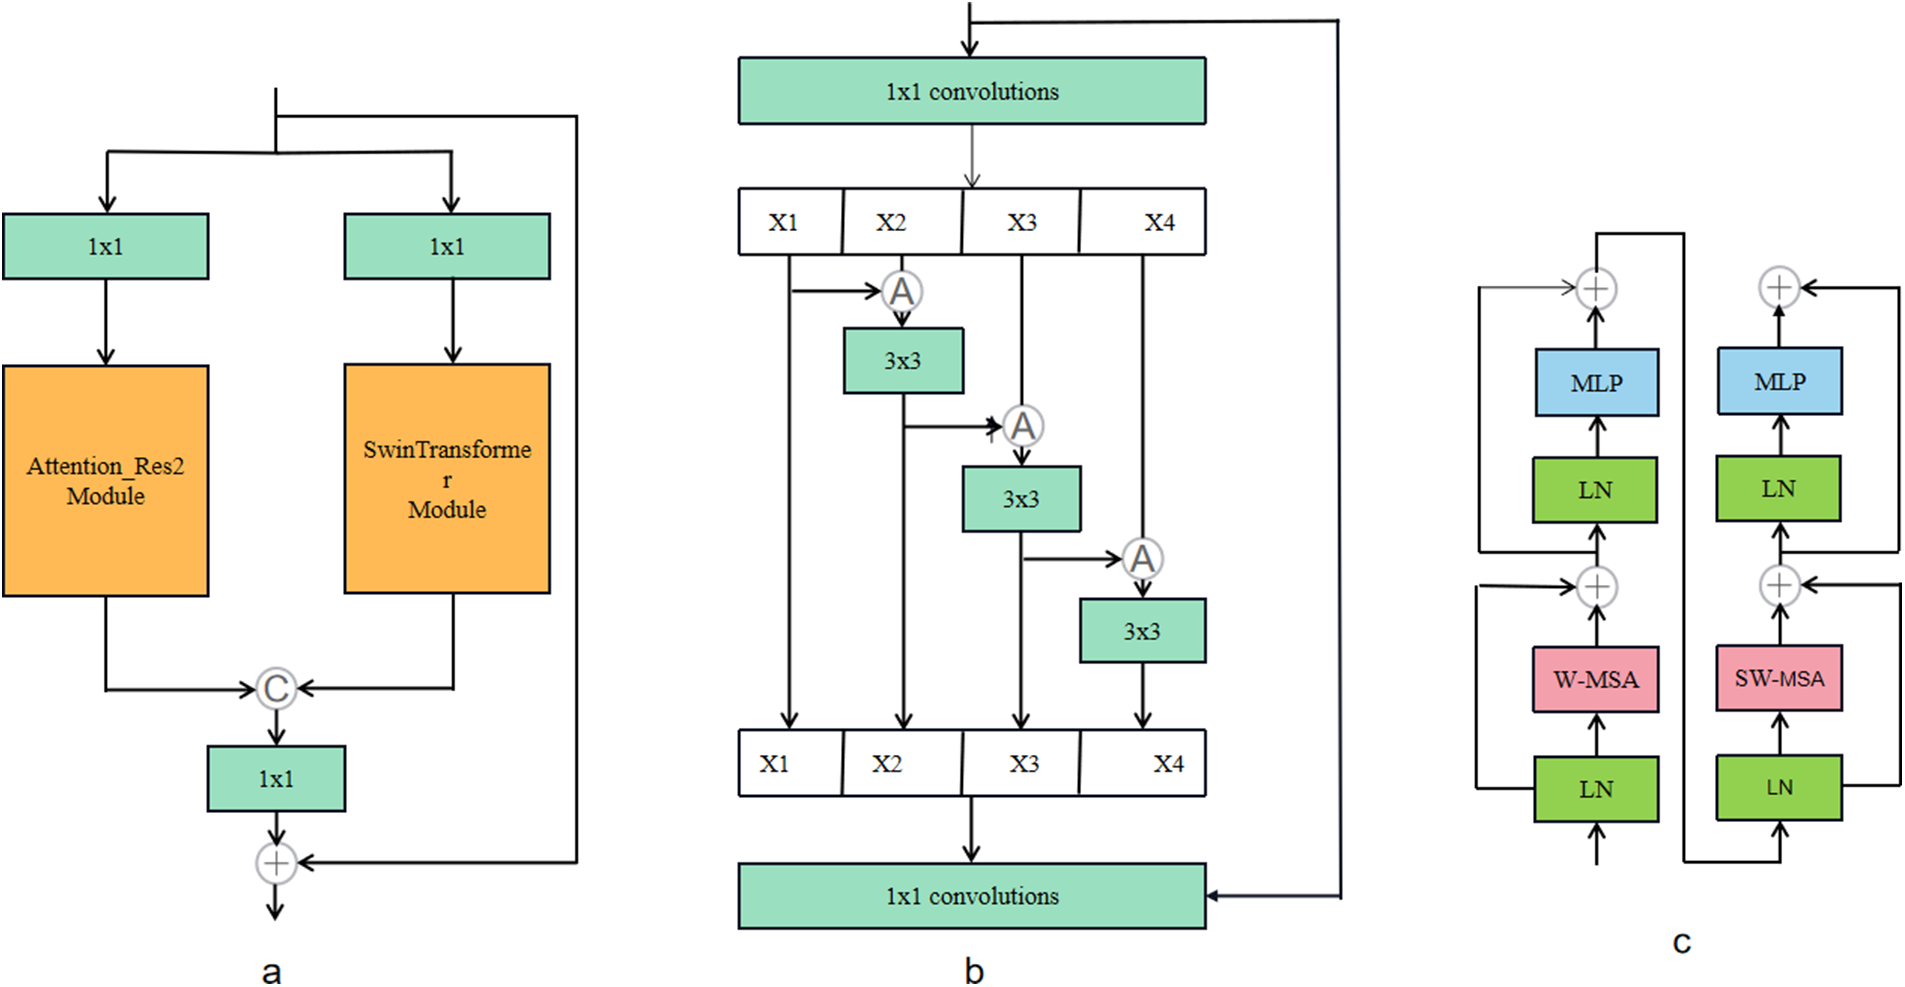
Figure 3: (a) Res2Swin-block; (b) Attention-Res2 module; (c) SwinTransformer module;
The Attention Res2 Module, as shown in Fig. 3b, first passes the input feature map through one 1 × 1 convolution kernel, and the channel is divided into four parts, and then each part is fused with the feature map on the left through the Attention gate, and then through one 3 × 3 convolution kernel, and then splice the groups and use 1 × 1 Convolution kernel for fusion, and finally, it is added with the output of residual connection branch. As shown in Fig. 3c, the Swin Transformer Module consists of two consecutive swin transformer blocks. Each swin transformer block consists of a LayerNorm layer, a multi-header self-attention module, a residual connection, and a two-layer MLP with GELU nonlinearity. In two consecutive transformer modules, a window-based multi-head self-attention (W-MSA) module and a displacement-based multi-head self-attention (SW-MSA) module are used, respectively. In addition, each Res2Swin Block contains one 1 × 1 convolution kernel and one 2 × 2 maximum pooling layer. The decoder part consists of one 1 × 1 convolution module and 4 Up Conv modules. Each Up Conv module is composed of two groups of convolution operations and one upsampling module, wherein each group of convolution operations includes one with a size of 3 × 3 convolution layer, batch normalization layer, and ReLU activation layer. The upsampling module includes one upsampling module with a magnification factor of 2 and one with a size of 3 × 3 convolution layer, batch normalization layer, and ReLU activation layer. In addition, to save computing resources, the convolution cores of the network are all deep separable convolution cores [48].
Liver tumor segmentation is a difficult task because the tumors are small and their location is uncertain. Simply relying on the network’s output and label to calculate loss value is not enough to achieve good segmentation results. Therefore, it is necessary to fully utilize the feature maps extracted by intermediate layers to strengthen the supervision of the network and accelerate the convergence speed of the model. In the decoder module, a deep supervision mechanism is introduced. The specific method is to pass the characteristic graph output from the first three levels of the decoder from bottom to top through one 3 × 3 convolution module and one upsampling module to restore the gold standard size, and the output result and the gold standard calculation loss value are weighted and added with the network final output and the gold standard calculation loss value, and the early layer is monitored through backpropagation.
The loss function used in this paper is the weighted sum of the Dice function and binary cross-entropy function (BCE). The dice loss function is used to calculate the similarity between two samples. The more the two samples overlap, the higher the Dice coefficient, and the smaller the loss value. The functions are defined as Eq. (1):
The formula
Because the Dice coefficient calculates the overlapping part, when there are many small targets and the distribution is uniform, the Dice coefficient will fluctuate greatly, making the model training unstable. Therefore, this paper introduces the binary cross entropy function (BCE), which calculates the prediction probability of each pixel in the sample. The specific function is defined as Eq. (2):
The formula
Because the BCE function predicts the probability of each pixel, it has little impact on the target when the target is small, and can effectively compensate for the shortcomings of the Dice coefficient. Therefore, this paper combines these two loss functions and adds them by weighting according to a certain proportion coefficient to get the final loss function, which is defined as Eq. (3):
after experimental analysis, the ɑ is finally determined as 0.9.
This paper uses the public dataset LiTS2017 to verify the algorithm. This data set provides 201 abdominal enhanced CT images, a total of 58638 CT slice images, and the resolution of slice cross-section is 512 × 512, in which, the intra-resolution range of CT image is 0.55~1.00 mm, and the inter resolution range is 0.45~6.00 mm. Since 70 of 201 CT images have no corresponding labels, this paper will only use 131 CT images with labels as the data set, in which 30 CT images are randomly selected as the test set, and the remaining 101 CT images are preprocessed according to Section 3.1. Finally, the preprocessed data set is randomly divided, and the ratio of the training set and verification set is 7:3.
The experimental environment of this paper is a computer platform with the operating system of Ubuntu 1804, the processor of Intel Core i9, the memory of 32 GB, and the GPU of Tesla T4. The programming language used is python 3.8, and the deep learning framework is Python 1.9. Using the AdamW optimizer, the initial learning rate is set to 1 ×
To verify the performance of the proposed network model, three commonly used evaluation indicators are used in this paper, including Average Dice Coefficient, Jaccard, Recall, and Accuracy. The Dice Coefficient is used to calculate the overlap index of prediction result X and gold standard Y, the higher the Dice Coefficient, the better the segmentation effect. See Eq. (4):
Jaccard calculates the similarity of two set elements, In the formula, A represents all elements of set A, and B represents all elements of set B. The intersection of two set elements is used as the numerator, and the union of two set elements is used as the denominator. The larger the value of the result, the better the segmentation effect. See Eq. (5):
Recall refers to the fraction of correctly detected positive pixels out of all positive pixels. Positive pixels are the ones that are correctly segmented in the image. In the formula, TP represents the number of correctly detected positive pixels and FN represents the number of missed positive pixels. The larger the value of the result, the better the segmentation effect. See Eq. (6):
Accuracy refers to the proportion of correctly predicted pixels out of all pixels in the image. In the formula, FP represents the number of pixels that are incorrectly predicted as positive. TN represents the number of pixels that are correctly predicted as negative. See Eq. (7):
4.4.1 Weight Analysis of Loss Function
To study the impact of the loss function on the segmentation accuracy, the weight coefficient of the above loss function has been analyzed, The range of ɑ is set to 0~1, and the experimental analysis is carried out in steps of 0.1. Fig. 4 (Left) shows the average Dice coefficient value obtained from liver segmentation. The line chart shows that the average Dice coefficient increases with increasing ɑ values in the intervals (0.1, 0.3] and (0.4, 1], but decreases when ɑ falls within the intervals [0, 0.1] and [0.3, 0.4]. As these intervals occur earlier in the chart and the overall trend is upward, it can be concluded that the model is unstable when ɑ is less than 0.5. Fig. 4 (Right) shows the average Dice coefficient value obtained from tumor segmentation. The line chart generally shows an upward trend when ɑ values fall within the interval [0, 0.9], but experiences fluctuations at a value of 0.7. However, when the value is greater than 0.9, the average Dice coefficient declines.
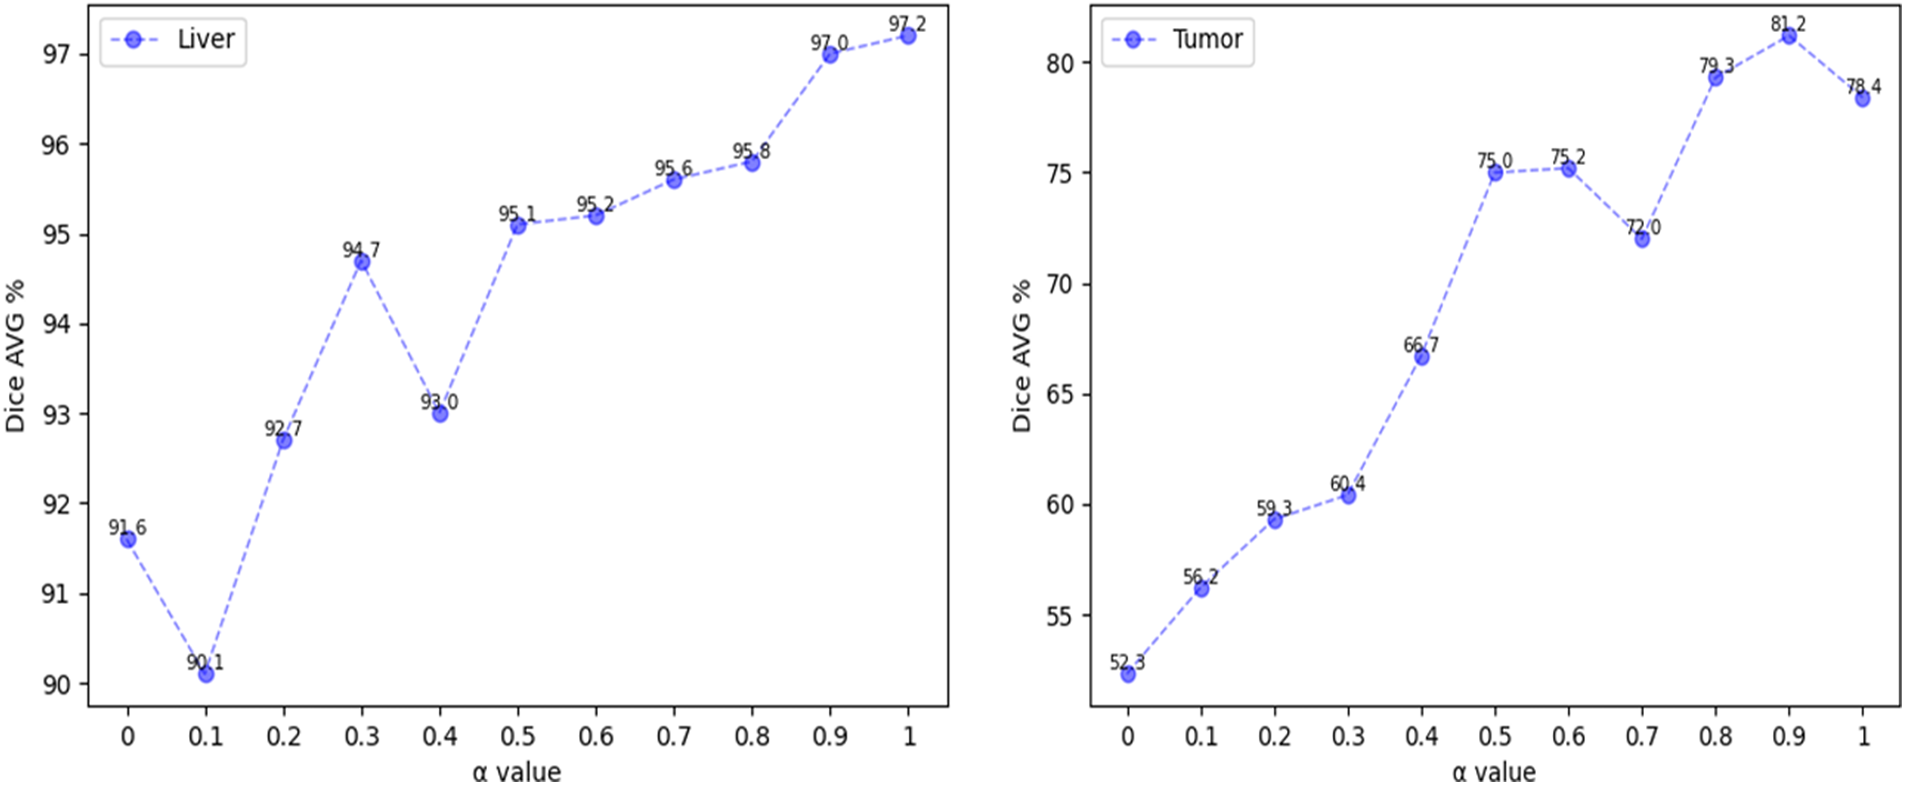
Figure 4: Change trend of dice coefficient with a weight factor
The above observations demonstrate that utilizing a combination of binary cross-entropy (BCE) and Dice coefficient, along with an appropriate ɑ value, can effectively enhance the accuracy of liver and tumor segmentation. To improve the accuracy of tumor segmentation without reducing the accuracy of liver segmentation, the weight factor of the loss function is set to 0.9, the average Dice coefficient of liver segmentation is 97%, while the average Dice coefficient of tumor segmentation is 81.2%.
4.4.2 Analysis of Training Loss Rate
Fig. 5 illustrates the loss descent trends of different models during training, with the X-axis indicating the number of training batches and the Y-axis indicating the model’s loss value. Initially, the loss values are high, and the descent speed is fast due to the model’s incomplete learning of data patterns and a higher initial learning rate. However, with an increase in training iterations, the model gradually learns data patterns, optimizes its parameters, and reduces the learning rate to stabilize the loss value. The loss descent may fluctuate, indicating potential issues such as local optima or overfitting. Overall, compared to other models, the proposed Res2Swin Unet method exhibits faster convergence, less fluctuation during descent, and better network performance.
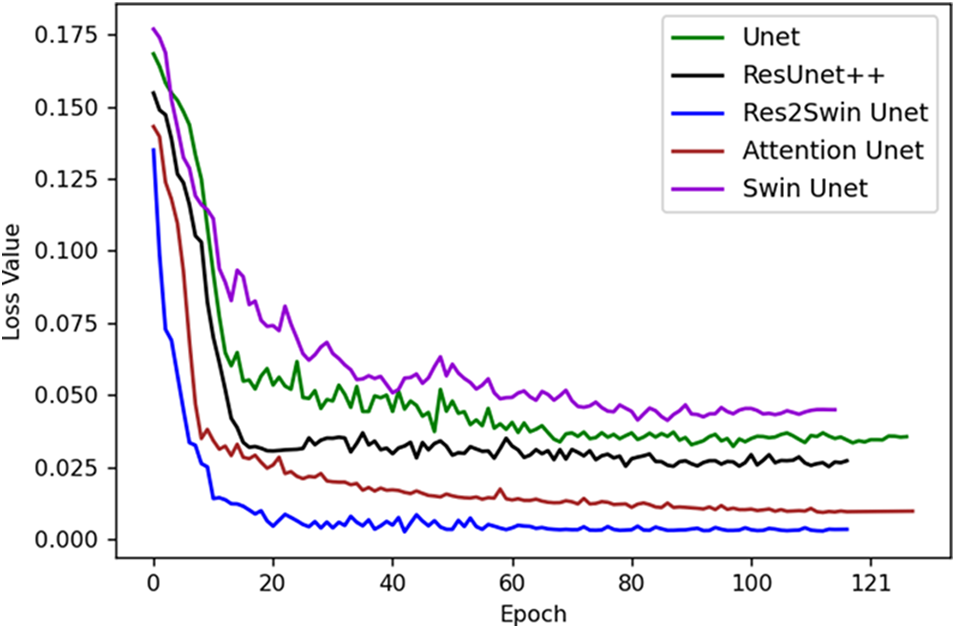
Figure 5: The decreasing trend of the loss value
Res2Swin Unet integrates Attention Res2 Module and Swin Transformer based on Unet and makes full use of multi-scale technology and self-attention mechanism to improve the segmentation accuracy of target edges and small targets. To verify the impact of the integrated modules on the segmentation effect, this paper has conducted several ablation experiments on the liver region and tumor region respectively with Unet as the benchmark. The experimental results of the liver region are shown in Table 1. It can be seen that the average Dice coefficient of the benchmark network Unet is 96.5%, while the average Dice coefficient decreases by 0.8% and 2% respectively after adding Attention Res2 Module and Swin Transformer separately, However, the average Dice coefficient of the liver region in this method increases by 0.5% after combining these two modules. This is mainly because the liver is diffusely distributed in the abdomen, occupying a large area, and the convolution operation will treat each pixel equally, regardless of its importance and content, which makes the final features contain little semantic information.
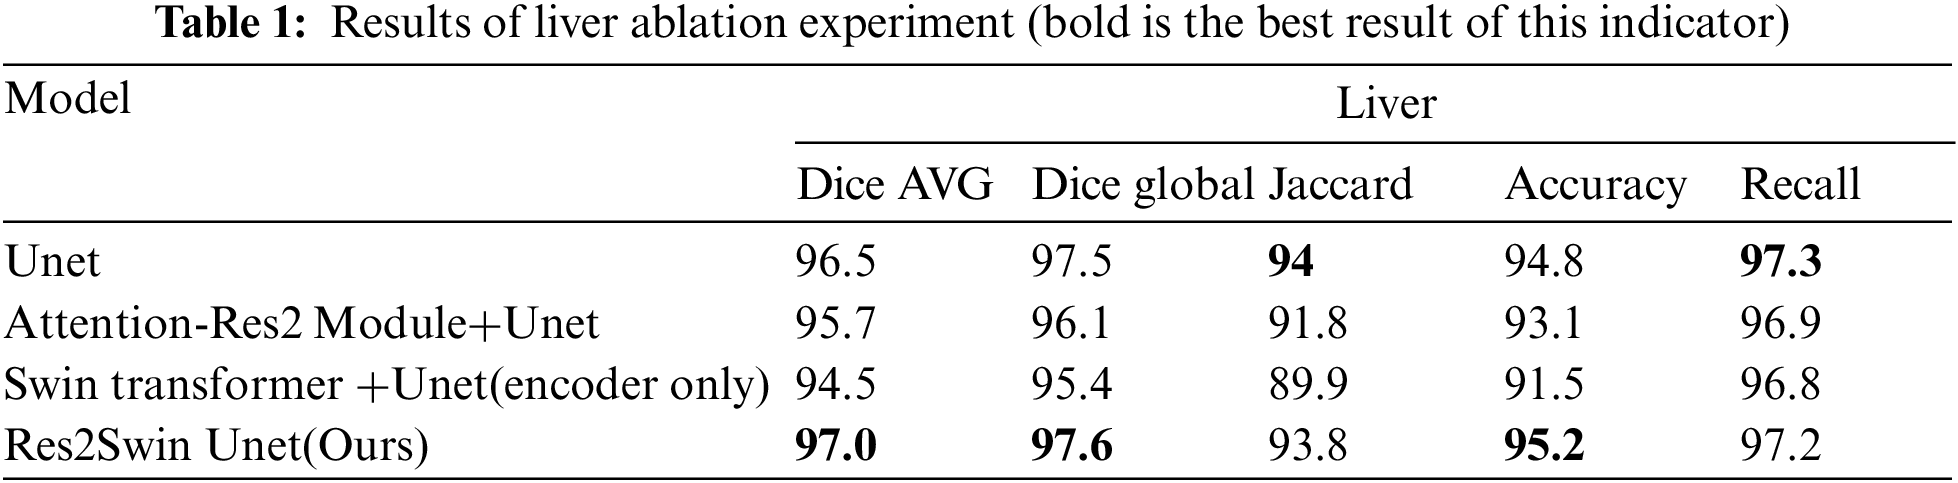
Although the Attention Res2 Module uses multi-scale technology to enlarge the receptive field and the Attention gate to inhibit the learning of unrelated areas, it still cannot effectively connect pixels over a long distance, thus ignoring the correlation information between pixels, resulting in the inability to completely segment all liver regions. Swin Transformer uses image patches as input, The global context information of the image can be obtained through the operation of the self-attention mechanism, so that the network has a global receptive field and is good at capturing long-distance dependencies, which can effectively make up for the disadvantage that the convolutional network can only focus on local information, thus improving the segmentation accuracy of the target region.
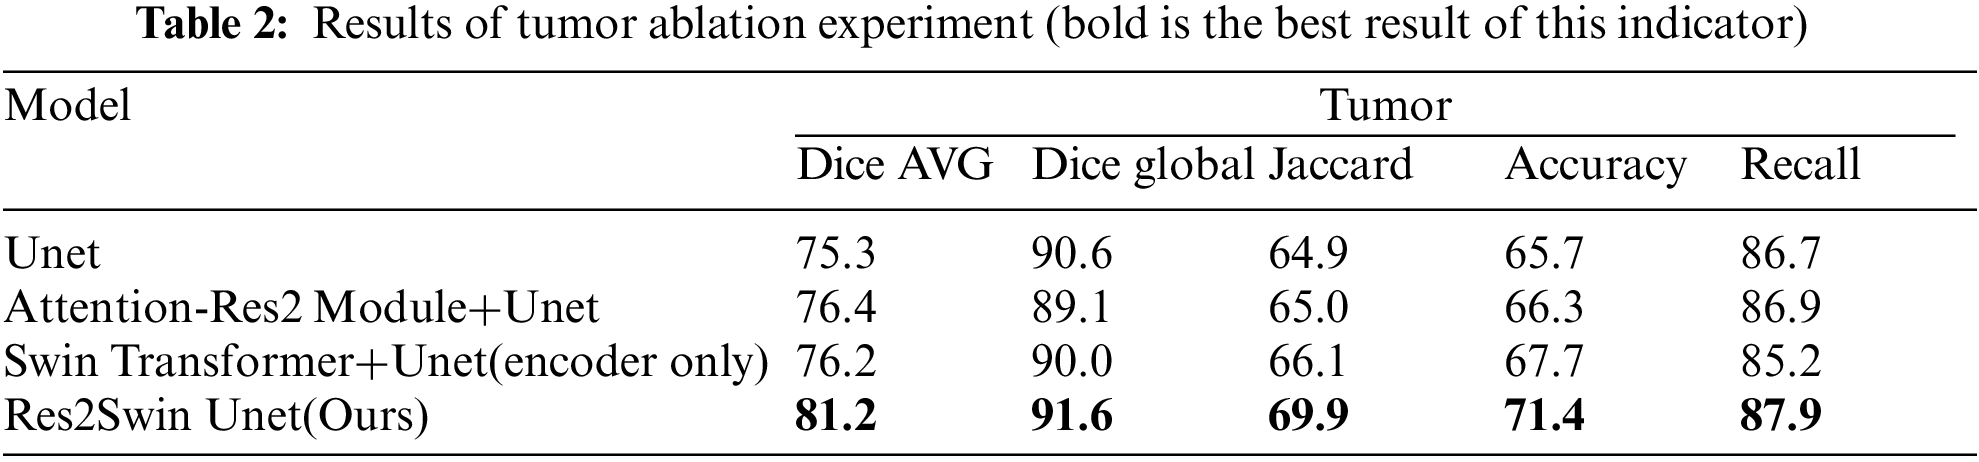
The experimental results of the tumor area are shown in Table 2. It can be seen that the average Dice coefficient obtained by using Unet as the benchmark network is 75.3%. After adding the Attention Res2 Module and Swin Transformer module separately, the average Dice coefficient has increased by 1.1% and 0.9%, respectively. After adding two modules at the same time, the average Dice coefficient increased by 5.9%. At the same time, Res2Swin Unet achieved the best results in the global Dice coefficient, Jaccard, Accuracy, and Recall evaluation indicators. This shows that the Attention Res2 Module expands the network’s receptive field and extracts small tumor features while inhibiting irrelevant region learning. Swin Transformer enhances global modeling and semantic information extraction, improving tumor recognition accuracy.
In the ablation experiment, the segmentation results of some images in the test set by each network are as shown in Fig. 6, From left to right, they are (a). the original CT image, (b). the gold standard, (c). Unet, (d) Attention-Res2 Module+Unet, (e). Swin Transformer+Unet (encoder only), (f) Res2Swin Unet (method in this paper). The figure shows that different methods can accurately segment the liver contour and roughly detect the tumor area, but in Case 4, some methods make errors. Unet and Attention Res2 Module+Unet wrongly segment the right side of the liver into a tumor, while Swin Transformer+Unet fails to recognize the tumor area in the upper left corner. The Res2Swin Unet method accurately identifies small tumors in the upper left corner without wrongly dividing the liver region into tumor regions by combining the Attention Res2 Module and the Swin Transformer module, resulting in the closest segmentation effect to the gold standard. It can be proved that this method can improve the segmentation accuracy of small tumors without reducing the segmentation accuracy of the liver after introducing Attention Res2 Module and Swin Transformer.
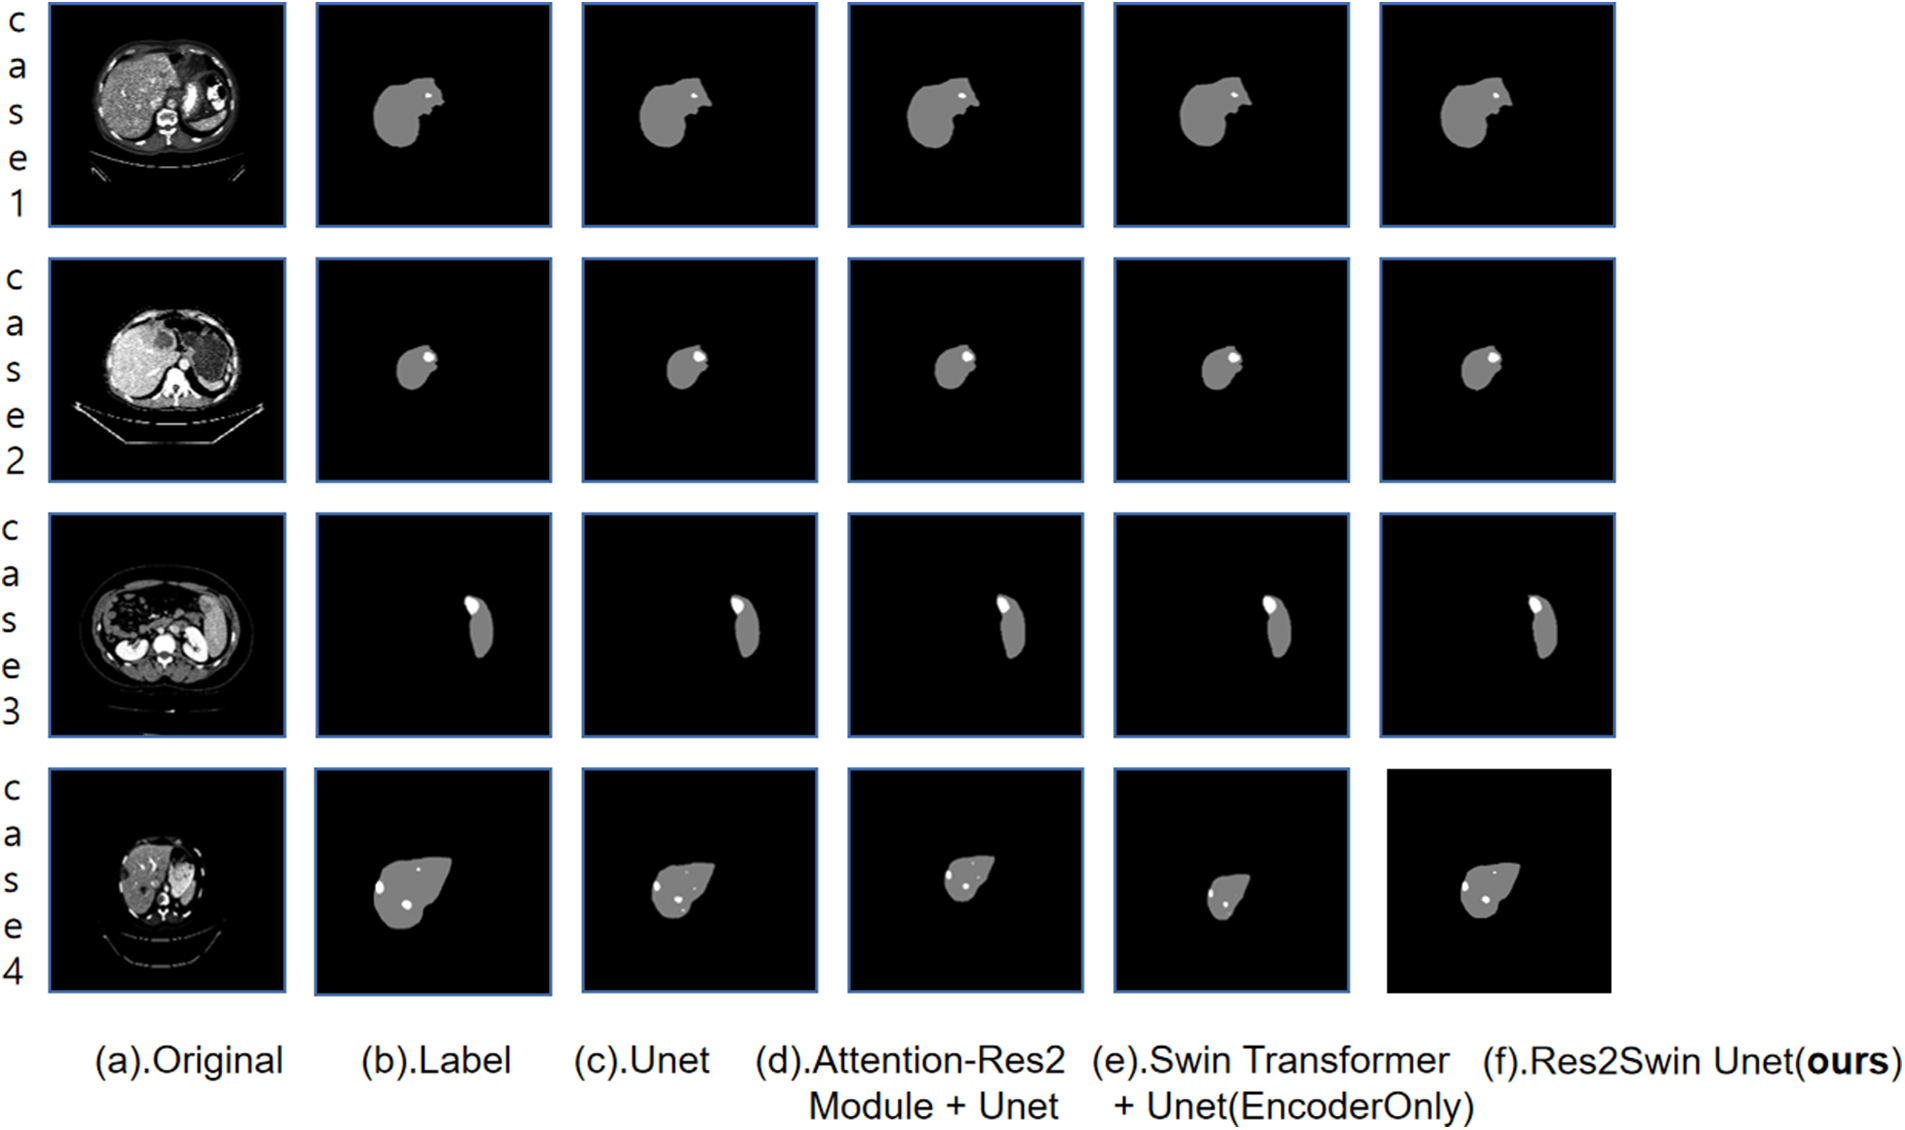
Figure 6: Results of ablation experiment segmentation
4.4.4 Liver Segmentation Results
To evaluate the segmentation performance of the proposed Res2Swin Unet method on the liver, 30 out of the 131 labeled CT images from the LiTS2017 dataset were randomly selected as the test set. The segmentation results were compared with four advanced network models in the field. In Fig. 7, gray represents the liver area and white represents the tumor area in the segmentation results of some slices from the test set. From left to right are (a). Original CT image, (b). The gold standard, (c). Unet, (d). Attention Unet, (e). ResUnet++, (f). Swin Unet, (g). Res2Swin Unet (method in this article). In Cases 1 and 3, the proposed method achieved liver segmentation results closer to the gold standard. In Case 4, the method depicted the liver outline with more detail.
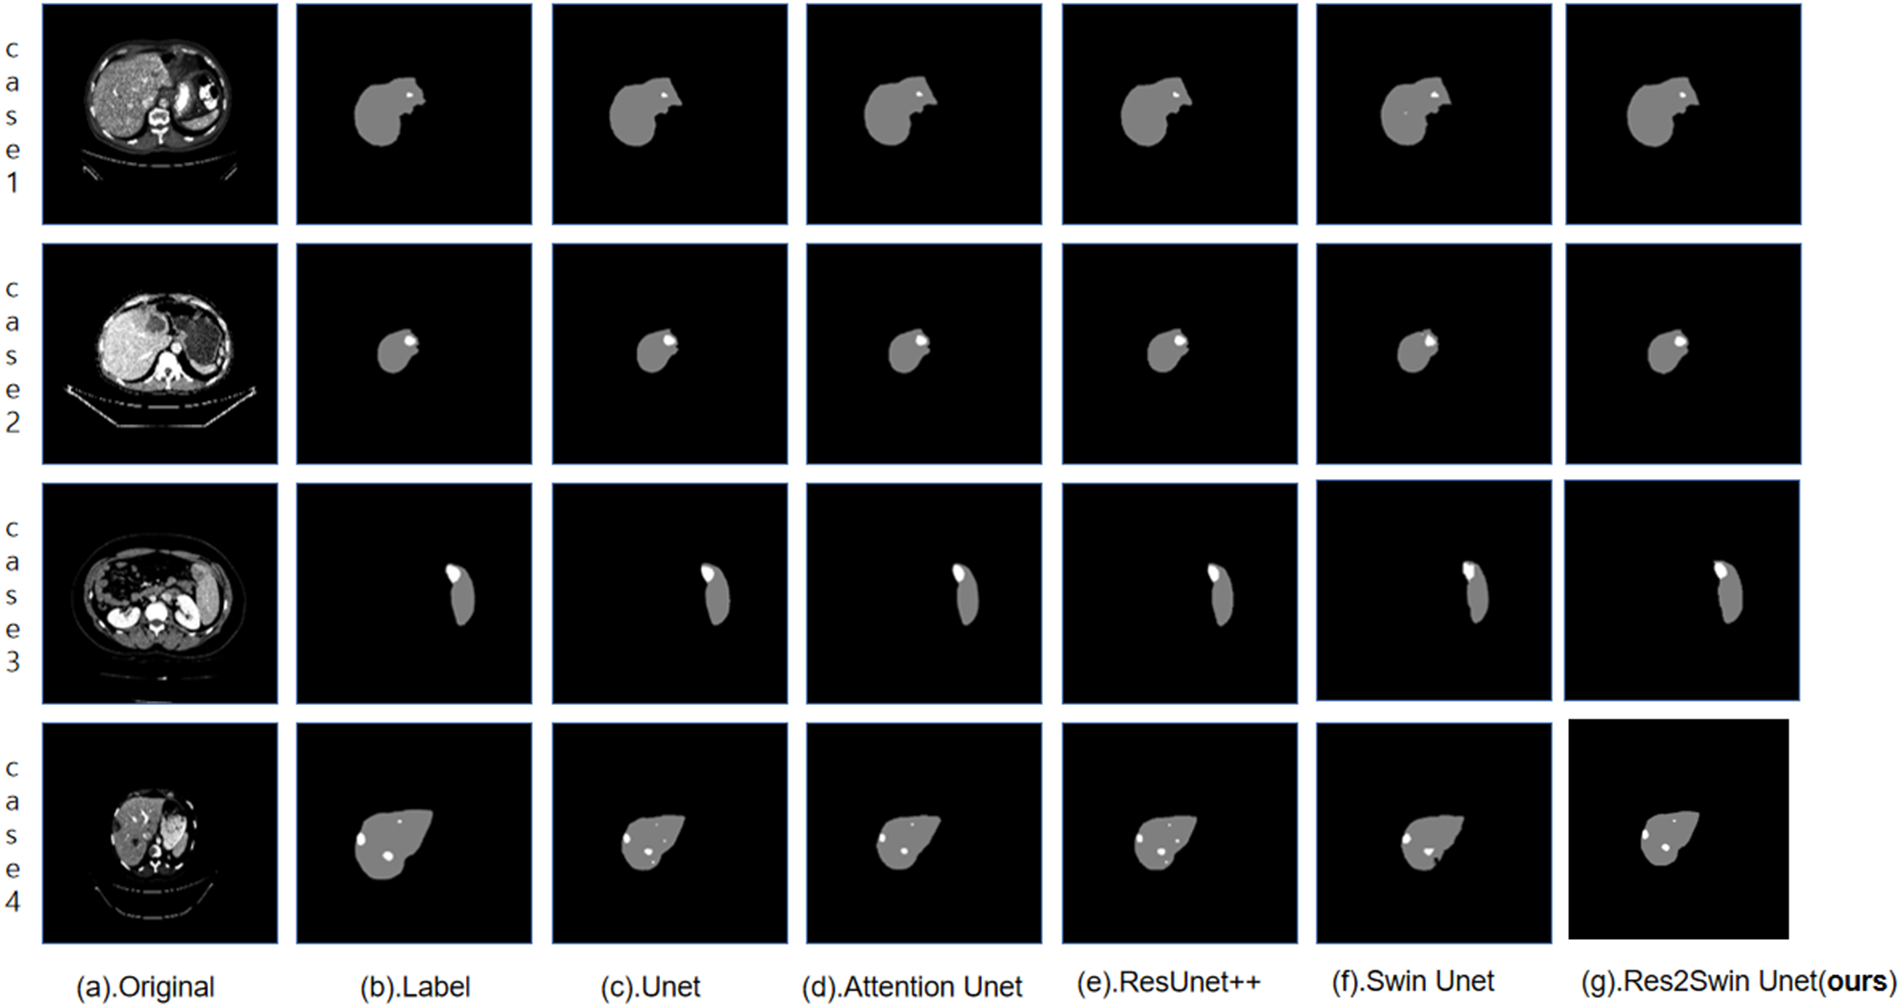
Figure 7: Compare network segmentation results
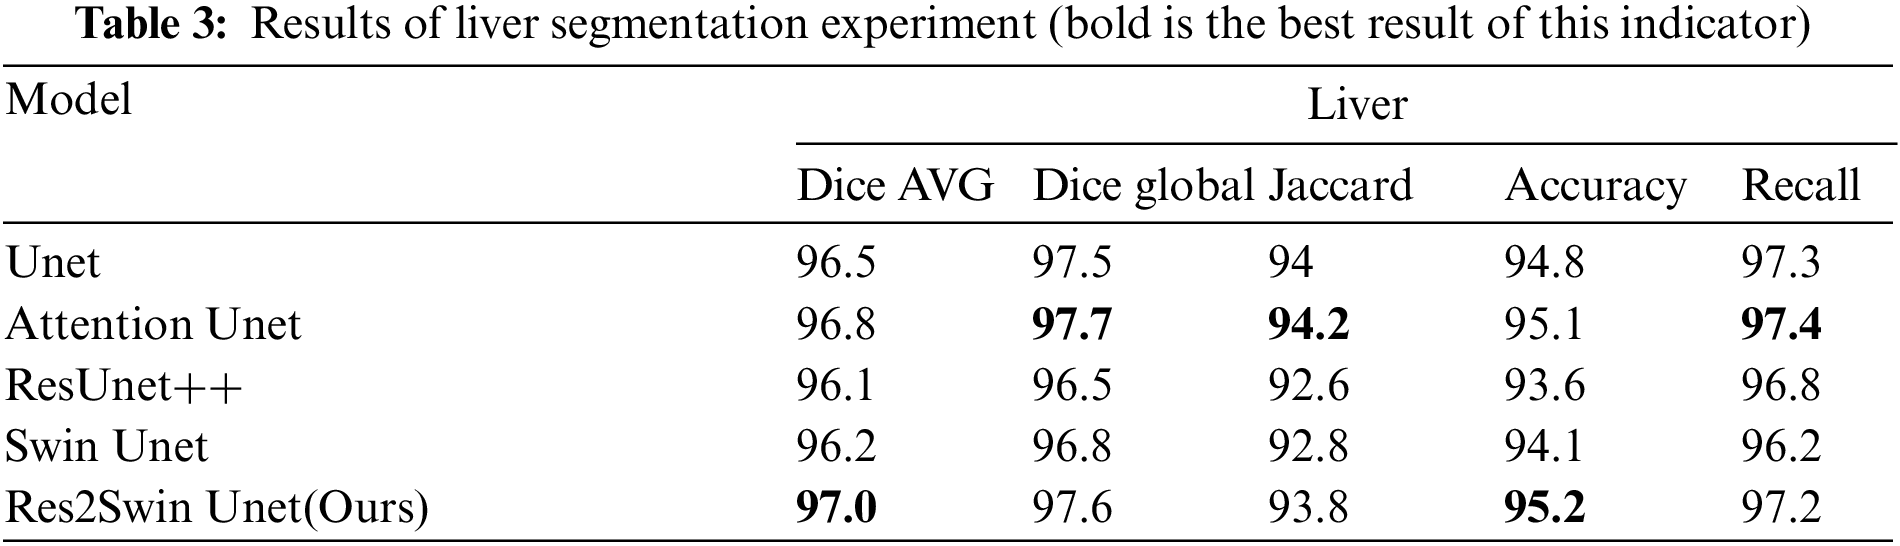
The segmentation data of the five algorithms in the liver area is shown in Table 3. It can be seen that the average Dice coefficient has increased by 0.5%, 0.2%, 0.9%, and 0.8% respectively compared to Unet, Attention Unet, ResUnet++, and Swin Unet. The global Dice coefficient and Jaccard coefficient are only lower than Attention Unet by 0.1% and 0.4%, respectively. It can be seen that the proposed Res2Swin Unet method performs liver segmentation at a similar level to the comparison networks, with finer details in the liver outline and a higher average Dice coefficient index. Because the Attention-Res2 Module can capture features at various scales and levels, improving the feature representation. The module includes a multi-scale branch to extract features at different scales and a cross-layer feature connection to retain high-level feature information. This enhances the ability to extract object boundaries and contour information. And the Attention gate also dynamically selects the most important features, reducing redundant information and improving model accuracy and robustness.
4.4.5 Tumor Segmentation Results
Fig. 7 also shows the segmentation results of different networks on the tumor. The method proposed in the paper demonstrated superior tumor segmentation compared to other networks in Case 1, Case 2, and Case 3, with results that were more consistent with the gold standard. In Case 4, Unet and ResUnet++ erroneously identified liver areas as tumors, Attention Unet segmented smaller tumors, and Swin Unet missed a small tumor in the upper left corner. However, the method proposed in the paper accurately identified small tumors without mis-segmentation, achieving results closer to the gold standard.
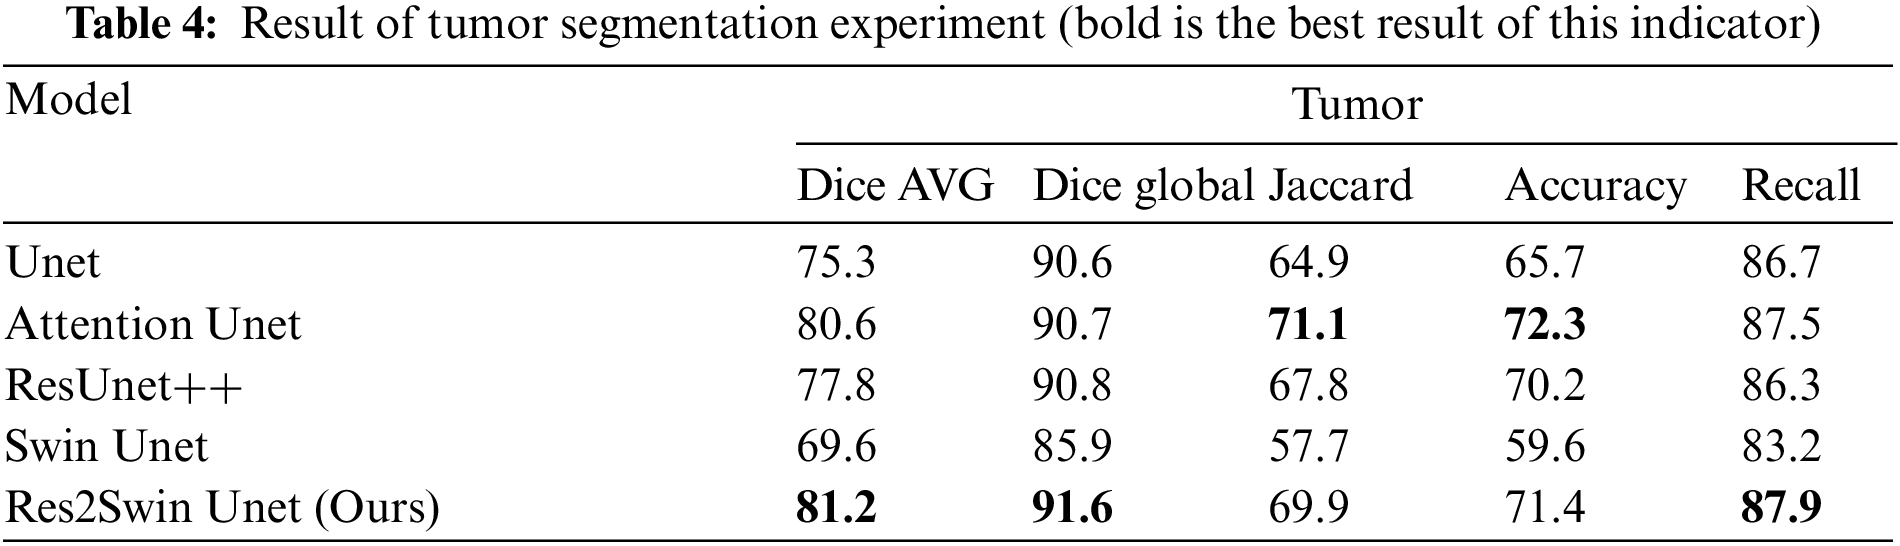
The results obtained on the evaluation index are shown in Table 4. The method in this paper is superior to other networks in terms of the average Dice coefficient, global Dice coefficient, and Recall. Compared with Unet, Attention Unet, ResUnet++, and Swin Unet, the average Dice coefficient has increased by 5.9%, 0.6%, 3.4%, and 11.6%, respectively. Res2Swin Unet’s success in accurately identifying small tumors can be attributed to its incorporation of multi-scale technology with Attention gates, which expands the model’s receptive field and suppresses feature information from irrelevant regions. Additionally, the introduction of the Swin transformer improves the model’s global modeling ability, reducing the risk of mis-segmentation.
This paper proposes a Res2Swin Unet for liver tumor segmentation. It integrates Attention Res2 Module and Swin Transformer into the Unet architecture to improve accuracy. The Attention Res2 Module splits the feature map into channels, fuses adjacent maps, and convolves them to increase the receptive field while suppressing unrelated areas. The Swin Transformer uses self-attention to capture long-distance dependencies and improve global modeling. The network is trained using depth supervision and mixed loss function to converge faster.
The added modules in the Res2Swin Unet were tested on the LiTS2017 dataset through ablation experiments to confirm their feasibility. Comparison experiments with other networks were conducted to verify the accuracy of the Res2Swin Unet. Compared to the other models, our proposed method achieves better results in both the average Dice coefficient and accuracy for liver segmentation, with values of 97% and 95.2%, respectively. For tumor segmentation, our method also outperforms other models in terms of average Dice coefficient, global Dice coefficient, and recall, with values of 81.2%, 91.6%, and 87.9%, respectively. Therefore, this method can effectively improve the segmentation accuracy of liver tumors and has a certain auxiliary role in doctors’ medical diagnoses.
Acknowledgement: None.
Funding Statement: The authors received no specific funding for this study.
Author Contributions: Study concept and design: F. Li, M. Luo; Data collection: F. Li; Analysis and interpretation of results: F. Li, M. Luo; Draft manuscript preparation: M. Luo; Review and editing: F. Li; visualization: M. Hu, G. Wang, Y. Chen.
Availability of Data and Materials: Contact the corresponding author for data and materials support.
Conflicts of Interest: The authors declare that they have no conflicts of interest to report regarding the present study.
References
1. L. P. Waller, V. Deshpande and N. Pyrsopoulos, “Hepatocellular carcinoma: A comprehensive review,” World Journal of Hepatology, vol. 7, no. 26, pp. 2648, 2015. [Google Scholar] [PubMed]
2. J. Ferlay, H. R. Shin, F. Bray, D. Forman, C. Mathers et al., “Estimates of worldwide burden of cancer in 2008: GLOBOCAN 2008,” International Journal of Cancer, vol. 127, no. 12, pp. 2893–2917, 2010. [Google Scholar] [PubMed]
3. S. Zhang, K. Sun, R. Zheng, H. Zeng, S. Wang et al., “Cancer incidence and mortality in China,” Journal of the National Cancer Center, vol. 1, no. 1, pp. 2–11, 2021. [Google Scholar]
4. W. Li, F. Jia and Q. Hu, “Automatic segmentation of liver tumor in CT images with deep convolutional neural networks,” Journal of Computer and Communications, vol. 3, no. 11, pp. 146, 2015. [Google Scholar]
5. A. M. Anter and A. E. Hassenian, “CT liver tumor segmentation hybrid approach using neutrosophic sets, fast fuzzy c-means and adaptive watershed algorithm,” Artificial Intelligence in Medicine, vol. 97, pp. 105–117, 2019. [Google Scholar] [PubMed]
6. J. D. L. Araújo, L. B. da Cruz and J. O. B. Diniz, “Liver segmentation from computed tomography images using cascade deep learning,” Computers in Biology and Medicine, vol. 140, pp. 105095, 2022. [Google Scholar]
7. F. Wang and H. Li, “Application of mean shift clustering method in traditional clothing image extraction,” Wool Textile Journal, vol. 50, no. 4, pp. 89–95, 2022. [Google Scholar]
8. S. Saifullah, R. Drezewski, A. Khaliduzzaman, L. K. Tolentino and R. Ilyos, “K-means segmentation based-on lab color space for embryo detection in incubated egg,” Jurnal Ilmiah Teknik Elektro Komputer dan Informatika, vol. 8, no. 2, pp. 175–185, 2022. [Google Scholar]
9. R. Khilkhal and M. Ismael, “Brain tumor segmentation utilizing thresholding and k-means clustering,” in 2022 Muthanna Int. Conf. on Engineering Science and Technology (MICEST), Samawah, Iraq, pp. 43–48, 2022. [Google Scholar]
10. F. Lecellier, S. Jehan-Besson and J. Fadili, “Statistical region-based active contours for segmentation: An overview,” IRBM, vol. 35, no. 1, pp. 3–10, 2014. [Google Scholar]
11. A. Baâzaoui, W. Barhoumi, A. Ahmed and E. Zagrouba, “Semi-automated segmentation of single and multiple tumors in liver ct images using entropy-based fuzzy region growing,” IRBM, vol. 38, no. 2, pp. 98–108, 2017. [Google Scholar]
12. S. L. Bangare, “Classification of optimal brain tissue using dynamic region growing and fuzzy min-max neural network in brain magnetic resonance images,” Neuroscience Informatics, vol. 2, no. 3, pp. 100019, 2022. [Google Scholar]
13. A. Hoogi, C. F. Beaulieu, G. M. Cunha, E. Heba and C. B. Sirlin, “Adaptive local window for level setsegmentation of CT and MRI liver lesions,” Medical Image Analysis, vol. 37, pp. 46–55, 2017. [Google Scholar] [PubMed]
14. S. Feng, “Effective document image binarization via a convex variational level set model,” Applied Mathematics and Computation, vol. 419, pp. 126861, 2022. [Google Scholar]
15. M. M. Abdelsamea, G. Gnecc and M. M. Gaber, “An efficient self-organizing active contour model for image segmentation,” Neurocomputing, vol. 149, pp. 820–835, 2015. [Google Scholar]
16. H. E. Yaru and H. W. Ge, “Image segmentation algorithm combining visual salient regions and active contour,” Journal of Frontiers of Computer Science and Technology, vol. 16, no. 5, pp. 1155, 2022. [Google Scholar]
17. A. Das, P. Das, S. S. Panda and S. Sabut, “Adaptive fuzzy clustering-based texture analysis for classifying liver cancer in abdominal CT images,” International Journal of Computational Biology and Drug Design, vol. 11, no. 3, pp. 192–208, 2018. [Google Scholar]
18. W. Wu, S. Wu, Z. Zhou, R. Zhang and Y. Zhang, “3D liver tumor segmentation in CT images using improved fuzzy C-means and graph cuts,” BioMed Research International, vol. 2017, pp. 1–11, 2017. [Google Scholar]
19. O. F. Abd-Elaziz, M. S. Sharaf and M. I. Abdullah, “Liver tumors segmentation from abdominal CT images using region growing and morphological processing,” in 2014 Int. Conf. on Engineering and Technology (ICET), Cairo, Egypt, pp. 1–6, 2014. [Google Scholar]
20. L. Xu, Y. Zhu, Y. Zhang and H. Yang, “Liver segmentation based on region growing and level set active contour model with new signed pressure force function,” Optik, vol. 202, pp. 163705, 2020. [Google Scholar]
21. K. Sridhar, W. C. Lai and B. P. kavin, “Detection of liver tumour using deep learning based segmentation with coot extreme learning model,” Biomedicines, vol. 11, no. 3, pp. 800, 2023. [Google Scholar] [PubMed]
22. M. Chen, W. Liu, T. Wang, S. Zhang and A. Liu, “A game-based deep reinforcement learning approach for energy-efficient computation in MEC systems,” Knowledge-Based Systems, vol. 235, pp. 107660, 2022. [Google Scholar]
23. X. Zhu, Y. Luo, A. Liu, N. Xiong, M. Dong et al., “A deep reinforcement learning based resource management game in vehicular edge computing,” IEEE Transactions on Intelligent Transportation Systems, vol. 23, no. 3, pp. 2422–2433, 2022. [Google Scholar]
24. W. Mo, W. Liu, G. Huang, N. Xiong, A. Liu et al., “A cloud-assisted reliable trust computing scheme for data collection in internet of things,” IEEE Transactions on Industrial Informatics, vol. 18, no. 7, pp. 4969–4980, 2022. [Google Scholar]
25. J. Zhang, Q. Qin, Q. Ye and T. Ruan, “ST-Unet: Swin transformer boosted U-Net with cross-layer feature enhancement for medical image segmentation,” Computers in Biology and Medicine, vol. 153, pp. 106516, 2023. [Google Scholar] [PubMed]
26. O. Ronneberger, P. Fischer and T. Brox, “Unet: Convolutional networks for biomedical image segmentation,” in Proc. of Medical Image Computing and Computer-Assisted Intervention, Munich, Germany, pp. 234–241, 2015. [Google Scholar]
27. X. Liu, L. Yang, J. Chen, J. Yu and K. Li, “Region-to-boundary deep learning model with multi-scale feature fusion for medical image segmentation,” Biomedical Signal Processing and Control, vol. 71, pp. 103165, 2022. [Google Scholar]
28. O. Oktay, J. Schlemper, L. L. Folgoc, M. Lee, M. Heinrich et al., “Attention U-Net: Learning where to look for the pancreas,” arXiv preprint arXiv:1804.03999, 2018. [Google Scholar]
29. D. Jha, P. H. Smedsrud, D. Johansen, T. D. Lange, H. D. Johansen et al., “A comprehensive study on colorectal polyp segmentation with ResUNet++, conditional random field and test-time augmentation,” IEEE Journal of Biomedical and Health Informatics, vol. 25, no. 6, pp. 2029–2040, 2021. [Google Scholar] [PubMed]
30. J. Hu, L. Shen and G. Sun, “Squeeze-and-excitation networks,” in Proc. of Computer Vision and Pattern Recognition, Salt Lake City, USA, pp. 7132–7141, 2018. [Google Scholar]
31. L. Chen, G. Papandreou, F. Schroff and H. Adam, “Rethinking atrous convolution for semantic image segmentation,” arXiv preprint arXiv:1706.05587, 2017. [Google Scholar]
32. H. Cao, Y. Wang, J. Chen, D. Jiang, X. Zhang et al., “Swin-Unet: Unet-like pure transformer for medical image segmentation,” in Computer Vision—ECCV, 2022 Workshops, vol. 13803, pp. 205–218, 2023. [Google Scholar]
33. Y. Gao, M. Zhou, D. Liu, Z. Yan, S. Zhang et al., “A data-scalable transformer for medical image segmentation: Architecture, model efficiency, and benchmark,” arXiv preprint arXiv: 2203.00131, 2022. [Google Scholar]
34. C. Lee, S. Xie, P. Gallagher, Z. Zhang and Z. Tu, “Deeply-supervised nets,” PMLR, vol. 38, pp. 562–570, 2015. [Google Scholar]
35. F. Yu and V. Koltun, “Multi-scale context aggregation by dilated convolutions,” arXiv preprintarXiv: 1511. 07122, 2015. [Google Scholar]
36. C. Szegedy, W. Liu, Y. Jia, P. Sermanet, S. Reed et al., “Going deeper with convolutions,” in Proc. of CVPR, Boston, USA, pp. 1–9, 2015. [Google Scholar]
37. K. He, X. Zhang, S. Ren and J. Sun, “Spatial pyramid pooling in deep convolutional networks for visual recognition,” IEEE Transactions on Pattern Analysis and Machine Intelligence, vol. 37, no. 9, pp. 1904–1916, 2015. [Google Scholar] [PubMed]
38. L. Chen, Y. Zhu, G. Papandreou, F. Schroff and H. Adam, “Encoder-decoder with atrous separable convolution for semantic image segmentation,” in Proc. of ECCV, Munich, Germany, pp. 801–818, 2018. [Google Scholar]
39. S. Gao, M. Cheng, K. Zhao, X. Zhang, M. Yang et al., “Res2Net: A new multi-scale backbone architecture,” IEEE Transactions on Pattern Analysis and Machine Intelligence, vol. 43, no. 2, pp. 652–662, 2019. [Google Scholar]
40. X. Xie, X. Pan, F. Shao, W. Zhang and J. An, “MCI-Net: Multi-scale context integrated network for liver CT image segmentation,” Computers and Electrical Engineering, vol. 101, pp. 108085, 2022. [Google Scholar]
41. Y. Chen, X. Zhu, Y. Li, Y. Wei and L. Ye, “Enhanced semantic feature pyramid network for small object detection,” Signal Processing: Image Communication, vol. 113, pp. 116919, 2023. [Google Scholar]
42. A. Vaswani, N. Shazeer, N. Parmar, J. Uszkoreit, L. Jones et al., “Attention is all you need,” Advances in Neural Information Processing Systems, vol. 30, pp. 5998–6008, 2017. [Google Scholar]
43. A. Dosovitskiy, L. Beyer, A. Kolesnikov, D. Weissenborn, X. Zhai et al., “An image is worth 16 x 16 words: Transformers for image recognition at scale,” arXiv preprint arXiv:2010.11929, 2020. [Google Scholar]
44. Z. Liu, Y. Lin, Y. Cao, H. Hu, Y. Wei et al., “Swin transformer: Hierarchical vision transformer using shifted windows,” in Proc. of ICCV, Montreal, Canada, pp. 10012–10022, 2021. [Google Scholar]
45. P. Bilic, P. Christ, H. B. Li, E. Vorontsov, A. Ben-Cohen et al., “The liver tumor segmentation benchmark (lits),” Medical Image Analysis, vol. 84, pp. 102680, 2023. [Google Scholar] [PubMed]
46. P. Lv, J. Wang and H. Wang, “2.5D lightweight RIU-Net for automatic liver and tumor segmentation from CT,” Biomedical Signal Processing and Control, vol. 75, pp. 103567, 2022. [Google Scholar]
47. M. Z. Alom, C. Yakopcic, M. Hasan, T. M. Taha and V. K. Asari, “Recurrent residual U-Net for medical image segmentation,” Journal of Medical Imaging, vol. 6, no. 1, pp. 014006, 2019. [Google Scholar] [PubMed]
48. F. Chollet, “Xception: Deep learning with depthwise separable convolutions,” in Proc. of CVPR, Honolulu, Hawaii, USA, pp. 1251–1258, 2017. [Google Scholar]
Cite This Article
 Copyright © 2023 The Author(s). Published by Tech Science Press.
This work is licensed under a Creative Commons Attribution 4.0 International License , which permits unrestricted use, distribution, and reproduction in any medium, provided the original work is properly cited.
 Downloads
 Citation Tools