
 Submit a Paper
 Propose a Special lssue
 Open Access
ARTICLE
Fine-Tuned Extra Tree Classifier for Thermal Comfort Sensation Prediction
1 Department of Computer Engineering and Networks, College of Computer and Information Sciences, Jouf University, Sakaka, 72388, Saudi Arabia
2 School of Telecommunication Engineering, Suranaree University of Technology, Nakhon Ratchasima, 30000, Thailand
3 Department of Management Information Systems, Prince Sattam Bin Abdulaziz University, Al Kharaj, Riyadh, Saudi Arabia
4 Information Systems Department, Faculty of Management, Comenius University in Bratislava, Odbojárov, Bratislava, 440, Slovakia
5 Faculty of Computers & Information Technology, Computer Science Department, University of Tabuk, Tabuk, 71491, Saudi Arabia
6 Department of Computer Science and Software Engineering, International Islamic University, Islamabad, 44000, Pakistan
7 Department of Electrical Engineering, College of Engineering, Jouf University, Sakaka, 72388, Saudi Arabia
* Corresponding Authors: Chitapong Wechtaisong. Email: ; Natalia Kryvinska. Email:
Computer Systems Science and Engineering 2024, 48(1), 199-216. https://doi.org/10.32604/csse.2023.039546
Received 04 February 2023; Accepted 23 May 2023; Issue published 26 January 2024
A correction of this article was approved in:
Correction: Fine-Tuned Extra Tree Classifier for Thermal Comfort Sensation Prediction
Read correction
 View Full Text
 Download PDF
Abstract
Thermal comfort is an essential component of smart cities that helps to upgrade, analyze, and realize intelligent buildings. It strongly affects human psychological and physiological levels. Residents of buildings suffer stress because of poor thermal comfort. Buildings frequently use Heating, Ventilation, and Air Conditioning (HVAC) systems for temperature control. Better thermal states directly impact people’s productivity and health. This study revealed a human thermal comfort model that makes better predictions of thermal sensation by identifying essential features and employing a tuned Extra Tree classifier, MultiLayer Perceptron (MLP) and Naive Bayes (NB) models. The study employs the ASHRAE RP-884 standard dataset for experimentation and analysis, which is available to the public. Exploratory Data Analysis (EDA) is performed to examine the outliers and anomalies in the dataset. The Synthetic Minority Over-Sampling Technique (SMOTE) enhances the minority class’s interpretation. The proposed Extra Tree classifier outperforms by achieving an accuracy of 94%. The experiment shows that the suggested model is superior to other established methods and state-of-the-art.Keywords
The advent of digital transformation has made it possible for smart cities to offer amenities like intelligent healthcare systems, secure neighborhoods, smart homes, smart transit, and smart buildings [1–5]. In smart buildings, smart homes/rooms are the optimal choices to monitor and assess the health of residents [6,7]. Thermal comfort is a crucial application of smart cities to enhance, monitor, and provide the realization of intelligent buildings [8–10].
Designing thermal control is crucial for creating high-quality living and working spaces since occupants can only be at ease when the temperature and humidity levels are in the range of thermal comfort [11]. However, the environmental temperature may change significantly, which causes the indoor thermal temperature to fluctuate and causes the inhabitants discomfort [12,13]. Thermal comfort greatly influences human psychological and physiological levels. According to the American Society of Heating, Refrigerating, and Air-Conditioning Engineers (ASHRAE) Standard 55, thermal comfort is a psychological state that communicates contentment with the thermal environment. Additionally, thermal comfort differs in many climatic regions and geographic places. Residents of the same buildings confronted with the same environment may have differing opinions on the level of thermal comfort [14].
HVAC systems are frequently utilized to regulate the temperature inside buildings. The high energy consumption of HVAC systems, which makes buildings account for 20% to 40% of all energy usage, is one of the systems’ significant potential downsides [15]. By modifying the breakpoints for average temperature, the HVAC system regulates the building’s thermal environment, which will also alter that much energy it uses. Building thermal regulation is thus required to ensure a suitable indoor thermal environment. However, if the HVAC systems’ breakpoints are incorrect, people could feel cold or hot even though more power may be used. Hence, it is crucial to evaluate ways to lower HVAC system energy use without compromising occupant comfort, especially given the high cost of electricity, rising electricity usage, and increased environmental degradation. Building thermal control is influenced by several elements. These variables can be divided into three groups: variables relating to HVAC systems, variables relating to the thermal environment of buildings, and variables relating to people. Building structures, indoor and outdoor temperatures, and heat sources affect the buildings’ thermal surroundings. These variables influence the dynamic variations in building thermal conditions [16].
The capacity to feel temperature declines with growing old or disease. Older people have more difficulty perceiving a quick temperature shift than young people. They are highly susceptible to severe drops in temperature, like frostbite [17], which in some circumstances can result in death due to this delayed perception. Frostbite is when the human body produces less heat than its absorption. The entire amount of energy the human body produces and expends is measured by its metabolic rate. People typically become less sensitive to the cold and heat of surfaces with age. This is primarily due to the body’s slower response in the lower regions, which regulate the core temperature [8].
Motivation: The study aims to promote human thermal comfort by emphasizing essential traits and enhancing thermal experience predictions. Creating an ML model that can precisely predict smart buildings’ temperature based on HVAC systems is one of the objectives. Several techniques are used for controlling building temperature and power optimization [18]. Different techniques, such as Proportional Integrate Derivative (PID) [19], Model Predictive Control (MPC) and Fuzzy Control [20,21], and Linear-Quadratic Regulator [22]. Simulating the intricate nature of the thermal dynamics and the different affecting elements with these methodologies takes much work. These techniques also need a control policy specially designed for the designated environments. Another research branch employed a learning-based technique, Machine Learning (ML), to learn the best control strategy. Even though various models employing ML algorithms have been presented for thermal sensation, the most crucial factor that may correctly assess thermal comfort while considering both psychological and physical elements is still an open research area [23–26]. This study suggests a model of human thermal comfort that, by emphasizing key characteristics and using a tuned Extra Tree classifier, improves predictions of thermal experience.
The research’s primary contribution is further down in the list form:
• This paper proposes a human thermal comfort model that enhances predictions of thermal experience by concentrating on crucial traits and employing a tuned Extra Tree classifier.
• The ASHRAE RP-884 standard dataset is used in this study, and exploratory data analysis techniques such as skewed data, categorical distribution, and data cleaning are applied to visualize all features in the dataset. Preprocessing technique SMOTE is applied to balance minority classes in the dataset.
• The proposed Extra Tree classifier performs better by reaching an accuracy of 0.94%. The experiment results demonstrate the proposed model’s superiority over other widely used techniques and effectively increase the rate of thermal comfort detection.
The following sections comprise the paper: The heat balancing and machine learning methodologies for analyzing the thermal comfort model are described in Section 2. Section 3 explains the proposed work’s research methodology using the ASHRAE RP-884 standard dataset and ML model. The findings are explained and discussed in Section 4. The conclusion of the work and suggestions for further research are included in Section 5.
In the literature, numerous models account for physiological, ecological, and psychological factors to predict human temperature feelings. These models, sometimes called Predictive Mean Vote (PMV) values, compute the necessary to forecast the average value of the votes for a collection of residents on a thermal perception scale according to the output with varied degrees of accuracy. We separated the literature into two categories: ML techniques to anticipate thermal comfort sensations and the heat balance approach.
Implement a simulation system for building thermal control and test the performance in various configurations to gauge the performance [10,11]. The author presents the building thermal control in [27] as a cost-detraction issue that considers both the inhabitants’ thermal comfort and the power use of the HVAC system. The author uses Deep Deterministic Policy Gradients (DDPG) to learn the thermal control policy after initially using a deep neural network-based approach to anticipate the occupants’ thermal comfort to address the challenge. The experiment’s findings demonstrate that the proposed method may increase the precision of thermal comfort predictions, lower HVAC energy usage, and increase thermal comfort for occupants.
The occupants’ contentment with the thermal environment is reflected in their thermal comfort [28]. Thermal comfort models are proposed to forecast the occupants’ happiness under specific thermal conditions to evaluate thermal comfort objectively. Thermal comfort is evaluated subjectively since the occupants’ subjective experiences in a specific thermal environment. Many participants will be asked to rate how satisfied they are in a variety of thermal situations, including neutral (0), cool (−1), warm (1), cold (−2), and hot (2). The data can then be fitted using some mathematical or heuristic methods.
Different transfer learning techniques are proposed in [29,30] to reduce energy consumption in smart buildings. When there are insufficient previous training data, paper [30] used a novel transfer learning technique to improve occupancy forecast accuracy. Three office spaces in an educational institution are used as a case study for the proposed strategy and models. The data sets employed in this study are gathered from Newcastle University’s Urban Sciences Building (USB). ML algorithms have been compared to the outcomes of the suggested transfer learning technique. The findings demonstrate that the proposed model accurately works. The author’s goal in this study [31] is to improve thermal comfort forecasting accuracy and tackle the data-shortage issue. To discover patterns of thermal comfort, the author uses sensor data from numerous cities in the same temperature zone. To overcome the challenges associated with data inadequacy, the researcher utilizes transfer learning to apply learning from the source domain to the target domain [32].
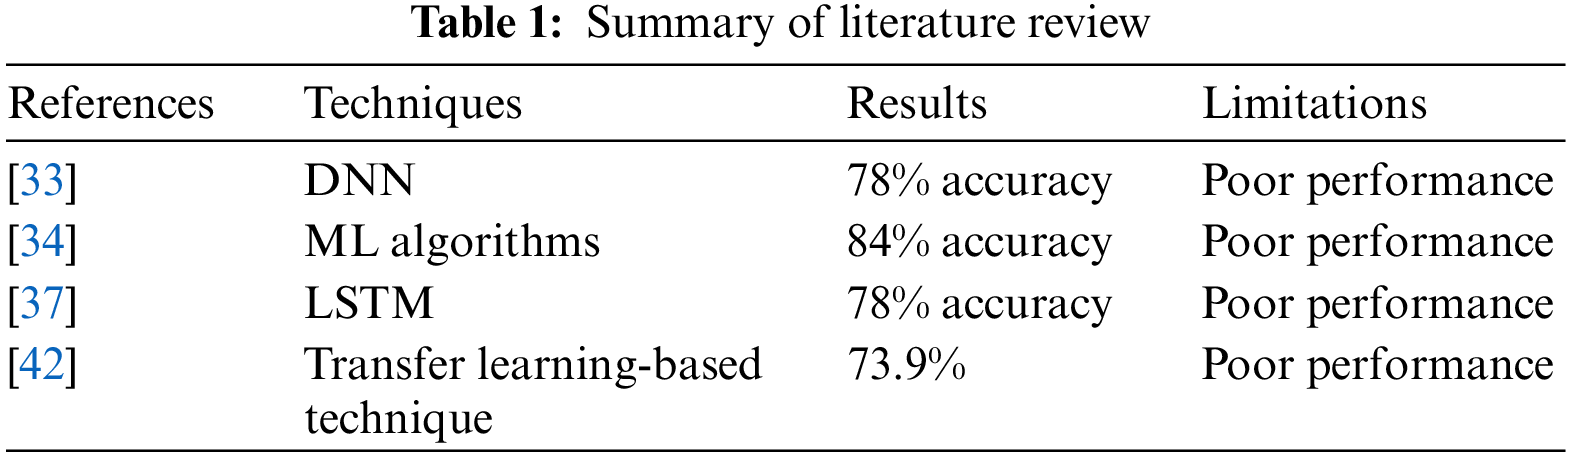
The researchers in [33] aimed to assist facility managers in anticipating thermal sensations under conditions. For prediction, a data-driven methodology is used on the gathered dataset, such as the ASHRAE Global Thermal Comfort. The proposed methodology is based on a Deep Neural Network (DNN) algorithm. The Bayesian algorithm is applied to optimize the hyperparameter of the DNN model. The proposed methodology, with an accuracy of 78%, performed well compared to traditional approaches.
According to a framework with three aspects: sensing, forecasting, and controlling, the research [34] conducted a literature review to compile modern inmate thermal comfort methods. Various factors and data-gathering devices were used to support the concept. The top three often used input elements for predicting the thermal environment among all the available variables are inhabitants’ feedback on their comfort level, body temperature, and ambient temperature. Using the ML algorithm, the proposed model achieved an accuracy of 84%.
2.2 Machine Learning-Based Techniques
Machine learning techniques consider behavioral, psychological, and physiological variables for thermal comfort [8,23]. The author utilized deep learning [35,36] and a time-series-based technique to predict temperature preferences by framing the challenge as a multivariate, multi-class classification problem. Integrate a Normalized Long Short Term (LSTM) with l1 regularization. Using a memory network to prevent overfitting and use this model’s attentional processes. An experiment is conducted on fourteen issues, and evaluation measurements such as accuracy, F1-score, and Area Under the Curve (AUC) are utilized. The proposed model performed well with 78% accuracy [37].
Modeling of user behavior using a Markov decision process. The author in [38] proposed a rule reinforcement learning model to explain how people change their clothes and thermostat settings. The MDP includes user behavior and several impact factors in the activity and state space. The user actions are intended to create a friendlier atmosphere. MATLAB language is used in the reinforcement learning model. Q-learning is employed to train the model on the used dataset. Following training, the model correctly predicted behavior involving thermostat set point adjustments with an R2 of 0.75 to 0.8. The proposed model consistently predicted the user’s actions with an R2 between 0.73 and 0.8; the MAE has been typically less than 1.1 °C (2 °F). In an office space, the mean absolute error has been below 1.1 °C (2 °F). This research also applied the RL model’s behavioral insights to various HVAC control techniques in other office spaces. From corporate buildings to residential properties, the model similarly achieved an R2 over 0.6.
A building power consumption forecast and evaluation approach based on the machine and deep learning network to address the problem of low prediction accuracy caused by inadequate management of existing building energy usage forecasting models is provided in the studies [39,40]. Two Neural Network (NN) algorithms were employed in this paper [41] to forecast the thermal comfort of older adults. The two algorithms’ efficacy was evaluated to determine which NN method would be more effective. The findings demonstrated a relationship between the two systems’ prediction accuracy and the additional influencing factors. The RBF NN algorithm is the most precise in predicting older subjects’ heat sensitivity. The primary criteria were body fat percentage, wind direction, and mean body temperature.
The author presented a Heterogeneous Transfer learning-based methodology for thermal comfort simulation. Firstly, the author includes extra important parameters as modeling features to resolve the parameter sufficiency problem. Second, use deep transfer learning models to train the thermal comfort model, which will benefit from the transferred knowledge from the used datasets, to lessen the effects of the data inadequacy problem. Due to the adaptability of learning-based techniques, the number of modeling features can be increased by attaching newly discovered thermal comfort factors. The research uses the HTL idea to effectively transfer knowledge among heterogeneous environments, which are diverse but related datasets with varying features due to the diversity of the features across various datasets. A five-month data-gathering experiment is carried out to validate the approach and create the datasets. The results demonstrate that the proposed model achieved an average accuracy of 73.9% [42].
Heat balancing methods have some issues that cannot be disregarded. They conduct their study only on one age group, primarily in an office setting. Furthermore, they should have examined how location, age, and weather impacted their findings. Additionally, the proposed model is static and does not evolve in response to environmental changes. In essence, many limits are being addressed by utilizing heat balancing approaches, machine learning techniques, and a range of datasets to test the generalizability of methodologies. Different optimization techniques also consider behavioral, psychological, and physiological variables for thermal comfort [43–47]. The summary of the literature review is provided in Table 1.
This section details the proposed methodology step, such as experimental dataset, Exploratory Data Analysis, balance data with SMOTE, and classification model. Fig. 1 demonstrates these steps of the suggested model. The ASHRAE RP-884 dataset was compiled through a series of field surveys conducted at 160 distinct building locations worldwide. Next, we preprocess the data by employing EDA techniques such as skewed data and cleaning the data using Z-score. After this phase, the data are balanced by either oversampling the minority class or under sampling the majority class using SMOTE. Next, Train the Extra Tree classifier used for thermal comfort sensation prediction. This study experimented with a Jupyter Notebook using Anaconda. This testing set shows how programmers can create and evaluate ML models on a structured framework.
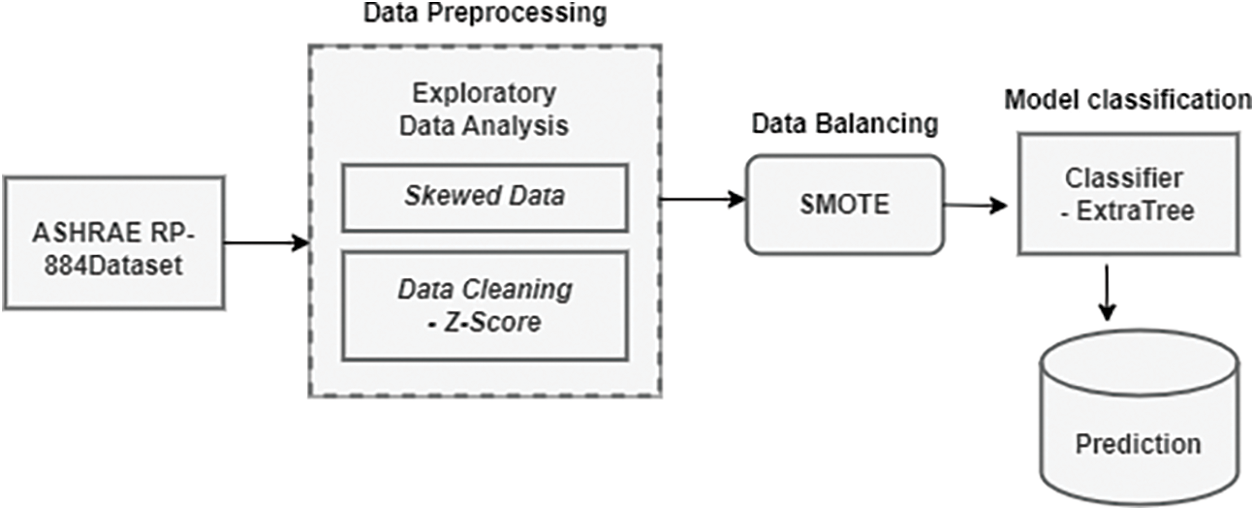
Figure 1: Proposed thermal comfort model overview
Data preprocessing is essential since it improves the model’s performance and achieves more specific features. In this section, data preprocessing is performed using Exploratory Data Analysis (EDA), converting the categorical data into integer values, cleaning, splitting the data, and balancing the data with SMOTE. This paper uses label encoding and data cleaning using Z-score techniques.
The dataset is gathered through a series of field surveys covering 160 building locations of different buildings worldwide. It is offered as part of the ASHRAE project to establish a thermal comfort preference model. As part of the ASHRAE RP-884 public repository, a collection of documents from numerous investigations carried out by various researchers is managed by ASHRAE. Multiple climate zones scattered over diverse geographic regions are the source of the data files [48]. The dataset is chosen because thermal comfort is crucial for human health and productivity. A lack of thermal comfort may bring on inconvenience among building occupants. The ASHRAE RP-884 dataset utilized in this study has 12595 records and 56 characteristics. The creation of an adaptive model is the goal of this dataset. It comprises more than 20,000 customer comfort votes from 52 studies conducted across 10 different climatic zones. The dataset contains 55 primary identifiers such as blcode, sub, ash, ACT10, ACT20, ACT30, ACT60, met, clo upholst, insul, and TA_H with three classes: UW, N, and UC.
Exploratory Data Analysis (EDA) is essential to conduct all research. Finding outliers and anomalies in the data allows targeting the testing of the hypothesis, which is the primary objective of exploratory analysis. After data collection, EDA is carried out. Without making assumptions, the data is effectively viewed, plotted, and updated to assess the data quality and build models [49].
We applied the EDA technique to ASHRAE dataset. The dataset has 55 numeric and one categorical feature, and most features have a normal distribution. The target feature is categorical, consisting of three classes: UW, N, and UC. The dataset is assessed by discovering the 12,595 records of these classes: UW class has 1029, N class has 10061, and UC has 1505 data records. The dataset’s quality is imbalanced, presented in Fig. 2.
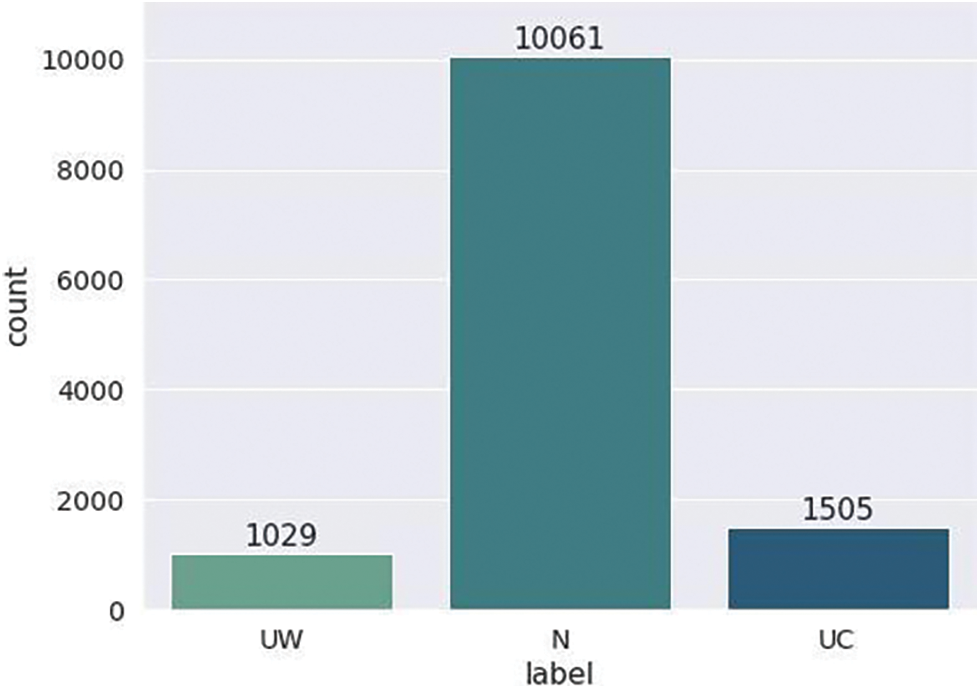
Figure 2: Representation of dataset classes
Skewness is a metric for the asymmetry or deviation of standard patterns in a data set. This research performs the data skewness to check the outlier’s direction. If the skewness value is positive, the distribution is asymmetrical, and the tail is longer on the right side of the distribution; after checking the skewness of the dataset performed, the kurtosis. The aggregate weight of the distribution’s tails, measured as a ratio to the distribution’s center, is known as kurtosis.
The log transformation of skewed data is performed after analyzing the kurtosis of the normal distribution in this study. Skewed data can be transformed using the log transformation to adhere to normality roughly. The result indicates that the kurtosis of the normal distribution is 0.
3.4 Encoding Categorical Variables
Some machine learning algorithms find it challenging to handle categorical variables. It is essential to convert the categorical variable into numerical information. It is an essential step for the developed algorithms to operate as intended. The performance of different algorithms depends on the coding of categorical variables. A feature’s dataset may have one or more labels in word or numeric format. Because of this, it is easier for individuals to analyze the data, but machines cannot understand it [50]. To make these labels understandable to computers, we use an encoding. There are various encoding methods, including hash encoding and one-hot encoding. Categorical variables in this study are encoded using the label encoding technique.
Label Encoder: Label encoding enables numerical label input into a machine-learning model. To replace each separate label’s value in the dataset, Label Encoder assigns a numeric value to each label. The labels can be used when they have different priorities. Typically, this method substitutes a number between 0 and N−1 for each value in a categorical column. Each categorical attribute in this study is given a value of 0, 1, or 2 using a label encoder. This data preparation phase for supervised learning techniques is critical [50].
This research uses the Z-score technique to detect and remove outliers and clean the data. After converting the categorical variable into a numeric value, this study performs the data cleaning. Before cleaning, the distribution of the data was 0.5, 0.98. Fig. 3 represents the distribution of some features, including blcode, sub, ash, ACT10, ACT20, ACT30, ACT60, met, clo upholst, insul, and TA_H before data cleaning.
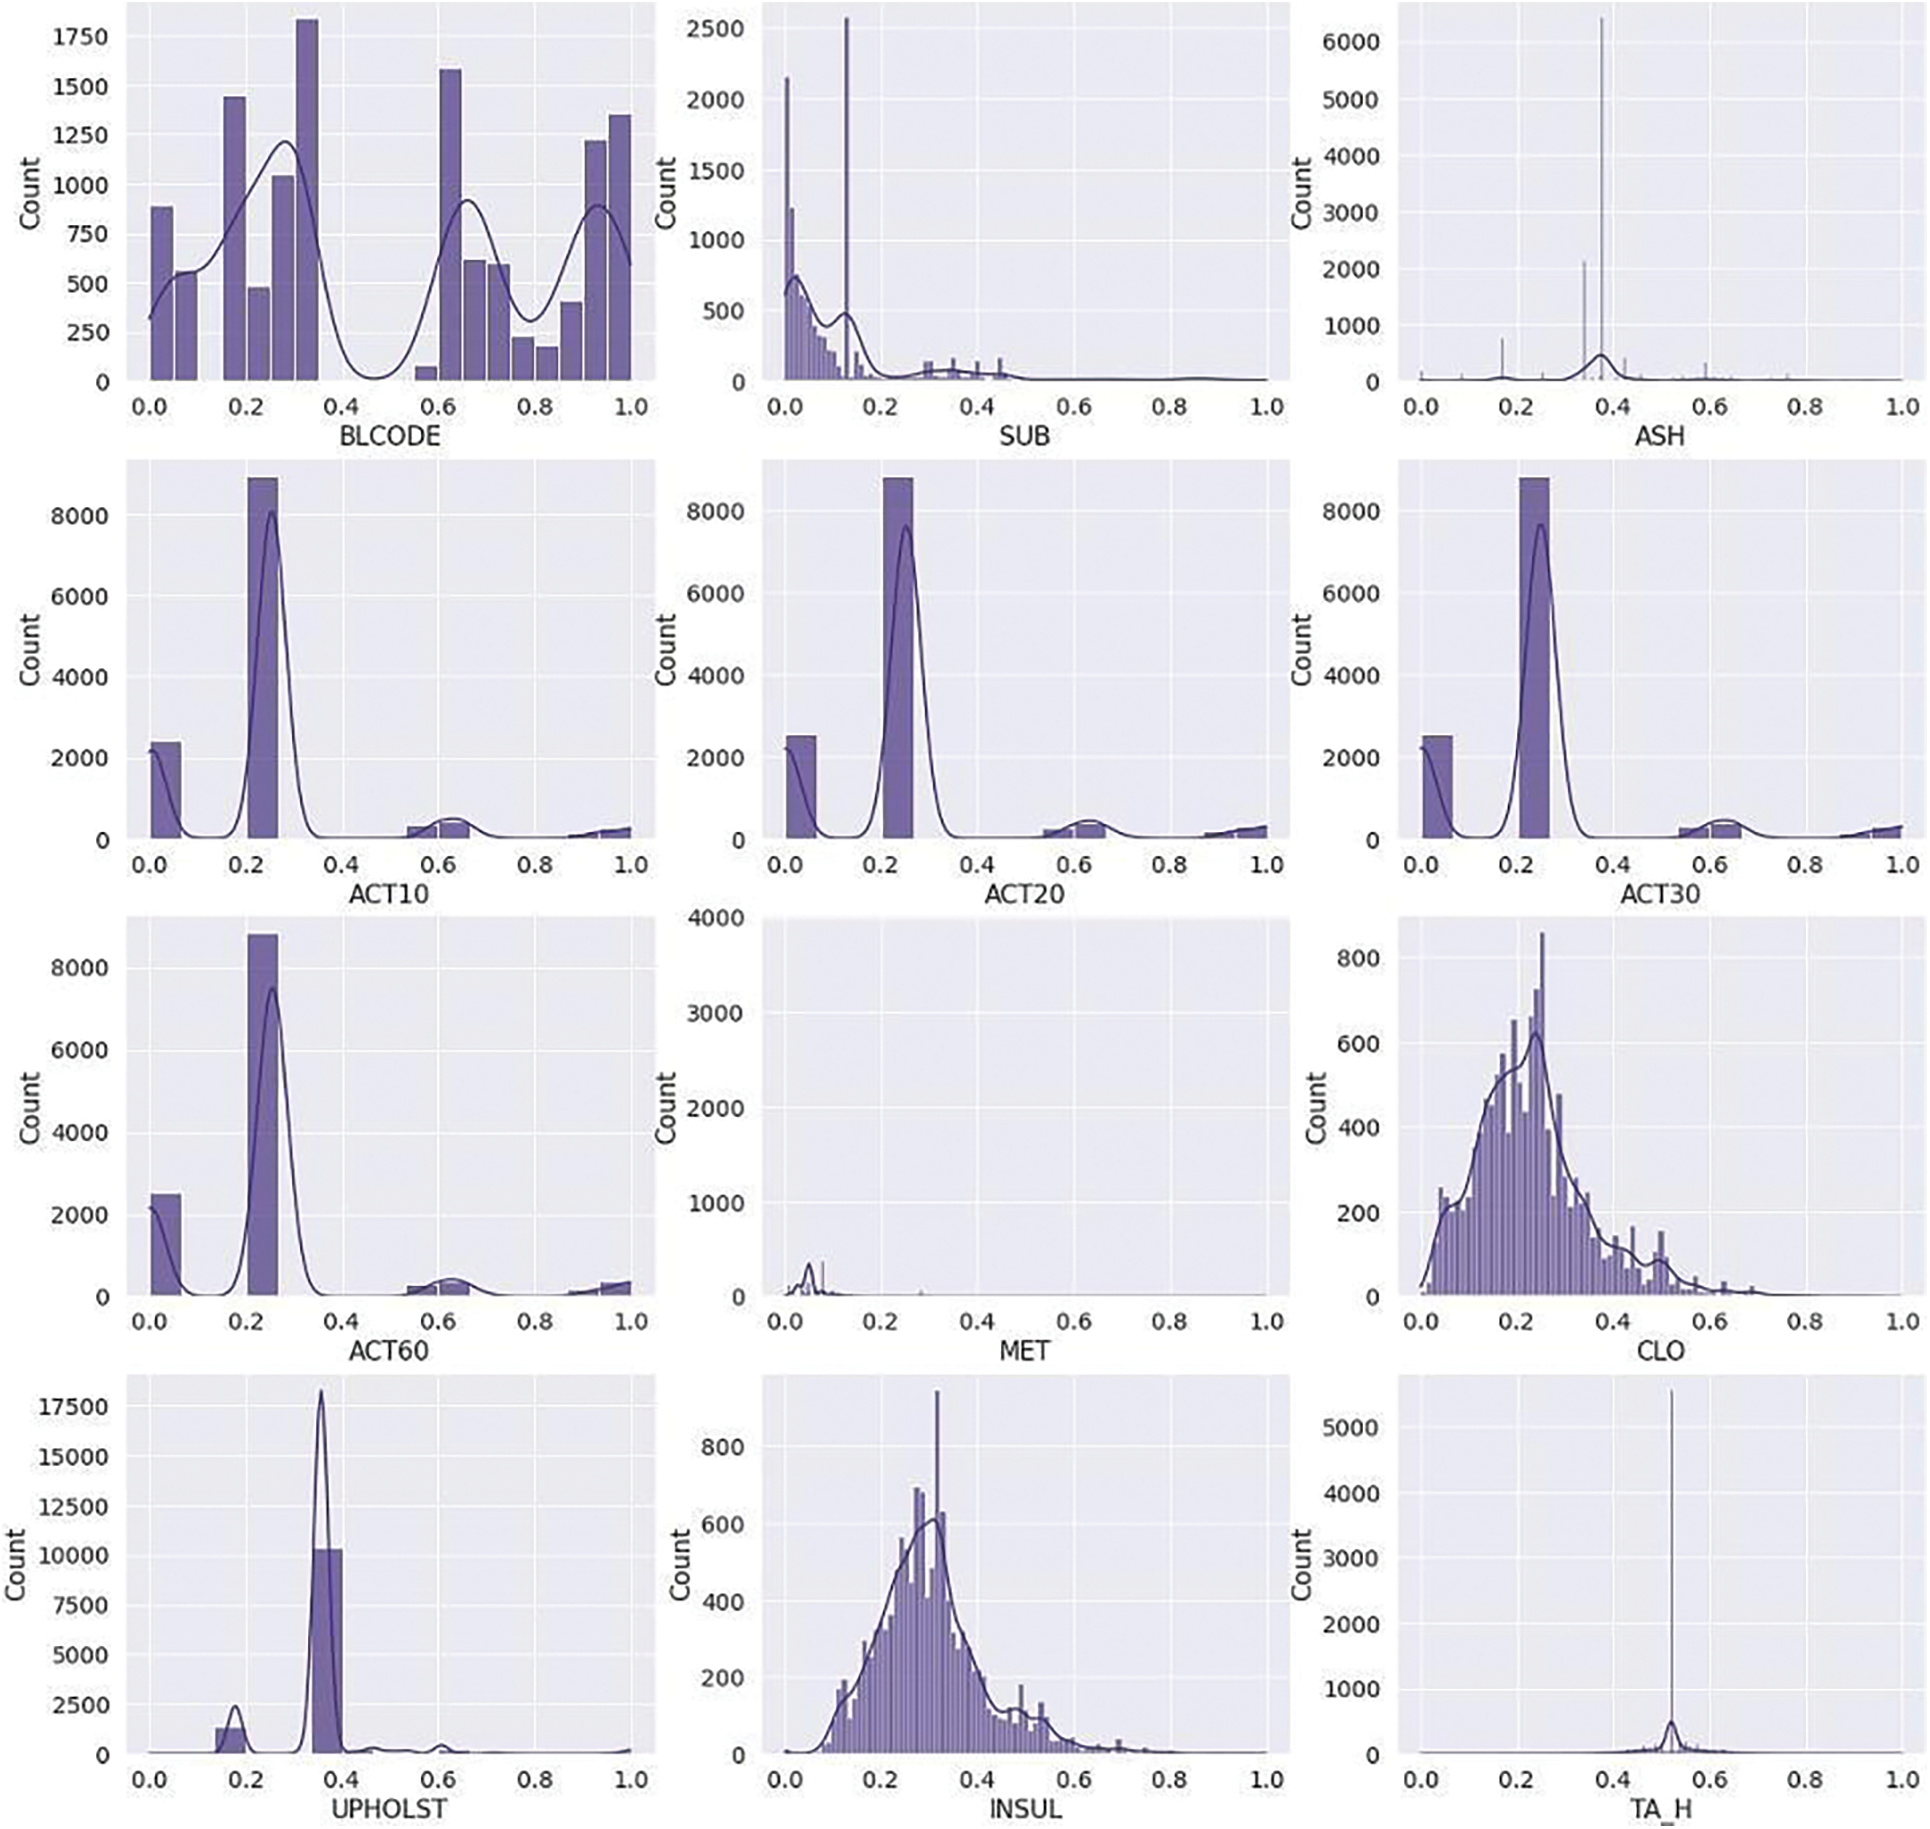
Figure 3: Data distribution before cleaning
Z-score: A Z-score is a metric that quantifies how closely a value relates to the average of a set of values. The Z-score is calculated using standard deviations through the average. When a data point’s Z-score is 0, it has the same score as the average. After applying the Z-score, the outliers are removed, and the data distribution is 0.5, 0.98. Fig. 4 graphically represents the features such as blcode, sub, ash, ACT10, ACT20, ACT30, ACT60, met, clo upholst, insul, and TA_H distribution after data cleaning.
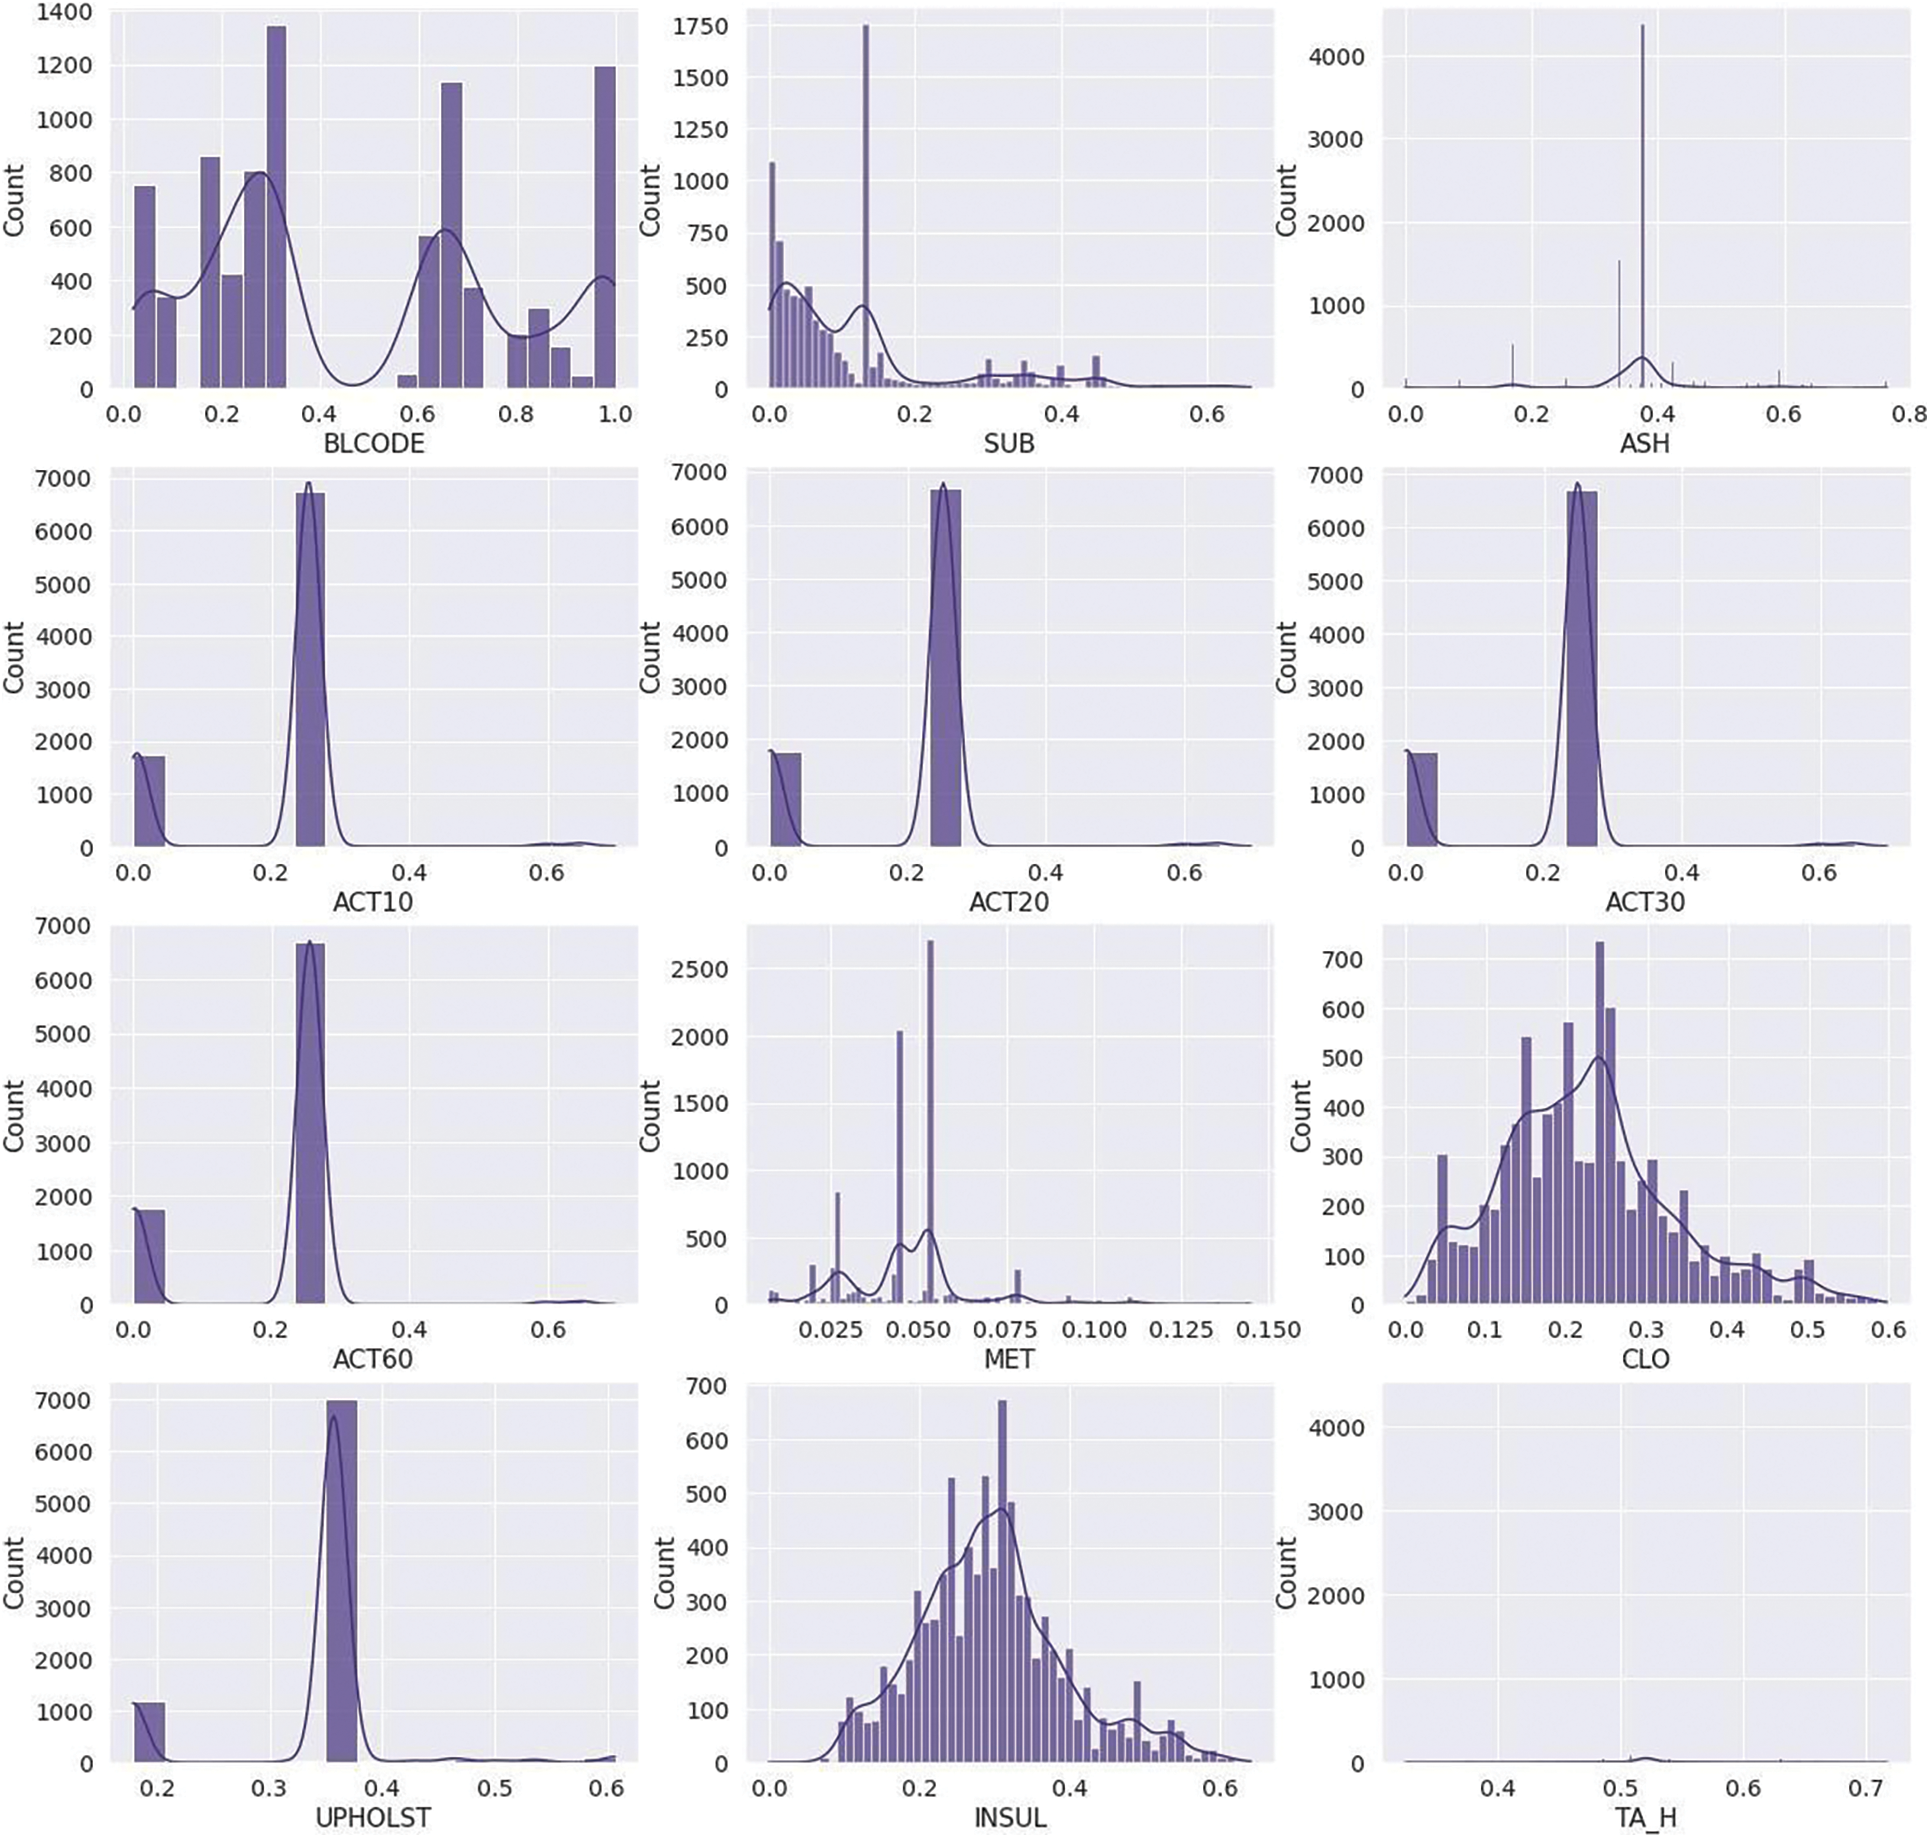
Figure 4: Data distribution after cleaning
After performing EDA, label encoding, and data cleaning, in prediction section counts the label values as class 0 has 6919 values, class 1 has 1014, and class 2 has 651 and balanced the dataset by using SMOTE technique.
3.6.1 Balance Dataset with SMOTE
The ratio of “normal” classes in real-world data sets is often higher than that of “abnormal” classes. Unbalanced data is defined as datasets where the distribution of the classifying classes varies across the dataset. The majority of the time, under-sampling is used to make the majority class appear underrepresented, and over-sampling is used to make the minority class appear over-represented in the dataset. The classifier performs stronger due to these strategies [51]. The dataset has three classifying classes in this research: UW, N, and UC. The dataset is highly imbalanced; therefore, this study applied the SMOTE technique to balance the data. Before applying SMOTE technique, the model performed poorly without training it with enough samples from both classes. After applying SMOTE technique, the model performs well with proper training of machine learning classifiers. Before using the SMOTE, the counter values are 0 : 6919, 1 : 1014, 2 : 651, and after SMOTE, the counter values are 0 : 6919, 1 : 6919, 2 : 6919.
The process of building models comes after data preparation and handling the imbalanced dataset. To improve accuracy and effectiveness for this phase, the under-sampled data are split into training and testing data, maintaining a ratio of 70% training data and 30% testing data. After splitting, the model is trained using the extra tree classifier.
The Extra-Trees classifier entails significantly randomizing the selection of a feature and a cut point while dividing a tree node. In the worst situation, it creates completely random trees with patterns distinct from the output values of the training sample. It mainly distinguishes itself from previous tree-based ensemble techniques on two grounds: it splits nodes by choosing cut points entirely at random. It builds the trees using the complete training sample. Using a majority vote, the estimations of every tree are pooled to determine the final result. Besides the extra-trees classifier, the theory is that ensemble means and wide variation of the cut-point and attribute will reduce variation more effectively than other approaches’ inferior randomization strategies. The training data are used instead of bootstrap duplicates to reduce bias. One of this algorithm’s key advantages is its computational effectiveness [52]. The Key features of the extra tree classifier are:
Randomness in Feature Selection: In Extra Trees, feature splitting points are selected randomly instead of using the best possible split. This randomness adds diversity to the trees and reduces the variance of the model, making it less prone to overfitting.
Randomness in Bootstrap Sampling: Like Random Forests, the Extra Trees Classifier performs bootstrap sampling to create different subsets of the training data for each tree. However, Extra Trees also randomly selects a subset of features at each node to determine the best split, further enhancing the randomness of the model.
Efficiency: Extra Trees typically have a faster training time since they do not search for the best-split point at each node. However, this speed gain comes at the cost of slightly lower predictive accuracy. This research uses the ‘gini’ criterion; the min-sample-split is 3, and 1 is a random state.
The complexity of the Extra Trees Classifier algorithm can be broken down into two main aspects: training complexity and prediction complexity.
Training Complexity: The training complexity refers to the computational cost of building the ensemble of decision trees in the Extra Trees Classifier. The primary factor influencing the training complexity is the number of trees in the ensemble, denoted by the hyperparameter n_estimators. The training complexity of the Extra Trees Classifier is generally higher than that of traditional decision trees but lower than that of Random Forests. It is typically proportional to the number of trees multiplied by the complexity of building a single decision tree. The complexity of building a single tree is determined by the number of samples in the training set (n) and the number of features (m). The time complexity of constructing a single decision tree is usually around O(n * m * log(n)), where log(n) represents the average depth of the tree. Therefore, the training complexity of the Extra Trees Classifier can be approximated as O(n_estimators * n * m * log(n)).
Prediction Complexity: The prediction complexity refers to the computational cost of making predictions with the trained Extra Trees Classifier. The prediction complexity of the Extra Trees Classifier depends on the number of trees (n_estimators), the average depth of the trees (max_depth), and the number of features (m). The prediction complexity is generally similar to that of a single decision tree. Once the ensemble of decision trees is built, predicting the class labels for new instances involves traversing each decision tree in the ensemble and aggregating their votes. The time complexity of predicting with a single decision tree is typically around O(m * log(n)), where log(n) represents the depth of the tree. Therefore, the prediction complexity of the Extra Trees Classifier can be approximated as O(n_estimators * m * log(n)).
Model Limitations: Like any other machine learning algorithm, the Extra Trees Classifier has weaknesses and limitations. Here are some of them: The Extra Trees Classifier tends to use more memory than other algorithms like decision trees or linear models. This is because it constructs multiple decision trees in the ensemble, each requiring memory to store the tree structure and training data subsets. By introducing randomness in feature selection and splitting points, the Extra Trees Classifier increases the model’s bias. This can lead to slightly lower predictive accuracy than other ensemble methods like Random Forests. However, the reduction in variance can make it more resistant to overfitting. Ensemble methods like the Extra Trees Classifier are generally less interpretable than individual decision trees. Understanding the underlying logic and feature importance can be more challenging because the predictions are based on the combined votes of multiple trees. Extra Trees does provide feature importance estimates, but they may not be as reliable as those of Random Forests. This is because the random feature selection in Extra Trees can sometimes result in suboptimal splits, leading to less accurate feature importance rankings. The randomness introduced by Extra Trees may cause it to pay more attention to noisy features in the data. This can lead to overfitting on noisy features and potentially degrade the classifier’s overall performance. The performance of the Extra Trees Classifier can be sensitive to the choice of hyperparameters, such as the number of trees (n_estimators), the maximum depth of the trees (max_depth), and the number of features to consider at each split (max_features). Careful tuning of these hyperparameters is necessary to achieve optimal results.
Despite these limitations, the Extra Trees Classifier can still be a powerful and effective algorithm, especially when computational efficiency is a priority or when dealing with high-dimensional datasets. It can provide competitive performance in many classification tasks, particularly with proper preprocessing techniques and hyperparameter tuning.
We use Multilayer Perceptron (MLP) to analyze thermal sensation prediction further. It is a feedforward classifier that predicts the output mapped by input variables. MLP comprises input units, one hidden layer, and one output layer.
Naive Bayes is a supervised machine learning algorithm based on likelihood. Each feature is independent of the other and takes part in the learning process independently.
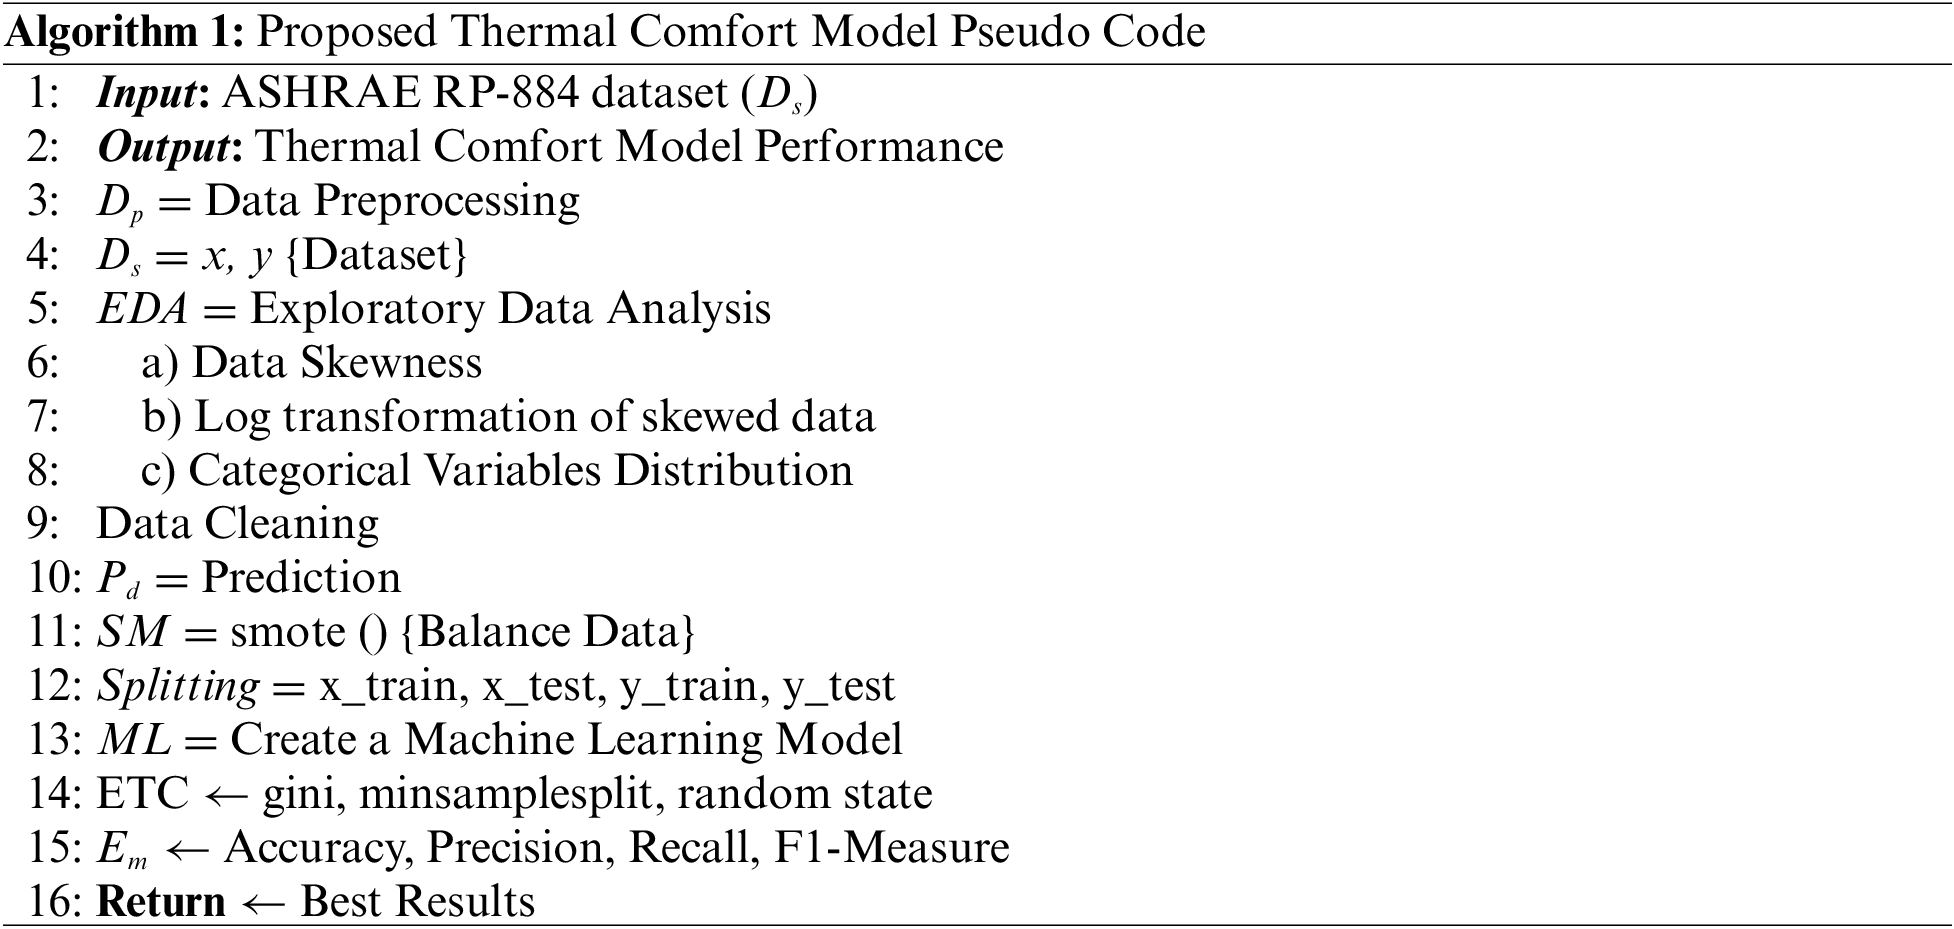
The proposed thermal comfort model’s general operation is described in Algorithm 1. The ASHRAE RP-884 dataset DS is taken as input, and the output is the performance of the proposed thermal comfort model. The features are visualized using Exploratory Data Analysis (EDA). Data cleaning, skewness correction, log transformation of skewed data, and categorical variable distribution are all used to preprocess the data. SMOTE (SM) is used as a data preprocessing approach for balancing the data, and the data is divided into training and testing groups with sizes of 0.7 and 0.3, respectively. Accuracy, precision, recall, and F1-score evaluation metrics Em are employed. The thermal comfort model’s training dataset yields the best results.
This section examines the performance of the proposed model. The model’s performance was evaluated using various metrics such as accuracy, precision, recall, F1-score, and confusion matrix. These criteria assess the proposed model’s performance compared to the current methods and their suitability for the human thermal comfort model. The proposed model uses machine learning classifiers on an ASHRAE RP-884 dataset. The dataset was split into 25% for model testing and 75% for model training. The results obtained from the experiments are discussed in detail in this section. Different ML classifiers are applied to check the validity of the model.
Evaluation Metrics: The effectiveness of the suggested model is evaluated using the evaluation parameters listed below. The accuracy reported in Eq. (1), the precision in Eq. (2), the recall in Eq. (3), and the F1-score in Eq. (4) are some of the metrics used to evaluate the prediction and classification issues.
Table 2 demonstrates the overall performance of the ML algorithm on the ASHRAE dataset. Fig. 5 represents the performance error of tuned Extra Tree classifier, MLP and Naive Bayes algorithms. The Extra Tree classifier obtained an accuracy of 0.94, a precision of 0.94, a recall of 0.97, and an F1-score of 0.95. The MLP classifier obtained an accuracy of 0.81, a precision of 0.84, a recall of 0.85, and an F1-score of 0.84. The Naive Bayes obtained an accuracy of 0.74, a precision of 0.78, a recall of 0.76, and an F1-score of 0.76.
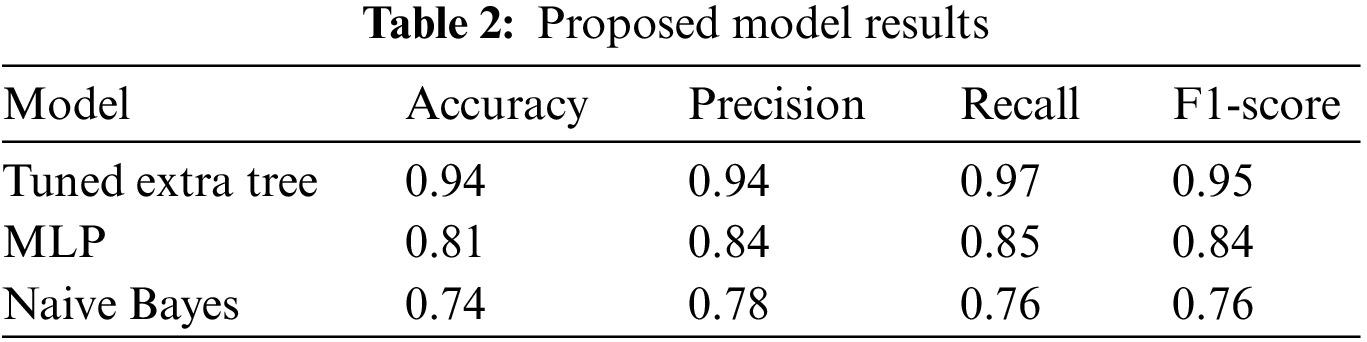
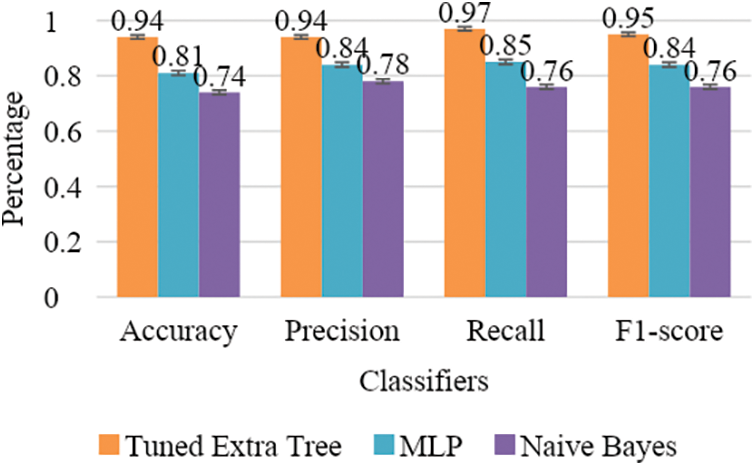
Figure 5: Graphical representation of performance error
The confusion matrix of the proposed model is depicted visually in Fig. 6. It gives a general description of how a classification algorithm works. It indicates that class 0 accurately predicts 1870 samples, whereas 230 samples are misdiagnosed, and class 1 predicts 2024 samples successfully and 78 samples are falsely diagnosed. Similarly, class 2 successfully predicted 1949 samples, whereas 59 samples were misdiagnosed. The proposed method works better because it has more continuous, better true positive and negative values and fewer false positive and negative values.
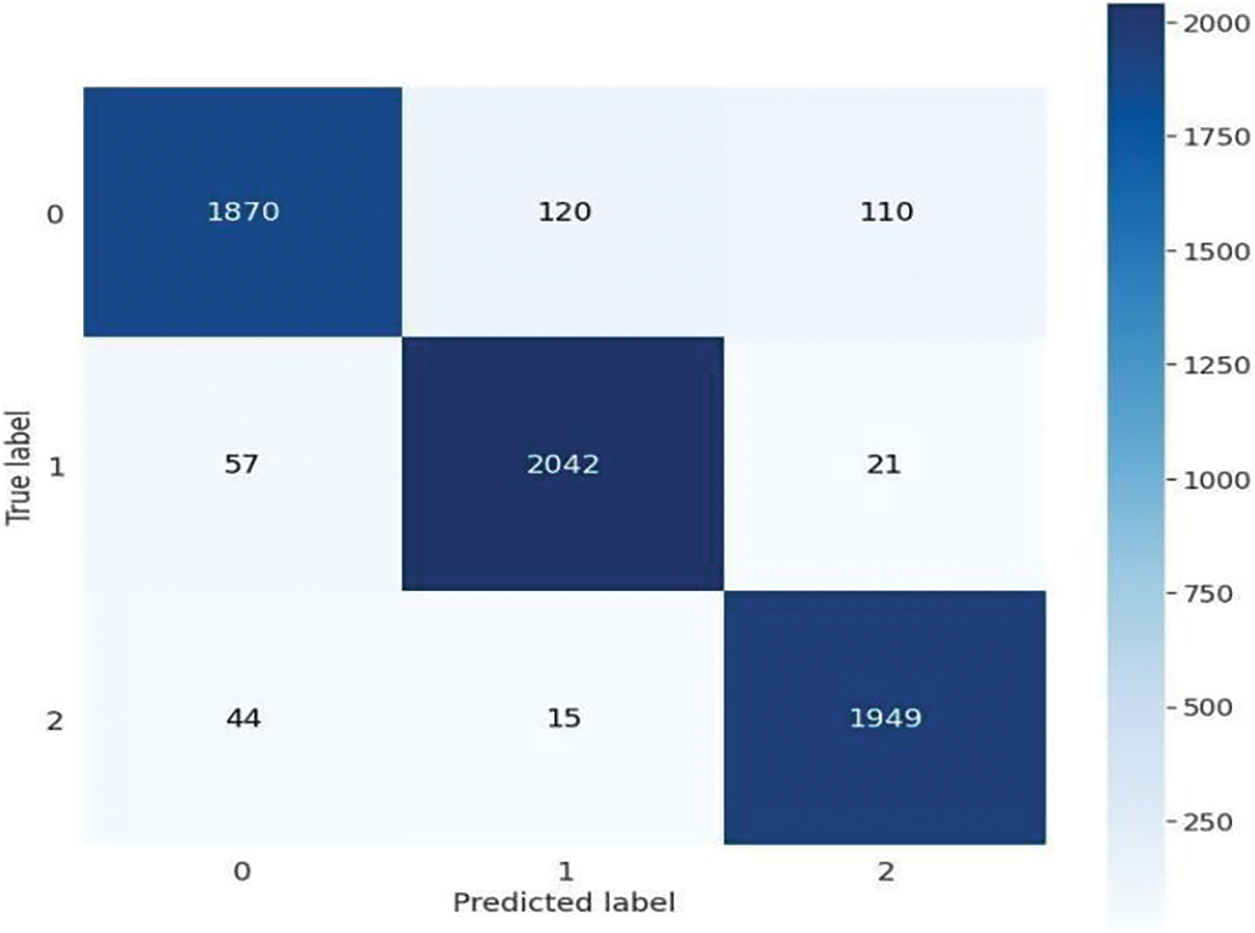
Figure 6: Confusion matrix of proposed model
Fig. 7 indicates the Receiver Operating Characteristic (ROC) curve. The ROC curve is a graphical representation of the performance of the classification model. It illustrates the trade-off between the true positive rate (sensitivity) and the false positive rate (1-specificity) for different classification thresholds. The ROC curve is created by plotting the True Positive Rate (TPR) on the y-axis against the False Positive Rate (FPR) on the x-axis at various threshold settings. Each point on the curve represents a different threshold, showing the model’s performance across all possible threshold values. The pink dotted line represents the micro-average ROC curve area of 0.96, and the purple dotted line shows the macro-average ROC curve with a 0.96 value. Class 0 is represented by a sky-blue line with an area of 0.93, class 1 by an orange line with a 0.97 area, and class 2 by a green line with a 0.97 area.
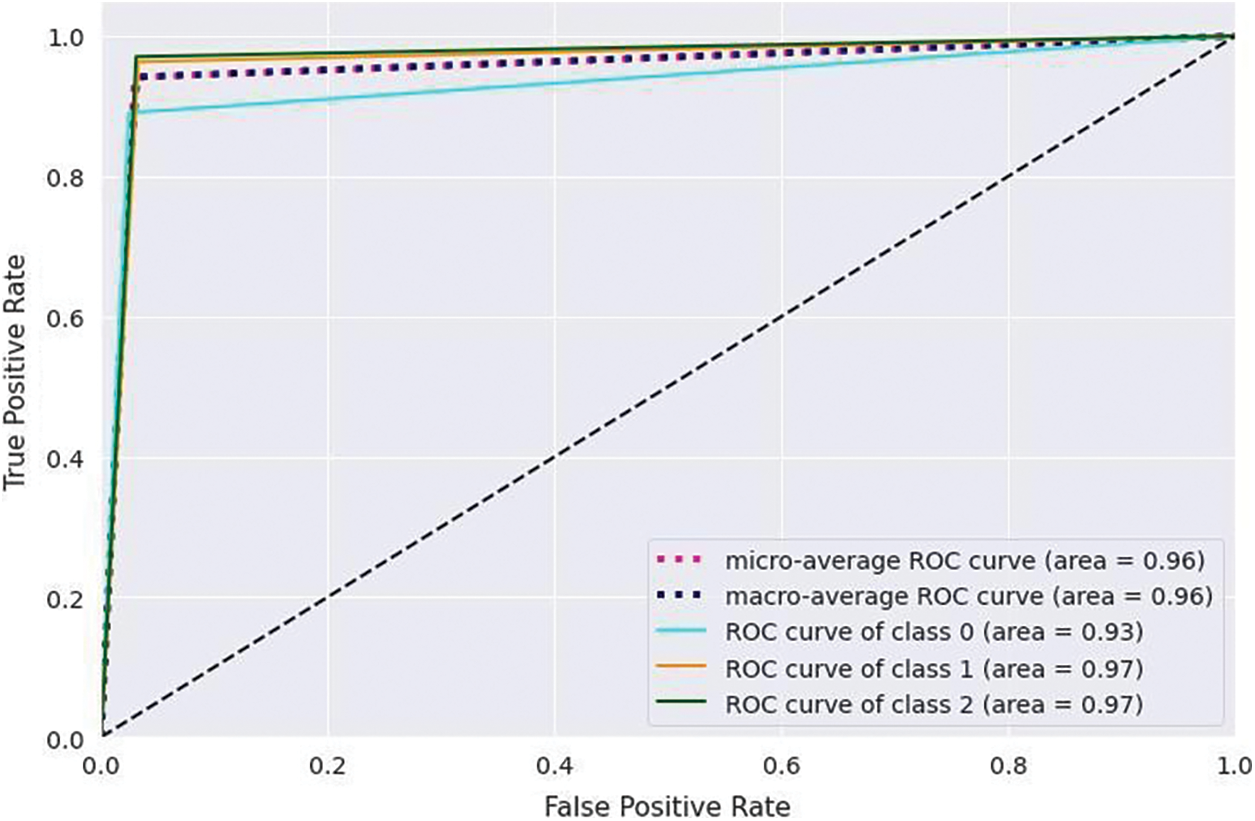
Figure 7: Receiver operating characteristic curve
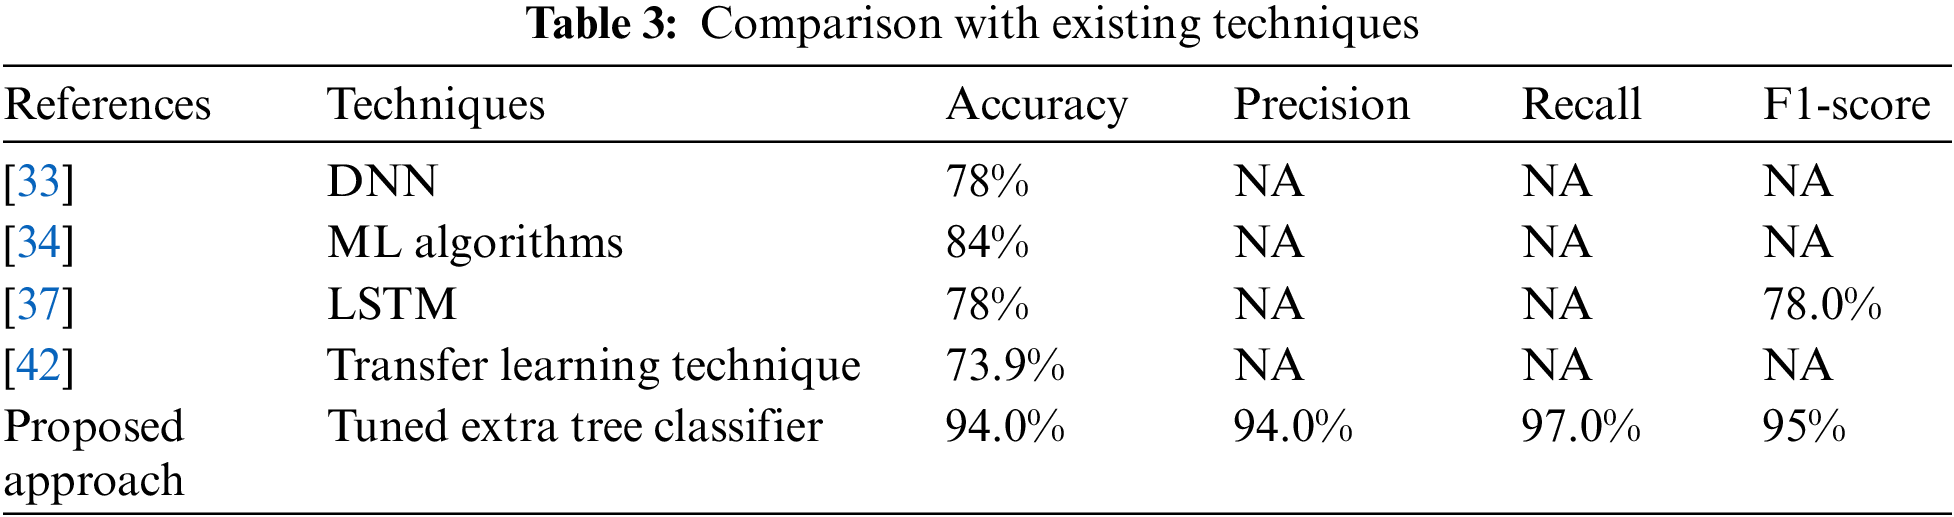
The comparative analysis of the suggested approach with existing techniques [33,34,37,42] is provided in Table 3. The comparison is provided regarding the accuracy, precision, recall, and F1-score. The proposed approach outperforms as associated to the existing techniques.
This study produces a human thermal comfort model that uses an Extra Tree classifier to detect critical elements and generate improved predictions of thermal experience. Furthermore, MLP and NB algorithms are employed and compared with the tuned Extra Tree classifier. HVAC systems are used in buildings to regulate the temperature. Better thermal conditions directly impact people’s productivity and health. The suggested approach significantly enhances people’s thermal comfort. This technique preprocessed the raw information, balanced the class imbalance dataset, then built a classifier that receives a feature vector as inputs and produces a class of thermal characteristics sensations. The study uses an ASHRAE RP884 standard dataset, open to the public for experimentation and research. SMOTE balances the dataset, while EDA explores outliers and abnormalities in the dataset. The proposed Extra Tree classifier obtained 94% accuracy and precision, 97% recall, and 95% F1-score. Similarly, the MLP obtained 81% accuracy, 84% precision, 85% recall and 84% F1-score, and NB yielded 74% accuracy, 78% precision and 76% recall and F1-score. The results demonstrate that a tuned Extra Tree classifier outperforms MLP and NB. They present a model for human thermal comfort that enhances predictions of thermal experience by emphasizing key traits and utilizing a tuned Extra Tree classifier. The limitation of this study is that we focused on building from a few limited geographic locations. The model may underperform when the proposed approach is applied to new data from different locations. The future scope includes extending the study’s focus to non-ventilated buildings and local thermal comfort, as well as taking other machines and deep learning approaches into account to enhance the learning effectiveness of the HVAC systems with multiple datasets and employing different statistical tests, such as Wilcoxon and ANOVA, to ensure the quality of the proposed algorithm.
Acknowledgement: The authors extend their appreciation to the Deputyship for Research & Innovation, Ministry of Education in Saudi Arabia.
Funding Statement: The authors extend their appreciation to the Deputyship for Research & Innovation, Ministry of Education in Saudi Arabia for funding this research work through the Project Number 223202.
Author Contributions: The authors confirm contribution to the paper as follows: study conception and design: Ahmad Almadhor, Chitapong Wechtaisong, Usman Tariq, Natalia Kryvinska; data collection: Abdullah Al Hejaili, Uzma Ghulam Mohammad, Ahmad Almadhor; analysis and interpretation of results: Abdullah Al Hejaili, Uzma Ghulam Mohammad, Usman Tariq, Mohana Alanazi, Ahmad Almadhor, Chitapong Wechtaisong, Usman Tariq, Natalia Kryvinska; draft manuscript preparation: Abdullah Al Hejaili, Uzma Ghulam Mohammad, Usman Tariq, Mohana Alanazi, Ahmad Almadhor, Chitapong Wechtaisong, Usman Tariq, Natalia Kryvinska. All authors reviewed the results and approved the final version of the manuscript.
Availability of Data and Materials: Data available within the article or its supplementary materials.
Conflicts of Interest: The authors declare that they have no conflicts of interest to report regarding the present study.
References
1. A. R. Javed, F. Shahzad, S. ur Rehman, Y. B. Zikria, I. Razzak et al., “Future smart cities requirements, emerging technologies, applications, challenges and future aspects,” Cities, vol. 129, pp. 103794, 2022. [Google Scholar]
2. S. Chatterjee, A. K. Kar and S. Z. Mustafa, “Securing IoT devices in smart cities of India: From ethical and enterprise information system management perspective,” Enterprise Information Systems, vol. 15, no. 4, pp. 585–615, 2021. [Google Scholar]
3. A. R. Javed, R. Faheem, M. Asim, T. Baker and M. O. Beg, “A smartphone sensors-based personalized human activity recognition system for sustainable smart cities,” Sustainable Cities and Society, vol. 71, pp. 102970, 2021. [Google Scholar]
4. M. Majid, S. Habib, A. R. Javed, M. Rizwan, G. Srivastava et al., “Applications of wireless sensor networks and Internet of Things frameworks in the Industry Revolution 4.0: A systematic literature review,” Sensors, vol. 22, no. 6, pp. 2087, 2022. [Google Scholar] [PubMed]
5. M. M. Razip, K. Savita, K. S. Kalid, M. N. Ahmad, M. Zaffa et al., “The development of sustainable IoT E-waste management guideline for households,” Chemosphere, vol. 303, pp. 134767, 2022. [Google Scholar] [PubMed]
6. A. R. Javed, M. U. Sarwar, H. U. Khan, Y. D. Al-Otaibi and W. S. Alnumay, “PP-SPA: Privacy preserved smartphone-based personal assistant to improve routine life functioning of cognitive impaired individuals,” Neural Processing Letters, pp. 1–18, 2021. [Google Scholar]
7. A. R. Javed, M. U. Sarwar, M. O. Beg, M. Asim, T. Baker et al., “A collaborative healthcare framework for shared healthcare plan with ambient intelligence,” Human-Centric Computing and Information Sciences, vol. 10, no. 1, pp. 1–21, 2020. [Google Scholar]
8. M. Fayyaz, A. A. Farhan and A. R. Javed, “Thermal comfort model for HVAC buildings using machine learning,” Arabian Journal for Science and Engineering, vol. 47, no. 2, pp. 2045–2060, 2022. [Google Scholar]
9. T. M. Nisar, G. Prabhakar and L. Strakova, “Social media information benefits, knowledge management and smart organizations,” Journal of Business Research, vol. 94, pp. 264–272, 2019. [Google Scholar]
10. S. U. Rehman, A. R. Javed, M. U. Khan, M. Nazar Awan and A. Farukh, “Personalised comfort: A personalised thermal comfort model to predict thermal sensation votes for smart building residents,” Enterprise Information Systems, vol. 16, no. 7, pp. 1852316, 2022. [Google Scholar]
11. I. Petidis, M. Aryblia, T. Daras and T. Tsoutsos, “Energy saving and thermal comfort interventions based on occupants needs: A students residence building case,” Energy and Buildings, vol. 174, pp. 347–364, 2018. [Google Scholar]
12. V. R. Sharma, Making Cities Resilient, Springer, 2019. [Google Scholar]
13. A. R. Javed, L. G. Fahad, A. A. Farhan, S. Abbas, G. Srivastava et al., “Automated cognitive health assessment in smart homes using machine learning,” Sustainable Cities and Society, vol. 65, pp. 102572, 2021. [Google Scholar]
14. E. Kuchen and M. N. Fisch, “Spot monitoring: Thermal comfort evaluation in 25 office buildings in winter,” Building and Environment, vol. 44, no. 4, pp. 839–847, 2009. [Google Scholar]
15. L. Pérez-Lombard, J. Ortiz and C. Pout, “A review on buildings energy consumption information,” Energy and Buildings, vol. 40, no. 3, pp. 394–398, 2008. [Google Scholar]
16. S. P. Corgnati, M. Filippi and S. Viazzo, “Perception of the thermal environment in high school and university classrooms: Subjective preferences and thermal comfort,” Building and Environment, vol. 42, no. 2, pp. 951–959, 2007. [Google Scholar]
17. D. W. DeGroot and W. L. Kenney, “Impaired defense of core temperature in aged humans during mild cold stress,” American Journal of Physiology-Regulatory, Integrative and Comparative Physiology, vol. 292, no. 1, pp. R103–R108, 2007. [Google Scholar] [PubMed]
18. A. I. Dounis and C. Caraiscos, “Advanced control systems engineering for energy and comfort management in a building environment review,” Renewable and Sustainable Energy Reviews, vol. 13, no. 6–7, pp. 1246–1261, 2009. [Google Scholar]
19. A. I. Dounis, M. Bruant, M. Santamouris, G. Guarracino and P. Michel, “Comparison of conventional and fuzzy control of indoor air quality in buildings,” Journal of Intelligent & Fuzzy Systems, vol. 4, no. 2, pp. 131–140, 1996. [Google Scholar]
20. A. Shepherd and W. Batty, “Fuzzy control strategies to provide cost and energy efficient high quality indoor environments in buildings with high occupant densities,” Building Services Engineering Research and Technology, vol. 24, no. 1, pp. 35–45, 2003. [Google Scholar]
21. F. Calvino, M. La Gennusa, G. Rizzo and G. Scaccianoce, “The control of indoor thermal comfort conditions: Introducing a fuzzy adaptive controller,” Energy and Buildings, vol. 36, no. 2, pp. 97–102, 2004. [Google Scholar]
22. M. Maasoumy, A. Pinto and A. Sangiovanni-Vincentelli, “Model-based hierarchical optimal control design for HVAC systems,” Dynamic Systems and Control Conference, vol. 54754, pp. 271–278, 2011. [Google Scholar]
23. A. A. Farhan, K. Pattipati, B. Wang and P. Luh, “Predicting individual thermal comfort using machine learning algorithms,” in 2015 IEEE Int. Conf. on Automation Science and Engineering (CASE), Gothenburg, Sweden, IEEE, pp. 708–713, 2015. [Google Scholar]
24. M. Luo, Z. Wang, K. Ke, B. Cao, Y. Zhai et al., “Human metabolic rate and thermal comfort in buildings: The problem and challenge,” Building and Environment, vol. 131, pp. 44–52, 2018. [Google Scholar]
25. J. Kim, S. Schiavon and G. Brager, “Personal comfort models-A new paradigm in thermal comfort for occupant-centric environmental control,” Building and Environment, vol. 132, pp. 114–124, 2018. [Google Scholar]
26. F. Auffenberg, S. Stein and A. Rogers, “A personalised thermal comfort model using a bayesian network,” in Twenty-Fourth Int. Joint Conf. on Artificial Intelligence, Buenos Aires, Argentina, 2015. [Google Scholar]
27. G. Gao, J. Li and Y. Wen, “Energy-efficient thermal comfort control in smart buildings via deep reinforcement learning,” arXiv preprint arXiv:1901.04693, 2019. [Google Scholar]
28. A. Standard, “Thermal environmental conditions for human occupancy American society of heating,” in Refrigeration and Air Conditioning Engineers, Atlanta, USA: Peachtree Corners, Georgia, 1992. [Google Scholar]
29. G. Pinto, Z. Wang, A. Roy, T. Hong and A. Capozzoli, “Transfer learning for smart buildings: A critical review of algorithms, applications and future perspectives,” Advances in Applied Energy, vol. 5, pp. 100084, 2022. [Google Scholar]
30. M. Khalil, S. McGough, Z. Pourmirza, M. Pazhoohesh and S. Walker, “Transfer learning approach for occupancy prediction in smart buildings,” in 2021 12th Int. Renewable Engineering Conf. (IREC), Amman, Jordan, IEEE, pp. 1–6, 2021. [Google Scholar]
31. N. Gao, W. Shao, M. S. Rahaman, J. Zhai, K. David et al., “Transfer learning for thermal comfort prediction in multiple cities,” Building and Environment, vol. 195, pp. 107725, 2021. [Google Scholar]
32. N. Somu, A. Sriram, A. Kowli and K. Ramamritham, “A hybrid deep transfer learning strategy for thermal comfort prediction in buildings,” Building and Environment, vol. 204, pp. 108133, 2021. [Google Scholar]
33. M. Cakir and A. Akbulut, “A bayesian deep neural network approach to seven-point thermal sensation perception,” IEEE Access, vol. 10, pp. 5193–5206, 2022. [Google Scholar]
34. J. Xie, H. Li, C. Li, J. Zhang and M. Luo, “Review on occupant-centric thermal comfort sensing, predicting and controlling,” Energy and Buildings, vol. 226, pp. 110392, 2020. [Google Scholar]
35. A. Singh, K. Raj, T. Kumar, S. Verma and A. M. Roy, “Deep learning-based cost effective and responsive robot for autism treatment,” Drones, vol. 7, no. 2, pp. 81, 2023. [Google Scholar]
36. A. Singh, R. Ranjbarzadeh, K. Raj, T. Kumar and A. M. Roy, “Understanding EEG signals for subject-wise definition of Armoni activities,” arXiv preprint arXiv:2301.00948, 2023. [Google Scholar]
37. A. Chennapragada, D. Periyakoil, H. P. Das and C. J. Spanos, “Time series-based deep learning model for personal thermal comfort prediction,” in Proc. of the Thirteenth ACM Int. Conf. on Future Energy Systems, New York, USA, pp. 552–555, 2022. [Google Scholar]
38. Z. Deng and Q. Chen, “Reinforcement learning of occupant behavior model for cross-building transfer learning to various HVAC control systems,” Energy and Buildings, vol. 238, pp. 110860, 2021. [Google Scholar]
39. B. Fan and X. Xing, “Intelligent prediction method of building energy consumption based on deep learning,” Scientific Programming, vol. 2021, pp. 1–9, 2021. [Google Scholar]
40. R. Ashrafi, M. Azarbayjani and H. Tabkhi, “Machine learning-based automated thermal comfort prediction: Integration of low-cost thermal and visual cameras for higher accuracy,” arXiv preprint arXiv: 2204.08463, 2022. [Google Scholar]
41. J. Zhang, H. Liu, Y. Wu, S. Zhou and M. Liu, “Neural network-based thermal comfort prediction for the elderly,” E3S Web of Conferences, vol. 237, pp. 2022, 2021. [Google Scholar]
42. W. Hu, Y. Luo, Z. Lu and Y. Wen, “Heterogeneous transfer learning for thermal comfort modeling,” in Proc. of the 6th ACM Int. Conf. on Systems for Energy-Efficient Buildings, Cities and Transportation, New York, USA, pp. 61–70, 2019. [Google Scholar]
43. R. de Dear and G. Schiller Brager, “The adaptive model of thermal comfort and energy conservation in the built environment,” International Journal of Biometeorology, vol. 45, pp. 100–108, 2001. [Google Scholar] [PubMed]
44. L. Wang, M. Khishe, M. Mohammadi and A. Mahmoodzadeh, “Extreme learning machine evolved by fuzzified hunger games search for energy and individual thermal comfort optimization,” Journal of Building Engineering, vol. 60, pp. 105187, 2022. [Google Scholar]
45. B. Wang, L. Liu, Y. Li and M. Khishe, “Robust grey wolf optimizer for multimodal optimizations: A cross-dimensional coordination approach,” Journal of Scientific Computing, vol. 92, no. 3, pp. 110, 2022. [Google Scholar]
46. Q. Wang, G. Chen, M. Khishe, B. F. Ibrahim and S. Rashidi, “Multi-objective optimization of IoT-based green building energy system using binary metaheuristic algorithms,” Journal of Building Engineering, vol. 68, pp. 106031, 2023. [Google Scholar]
47. M. Khishe, “Greedy opposition-based learning for chimp optimization algorithm,” Artificial Intelligence Review, vol. 56, pp. 1–31, 2022. [Google Scholar]
48. M. Khishe, N. Orouji and M. R. Mosavi, “Multi-objective chimp optimizer: An innovative algorithm for multi-objective problems,” Expert Systems with Applications, vol. 211, pp. 118734, 2023. [Google Scholar]
49. M. Komorowski, D. C. Marshall, J. D. Salciccioli and Y. Crutain, “Exploratory data analysis,” Secondary Analysis of Electronic Health Records, pp. 185–203, 2016. [Google Scholar]
50. N. Sharma, H. V. Bhandari, N. S. Yadav and H. Shroff, “Optimization of IDS using filter-based feature selection and machine learning algorithms,” International Journal of Innovative Technology and Exploring Engineering, vol. 10, no. 2, pp. 96–102, 2020. [Google Scholar]
51. N. V. Chawla, K. W. Bowyer, L. O. Hall and W. P. Kegelmeyer, “Smote: Synthetic minority oversampling technique,” Journal of Artificial Intelligence Research, vol. 16, pp. 321–357, 2002. [Google Scholar]
52. E. K. Ampomah, Z. Qin and G. Nyame, “Evaluation of tree-based ensemble machine learning models in predicting stock price direction of movement,” Information, vol. 11, no. 6, pp. 332, 2020. [Google Scholar]
Cite This Article
 Copyright © 2024 The Author(s). Published by Tech Science Press.
This work is licensed under a Creative Commons Attribution 4.0 International License , which permits unrestricted use, distribution, and reproduction in any medium, provided the original work is properly cited.
 Downloads
 Citation Tools