
 Submit a Paper
 Propose a Special lssue
 Open Access
ARTICLE

Enhancing Employee Turnover Prediction: An Advanced Feature Engineering Analysis with CatBoost
1 Department of Artificial Intelligence Convergence, Chonnam National University, Gwangju, 61186, Republic of Korea
2 Department of Data Science, Gazipur Digital University, Gazipur, 1750, Bangladesh
3 Department of Computer Science and Engineering, Gopalganj Science and Technology University, Gopalganj, 8100, Bangladesh
* Corresponding Authors: Kwanghoon Choi. Email: ; Kyungbaek Kim. Email:
# These authors contributed equally to this work
Computer Systems Science and Engineering 2025, 49, 455-479. https://doi.org/10.32604/csse.2025.069213
Received 17 June 2025; Accepted 18 July 2025; Issue published 19 August 2025
 View Full Text
 Download PDF
Abstract
Employee turnover presents considerable challenges for organizations, leading to increased recruitment costs and disruptions in ongoing operations. High voluntary attrition rates can result in substantial financial losses, making it essential for Human Resource (HR) departments to prioritize turnover reduction. In this context, Artificial Intelligence (AI) has emerged as a vital tool in strengthening business strategies and people management. This paper incorporates two new representative features, introducing three types of feature engineering to enhance the analysis of employee turnover in the IBM HR Analytics dataset. Key Machine Learning (ML) techniques were subsequently employed in this work, such as Support Vector Machine (SVM), Random Forest (RF), Logistic Regression (LR), Extreme Gradient Boosting (XGBoost), and especially Categorical Boosting (CatBoost), a gradient boosting algorithm optimized for categorical data to analyze employee turnover. Adopting the unique feature engineering process enables CatBoost to enhance model accuracy and robustness while effectively analyzing complex patterns within employee data. Experimental results demonstrate the effectiveness of our proposed methodology, achieving the highest accuracy of 90.14% and an F1-score of 0.88 on the IBM dataset. To assess the capability of our detection system, we have also used an extended dataset, achieving an optimal accuracy of 98.10% and an F1-score of 0.98. These results strongly indicate the efficiency of our proposed methodology and highlight the impact of feature engineering on predictive performance. Moreover, by pinpointing the top ten factors influencing attrition, including “Monthly Income”, “Over Time”, “Total Satisfaction”, and others, this research equips HR departments with insights to implement targeted retention strategies, such as enhancing compensation or job satisfaction, to retain key talent before they consider leaving.Keywords
Employee attrition is the phenomena in which employees leave their organization for a variety of reasons, including resignation, pursuit of better opportunities, retirement, or other causes. The terms “Attrition” and “Turnover” are well-known concepts in the business sector. According to the Merriam-Webster dictionary, “Attrition” is defined as “a reduction in the number of staff or participants that occurs when people depart because they resign, retire, etc., and are not replaced” [1]. It can be classified into two types: one is voluntary and other is non-voluntary attrition. When workers quit their companies for personal reasons, it is referred to as voluntary turnover. On the other hand, if the employer terminates employees for work-related reasons, it is called non-voluntary attrition [2,3]. In the enterprise, turnover is a major issue that adversely impacts an organization’s ability to grow and maintain its reputation. The situation can worsen and become unavoidable when employees leave their jobs for personal or professional reasons, such as dissatisfaction with the work environment, lack of promotion opportunities, or long commutes. Frequent employee attrition creates significant challenges for HR departments, including the loss of skilled workers, costs associated with recruiting and training new staff, administrative expenses, and the destabilization of the work environment. Before taking drastic actions, it is important for them to carefully analyze the underlying causes of turnover. These causes may include concerns about their monthly salary, job satisfaction, consistent salary raises, and their relationships with managers or authorities. Such issues contribute to early attrition. Consequently, organizations today are strongly focused on minimizing the attrition rate at all costs, as finding an exact replacement for a departing employee is both difficult and time-consuming [4].
Businesses must recognize the importance of individual competencies and the ability to learn and adapt in the workplace. They also need to invest more time in understanding employees’ growth aspirations and satisfaction within the company. By doing so, they can forecast which employees might leave in the next few years and offer more opportunities to retain them. This approach boosts worker motivation and helps the company retain experienced and talented staff. Nowadays, the use of predictive models enables organizations to convert historical data into actionable insights, facilitating accurate predictions about employee behavior. This capability helps mitigate significant issues related to turnover and optimizes HR-related tasks. Consequently, estimating the turnover rate and identifying the key factors contributing to attrition in organizations become more manageable, underscoring the relevance of AI in addressing these challenges. The integration of AI technologies into human resource management is transforming how organizations handle employee turnover. In today’s AI era, several ML algorithms play an important role in predicting employee attrition. These predictive algorithms significantly assist HR departments in making informed decisions. With historical data on employee turnover, HR departments can not only take timely action to address issues but also enable the organization to implement proactive strategies to improve workflow, productivity, and overall performance.
This research not only contributes valuable insights to the existing literature on employee retention strategies but also highlights the role of AI in enhancing HR practices. Various ML techniques, such as XGBoost, Decision Tree (DT), Grey Wolf Optimization (GWO), Naïve Bayes (NB), and RF have been extensively used in previous studies to analyze employee turnover [5–7]. These methods are particularly effective in automatically and accurately predicting turnover, enabling organizations to take proactive measures to retain talent [8–11]. There is still need for development even though their testing accuracy is sufficient [12–16]. Most of the time, researchers take into account a lot of features without paying much attention to feature engineering [5,17]. In this study, we evaluated the effectiveness of our suggested approach using an extended dataset and the IBM HR Analytics dataset, which is accessible on the IBM website and Kaggle. To improve the prediction accuracy for employee turnover across both datasets—which comprise 34 features—we used a novel feature engineering technique. Additionally, we did experiments with innovative, well-known models such as CatBoost [18,19], LR, RF, XGBoost, and SVM with Linear and Radial Basis Function (RBF) kernel for predicting employee attrition. We particularly focused on CatBoost, which is one of the gradient boosting methods that is an extremely good fit for categorical features. Both datasets have eight categorical features, and for that reason, CatBoost performs best in this experiment. Consequently, we can precisely forecast attrition with the aid of our boosting algorithm, which can help any firm enhance alternative retention tactics for important employees and raise employee happiness. This study identifies the top ten features driving attrition, including “Monthly Income”, “Over Time”, and “Total Satisfaction”, etc. Notably, “Total Satisfaction”, a feature derived through our innovative feature engineering process, ranks among the top three factors. These insights provide valuable information that enables HR departments to develop targeted retention strategies aimed at retaining key talent. The following are the key contributions of our work:
– Applied effective feature engineering techniques to significantly improve prediction accuracy, emphasizing the importance of representative feature selection in employee attrition datasets.
– In our extended dataset, we applied our detection system separately to evaluate our proposed strategy and investigate its scalability and efficiency in predicting and detecting errors, ensuring adaptability to diverse real-world scenarios.
– To demonstrate our suggested strategy’s efficiency, we analyzed the experimental results from both the IBM and extended datasets, showcasing its effectiveness in error prediction and detection.
– This study identified additional critical factors influencing employee attrition, providing actionable insights for HR to develop targeted retention strategies.
This paper proposes an advanced method with refined feature engineering aimed at maximizing the prediction of employee turnover. It is an extension of our previous work [20]. In this refined version, the contributions include: (i) a comparative analysis of the effectiveness of the proposed technique using both the extended and IBM datasets; (ii) a comparison of results between these two datasets; and (iii) the inclusion of more recent works and a summary of their contributions.
The rest of the paper is structured as follows: A critical analysis of the previous research is summarized, which provides an overview of the current perspective on the selected topic under Section 2 as Related Work. The methodology’s processes are covered in Section 3 including an overview of the datasets, preprocessing tasks, feature engineering, suggested models for employee attrition detection, dataset splitting, cross-validation, and evaluation standards for the models that were used. The outputs of the implementations are thoroughly assessed for the conducted experiments, interpretability analysis, and feature importance, which are briefly presented in Section 4. Section 5 offers a general discussion of the entire system and a comparative analysis of the experimental results with previous works. Section 6 contains the study’s closing statements and the potential future work that may enhance the scope of this research.
Employee attrition is considered a significant capital loss for organizations [21]. Minimizing attrition is one of the most challenging issues for any company. Several approaches have been implemented to enhance algorithms for detecting employee turnover, using both the IBM dataset and other datasets. In this section, we will introduce some of these works.
2.1 Features Influencing Employee Turnover
The impacts of employee churn are devastating when it is unpredictable. It negatively affects the company’s financial sector as well as the working environments of its existing workers. The authors [22] analyzed a dataset was analyzed to identify key factors contributing to employee turnover. They concluded that the turnover rate is higher among employees with technical degrees compared to those with medical degrees. Similarly, another study [23] claims that mental health status and psychological features such as dissatisfaction with the job, over work-related stress, depression, and anxiety lead to attrition. Additionally, while the attrition rate is relatively high in some industries, like call centers, it affects all companies to some extent [24]. Based on ibid statistics, job satisfaction is strongly correlated with employee attrition. Another research found some factors such as salary, age, carrier development, tenure, and prospective preference is the most significant predictors of voluntary turnover [25]. In [16], Yadav et al. conducted an investigation on seasoned employees and revealed that turnover was not solely driven by salary, but also influenced by other factors such as job satisfaction and working hours. Following that, another research [26] identified employee attitude towards their job is also a reason for employee turnover. It was also claimed that attrition is one of the costliest and difficult workforce issues that companies face. In order to evaluate employee management skills, a study [27] conducted a survey about the company’s managers. This study suggests that organizations should hire managers with strong people management skills, as they can help reduce staff churn rates.
2.2 Importance of Feature Engineering Techniques on Employee Churn
Features can be classified into two types: categorical and numerical. Numerical attributes can be easily interpreted by machine learning models, whereas categorical features require feature engineering, including encoding, scaling, and decisions on feature inclusion and exclusion. Feature engineering can enhance the computational performance of a classification model by identifying significant predictors within a dataset. Some features can also be combined into a single attribute, which can further improve prediction performance. In [22], Bhartiya et al. conducted an experiment to forecast employee turnover using classification models and analyzed the prediction results with and without applying feature exclusion. Their study clearly demonstrated that holistic feature transformation and reduction can significantly improve the performance of predictive models. Another study [6] aimed to enhance the efficiency of predicting employee attrition by employing the data mining technique known as GWO and comparing it with traditional DT-based method called C5.0 and a particle swarm optimization (PSO). Their study concentrated on testing a small number of five features: gender, work-life balance, environment satisfaction, education field, and distance from home. These features were taken from the Kaggle-sourced IBM Watson Human Resource Employee Attrition 2 dataset. Similarly, the authors Yadav et al. [16] conducted an investigation on seasoned employees, using various machine learning techniques to provide comparative results among models and determine the most effective approach. However, their study considered only 11 features when analyzing employee churn, without providing feature importance values in relation to the target attribute. In this paper, Jain and Nayyar [5] utilized the XGBoost algorithm, a robust DT-based boosting technique, and briefly analyzed several reasons for attrition, such as unstable work life, unsatisfactory behavior, and stagnant salary increments.
2.3 Machine Learning Classifier on Binary Classification
Many studies have been conducted on employee churn using ML classifiers, with most addressing it as a binary classification problem. Some works related to my research are discussed below.
Jain and Nayyar [5] employed the XGBoost algorithm, a powerful boosting technique based on decision trees, and conducted a concise analysis of factors contributing to attrition, such as unstable work environments, dissatisfaction with behavior, stagnant salary increments, and related issues. However, in their feature engineering subsection, they did not provide a detailed explanation for the inclusion of three new features and their functionality. While they achieved an impressive accuracy of 89.10%, they did not offer a comparative analysis of the IBM dataset with other related works. In [11], in order to enhance accuracy and area under the curve (AUC), Pratibha and Hegde used the CatBoost model in conjunction with a novel method known as “synthetic generation” to generate more composite characteristics through arithmetic operations. Although they used feature ranking, they did not focus on combining features based on similarity. Additionally, they did not provide a comparative analysis of their results using the same “IBM HR Analytics Employee Attrition & Performance” dataset from Kaggle. Similarly, in [12], Gulmeher and Aiman proposed a method focusing on boosting algorithms based on the IBM HR Analytics dataset. However, the authors only presented the ROC curve in the results section, while other evaluation metrics were omitted. They also did not conduct advanced feature engineering or hyperparameter tuning, which could have improved the effectiveness of their method. Sharma et al. [13] conducted a study using a different dataset that included 14 features collected from Kaggle. They utilized a Mamdani-based fuzzy inference system with nine inputs and outputs, along with some machine learning classifiers. They found that XGBoost outperformed other classifiers, but they only presented the AUC-ROC score as an evaluation metric. It is important to note that their study worked with a dataset that had a limited number of features.
In another study conducted by Sethy and Raut [10], they did some basic exploratory data analysis on the IBM dataset before implementing learning models and showed RF with 85% accuracy. In the data-preprocessing step, they just divided the dataset into training and testing sets without implementing feature scaling and showing correlation matrix. The authors of [16] studied employee attrition among seasoned workers, finding that wages aren’t the sole factor. They used various ML techniques to identify effective approaches. Sharma and Sharma [14], worked on a balanced dataset of employees aged 20–39, finding higher recall and accuracy with RF. Their dataset, however, could benefit from more entries and features. Following that, Punnoose and Ajit [15] compared ML approaches for predicting turnover and found XGBoost outperformed others with 86% accuracy and low memory usage, but lacked feature analysis. In another research, Usha and Balaji [7] presented that classification algorithms outperformed clustering techniques, but their methodology only included correlation coefficients for a few attributes.
In the past, accuracy has often been the primary evaluation metric for predicting employee attrition, with various ML algorithms tested and assessed using diverse datasets [9]. In our proposed system, we shift the focus toward feature engineering and opt for a categorical feature-based classifier, CatBoost, to address the challenges associated with employee attrition.
A thorough explanation of datasets, data preprocessing, feature engineering, dataset splitting, cross validation and evaluation criteria of the utilized classifiers were all discussed in this section. The proposed methodology diagram of our study is depicted in Fig. 1.

Figure 1: Proposed methodology diagram
There are two datasets in this study: one is a secondary dataset, and the other is an extended dataset. The descriptions of the datasets are provided below.
The dataset used in this study, known as the IBM HR Employee Attrition dataset, was selected due to its relevance for studying employee turnover, a key topic in human resource analytics. The dataset was generated by IBM data scientists specifically for examining the factors associated with employee attrition. This artificially simulated dataset is widely utilized in research as there are limited open-source employee datasets available, largely due to privacy and data protection laws that restrict access to real-world data. Therefore, this dataset was chosen for conducting this research, as it provides an ethical and viable alternative for studying employee turnover patterns.
The IBM dataset includes 1470 records with 34 features, covering various attributes such as age, job satisfaction, and years at the company, along with a target column labeled “Attrition”. A brief description of the dataset is presented in Table 1. The attrition column categorizes employees into two groups: “yes”, indicating they left the company, and “no”, indicating they stayed. Of the 1470 records, 237 employees are categorized under the “yes” attrition group, while 1233 fall under the “no” group. This uneven distribution creates an imbalanced dataset, which is a common characteristic when one class is significantly smaller than the other. An imbalanced dataset like this one can pose challenges for predictive models, as they may favor the majority class. However, such a distribution is realistic and aligns with typical organizational attrition patterns, thus enhancing the study’s applicability to real-world scenarios. The summary of this dataset is as follows:
– A secondary dataset including 1470 employee records with 35 attributes is used in this work. The dataset focuses on an HR-related binary classification problem.
– Some of the features are age, gender, daily rate, job satisfaction, hourly rate, and others.
– 237 employees are included in the “yes” attrition group out of the 1470 entries, and 1233 employees are included in the “no” attrition category.

Our previous technique [20] was well suited on the IBM dataset. To assess its performance on a more challenging real-world dataset, we applied our proposed method to an extended dataset in this study. To validate that our strategy can be applied to real-world HR practices and effectively handle employee attrition data, we planned to extend the IBM dataset by gathering additional data from a private organization. Since the IBM dataset contains most of the relevant features related to employee turnover research, we also retained the same 34 features and one label in this extended dataset. With the permission of authorities, we conducted the data acquisition process. The data collection phase was carried out through a written self-evaluation form completed by employees, which included 35 question-answer (QA) sessions (see Fig. 2).

Figure 2: QA features analysis and mapping for extended employee dataset
After completing the sessions, we expanded the data of 200 employees, which we named the extended dataset. Fig. 2 outlines the key QA features used for data collection, categorized into several sections such as “Individual Attributes”, “Employee Experience”, “Workplace Context & Contentment”, “Work-related Travel”, “Salary & Earnings”, and “Performance & Evaluation”. The questions, answered by employees, encompass a broad range of factors like age, education, job satisfaction, salary, work-life balance, and travel distance. The raw responses were then compiled and analyzed to form the dataset, with the primary objective of identifying patterns and insights related to “Attrition”, the target variable. This extended dataset has the following characteristics:
– This extended dataset is also a standard dataset. It is applied as a problem of binary classification.
– Same attributes like gender, education, age, work-life balance, and so on which are also seen in the standard IBM HR dataset’s attributes.
– The dataset has 200 employee entries with 35 attributes.
– In this extended dataset, 94 employees were in the “yes” attrition group, whereas 105 were in the “no” attrition category.
This subsection outlines the preprocessing steps that will be employed for subsequent tasks, focusing on feature manipulation.
Handling missing value: As there were no instances of missing values identified in this particular dataset and the extended data set, we proceeded without managing this step.
Converting data types: Prior to employing a detection model, it is essential to convert categorical features into a numerical format. This approach assigns values of 0 or 1 to each data point. For example, for the “Gender” feature, the value 0 corresponds to “Female”, while the value 1 corresponds to “Male”.
Generating the correlation matrix: Displaying the correlation matrix provides insights into the statistical measurement of the correlation coefficient, which calculates the linear relationship between variables. By examining the correlation matrix, we can identify dependencies, distinguishing between strong and weak dependencies among features. Fig. 3 illustrates a diagrammatic representation of the correlation matrix, with values ranging from −1 to +1. A value of +1 indicates a complete correlation, while −1 represents the opposite. Blank spaces indicate the absence of any relationship with other features.
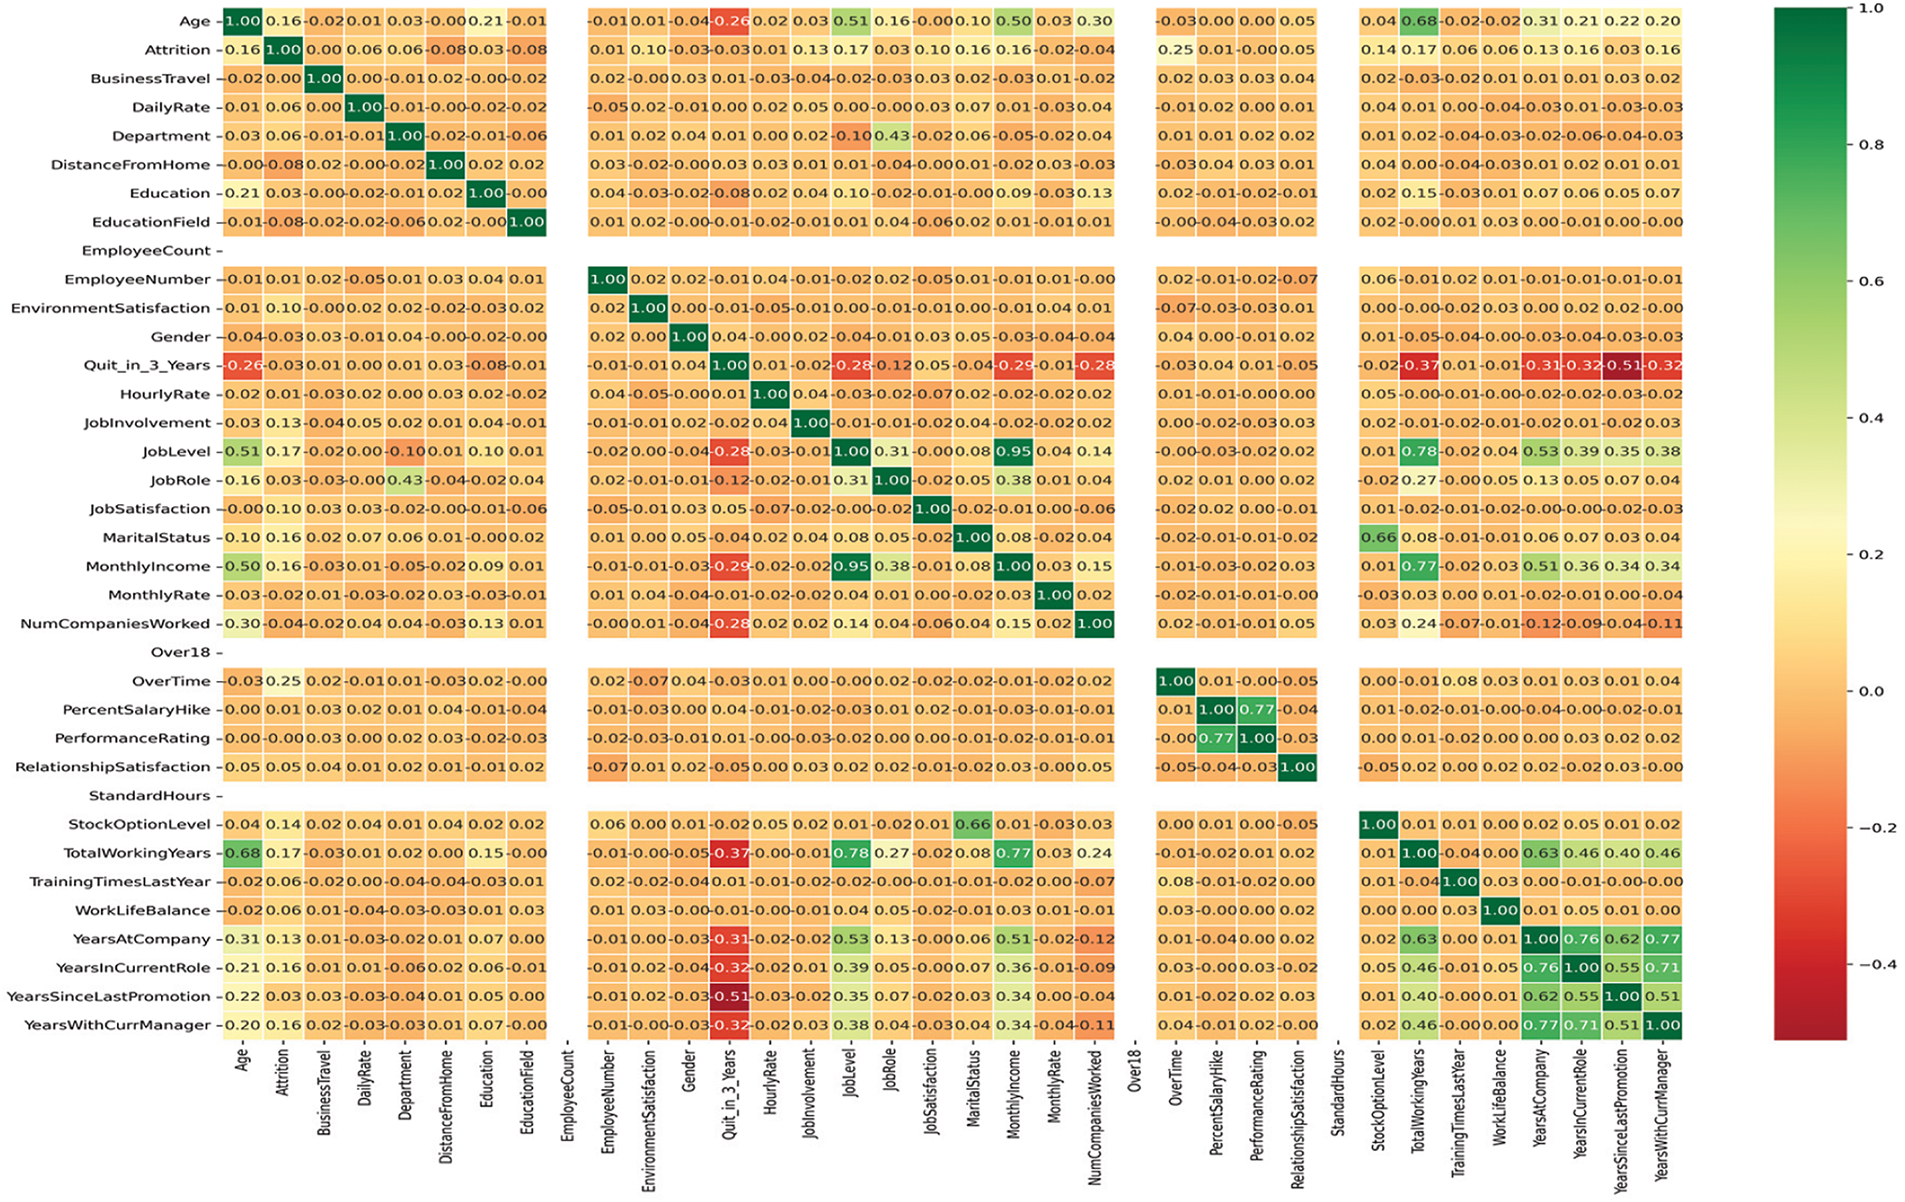
Figure 3: The correlation among the feature variables
Scaling the features: Significant variations among data points within a single feature can often hinder the optimization processes of an algorithm. To enhance classification performance, feature scaling can be utilized. For instance, the “Daily Rate” feature has 234 to 2877 values, this huge value difference may mitigate the performance of a model. To avoid this, we applied a scaling process on numerical features.
To improve the performance of ML models, feature engineering entails converting unprocessed data into pertinent features, developing new ones, or altering preexisting ones. In this empirical study, we carefully analyzed all available features, removing those deemed less relevant and incorporating others that significantly contributed to our predictive objectives. For example, we created composite features by aggregating related attributes, allowing us to capture more intricate relationships within the data. This grouping not only streamlined the dataset but also enhanced the model’s ability to identify key predictors of employee attrition. By focusing on the most impactful features, we ensured greater computational efficiency in our classification models, leading to improved prediction performance. Through thoughtful feature selection and engineering, we optimized the training process, enabling the models to learn more effectively from the data and ultimately improving the accuracy of our detection system. This approach emphasizes the critical role of feature engineering in developing robust ML models for predicting employee turnover. A brief overview of the feature engineering process, starting with feature exclusion and inclusion.
Feature Exclusion: It is evident from examining the correlation matrix, which is shown in Fig. 3, that the target variable, “Attrition”, is unrelated to “Employee Count”, “Over 18”, and “Standard Hours”. Analyzing the “Employee Number” column also showed that every item has a distinct value, suggesting that this column is useless for predicting staff attrition. Thus, the remaining 30 features and one target variable were kept after these four attributes, “Employee Count”, “Over 18”, “Standard Hours”, and “Employee Number”, were eliminated from the features.
Feature Inclusion: In this experiment, “feature inclusion” refers to creating new features and transforming the existing feature to improve the prediction of ML model. It represents the process of grouping of features and introducing some new resulting features. The idea behind the inclusion of the features is that some of the features basically represent one new representative feature. For example, in our two datasets, “Environment Satisfaction”, “Job Involvement”, “Job Satisfaction”, “Relationship Satisfaction”, and “Work-Life Balance” features highly indicated a new feature that we named “Total Satisfaction”. That’s why we introduced this new feature (Total Satisfaction) by eliminating the previous ones (such as “Environment Satisfaction”, “Job Involvement”, “Job Satisfaction”, etc.) that were mentioned previously. In the same manner, we also found another new feature named “Experience Less Than Three Years”. Therefore, the empirical study has resulted in the addition of the following two new features, which are discussed in detail below. Additionally, Fig. 4 illustrates how these two features are generated.
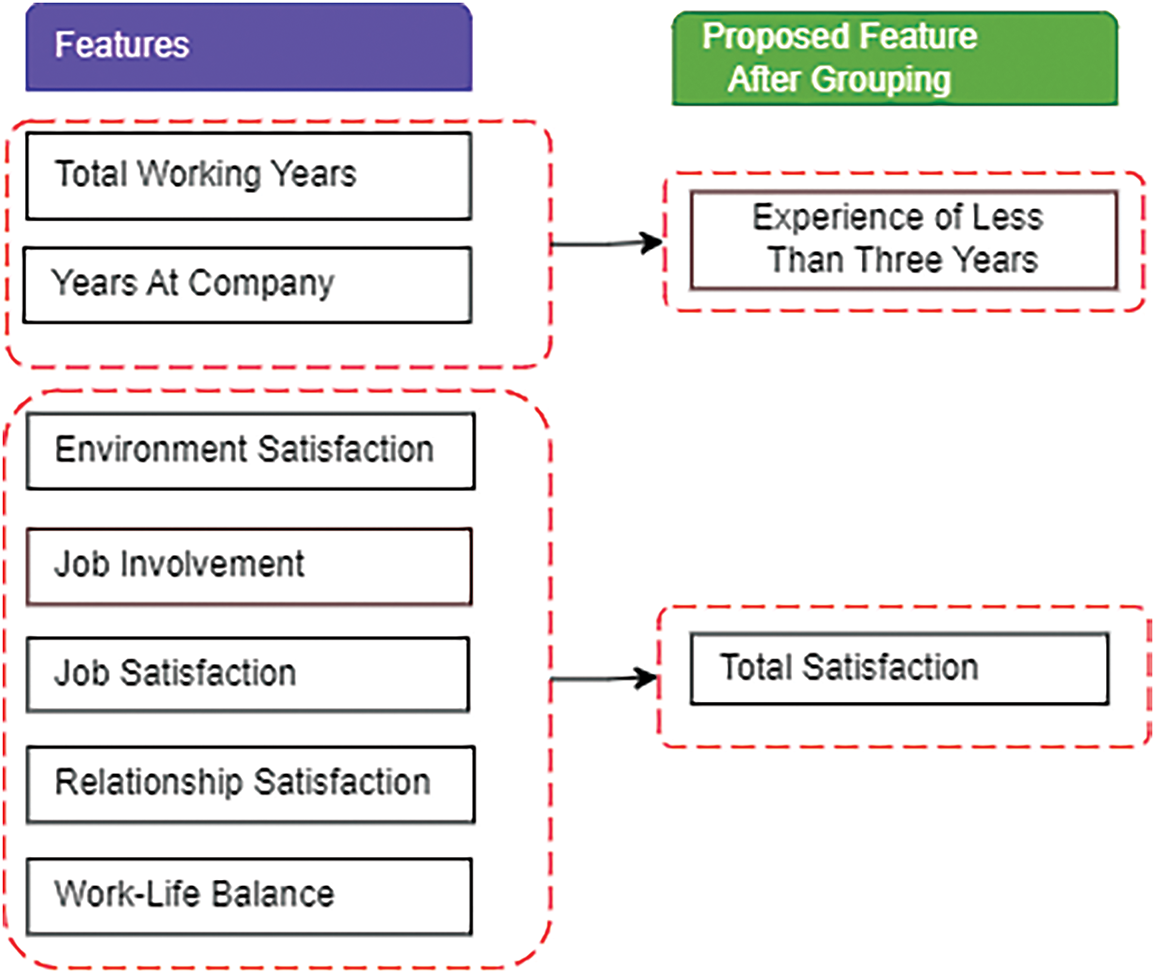
Figure 4: Grouping of seven features
Experience Less Than Three Years: This new feature combines the “Total Working Years” (TWY) and “Years At Company” (TAC) attributes. Any employee will have less than three years of work experience whose “Total Working Years” and “Years At Company” attribute values for any company are less than three years will have a label value of 1, otherwise, it would be 0, as shown in Eq. (1).
Total Satisfaction: It was mentioned previously that an employee’s total satisfaction depends on “Environment Satisfaction” (ES), “Job Involvement” (JI), “Job Satisfaction” (JS), “Relationship Satisfaction” (RS), and “Work-Life Balance” (WLB) in this dataset. We inaugurated this new feature by taking the average of the arithmetic values of all five attributes into account, as shown in Eq. (2).
We categorized all of the features into three groups after completing the previously described exclusion and inclusion procedures. These groups are called Feature Engineering Type 1 (FET-1), Feature Engineering Type 2 (FET-2), and Feature Engineering Type 3 (FET-3). These three categories are detailed below, outlining their properties, and their creation is shown in Fig. 5. This figure provides a visual representation of how each type is derived from the initial dataset, highlighting the key processes involved in their creation.
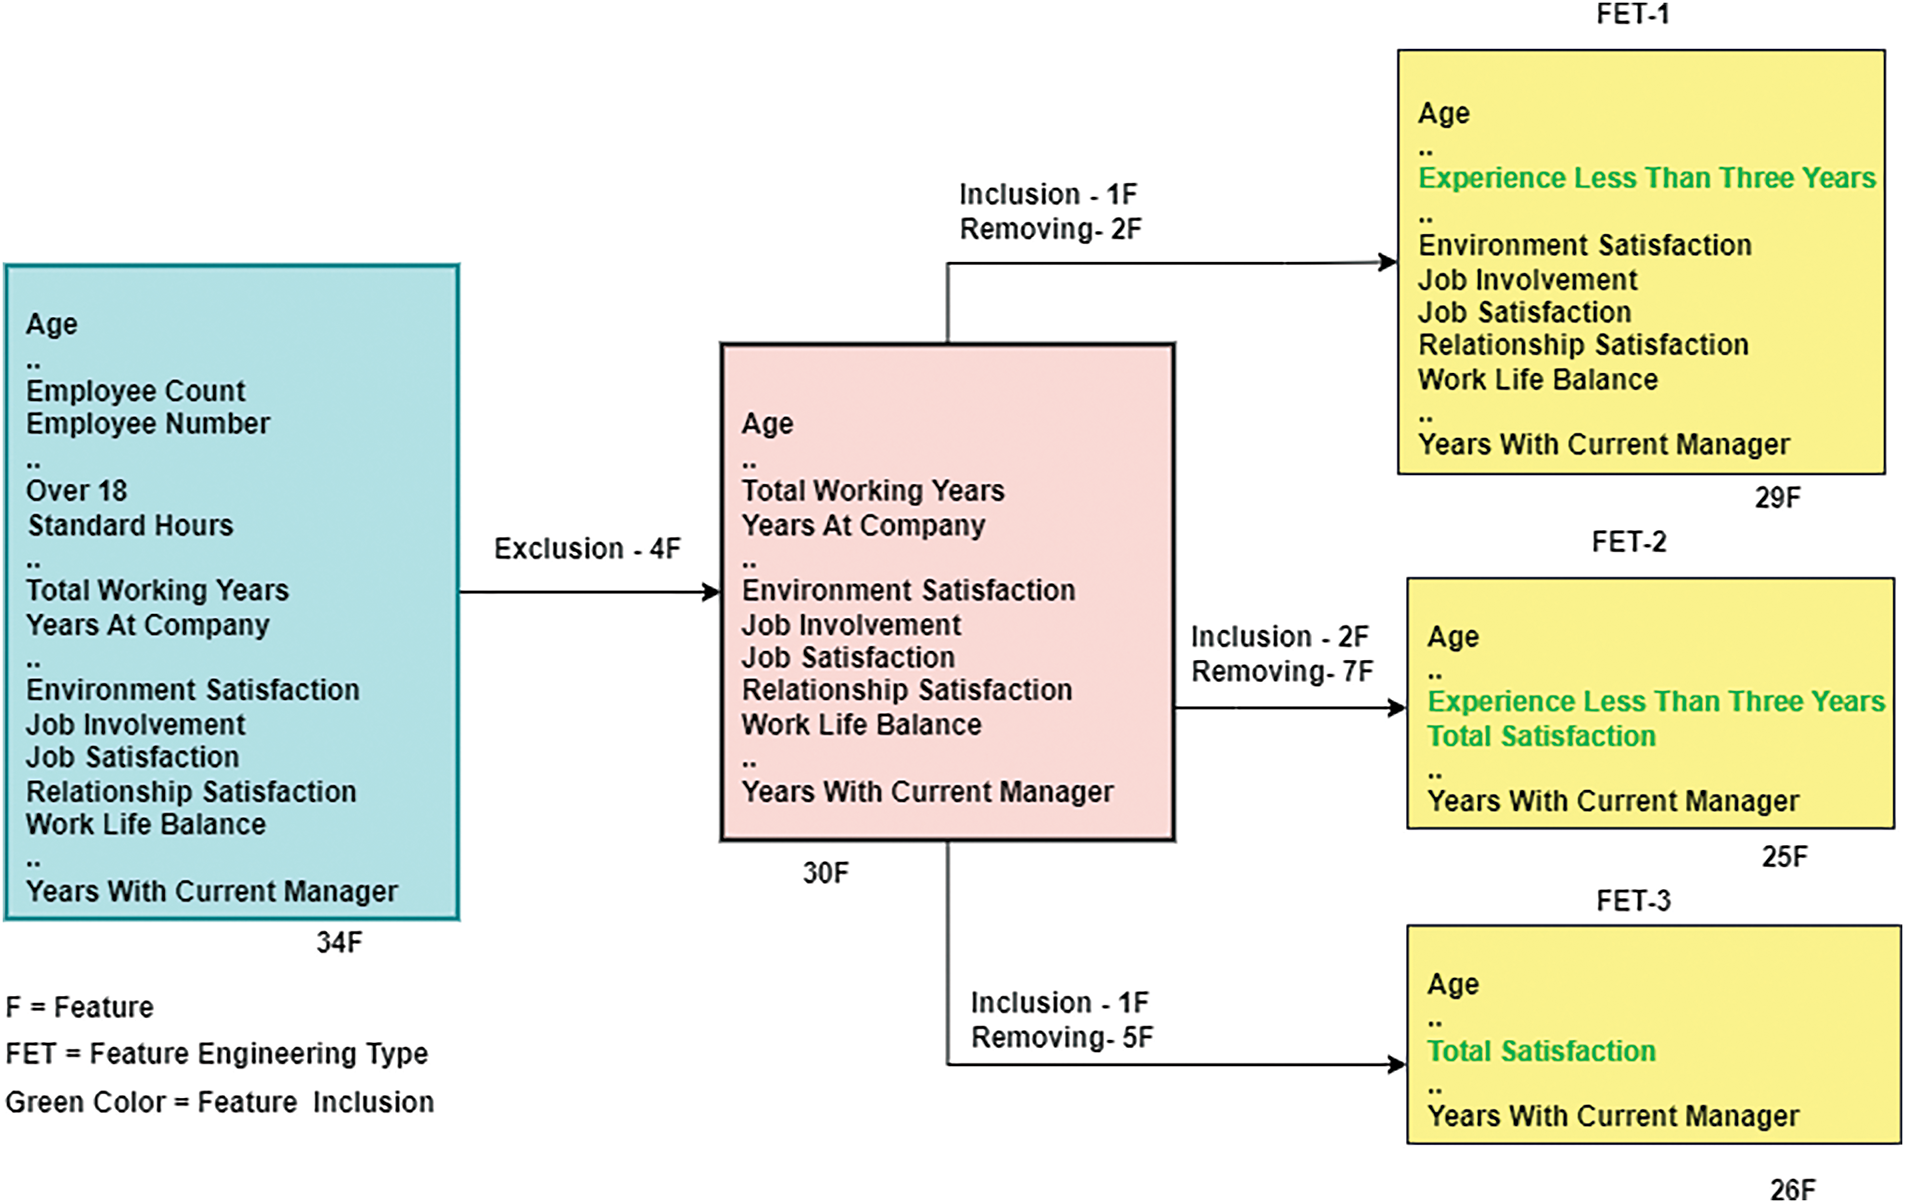
Figure 5: Feature engineering types
FET-1: After exclusion, we obtained 30 input variables and one target column. In FET-1, we only include the “Experience less than three years” feature and remove two features (“Total Working Years”, “Years At Company”) that are beneath the new features. Finally, FET-1 includes 29 features and one label.
FET-2: We were able to obtain 30 features and one label using the exclusion process. Two new features, “Experience Less Than Three Years” and “Total Satisfaction”, are being added to FET-2, and seven features that are underneath the two new features are being eliminated. FET-2 will eventually comprise 25 features and one target column.
FET-3: Following the same exclusion process as in FET-2, we obtained 30 attributes and one target variable. In FET-3, only one new feature, “Total Satisfaction”, was added, while five ones that were below it were eliminated. In the end, FET-3 has 26 input attributes and one label.
In this experiment, we implemented various ML models to tackle the classification problem, as our dataset contains two classes: attrition and non-attrition. ML techniques, such as DT, LR, and SVM [28], serve as foundational approaches for traditional techniques, while more complex techniques like RF, XGBoost, and CatBoost represent advanced ensemble and boosting methods. This research employs methods like XGBoost and RF, which are particularly effective for handling complex, high-dimensional data, allowing us to capture predictive factors for employee attrition by modeling non-linear relationships within the data. Each model was trained on the training set and tested on the test set to identify the best-performing classifier. Five algorithms were applied in this analysis: RF, SVM with Linear and RBF kernel, XGBoost, CatBoost, and LR. The models are divided into two categories: one for traditional ML models and the other for boosting algorithms. Brief descriptions of these categories of classifiers are discussed below.
3.4.1 Conventional Machine Learning Models
Conventional ML models, including RF, SVM with Linear and RBF kernel, LR, are commonly used for analyzing and predicting employee attrition. RF, an ensemble-based bagging algorithm, reduces overfitting by averaging predictions from bootstrapped subsets of data [29,30]. SVM, known for its maximum margin classifier, is effective for classification and regression tasks, leveraging the maximum marginal hyperplane to separate data classes [31,32]. LR, a basic linear model, uses the sigmoid function to map features to binary outcomes, making it suitable for the IBM dataset’s binary classification problem [33]. Particularly, CatBoost demonstrated the best performance in our experiments, and its operating principle is detailed below.
In this section, we focus on boosting algorithms, particularly CatBoost and XGBoost, which have shown exceptional performance in predictive modeling. These algorithms enhance the accuracy of models by iteratively combining weaker learners, making them highly effective for complex datasets and structured data analysis. A brief description of these algorithms is given below.
Extreme Gradient Boosting: The package called eXtreme Gradient Boosting is abbreviated as XGBoost. This gradient boosting framework implementation is both scalable and effective. Both a tree learning method and an effective linear model solver are included in the package [34]. It can perform a variety of objective functions, including as regression, classification, and ranking.
In modern business environments, predicting employee turnover has become a critical use case for AI and ML. Employee turnover is influenced by a combination of demographic factors, job satisfaction, performance metrics, and other personal attributes, many of which are categorical features. Traditional ML models often struggle with categorical data, especially when the dataset has many such features, as they typically require extensive preprocessing, such as one-hot encoding, which can lead to a loss of useful information and increase the dimensionality of the dataset. CatBoost is particularly well-suited for categorical data due to its ability to handle categorical features natively, without the need for extensive preprocessing. The theoretical explanation of the use of the CatBoost model in our context and its working principle is detailed below:
CatBoost: “Category” and “Boosting” are the two words that make up the moniker “CatBoost”. “Boost” refers to the gradient boosting machine learning algorithm. It’s a new open-source ML model from Yandex. Deep learning frameworks like as Apple’s core ML and Google’s TensorFlow are simply integrated with it. This new method outperforms conventional classifiers in handling categorical features [18,19]. It also offers the highest level of precision in its class. CatBoost performs effectively with the various categorical features in our dataset. Additionally, it employs a unique method for constructing DTs, which helps prevent overfitting, a common challenge in other models due to the complexity of human behavior. By using symmetric DTs and reducing gradient bias and prediction shift, it ensures that the model is not only accurate but also generalizes well to unseen data. This results in better performance than other commonly used models, such as XGBoost and LightGBM, which can struggle with categorical features without significant manual tuning. In this research, after performing the feature engineering process, we introduced two new categorical features, and the original dataset contains eight categorical features. In total, we considered ten categorical features, which contribute to better performance of the CatBoost algorithm in predicting employee turnover in this context.
Algorithmically, CatBoost is highly effective for employee turnover prediction tasks, where categorical variables such as department, job role, marital status, and education field play a significant role. It’s ability to automatically handle these features results in more accurate and robust models while significantly reducing the amount of time and effort needed for feature engineering. Moreover, employee turnover is influenced by complex interactions between features (e.g., the relationship between an employee’s job satisfaction and overtime work), which can be challenging for traditional models to capture. CatBoost’s gradient boosting approach excels in capturing these non-linear relationships, providing high accuracy in prediction tasks by learning from the data iteratively. It incrementally improves its performance by focusing on the residual errors from previous iterations, making it highly efficient for predictive tasks where nuanced patterns need to be discovered from the data.
Particularly, CatBoost is a powerful gradient-boosting technique designed for classification and regression tasks. A powerful ML algorithm, gradient boosting is frequently used to address a variety of commercial issues, such as fraud detection and recommendation systems. In order to reduce overfitting, it also uses a special method for calculating leaf values while selecting the tree structure. This strategy therefore performs better than earlier techniques like gradient-boosted decision trees (GBDT), XGBoost, and LightGBM. It maintains a GBDT framework using symmetric DT with fewer parameters. This results in high precision, fast processing of class-type characteristics, and support for class variables. In DT, the label guides node splitting through a process known as greedy target variable statistics. The formula for this is expressed as follows, as shown in Eq. (3):
This approach’s drawback is that features typically contain more information than labels. Representing features by label averages can cause conditional bias when training and test data distributions differ. A standard improvement to Greedy TS (Target-based Statistics) is adding a priori distribution terms to mitigate noise and low-frequency category data, with the formula is shown in Eq. (4):
where a usually denotes the weight coefficient greater than 0 and p is the appended prior phrase. The CatBoost algorithm’s flow chart is displayed in Fig. 6.
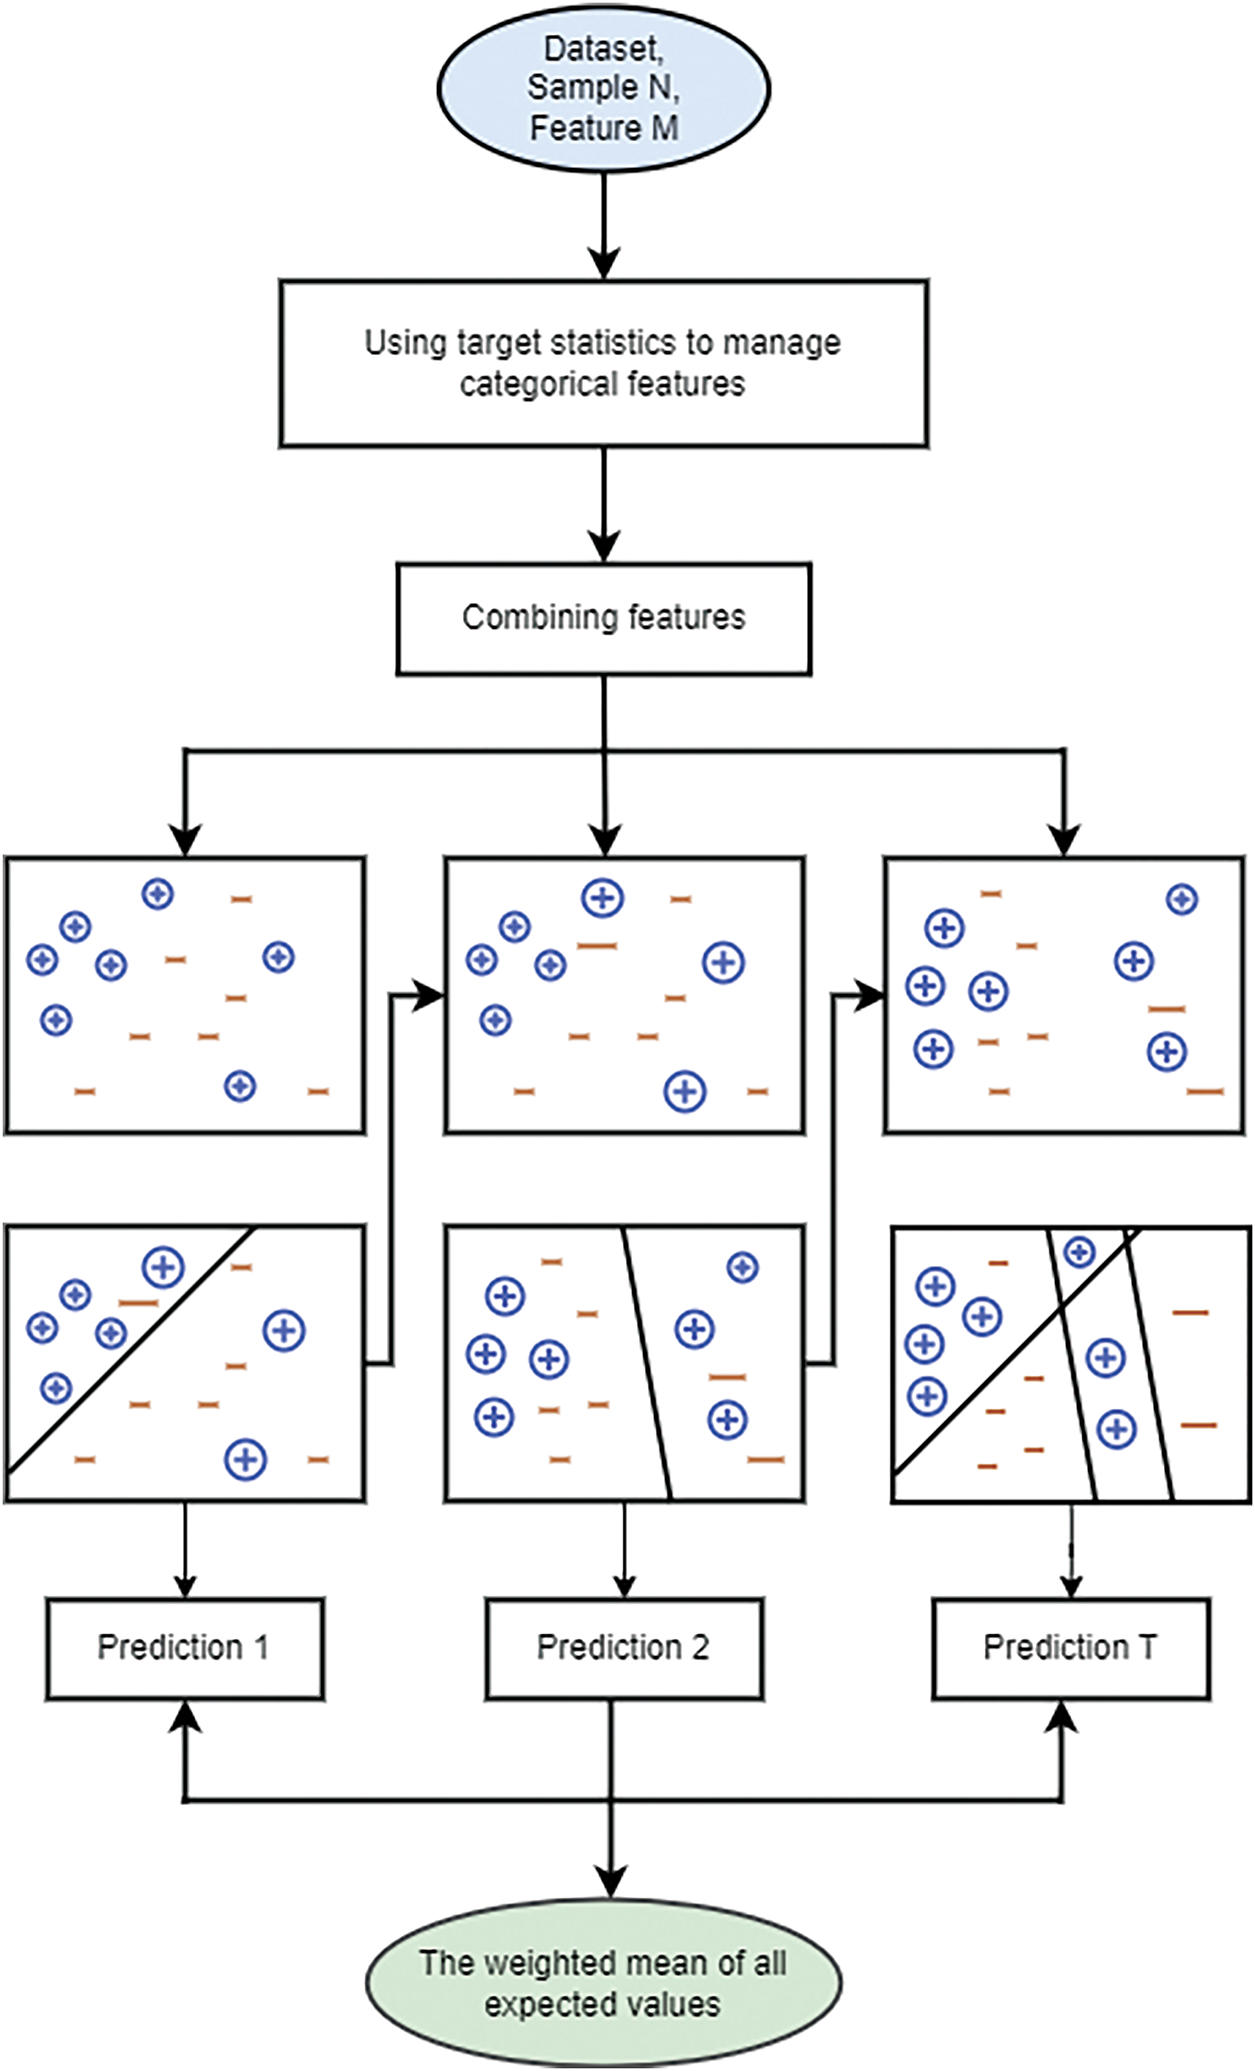
Figure 6: Flow chart of CatBoost technique
In our study, the process of CatBoost algorithm begins with an input dataset consisting of N samples and M features. Initially, feature engineering techniques are applied to handle classification within these features, enhancing the data’s quality and relevance for model training. Following feature engineering, the features are combined into a more informative dataset. The algorithm then proceeds through several stages of model training. In the first stage, depicted in the leftmost sub-image, the initial model makes predictions on the dataset, where positive samples are indicated by + and negative samples by −.
In subsequent stages, shown in the middle and right sub-images, the model iteratively refines its predictions. Each stage updates the model based on the errors from the previous stage, with particular focus on misclassified samples. This process involves extending the weights of incorrectly classified samples to ensure they receive more attention in the next iteration. The final step in the CatBoost process is to aggregate the results from all stages. This is done by calculating a weighted average of all the predicted values, as shown in the green oval at the bottom of the flow chart. This weighted averaging helps to improve the model’s overall accuracy and robustness, mitigating the risk of overfitting and enhancing predictive performance. Through this iterative boosting process, CatBoost effectively leverages the strength of multiple weak learners to create a highly accurate and reliable predictive model.
Before training the evaluation model with data, the standard approach is that the dataset has two distinct sets, one for training the model and the other for testing. Due to the limited records in our dataset, we split our secondary and expanded datasets into two sets with an 80:20 ratios.
K-fold cross-validation is a widely used cross-validation method. The complete dataset is separated into training and test sets during this procedure. This division is usually around 80% for instruction and 20% for testing. The training set is then further separated into K folds or subsets. Firstly, the first fold is used for the validation set, and the remaining (K − 1) folds or subsets are used for training the model to generate prediction results. Secondly, the second fold is used as a validation set, and the rest of the subsets serve as the training set to produce prediction results. This process continues until the last fold is used as the validation set. In the end, all prediction results are averaged, and the final result is utilized as the testing accuracy. This process addresses the issue of data overfitting, as a significant portion of the data is used to validate the model, ensuring that the model encounters a variety of unseen data. Although 5-fold cross-validation is generally used, we opted for 10-fold cross-validation to achieve the most robust and accurate performance of predictive models. The whole process is depicted in Fig. 7.
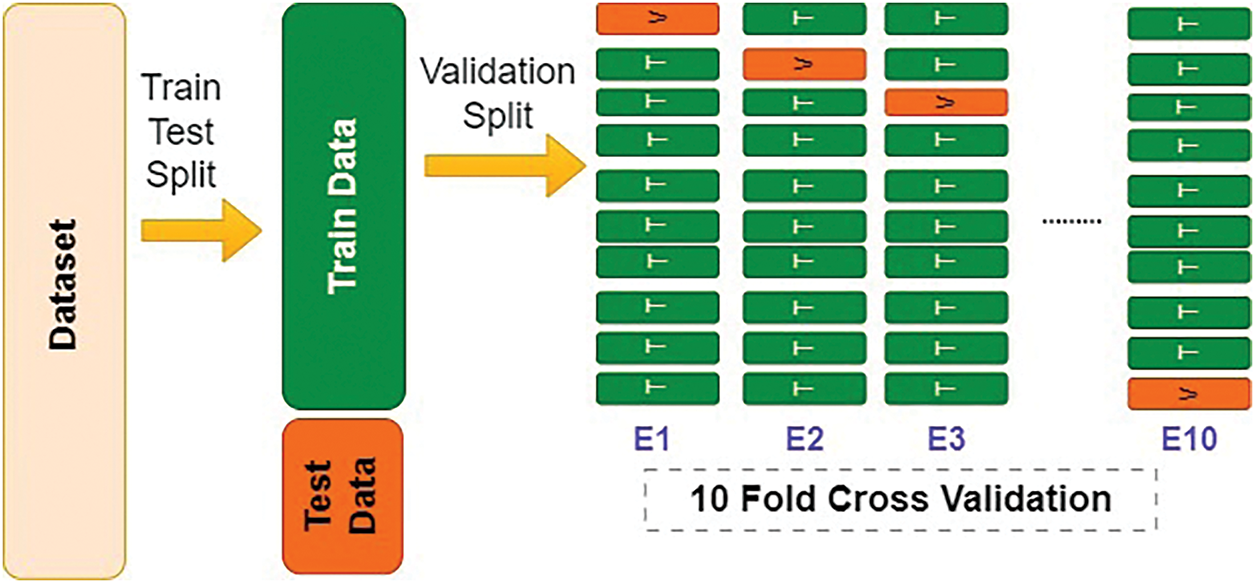
Figure 7: 10-Fold cross validation
3.7 Evaluation Criteria for Predictive Model(s)
In this research, the performance of the classifier was evaluated using various metrics including the Precision, Recall, F1 measure, and Accuracy. Throughout the equations presented below, the notation TP represents ‘True Positive’, TN represents ‘True Negative’, FP represents ‘False Positive’, and FN represents ‘False Negative’.
Accuracy is defined as the number of correct predictions divided by the total number of input samples (predictions) [35]. The formula is shown in Eq. (5):
Precision is the percentage of positive patterns that are correctly predicted out of all predicted patterns in a positive class [35]. The formula is shown in Eq. (6):
A recall is another viable evaluation metric option to determine the number of positives that can be fairly predicted [36]. The recall is used to calculate the percentage of positive patterns, as shown in Eq. (7).
A classifier’s accuracy and recalls are balanced by the F1-score [36]. As seen in Eq. (8), the F1-score gives the classification model a balance between accuracy and recalls.
We tested five classifier models using linear and RBF kernels across three feature engineering types (FET-1, FET-2, and FET-3): CatBoost, XGBoost, RF, LR, and SVM. The IBM dataset was divided into 80% for training and 20% for testing using the “train test split” technique before the models were applied. To guarantee that the training and testing subsets preserved the same class label distribution as the original dataset, the “stratify” parameter was employed. Using the training dataset, the models were initially trained to discover the connections between the input data samples. The models’ ability to predict new data and compute prediction errors was then assessed using the testing dataset.
If we add a new feature, “Experience Less Than 3 Years”, as FE Type-1, CatBoost outperforms the other classifier both on IBM dataset and the extended dataset. As indicated in Tables 2 and 3, it outperformed the other model in terms of accuracy, rising to 90.14% and 98.10%, respectively. As seen in Fig. 8, CatBoost fits and performs well in this feature engineering type, as evidenced by the respectable precision and recall values. With a low mistake rate (less than 9.9% and less than 1.5%, respectively) in comparison to the previous research studies, our CatBoost-based methodology proved to be the most effective.

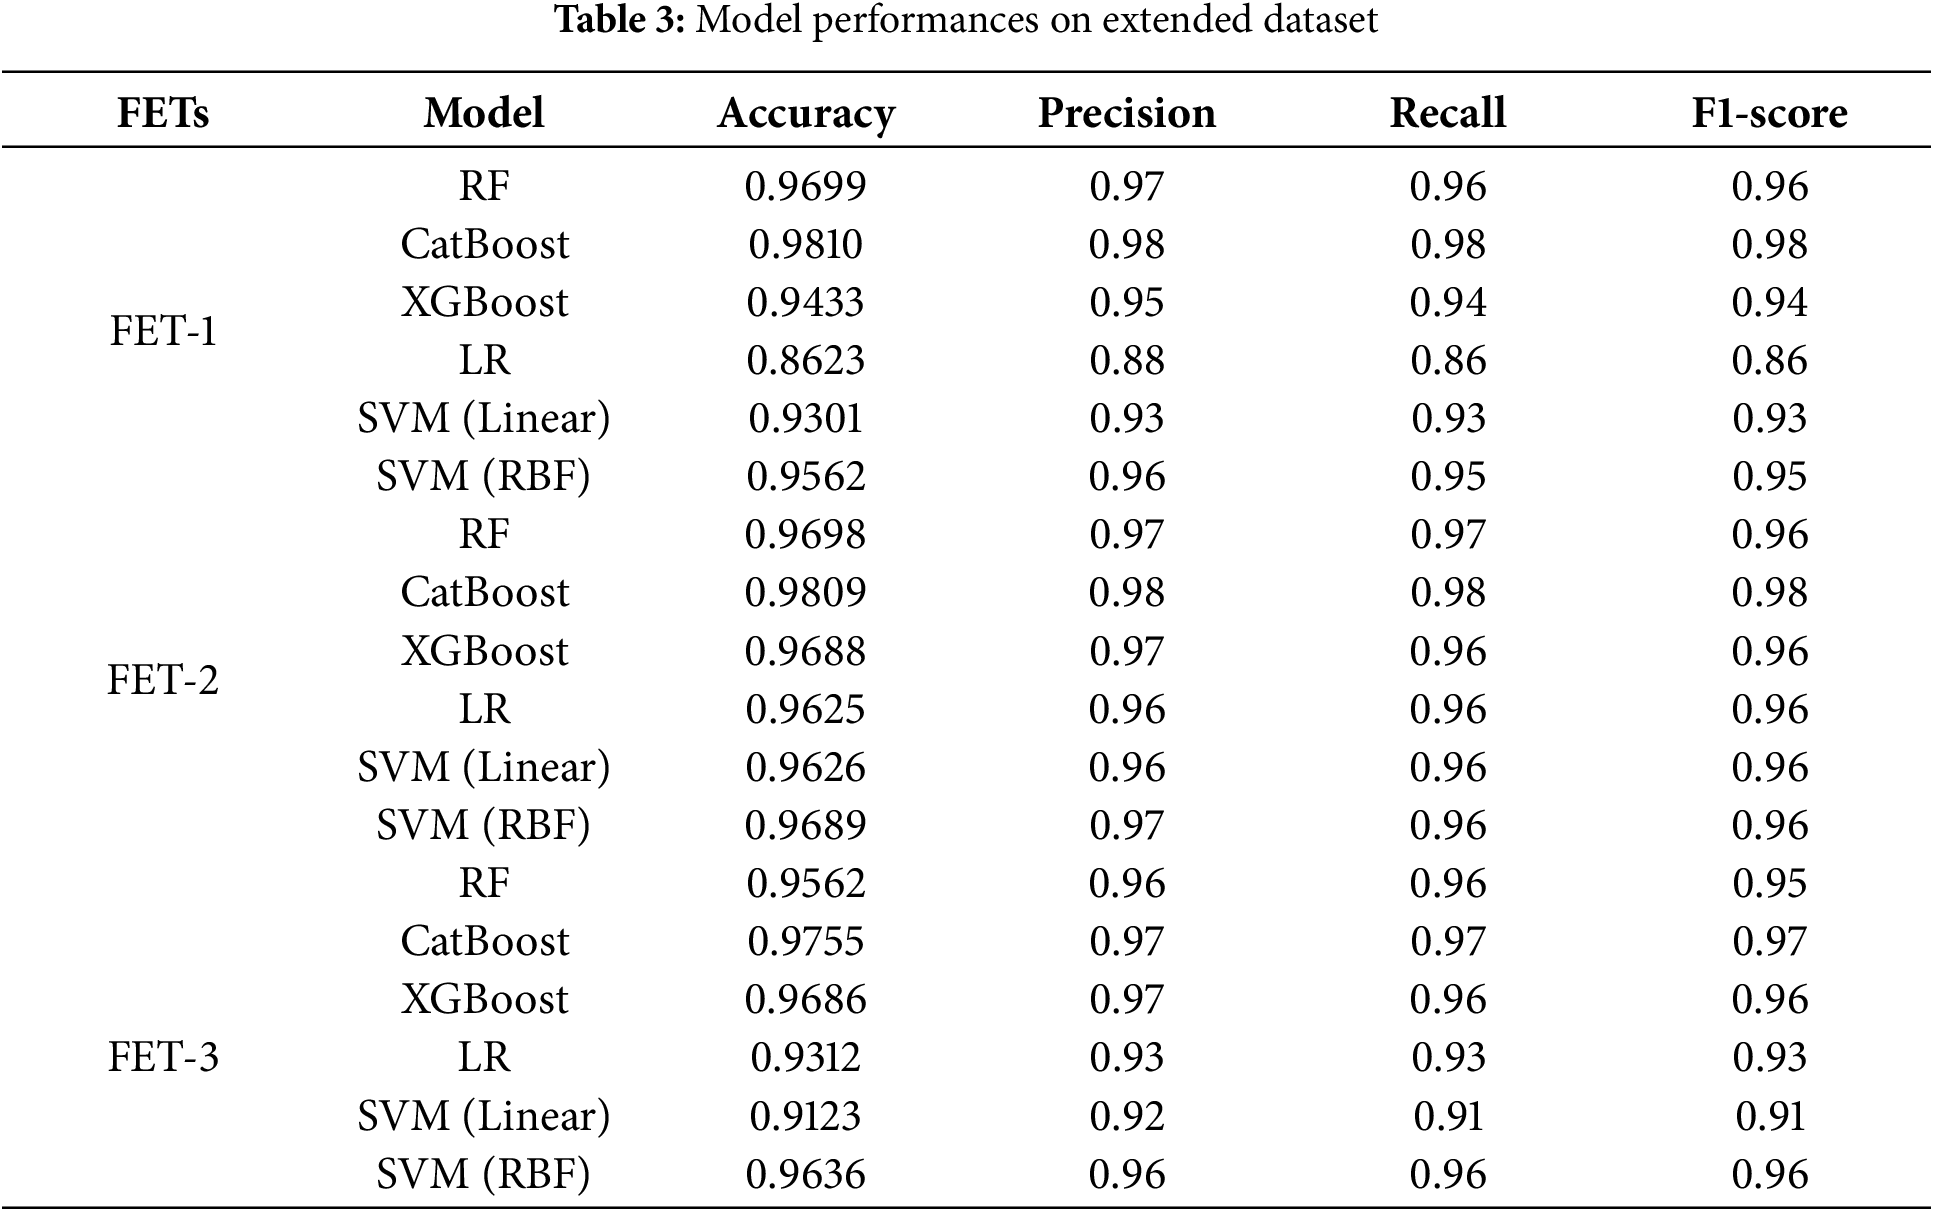
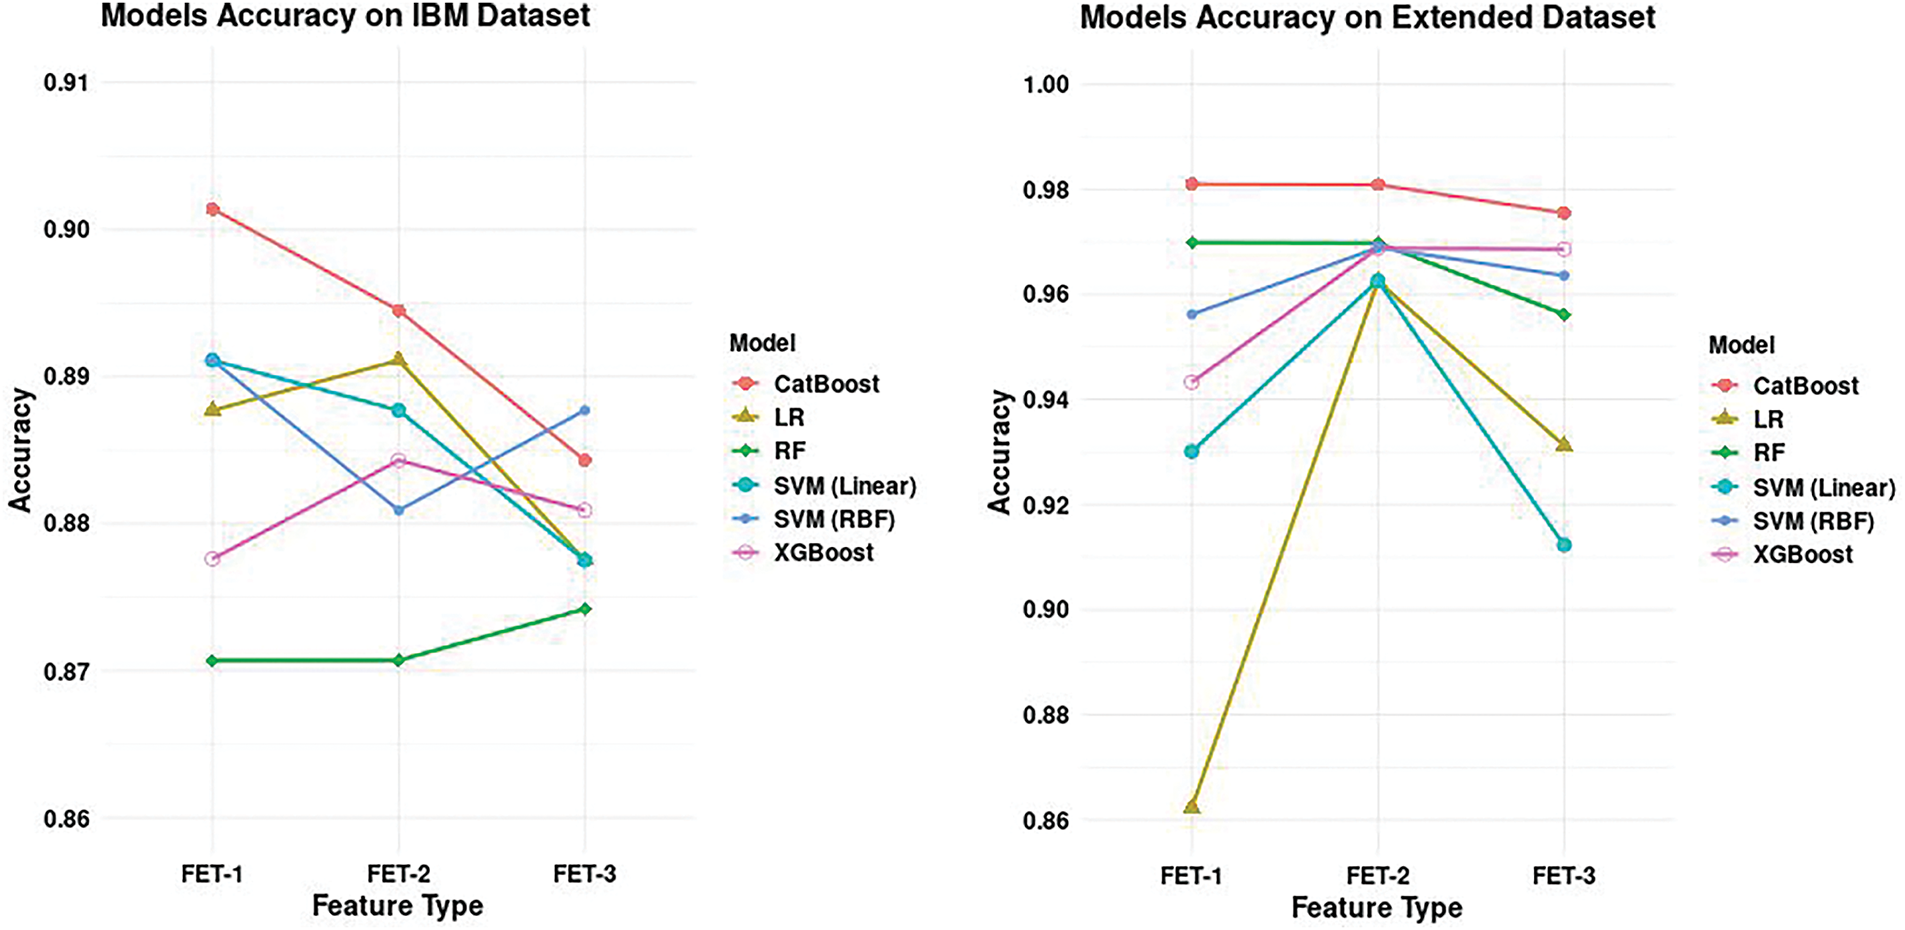
Figure 8: Model performance comparison with IBM and extended dataset
It also surpasses the other classifiers by incorporating two additional features, “Experience Less Than 3 Years“ and “Total Satisfaction“, as in FET-2. This enhancement resulted in improved accuracy compared to the other models, achieving 89.45% and 98.09% as shown in Tables 2 and 3, respectively. Additionally, precision and recall value reveal that CatBoost is the best performer in this feature engineering type also as shown in Fig. 8. Again, it exceeded the previous studies in terms of error rate (less than 11% and 2%, respectively). In FET-3, we focused on 26 features. The improved model also resulted in higher accuracies of 88.43% and 97.55%, respectively, as indicated in Tables 2 and 3, respectively. The precision and recall values are sufficiently high, indicating once more that it performs well with this feature engineering approach.
On the contrary, RF is an algorithm that leverages randomness to achieve robust generalization. However, it still struggles with over-fitting in this particular scenario. In contrast, XGBoost attempts to build new trees that complement existing ones [15], thereby enhancing training for challenging data points. In this experiment, boosting improves training for difficult-to-classify data points. Moreover, CatBoost demonstrates superiority over other classifiers by effectively managing categorical variables and incorporating them seamlessly into its decision-making process, which enhances its overall performance in complex datasets. In conclusion, our proposed method demonstrated the highest performance on the IBM dataset and its extended data, validating our claim that our approach surpasses those of previous studies.
The feature importance of the best classifier across the three FE types is shown in Figs. 9–11. In our experiment, CatBoost emerged as the best classifier, so we focused exclusively on the feature importance rankings generated by it. After exploring the figures of feature importance, we can conclude that the top ten features influencing employee attrition are: “Monthly Income”, “OverTime”, “Age”, “Total Satisfaction”, “Distance From Home”, “Job Role”, “Hourly Rate”, “Stock Option Level”, “Marital Status”, and “Number of Companies Worked”. Notably, our newly introduced feature, “Total Satisfaction”, ranked within the top three features in the FE Type-3 and FE Type-2 CatBoost feature importance figure. This significant placement highlights that “Total Satisfaction” plays a crucial role in predicting employee attrition. Figures depicting the CatBoost feature importance for three different feature engineering types show that in FE Type-1 and FE Type-2, “Monthly Income” and “OverTime” consistently appear as the most important features, with “Age” also showing high importance. However, in FE Type-3, “Total Satisfaction” takes the top spot, followed closely by “Age” and “OverTime”, emphasizing its significant impact. The consistent presence of “Monthly Income”, “Distance From Home”, and “Job Role” among the top features across all three types underlines their importance in the model’s predictive power. The inclusion of “Total Satisfaction” has proven to be highly impactful, reinforcing our claim that it significantly enhances the model’s ability to predict employee attrition.
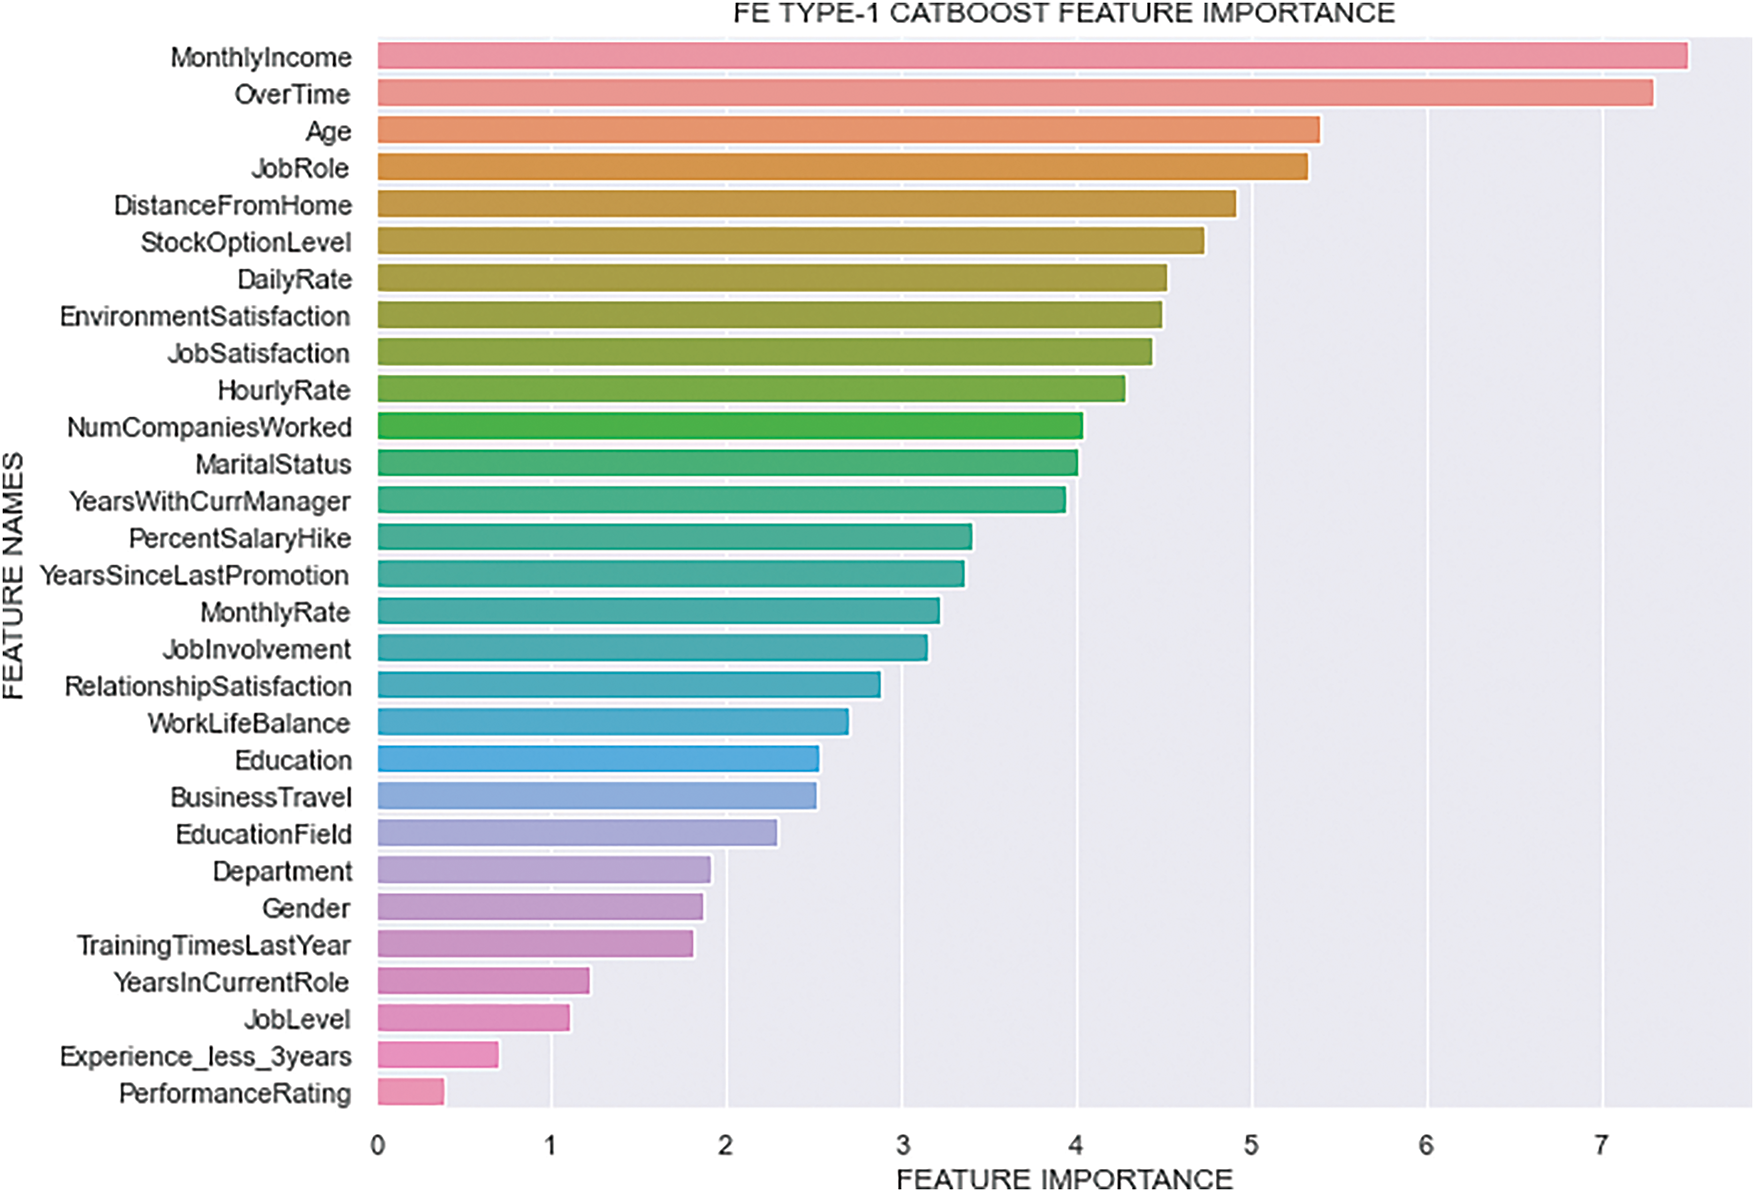
Figure 9: FE Type-1 CatBoost Feature Importance
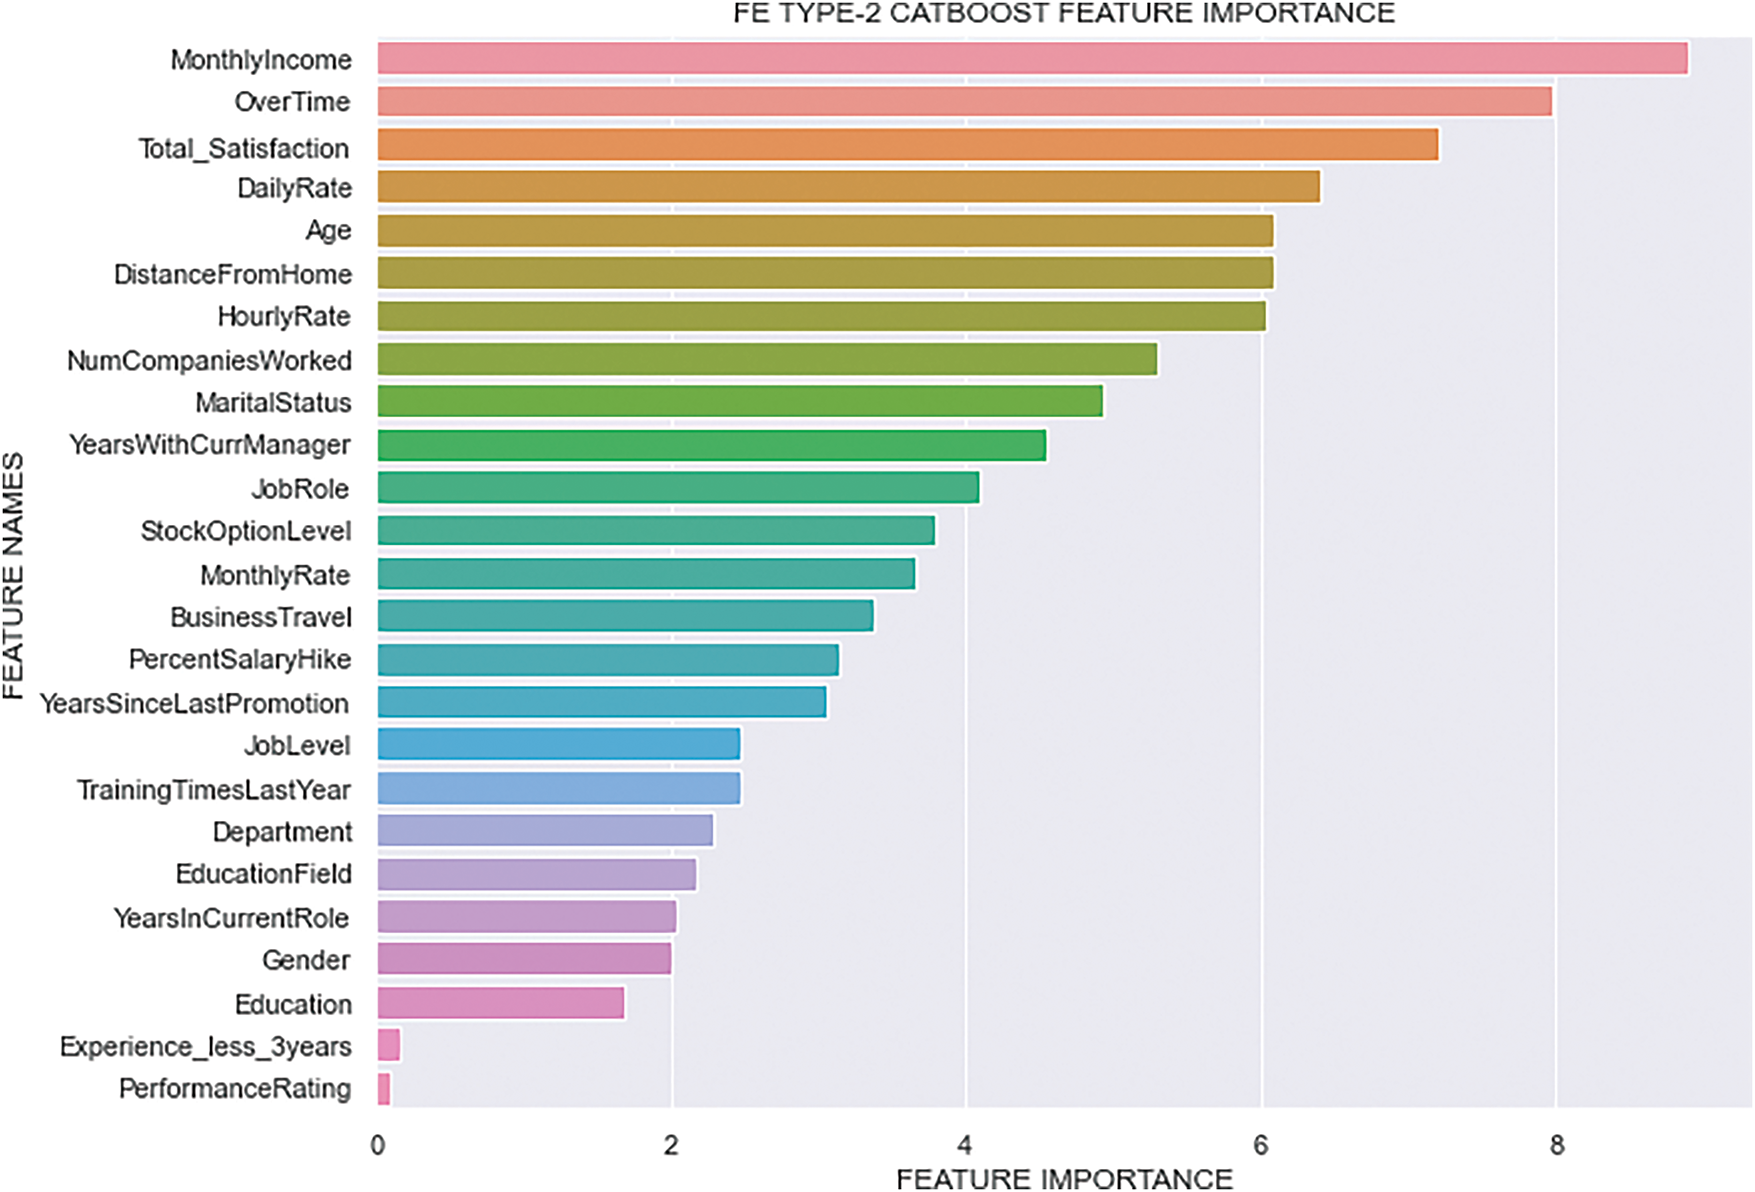
Figure 10: FE Type-2 CatBoost Feature Importance
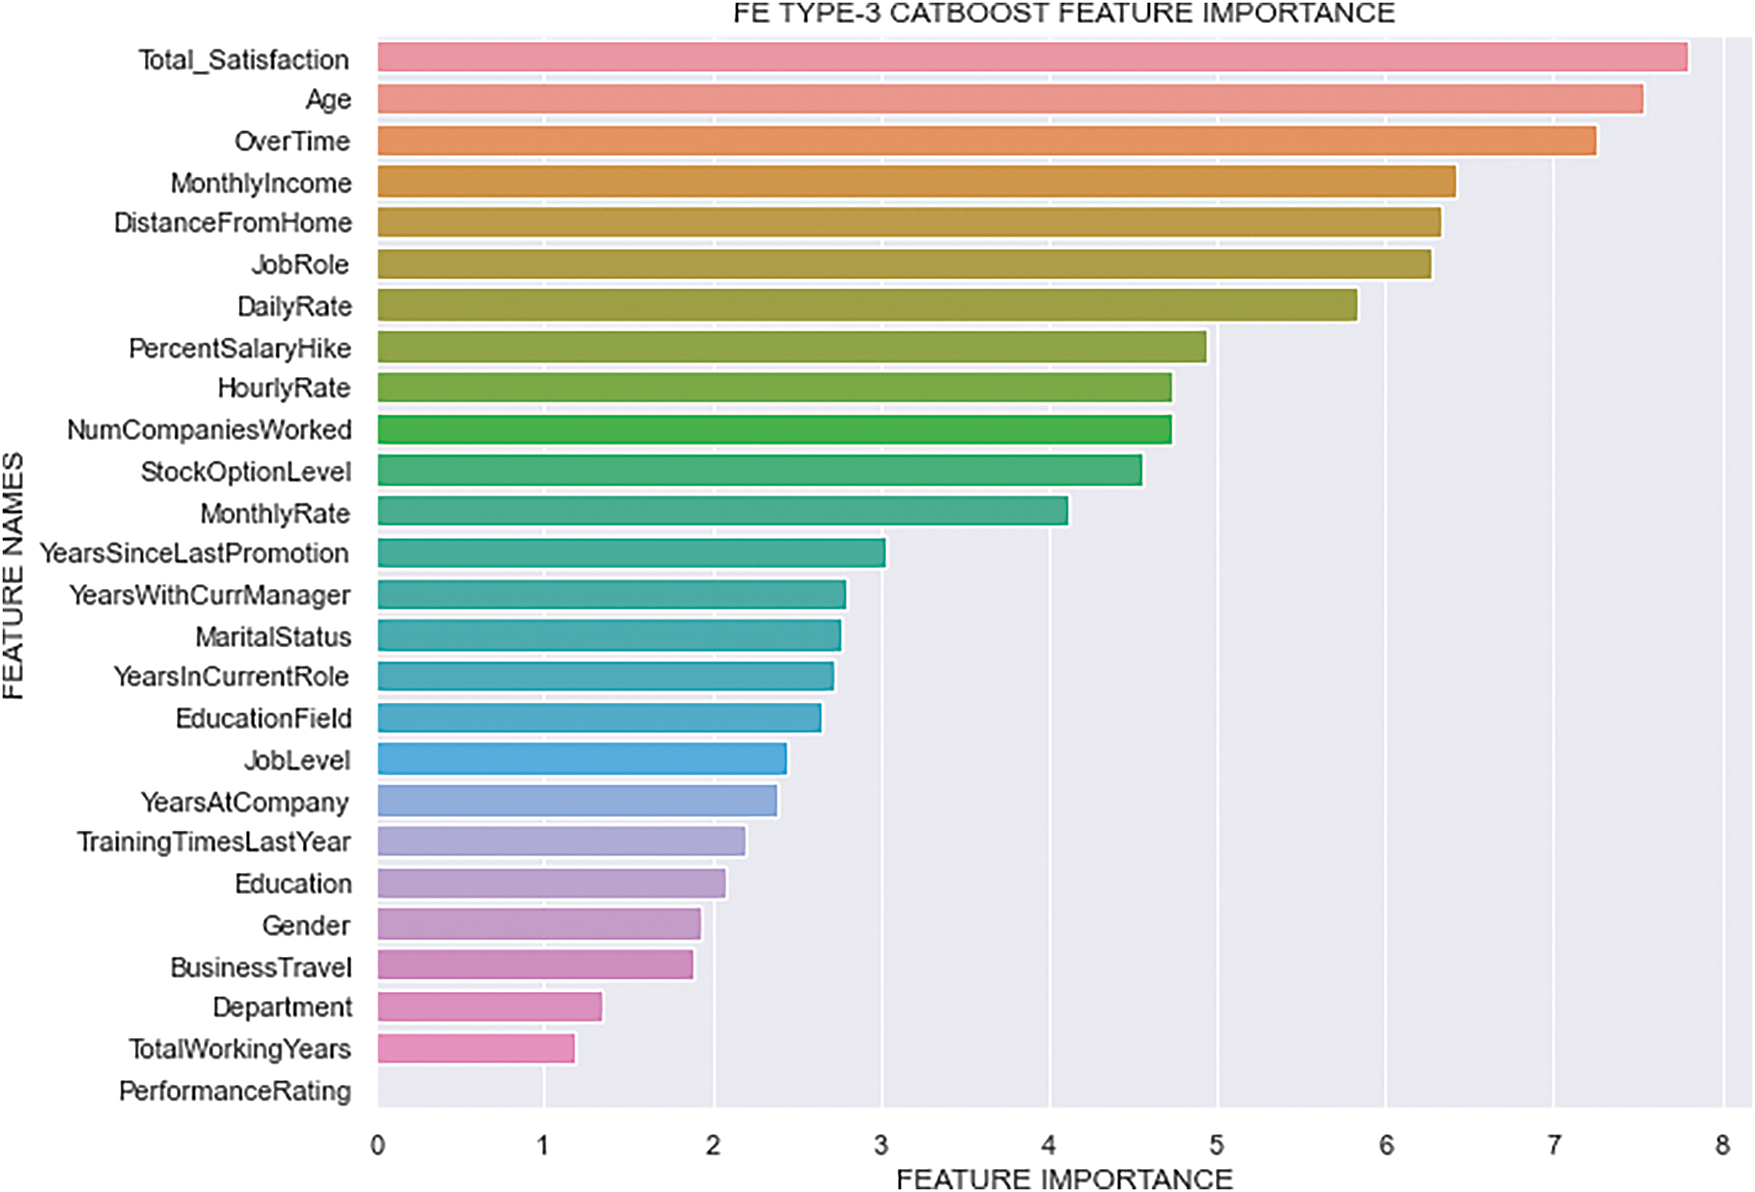
Figure 11: FE Type-3 CatBoost Feature Importance
An employee is the nucleus of any organization. Frequent employee churn always negatively affects the progress of that organization. Minimizing the high turnover rate is the primary concern for HR nowadays. Considering this issue, ML plays an important role in accurately predicting employee attrition and identifying key reasons for it. Over the years, many studies have been conducted in this area (Employee Attrition), but most of them did not focus on feature engineering and boosting methods, which are detailed in Section 2. In this paper, we adopted a proper feature engineering process and a robust method called CatBoost. Experimental results reveal that it outperforms other classifiers not only on the IBM dataset but also on its extended dataset. Our method achieved an accuracy of 90.14% and an F1-score of 0.88 on the IBM HR Analytics dataset, which are highly significant figures in the context of employee turnover prediction. These metrics indicate the model’s ability to both correctly classify employee churn (high accuracy) and maintain a balance between precision and recall (high F1-score), which is critical when dealing with imbalanced datasets, as is often the case with employee attrition. Notably, it shows outstanding performance (accuracy of 98.10% and F1-score of 0.98) on the extended dataset, which expresses the effectiveness of our proposed strategy. The F1-score of 0.88 and 0.98 are particularly notable because it highlights the model’s capacity to manage the trade-off between precision (minimizing false positives, i.e., predicting an employee will leave when they won’t) and recall (minimizing false negatives, i.e., predicting an employee won’t leave when they do). This is crucial for practical applications, where retaining high-performing employees and predicting potential churn accurately is a key business objective.
Eight categorical features that are employed for prediction are present in both datasets. The discrete, non-comparable values that make up categorical features are “Education Field” and “Gender”. These category features are often transformed into numerical representations prior to training gradient boosting models. We used CatBoost, an improved gradient-boosting method that handles categorical features automatically after preprocessing, to expedite the procedure. This technique has an enhanced schema for result prediction.
The CatBoost model outperforms the XGBoost model in terms of accuracy and error rate in the model performance analysis. In training, CatBoost and XGBoost outperform the other classifiers, but in testing, CatBoost performs noticeably better than XGBoost. The CatBoost classifier fared better than the other classifiers in terms of precision, recall, F1-score, and memory consumption. CatBoost is the ideal choice when dealing with huge datasets that contain category variables. It doesn’t require any specific preprocessing to convert categories to integers. In order to achieve this translation, different statistics for combinations of numerical and categorical features are examined. It has the shortest prediction period of any boosting technique. It makes predictions eight times faster than XGBoost.
As seen in Table 4, our method surpasses existing techniques used in prior studies on similar datasets. For example, studies using traditional ML models like LR, SVM or Linear Support Vector Classifier (LSVC) often report accuracies in the range of 81%–88.44% for employee attrition prediction, with F1-score typically below 0.80. Models such as XGBoost and LightGBM have been known to perform well in similar tasks, but our use of CatBoost, which is designed specifically to handle categorical features efficiently, provided a significant improvement in both accuracy (90.14%) and F1-score (0.88). A minimum accuracy of 81.10% was attained by Najafi-Zangeneh et al. using the LR model, but Jain and Nayyar previously reported a maximum accuracy of 89.10% using XGBoost achieved minimum accuracy of 81.10% using LR model. These two studies are closely related to our research as they also focused on feature engineering techniques. By leveraging the categorical feature-handling capabilities of CatBoost, we not only surpassed these benchmarks but also reduced overfitting and enhanced the model’s generalization ability, as evidenced by our improved metrics. In summary, we found very few studies in which the authors focus on feature engineering or selection on IBM dataset, which are shown in Table 4. Jain and Nayyar added three features through feature engineering and found that XGBoost outperformed other classifiers, although they did not explain the feature additions in detail. Najafi-Zangeneh Saeed et al. also highlighted feature selection, with LR achieving the highest accuracy. Most other studies focused solely on classification methods without feature engineering. Our proposed feature engineering techniques, however, enhanced the IBM dataset and improved model accuracy, demonstrating the method’s potential to support HR departments in refining retention strategies.

Employee retention is crucial for organizational stability and success, as high turnover rates can lead to operational disruptions, reputational damage, and increased recruitment costs. This paper highlights the importance of early identification of at-risk employees, enabling HR departments to proactively minimize turnover. Our proposed boosting technique demonstrated high predictive accuracy, achieving an accuracy of 90.14% and an F1-score of 0.88 on the IBM dataset, and significantly improved prediction with 98.10% accuracy and an F1-score of 0.98 on an expanded dataset. Key to our success was the application of innovative feature engineering techniques that enhanced the performance of the CatBoost model. Through this approach, we identified ten critical causes influencing attrition, including “Monthly Income”, “Over Time”, and “Total Satisfaction”, which are the top three causes. These insights arm HR departments with the knowledge to enhance their retention initiatives, specifically addressing the needs of vulnerable employees. For future research, we recommend extending our analysis to larger, real-world datasets to further validate and enhance the robustness of our findings. Additionally, exploring the incorporation of more diverse features could provide deeper insights into the underlying causes of employee attrition, ultimately supporting organizations in fostering a more stable and productive workforce.
Acknowledgement: We thank Professors Kwanghoon Choi and Kyungbaek Kim for their valuable guidance and support regarding the submission of this work. This work was supported by Innovative Human Resource Development for Local Intellectualization program through the Institute of Information & Communications Technology Planning & Evaluation (IITP) grant funded by the Korea government (MSIT). This work was partially supported by the Korea Internet & Security Agency (KISA)—Information Security College Support Project.
Funding Statement: This work was supported by Innovative Human Resource Development for Local Intellectualization program through the Institute of Information & Communications Technology Planning & Evaluation (IITP) grant funded by the Korea government (MSIT) (IITP-2024-00156287, 50%). This work was supported by Institute of Information & Communications Technology Planning & Evaluation (IITP) under the Artificial Intelligence Convergence Innovation Human Resources Development (IITP-2023-RS-2023-00256629, 25%) grant funded by the Korea government (MSIT). This work was partially supported by the Korea Internet & Security Agency (KISA)—Information Security College Support Project (25%).
Author Contributions: The authors confirm contribution to this paper as follows: study conception and design: Md Monir Ahammod Bin Atique, Md Ilias Bappi; data collection: Md Abul Ala Walid; analysis and interpretation of results: Kwanghoon Choi, Kyungbaek Kim, Md Monir Ahammod Bin Atique; draft manuscript preparation: Md Ilias Bappi, Pranta Kumar Sarkar. All authors reviewed the results and approved the final version of the manuscript.
Availability of Data and Materials: The datasets analyzed during the current study are available in the IBM HR Analytics dataset repository, www.ibm.com/communities/analytics/watson-analytics-blog/hr-employee-attrition/ (accessed on 14 February 2023).
Ethics Approval: Not applicable.
Conflicts of Interest: The authors declare no conflicts of interest to report regarding the present study.
References
1. Merriam-webster: essential meaning of attrition [Online]. [cited 2022 Feb 4]. Available from: https://www.merriam-webster.com/dictionary/attrition. [Google Scholar]
2. Allen DG. Retaining talent: a guide to analyzing and managing employee turnover. Alexandria, VA, USA: SHRM Foundations; 2008. [Google Scholar]
3. Igbaria M, Greenhaus JH, Parasuraman S. Career orientations of mis employees: an empirical analysis. MIS Q. 1991;15(2):151–69. [Google Scholar]
4. Jain PK, Jain M, Pamula R. Explaining and predicting employees’ attrition: a machine learning approach. SN Appl Sci. 2020;2(4):1–11. doi:10.1007/s42452-020-2519-4. [Google Scholar] [CrossRef]
5. Jain R, Nayyar A. Predicting employee attrition using XGBoost machine learning approach. In: 2018 International Conference on System Modeling & Advancement in Research Trends (SMART); 2018 Nov 23–24; Moradabad, India. p. 113–20. [Google Scholar]
6. Sehgal K, Bindra H, Batra A, Jain R. Prediction of employee attrition using GWO and PSO optimised models of C5.0 used with association rules and analysis of optimisers. In: Innovations in computer science and engineering. Singapore: Springer; 2019. p. 1–8. doi:10.1007/978-981-13-7082-3_1. [Google Scholar] [CrossRef]
7. Usha P, Balaji N. A comparative study on machine learning algorithms for employee attrition prediction. IOP Conf Ser Mater Sci Eng. 2021;1085:012029. [Google Scholar]
8. Bandyopadhyay N, Jadhav A. Churn prediction of employees using machine learning techniques. Teh Glas. 2021;15(1):51–9. doi:10.31803/tg-20210204181812. [Google Scholar] [CrossRef]
9. Mohbey KK. Employee’s attrition prediction using machine learning approaches. In: Machine learning and deep learning in real-time applications. Hershey, PA, USA: IGI Global; 2020. p. 121–8. doi:10.4018/978-1-7998-3095-5.ch005. [Google Scholar] [CrossRef]
10. Sethy A, Raut AK. Employee attrition rate prediction using machine learning approach. Turk J Physiother Rehabil. 2020;32(3):14024–31. [Google Scholar]
11. Pratibha G, Hegde NP. Low complexity early employee attrition analysis using boosting and non-boosting ml techniques. Int J Intell Syst Appl Eng. 2023;11(10s):246–56. [Google Scholar]
12. Gulmeher R, Aiman U. A novel approach to unveiling employee attrition patterns using machine learning algorithms. J Sci Res Technol. 2023;1(6):234–41. [Google Scholar]
13. Sharma MK, Singh D, Tyagi M, Saini A, Dhiman N, Garg R. Employee retention and attrition analysis: a novel approach on attrition prediction using fuzzy inference and ensemble machine learning. Webology. 2022;19(2):5338–58. [Google Scholar]
14. Sharma S, Sharma K. Analyzing employee’s attrition and turnover at organization using machine learning technique. In: 2023 3rd International Conference on Intelligent Technologies (CONIT); 2018 Dec 14–15; Hubli, India. p. 1–7. [Google Scholar]
15. Punnoose R, Ajit P. Prediction of employee turnover in organizations using machine learning algorithms. Algorithms. 2016;4(5):C5. doi:10.14569/ijarai.2016.050904. [Google Scholar] [CrossRef]
16. Yadav S, Jain A, Singh D. Early prediction of employee attrition using data mining techniques. In: 2018 IEEE 8th International Advance Computing Conference (IACC); 2018 Dec 14–15; Greater Noida, India. p. 349–54. [Google Scholar]
17. Najafi-Zangeneh S, Shams-Gharneh N, Arjomandi-Nezhad A, Hashemkhani Zolfani S. An improved machine learning-based employees attrition prediction framework with emphasis on feature selection. Mathematics. 2021;9(11):1226. doi:10.3390/math9111226. [Google Scholar] [CrossRef]
18. Dorogush AV, Ershov V, Gulin A. CatBoost: gradient boosting with categorical features support. arXiv:1810.11363. 2018. [Google Scholar]
19. Prokhorenkova L, Gusev G, Vorobev A, Dorogush AV, Gulin A. CatBoost: unbiased boosting with categorical features. Adv Neural Inf Process Syst. 2018;31:1–11. [Google Scholar]
20. Atique MMAB, Hoque MN, Uddin MJ. Employee attrition analysis using CatBoost. In: International Conference on Machine Intelligence and Emerging Technologies; 2022 Sep 23–25; Noakhali, Bangladesh. Cham, Switzerland: Springer; 2022. p. 644–58. [Google Scholar]
21. Qutub A, Al-Mehmadi A, Al-Hssan M, Aljohani R, Alghamdi HS. Prediction of employee attrition using machine learning and ensemble methods. Int J Mach Learn Comput. 2021;11(2):110–4. doi:10.18178/ijmlc.2021.11.2.1022. [Google Scholar] [CrossRef]
22. Bhartiya N, Jannu S, Shukla P, Chapaneri R. Employee attrition prediction using classification models. In: 2019 IEEE 5th International Conference for Convergence in Technology (I2CT); 2019 Mar 29–31; Bombay, India. p. 1–6. [Google Scholar]
23. Joseph R, Udupa S, Jangale S, Kotkar K, Pawar P. Employee attrition using machine learning and depression analysis. In: 2021 5th International Conference on Intelligent Computing and Control Systems (ICICCS); 2021 May 6–8; Madurai, India. p. 1000–5. [Google Scholar]
24. Mobley WH. Intermediate linkages in the relationship between job satisfaction and employee turnover. J Appl Psychol. 1977;62(2):237. doi:10.1037/0021-9010.62.2.237. [Google Scholar] [CrossRef]
25. Cotton JL, Tuttle JM. Employee turnover: a meta-analysis and review with implications for research. Acad Manag Rev. 1986;11(1):55–70. [Google Scholar]
26. Ozolina-Ozola I. Reducing employee turnover in small business: an application of employee turnover models. In:Mathematics and computers in sciences and industry. New York, NY, USA: IEEE; 2015. p. 139–44. [Google Scholar]
27. Hoffman M, Tadelis S. People management skills, employee attrition, and manager rewards: an empirical analysis. J Political Econ. 2021;129(1):243–85. doi:10.1086/711409. [Google Scholar] [CrossRef]
28. Michie D, Spiegelhalter DJ, Taylor CC, Campbell J. Machine learning, neural and statistical classification. London, UK: Ellis Horwood; 1994. [Google Scholar]
29. Breiman L. Random forests. Mach Learn. 2001;45(1):5–32. [Google Scholar]
30. Liaw A, Wiener M. Classification and regression by randomForest. R News. 2002;2(3):18–22. [Google Scholar]
31. Hearst MA, Dumais ST, Osuna E, Platt J, Scholkopf B. Support vector machines. IEEE Intell Syst Appl. 1998;13(4):18–28. doi:10.1109/5254.708428. [Google Scholar] [CrossRef]
32. Suthaharan S. Support vector machine. In: Machine learning models and algorithms for big data classification: thinking with examples for effective learning. Boston, MA, USA: Springer US; 2016. p. 207–35. [Google Scholar]
33. Hosmer DW, Lemeshow S, Sturdivant RX. Applied logistic regression. 3rd ed. Hoboken, NJ, USA: Wiley; 2013. [Google Scholar]
34. Chen T, He T, Benesty M, Khotilovich V, Tang Y, Cho H, et al. XGBoost: extreme gradient boosting [Internet]. [cited 2025 Jul 17]. Available from: https://cran.ms.unimelb.edu.au/web/packages/xgboost/vignettes/xgboost.pdf. [Google Scholar]
35. Hossin M, Sulaiman MN. A review on evaluation metrics for data classification evaluations. Int J Data Min Knowl Manag Process. 2015;5(2):1–11. [Google Scholar]
36. Naidu G, Zuva T, Sibanda EM. A review of evaluation metrics in machine learning algorithms. In: Silhavy R, Silhavy P, editors. Artificial intelligence application in networks and systems, CSOC 2023. Lecture notes in networks and systems. Vol. 724. Cham, Switzerland: Springer; 2023. p. 15–25. doi: 10.1007/978-3-031-35314-7_2. [Google Scholar] [CrossRef]
37. Fallucchi F, Coladangelo M, Giuliano R, William De Luca E. Predicting employee attrition using machine learning techniques. Computers. 2020;9(4):86. doi:10.3390/computers9040086. [Google Scholar] [CrossRef]
Cite This Article
 Copyright © 2025 The Author(s). Published by Tech Science Press.
This work is licensed under a Creative Commons Attribution 4.0 International License , which permits unrestricted use, distribution, and reproduction in any medium, provided the original work is properly cited.
 Downloads
 Citation Tools