
 Submit a Paper
 Propose a Special lssue
 Open Access
ARTICLE
An Experimental Study on the Performance of a Hybrid Photovoltaic/Thermal Solar System
1
School of Energy Engineering, Tianjin Sino-German University of Applied Sciences, Tianjin, 300350, China
2
Tianjin Sino-German and Cambodia Intelligent Motion Device and Communication Technology Promotion Center, Tianjin “The
Belt and Road” Joint Laboratory, Tianjin, 300350, China
* Corresponding Authors: Xin Xu. Email: ; Lian Zhang. Email:
Energy Engineering 2022, 119(6), 2319-2345. https://doi.org/10.32604/ee.2022.022457
Received 10 March 2022; Accepted 24 May 2022; Issue published 14 September 2022
 View Full Text
 Download PDF
Abstract
Considered as the widespread renewable energy, solar energy is used to produce the electricity and heat for carbon peaking and carbon neutralization. However, the photo-electric conversion efficiency will decrease with the increase of cells temperature. To solve this problem, a water-type hybrid photovoltaic/thermal (PV/T) solar system has been designed and tested in Hong Kong. The outdoor experiment proceeded all days in 6 months with three different operating modes. The data of selected 33 days were used to analyze the performance of the system. The results showed that the thermal efficiencies were 33.6%, 52%, and 48.3% at zero reduced temperature, corresponding to three modes. Besides, the overall efficiencies were 43.2%, 60.9%, and 55.2% accordingly, which are higher than those of the conventional flat-plate solar collector. The average water temperature in the storage tank could reach 39.9°C, and the system could produce 0.07 kWh electric power after one-day operation, when the collector with 96 kg/m2 M/Ac installed vertically combining with external wall for each family. It is realizable to utilize the developed building integrated water-type photovoltaic/thermal (BIPVT) solar system for residentialintensive high-rise buildings in Hong Kong, satisfying the needs of hot water, and eventually reducing energy consumption of the buildings.Keywords
Nomenclature
| Abbreviation | |
| PV/T | Photovoltaic/Thermal |
| BIPV | Building Integrated Photovoltaic |
| BIPVT | Building Integrated Photovoltaic/Thermal |
| PV-ST | Photovoltaic with Solar Thermal |
| PV/T-ST | Photovoltaic/Thermal with Solar Thermal |
| Symbols | |
| Ac | total heat collecting area [m2] |
| C | specific heat capacity [J/(kg· K)] |
| G | measured solar radiation intensity [W/m2] |
| H | solar radiation on unit collector area [MJ/(m2· day)] |
| I | standard solar radiation [W/m2] |
| H | thermal convection [W/m· K] |
| M | mass water in the system [kg] |
| m | mass flow rate [kg/s] |
| p | electric power output per minute [W/min] |
| P | electric power output [kWh/day] |
| Q | thermal power output [kWh/day] |
| S | total superficial area of tank with insulation [m2] |
| T | temperature [°C] |
| T | time [min] |
| U | thermal loss rate coefficient |
| U′ | system overall loss rate coefficient |
| v | wind speed [m/s] |
| daily thermal efficiency at zero reduced temperature [%] | |
| system daily overall efficiency at zero reduced temperature [%] | |
| temperature coefficient of PV module [%/°C] | |
| overall efficiency [%] | |
| overall efficiency per minute [%] | |
| electrical efficiency [%] | |
| electrical efficiency per minute [%] | |
| thermal efficiency [%] | |
| thermal efficiency per minute [%] | |
| Subscript | |
| a | ambient air |
| ab | absorber plate |
| aux | auxiliary thermal power required to meet hot water demand |
| ave | average |
| bottom | at the bottom of tank |
| co | beneath combi-panel |
| f | final in tank |
| g | cover glass |
| i | initial in tank |
| in | inlet of water tank |
| inc | inlet of collector |
| loss | energy loss |
| out | outlet of water tank |
| outc | outlet of collector |
| outs | outer surface of insulation |
| pv | PV cell |
| top | at the top of tank |
| w | water |
| w1 | point 1 in tank |
| w2 | point 2 in tank |
| w3 | point 3 in tank |
With economic growth seemingly continuous, conventional energy has been consumed at such a high, unsustainable pace. Traditional energy resources come mostly from fossil fuels, such as coal, oil, and natural gas, which are non-renewable resources. Most of the consumption of fossil fuels are wasteful, and great amounts of energy are lost due to wasteful and inefficient transportation and energy generation technologies. Today, we have concerned with the disaster awaiting our future generations, taken this situation seriously, and found new energy resources. It is widely acknowledged that the development and utilization of renewable energy, including wind, biomass, geothermal energy, and solar energy, are effective methods to meet soaring demand and solve the problems caused by non-renewable resources. Furthermore, the goal of “carbon peak and neutrality” can be achieved earlier. Therefore, solar energy, an inexhaustible energy source, must be better developed.
More than 80% of the solar radiation is not converted into electricity, but either reflected or converted into thermal energy. The photo-electric conversion efficiency will decrease with the increase of cells temperature, i.e., decreases in about 1 W for every 1°C increasing [1]. To use solar energy more efficiently and reasonably, the hybrid photovoltaic/thermal (PV/T) system was first described in 1978 by Kern et al. [2]; they presented the design and performance of the PV/T system.
In recent years, PV/T has been studied from different perspectives by several researchers. From the perspective of PVT system form, Anand et al. [3] discussed the various cooling technologies that can regulate PV temperature and augment power production. Pang et al. [4] reviewed the performance of different types of flat plate PV/T under different conditions with operating media, structural designs, and climate conditions. Pathak et al. [5] reviewed the performance of PV/T using different cooling methods, including jet impingement, airflow cooling, immersion cooling using liquids, thermoelectric-based cooling, and microchannel cooling, phase change materials (PCM) based cooling, water/liquid cooling and heat pipe cooling. Javidan et al. [6] used a multi-nozzle jet impingement cooling for PV, and analyzed the temperature uniformity index of the PV panel. There were several forms of PVT systems, few of them could be used directly and conveniently for civil utilization, unlike PV systems used in residential buildings [7,8].
For the view of the characteristics of PVT collectors, Shahsavar et al. [9] evaluated and compared the energetic and exergetic performances of three nanofluid-based PV/T systems. They found a PV/T system with a sheet-and-grooved serpentine tube type collector with a groove pitch of 5.4 mm had better performance. Kiwan et al. [10] found that for three porous fins, five porous fins, and a porous layer of PV/T collector cases, the percent increase in efficiency was 6.73%, 9.19%, and 8.34%, respectively. One of the key factors in designing a PV/T collector is choosing the appropriate coolant fluid. Kahani et al. [11] presented a modified model of layer arrangement for a conventional PV/T panel and used different concentrations of TiO2/water nanofluid as the coolant. Junaid et al. [12] used Zn-water nanofluid in serpentine copper tubes of PVT collector and evaluated the production factor and life cycle conversion efficiency of the PVT system. The complex flow channels and nanofluids with high heat transfer performance play a good role in improving the comprehensive performance of the system. However, few studies have researched the performance improvements concerning the civil system.
In terms of the simulation and experiment of the PVT system, Nikbakht et al. [13] conducted a MATLAB code developed for techno-economic optimization of the PV/T combined CCHP system based on a one-year operation. Han et al. [14] investigated the thermal, electrical, and overall performance of the PVT-ST and PV-ST systems by simulation and verified data by references. They found the PVT-ST system had better performance. Based on the CFD analysis results, Bae et al. [15] constructed a real-scale experimental plant of PV/T with textile and capillary tube composite panels. Alomar et al. [16] experimented to analyzing the performance of PV/T in North Iraq, and the results of exergy analysis displayed that the optimum thermal and electric efficiencies in the range of (2%–7%) and (10%–18%). Kazem et al. [17] experimented and studied to evaluate the PV/T systems with a hybrid collector. Cabral et al. [18] took the electrical and thermal outdoor testing measurements on a low concentration PV/T solar collector based on a parabolic reflector geometry with a wedge PV/T receiver. Brottier et al. [19] carried out the tests of 28 PV/T solar domestic hot water installations in different locations in one year. Shao et al. [20] proposed a novel PV/T ventilated roof as a heat exchanger for a heat pump system and conducted an experiment. Different models and tests provided the basic data to improve system performance. Few types of research were aiming to test the PVT system with small capacity continuously throughout the year.
Compared with the conventional PV cells and collectors operating separately then, there are many advantages of a hybrid PV/T system, like saving in space, lowering the operating temperature, and increasing overall efficiency by generating both electricity and thermal heat from one combi-panel at the same time. Nowadays, BIPV is going to be a popular application to improve electrical efficiency and most efficiently utilize solar energy, researchers pay lots of attention to PV cells cooled by air/water being designed to be a BIPVT module and installed as a façade in consequence of limited building space, which provides architectural beauty and uniformity. Maghrabie et al. [21] discussed the challenges and introduced the future perspectives of BIPVT. They found the key factors impeding the commercialization of BIPVT systems are the implementation of the feed-in tariff, customers’ perception, national economic support, and technical considerations. Asefi et al. [22] reviewed some new and efficient technologies being employed to benefit from BIPVT systems for indoor heating and evaluated previous works on thermal management of BIPVT. Jalalizadeh et al. [23] used a TRNSYS-MATLAB co-simulator to simulate the system’s performance, and it turned out that BIPVT could reduce the cooling energy demand of the building by 36%. Gagliano et al. [24] investigated different configurations of the BIPVT plant and pointed out as a PVT facade might significantly contribute to the generation of renewable energy in the building sector. Barthwal et al. [25] proposed BIPVT as a space heating solution for the Indian montane climate, and the overall system efficiency is 70% through simulating. However, there are still many problems to be solved for applications of the BIPVT system, especially for the residential high-rise buildings without a balcony or enough space to install the oblique collector.
In this study, a water-type hybrid PV/T system was designed for a typical residential application and taken outdoor experiment under three different conditions for six months in Hong Kong. The water-type hybrid PV/T system has advantages over the air-type in tropical and subtropical areas like Hong Kong, where the annual mean daily global solar radiation is 14.46 MJ/m2·day, and residents there need water heating rather than space heating. The water-type hybrid PV/T system occupies less space due to higher water density, making it possible to be flexibly used in residential-intensive buildings. Besides, the system with natural circulation will be simpler to operate and has a longer life and lower cost, reducing carbon emissions to a greater extent. The performance of the system will be analyzed, and then improved based on the result of the analysis, making it more suitable for actual residential buildings and more acceptable for residents in Hong Kong.
2 Water-Type Hybrid PV/T System Design
Using photovoltaic/thermal combi-panel has such a large superiority in comparison of using traditional PV cells and flat-plate absorber collector separately. One is that an area covered with combi-panel produces more electrical and thermal energy than a corresponding area covered, half with PV cells and half with a thermal collector. The average PV cells temperature in a combi-panel is lower than a conventional one. The other is that it is particularly useful to adopt a combi-panel when the installation space is limited. Specifically, the combi-panel configurations consisted of monocrystalline silicon PV cells, TPT, EVA, silicone gel, thermal absorber, and water tubes, and the PV/T collector composed of it, encapsulated in an Al-alloy frame, are shown in Fig. 1. As designed, the combi-panel had 36 PV cells, connected in series, each with an area of 125 mm × 125 mm. The air gap and glass cover were each above the cells, and the insulation material was beneath the tubes. Besides, because of its higher cost-efficiency, selecting monocrystalline silicon PV cells, selecting monocrystalline silicon rather than other types, such as polycrystalline silicon, amorphous silicon, and film PV cell. Meanwhile, silicone gel was used between PV cells and flat-plate absorbers to combine these two parts and meet the requirement of electrical insolation and thermal conduction. Copper absorbers and tubes with good thermal conductivity were used to promote heat transfer. The specific measuring points in the water tank are shown in Fig. 2.
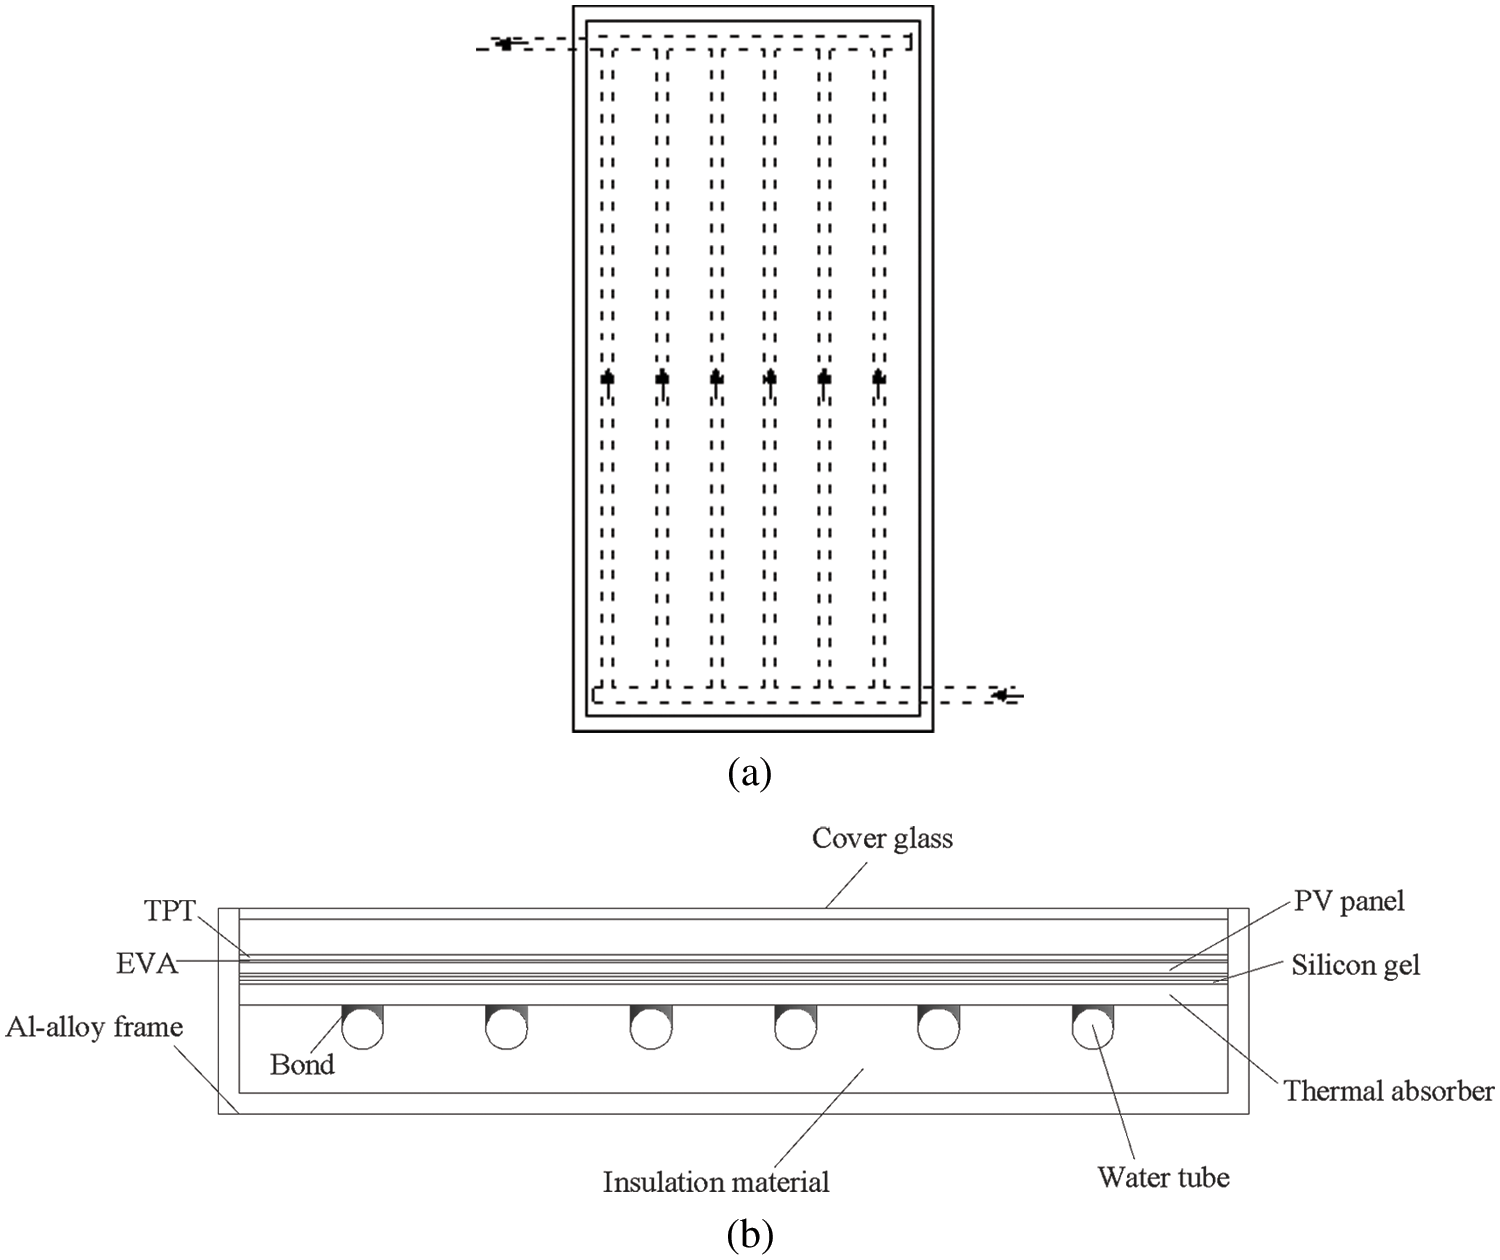
Figure 1: (a) The PV/T collector, (b) The section view of the collector, including combi-panel
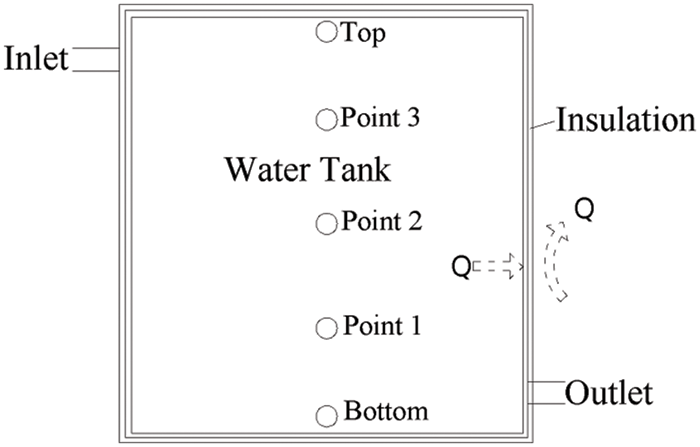
Figure 2: Specific point in the storage water tank, and schematic diagram of steady heat transfer from tank to ambient air
2.2 Experimental Design for Natural Circulation
The photo of the water-type hybrid PV/T system is illustrated in Fig. 3. Based on the demand for one nuclear family, the basic parameters of the system were designed, as shown in Table 1. The water heating system is composed of one collector with a total heat collecting area of 0.86 m2, one thermal storage tank with a volume of 0.03 m3, and another 0.06 m3 for the comparative experiment, pipes, and valves. Combined with the characteristics of the buildings and residents then, the natural circulation system was adopted to reduce the cost and operational complexity of the PV/T system.
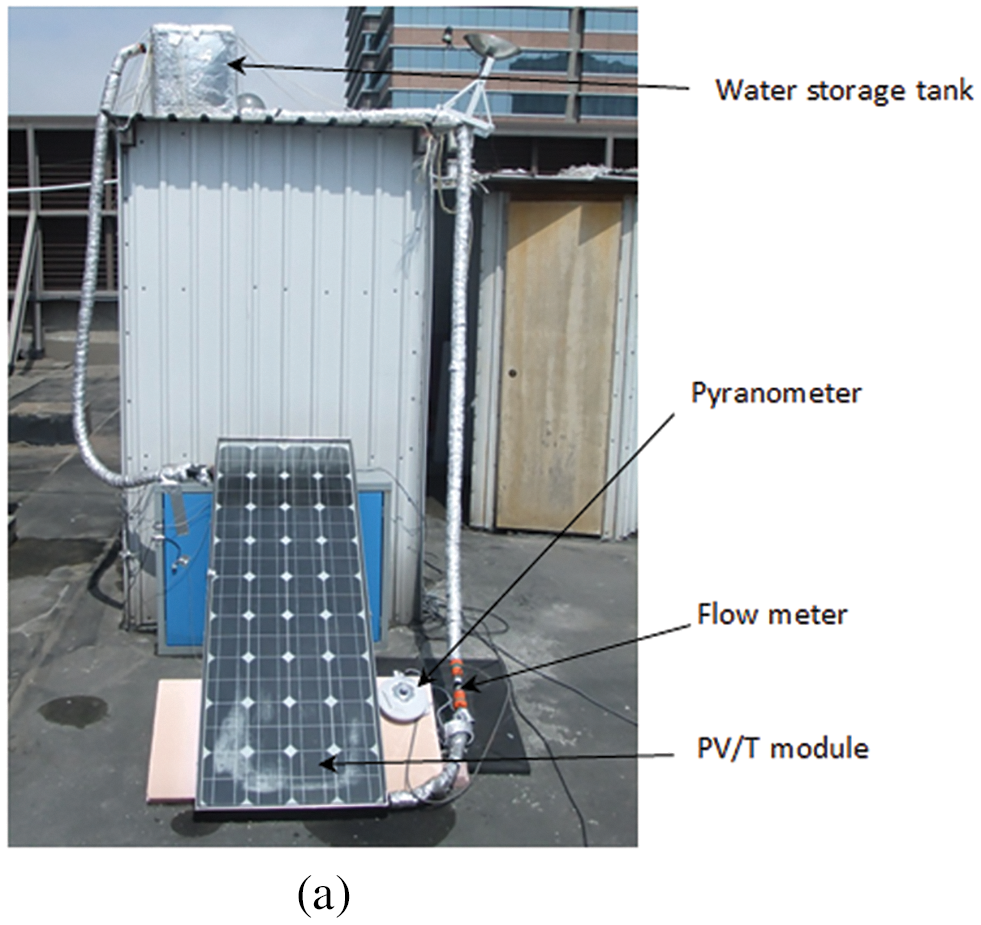
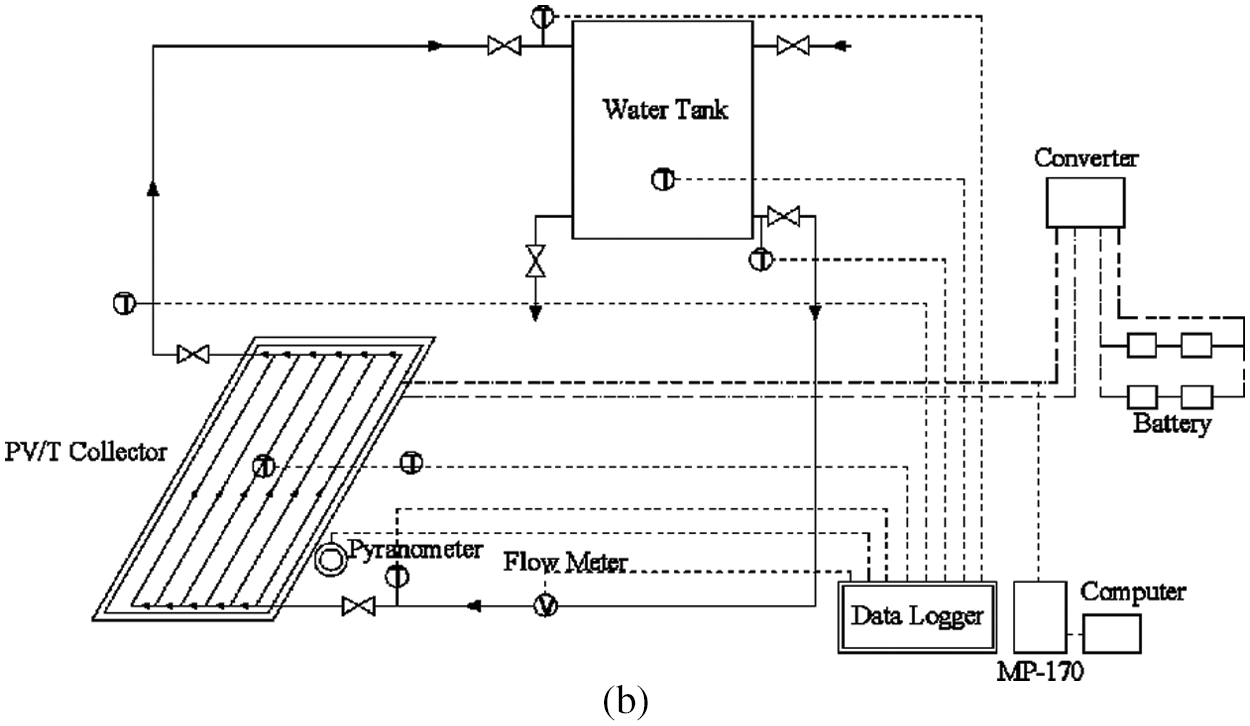
Figure 3: (a) The photo of the water-type hybrid PV/T system, (b) The picture of system design
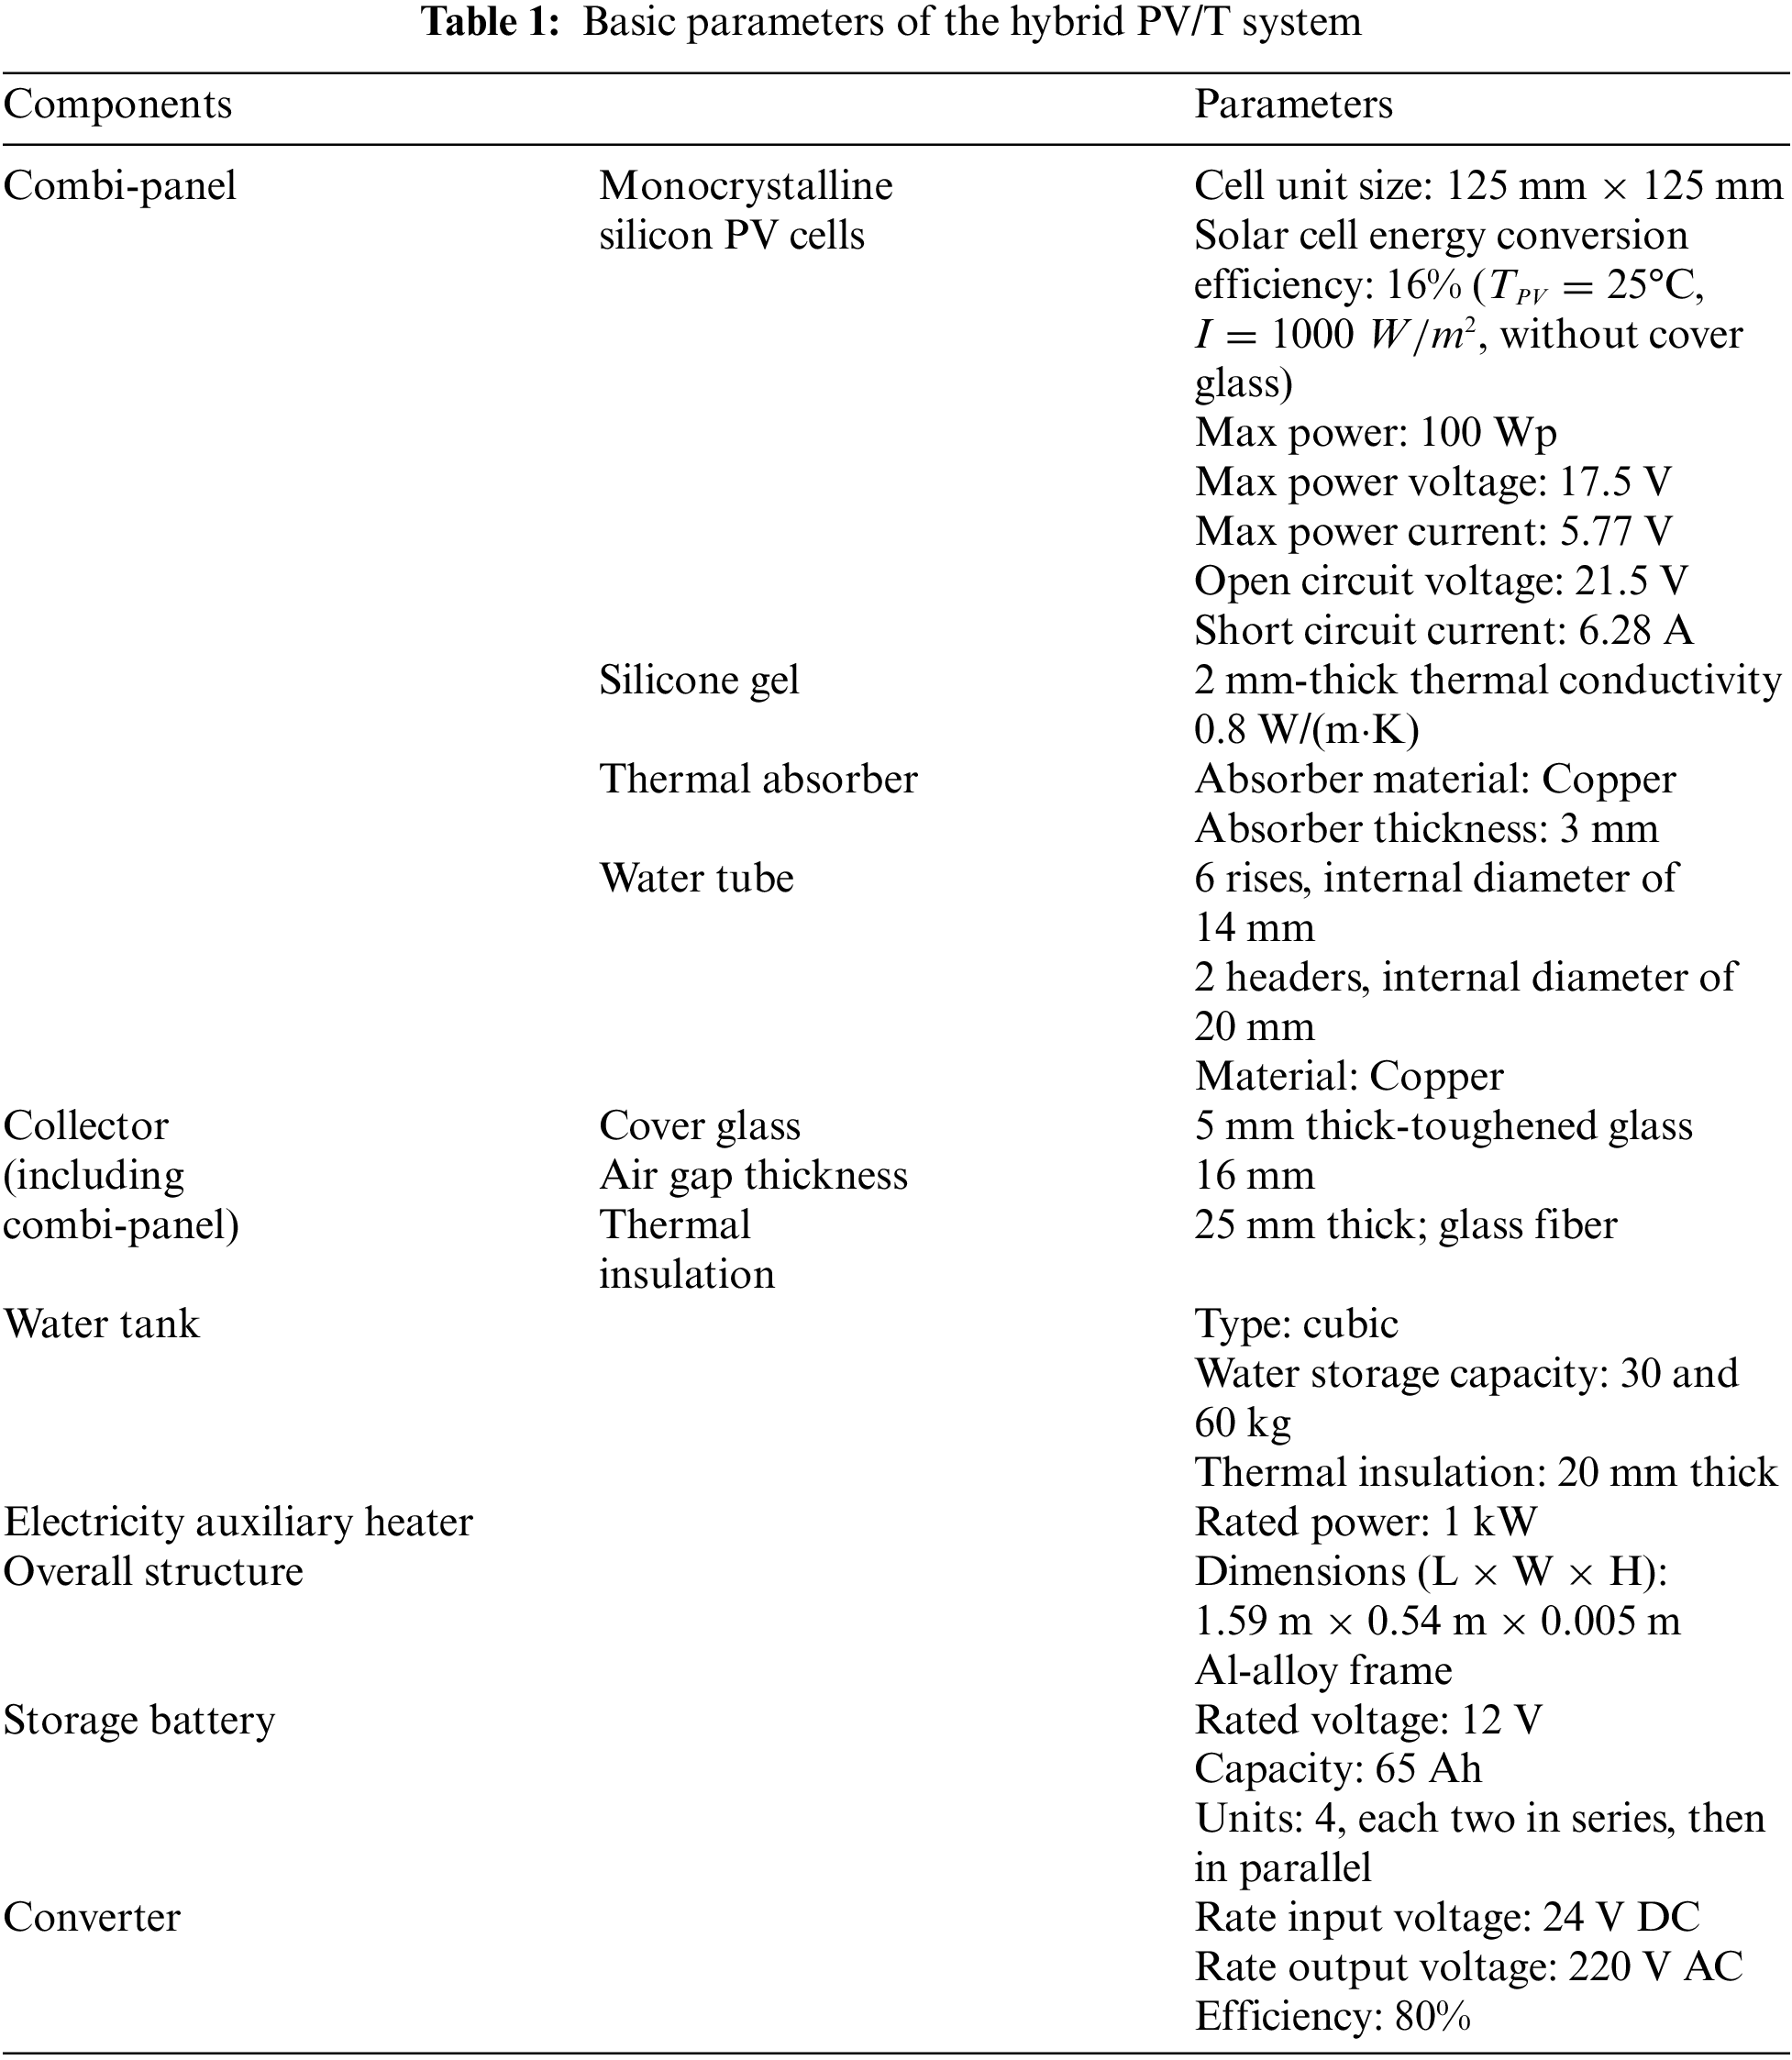
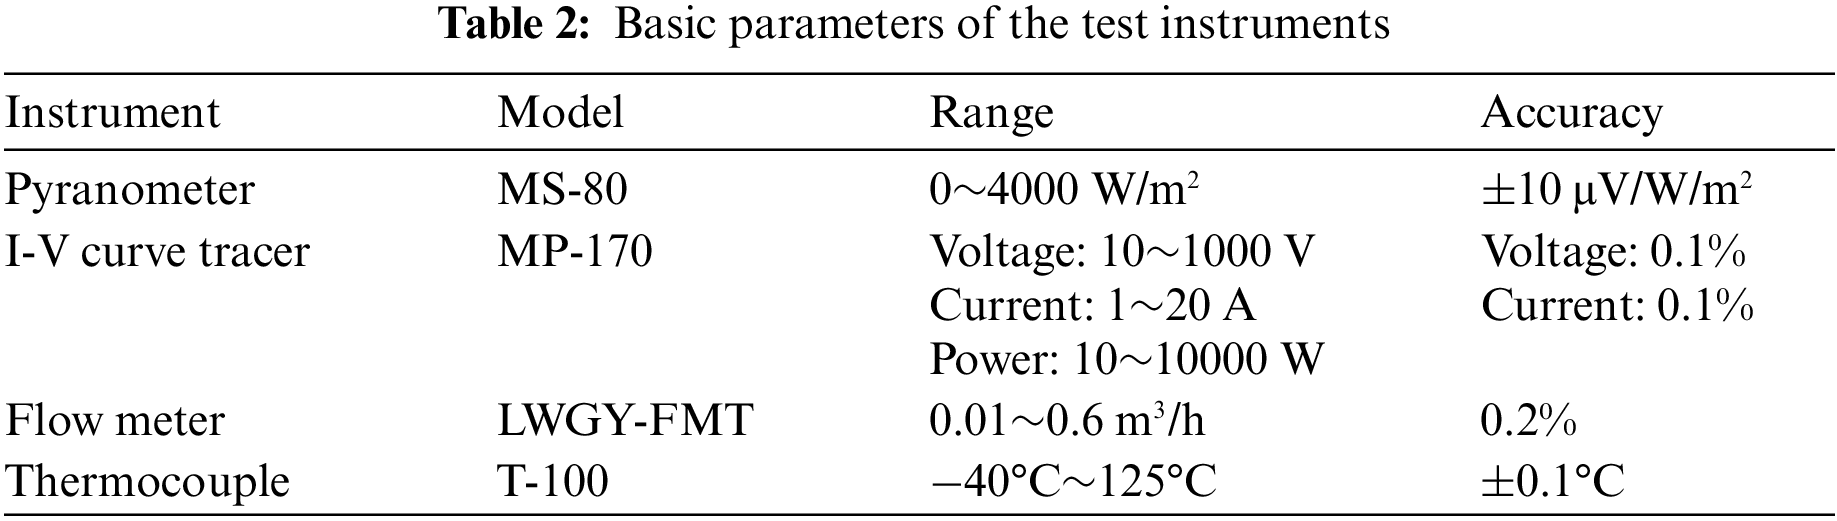
A pyranometer was used to measure the total solar radiation on the front surface of the collector. An I-V curve tracer measured the max power, short circuit current, and open circuit current. The water flow rate was measured by a flow meter. The temperature parameters included both inlet and outlet water of the collector and the tank, the back surface of PV cells, the front surface of a thermal absorber, and the external surface of the water tube. Additionally, five points were distributed equally from top to bottom in the tank, as illustrated in Fig. 2, and ambient air, which was all measured by copper-constantan thermocouples and collected by a data logger (GL820). The basic parameters of the test instruments are shown in Table 2.
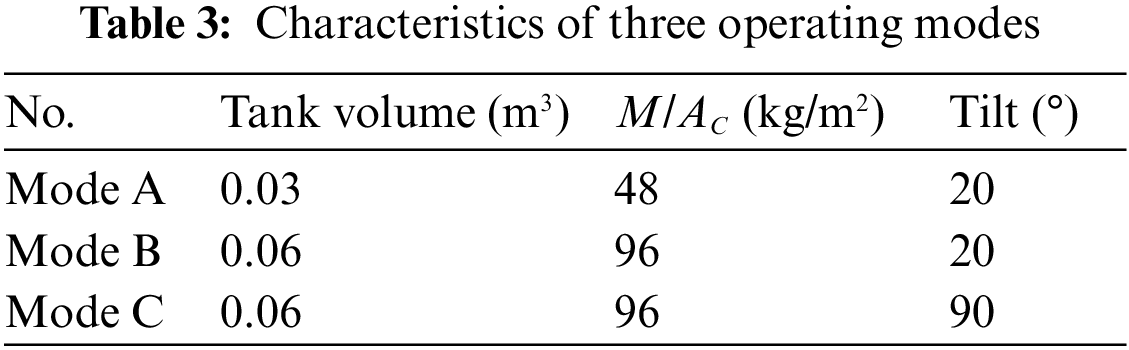
Three situations were tested to find the more efficient operating model and efficient system for residential-intensive buildings to determine the specific parameters of the modes, these tests below were carried out under similar environmental conditions. Firstly, the collector had been tilted 20°; at this angle, solar radiation would be absorbed more effectively, according to studies in Hong Kong [10] and Ali et al. [26]. According to per capita hot water consumption, water tank volume, and the water tank volume was set as 0.03 m3. The daily result showed that the average water temperature in the storage tank could reach 52.5°C after the one-day operation, when the initial water temperature was 20°C. However, nature circulation stopped at early 14:00, and heat energy produced by PV cells might not have been fully taken advantage of even reverse-cycle with the decreasing ambient temperature, which increases heat loss and reduces system efficiency. In order to prevent this circumstance from happening and enhance overall system efficiency, a tank with 0.06 m3 volume had used using. The average water temperature in the tank of mode B reached 42.3°C at the end of the one-day operation when the initial water temperature was 20.5°C. Although the temperature difference between initial and final water temperature in the tank was lower than mode A, nature circulation stopped at late 16:00. The circulating water took more waste heat that was not converted into electricity away from PV cells, which lowered so much temperature of PV cells, leading to an increase the overall system efficiency. Then, there are many high-rise residential buildings in Hong Kong, where population density is related high. Therefore, installing the system inclining on the roof for each family or as a sun-shading board tilted above the window is impractical. The more reasonable installation is setting up the collector vertically on the exterior wall, the tank on the indoor, and other accessories hidden in the wall structure, making the system a vertical BIPVT; besides, the position of the tank should be higher than it of a collector because of height and density contrast needed for natural circulation. The advantages are obvious, the vertical BIPVT will combine with buildings perfectly instead of affecting architectural aesthetics; at the same time, the space thermal loads could be reduced both in summer and winter. What’s more, it will neither affect nature lighting nor shading mutually. Therefore, three modes were set, as shown in Table 3.
The water-type hybrid PV/T system was experimented on the roof, facing south with 20° tilt angle, and 90° tilt angle for simulating vertical BIPV/T as contrast experiment, throughout the test period in The Hong Kong Polytechnic University. The outdoor test proceeded all day for six months, from winter to spring, and the data was recorded all day at 1-min intervals. However, due to bad weather conditions or equipment disturbances, these data might be neither complete nor precise in the test period. As a result, using the data of selected 33 days to analyze the system’s performance is more reasonable and accurate.
3 System Performance Evaluation
One of the most common methods to assess the performance of a system is using efficiency terms. Among them, the overall efficiency per minute
where
where
However, the efficiency recorded per minute may not properly illustrate the system’s performance. As the consequence of too many external factors, such as ambient temperature, wind speed and fluctuant solar radiation, etc., and internal factors that the inlet water temperature varies during a day because of a closed system being tested, under various climate conditions and working conditions [17], the efficiency terms should be rated based on a daily test result. Therefore, the daily electrical efficiency
where
For obtaining the average efficiency and thermal loss rate of the annual forecast of the system more accurate, in Huang’s et al. [27] research, a semi-empirical system efficiency model used for daily performance assessment was proposed, which is defined as:
where
Considering actual utilization in residential buildings, based on the requirement of hot water, if the average water temperature in tank
For non-absolutely insulation, the heat loss of the system and the demand of auxiliary thermal heat would increase along with the time in the evening, due to the ambient temperature decreasing.
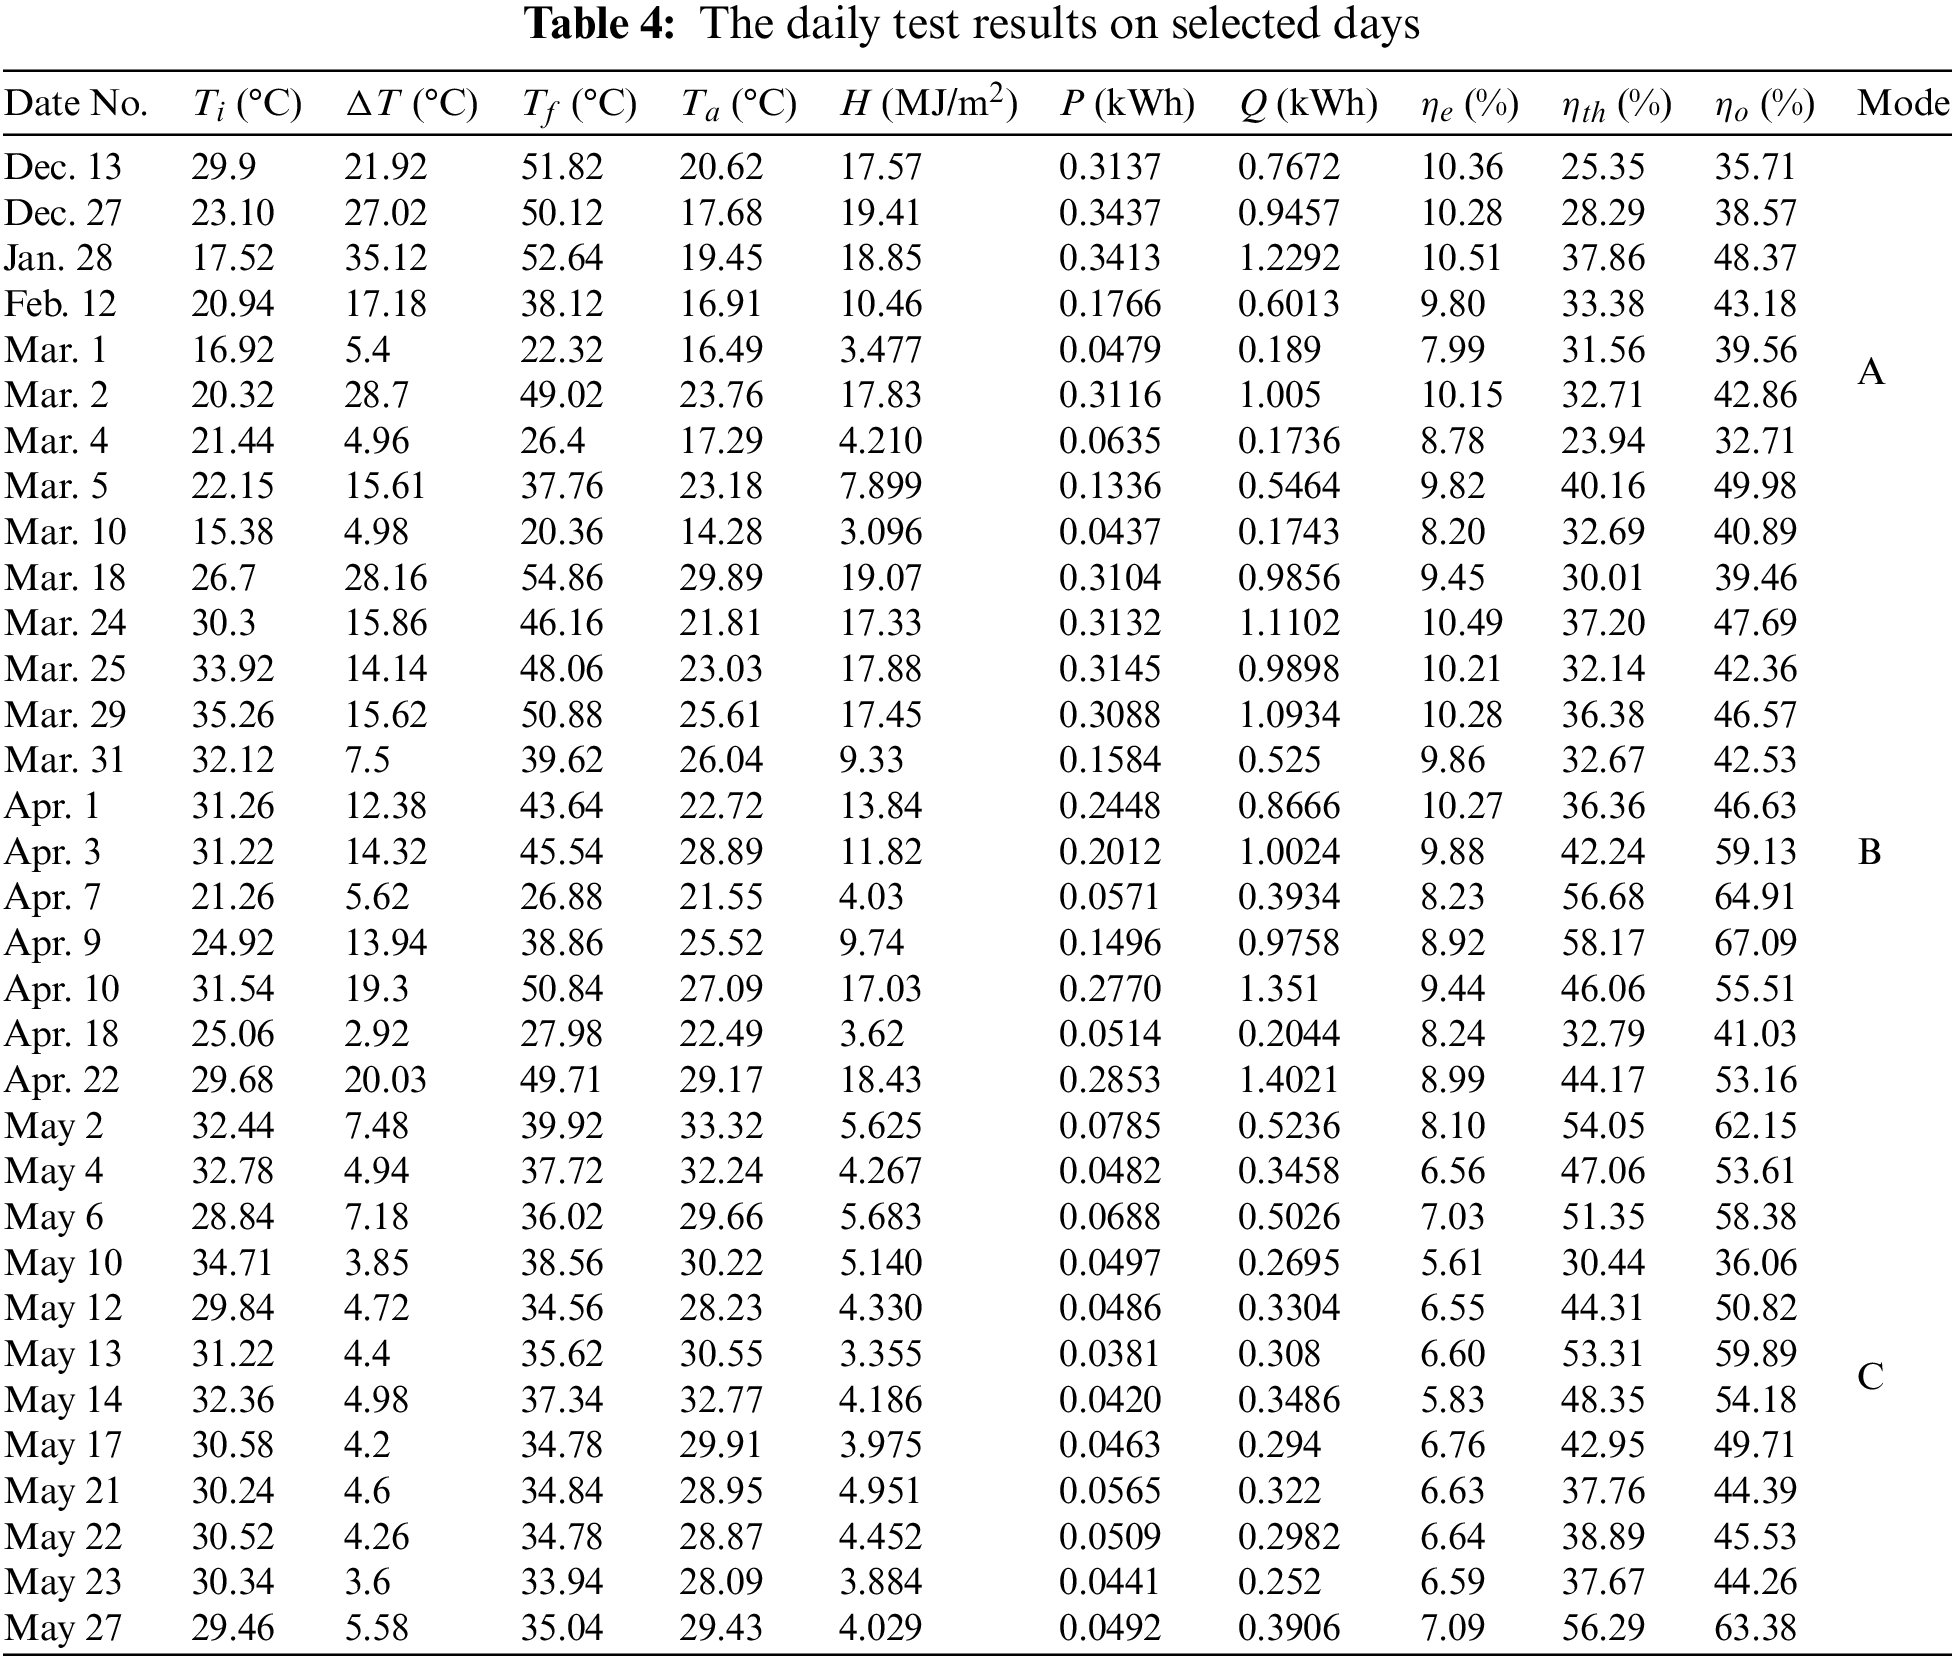
In Table 4, the daily test results of the suggested system are shown. Mode A was tested from December to mid-March, mode B was tested following mode A, and mode C was tested through May Through all modes, it can be seen that none of the daily electrical efficiencies is closed to the rated parameter. The variation of the weather, such as sunny, hazy, cloudy, and rainy days, and the solar altitude angle could explain the variation trend of efficiencies. Therefore, considering the PV cell itself, continually used for three years, the electrical efficiency would decay 2.2%–2.9%. Besides, tiny shading would significantly influence it because of connecting series. When it comes to the whole collector, the cover glass could explain that the glass reflects more than 15% of the incident solar radiation, leading to decreasing the electrical output. The other reason is the mist appearing on the inside of the cover glass; if there is unsatisfactory sealing between glass and frame, the air with high relative humidity permeates the collector. The cover glass increased PV cells’ temperature by the greenhouse effect, leading to better thermal energy conversion. So, the average daily thermal efficiency was higher than the conventional non-covered water-type flat-plate collector with the same heat collecting area.
When M/Ac was the same,
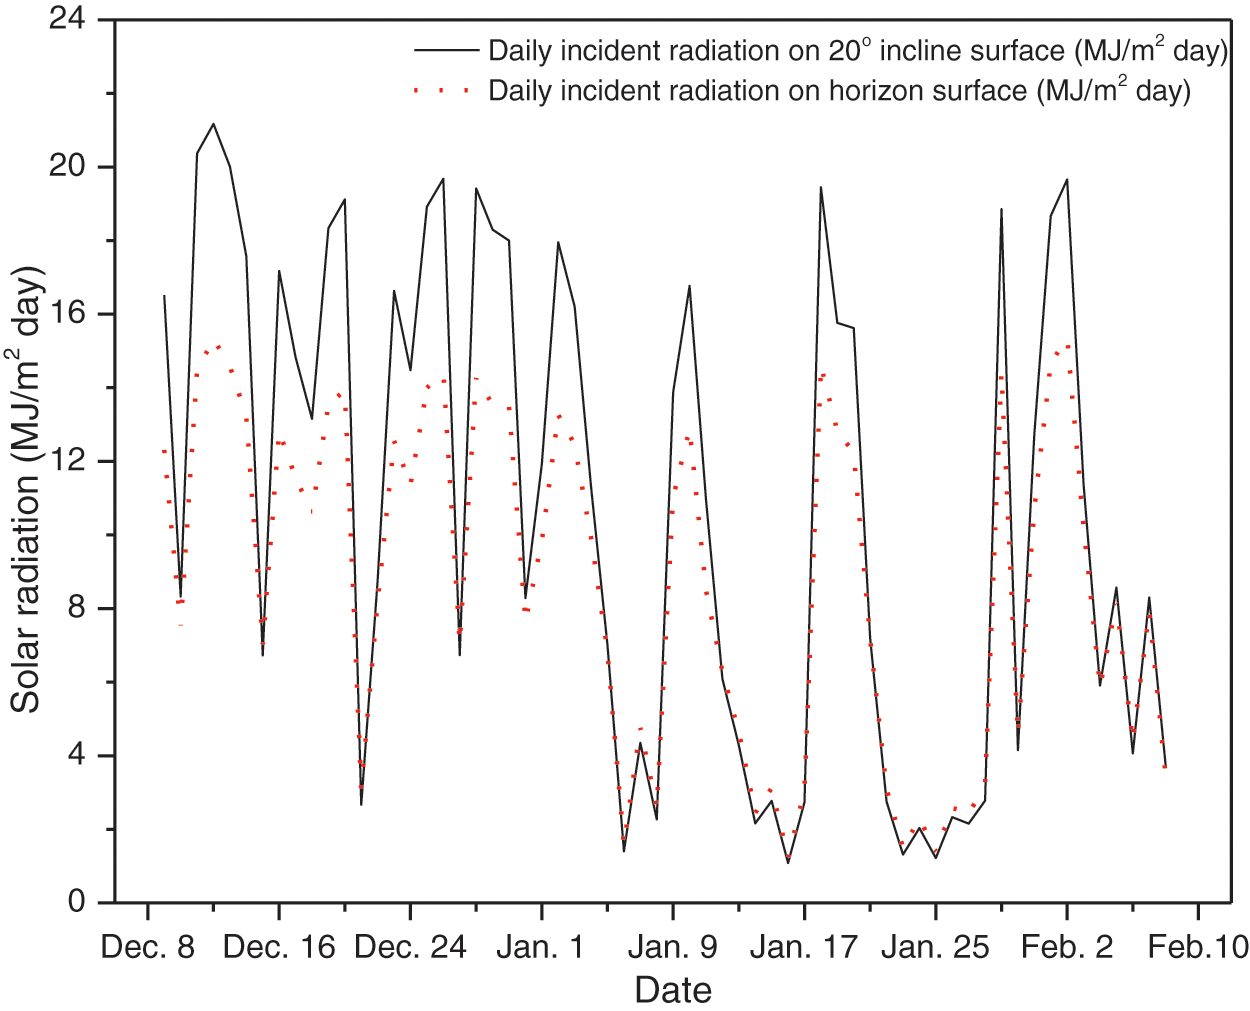
Figure 4: Daily incident solar radiation on 20° tilt and horizon surface under mode A
According to three modes, plots of
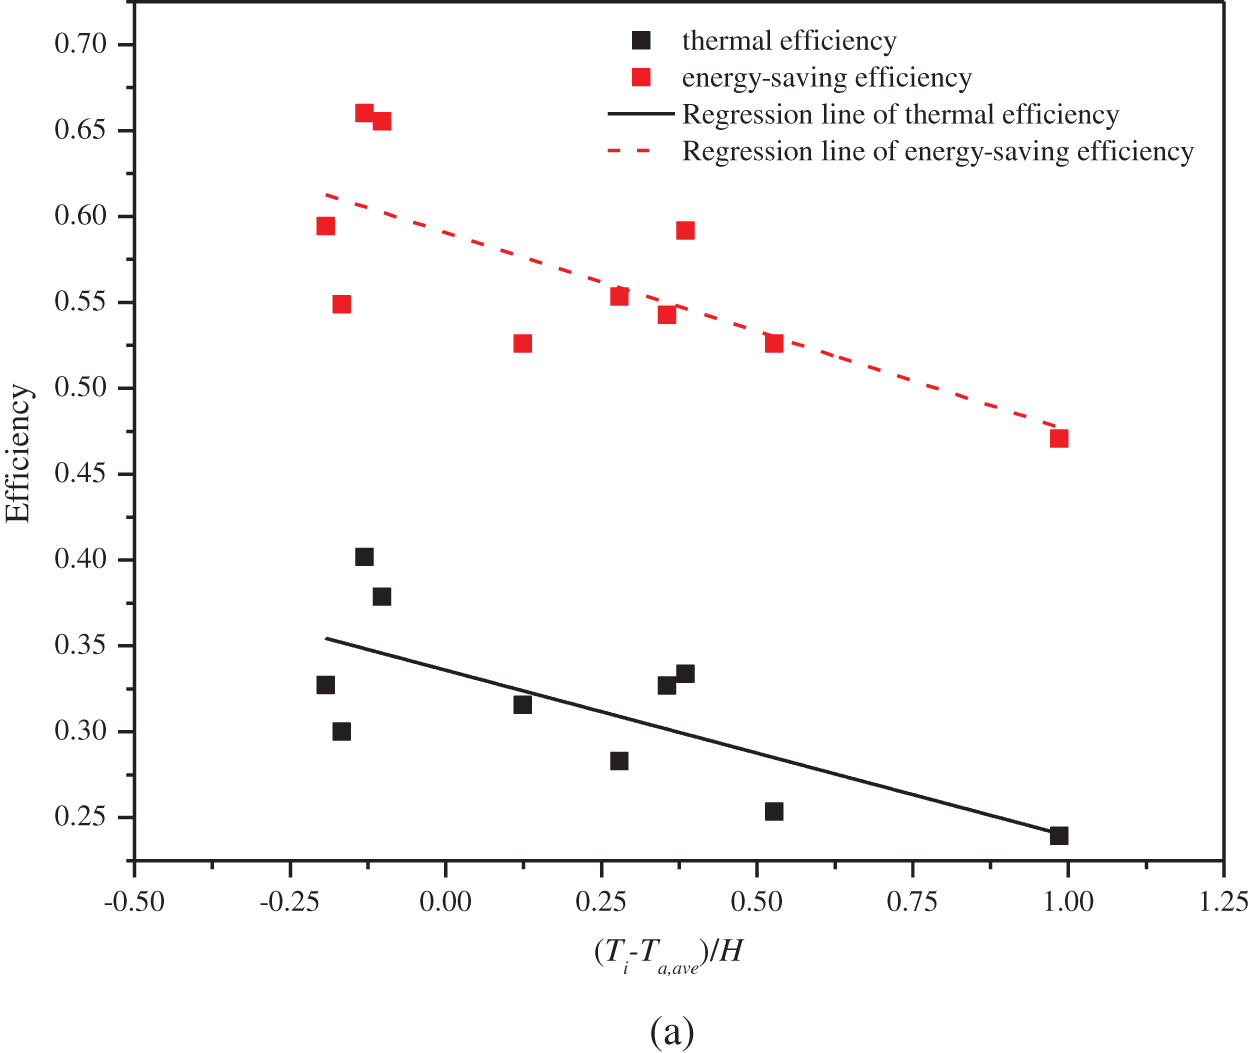
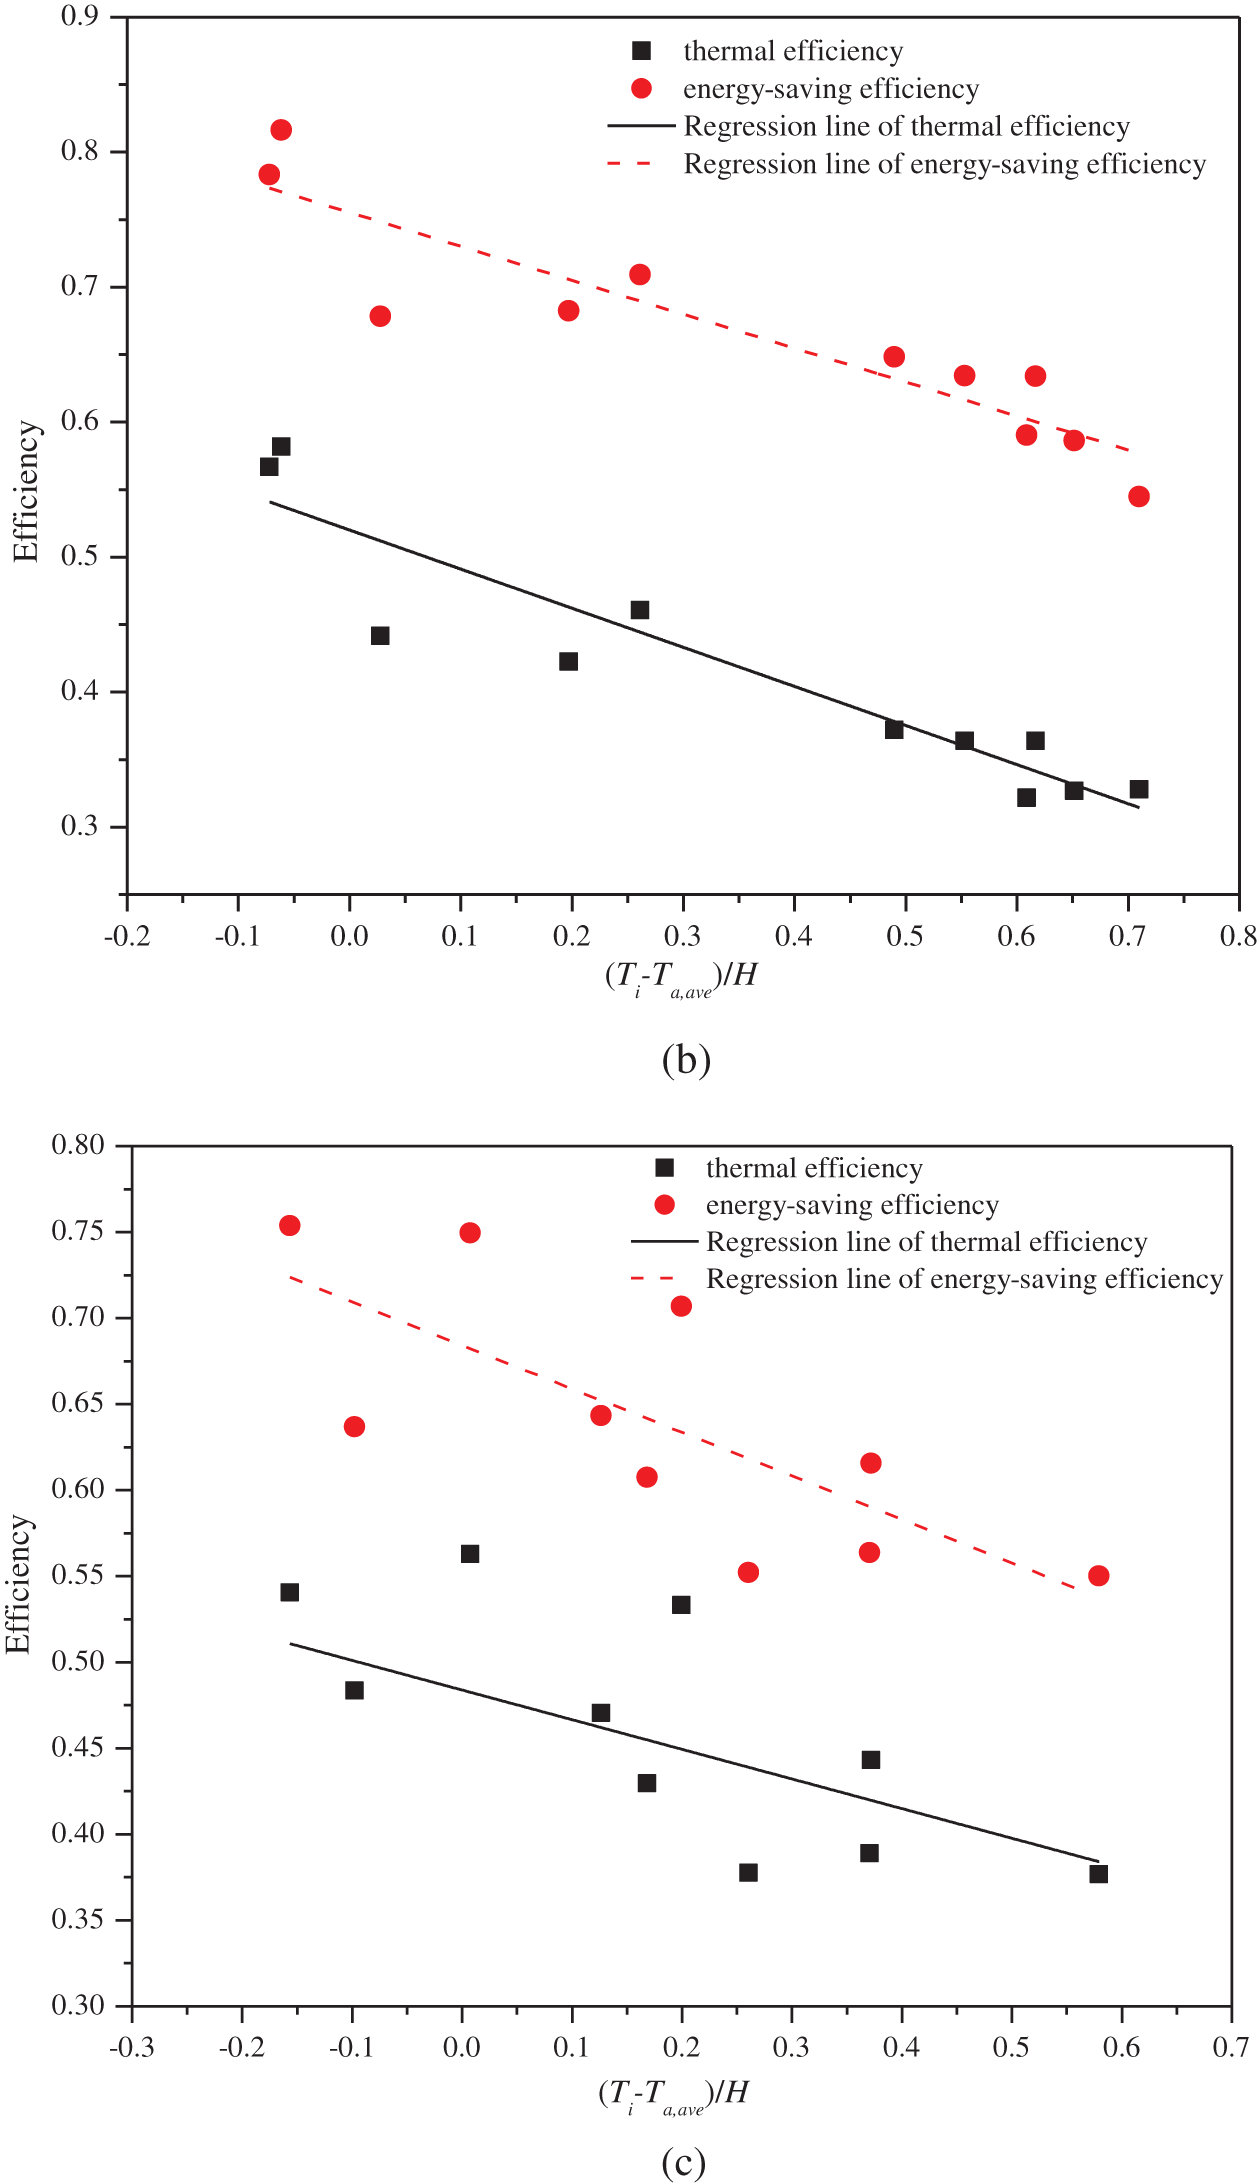
Figure 5: Test results of the daily thermal efficiency and overall efficiency of the PV/T system, (a) mode A, (b) mode B, (c) mode C
In mode A:
In mode B:
In mode C:
It is obvious that mode B has the highest value of
The performance of the hybrid PV/T system has been evaluated macroscopically, and one-day performance will be assessed on three specific days with three modes. The relationships between electricity, heat, working temperatures, flow rate, solar radiation, and efficiencies will be discussed below.
Mode A Dec. 13th and mode B Mar. 24th were chosen based on virtually identical circumstances of the two days, including solar radiation, initial water temperature in the tank, average ambient temperature, and wind speed. Specifically, H was 17.57 MJ/m2,
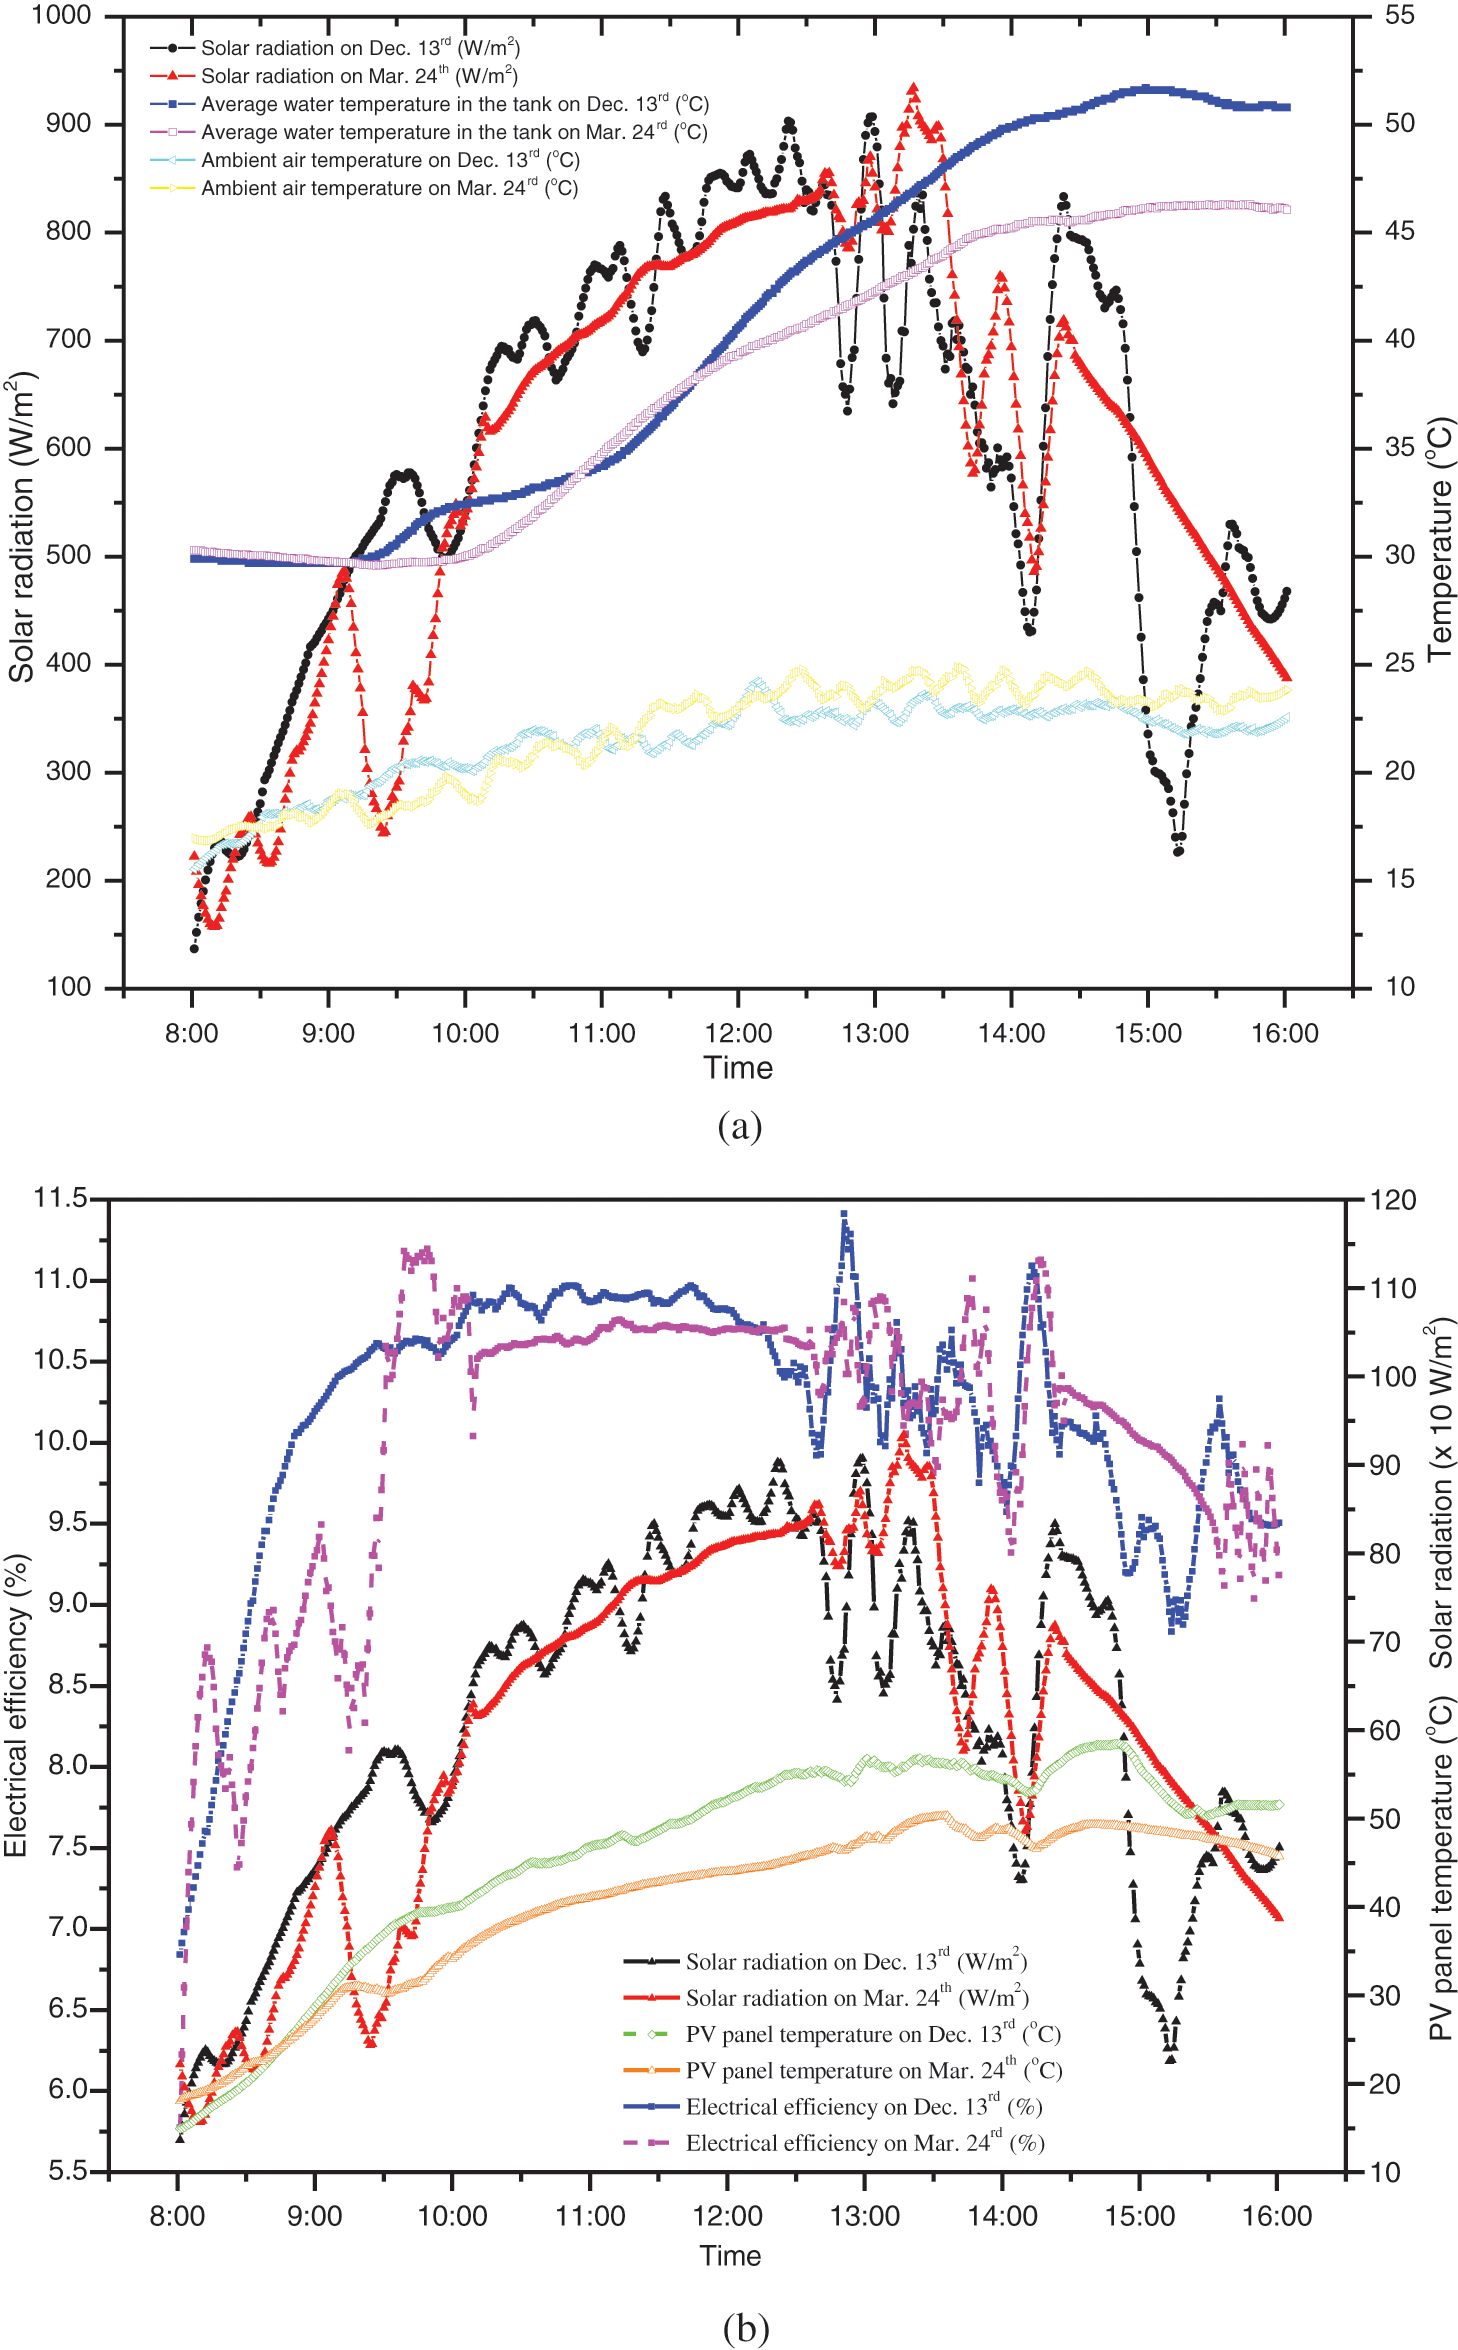
Figure 6: (a) Solar radiation, temperature in tank and ambient temperature on Dec. 13th (mode A) and Mar. 24th (mode B), (b) Solar radiation, PV cell temperature and electrical efficiency on Dec. 13th (mode A) and Mar. 24th (mode B)
In consideration of the influence on system performance by different collector angle, mode B Apr. 22nd and mode C May 6th were chosen. Particularly, the total daily horizon solar radiation was 15.49 MJ/m2,
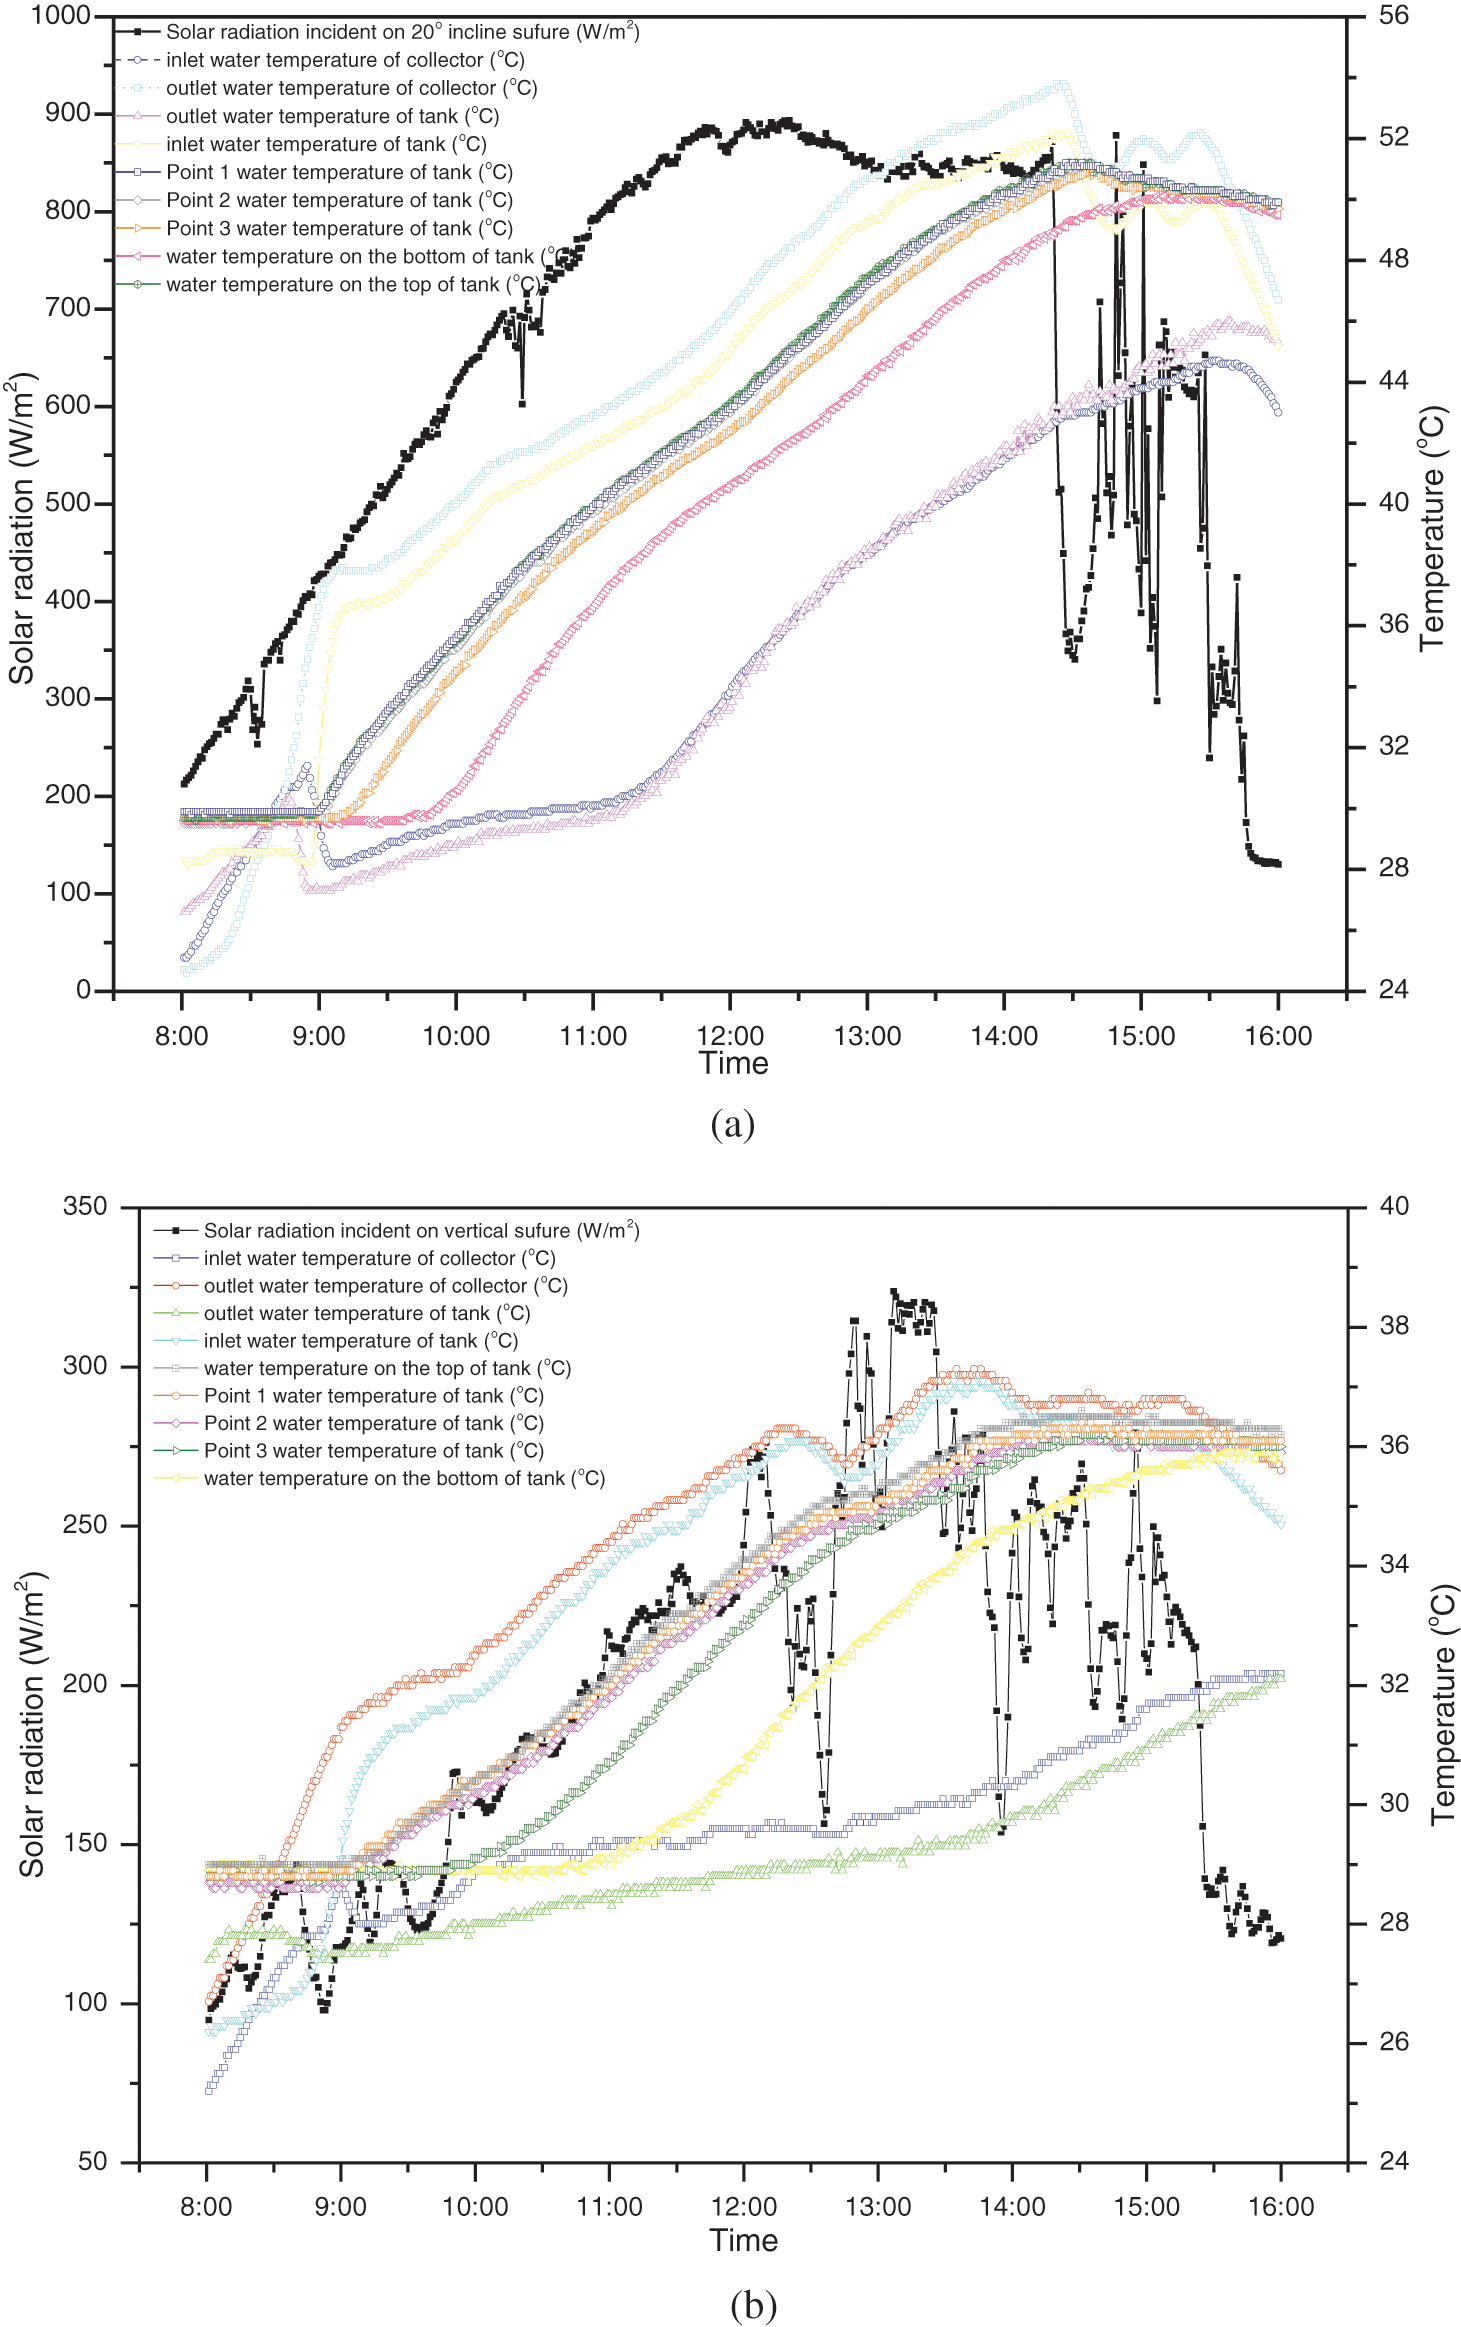
Figure 7: Relationships among solar radiation and temperatures. (a) Apr. 22nd (mode B), (b) May 6th (mode C)
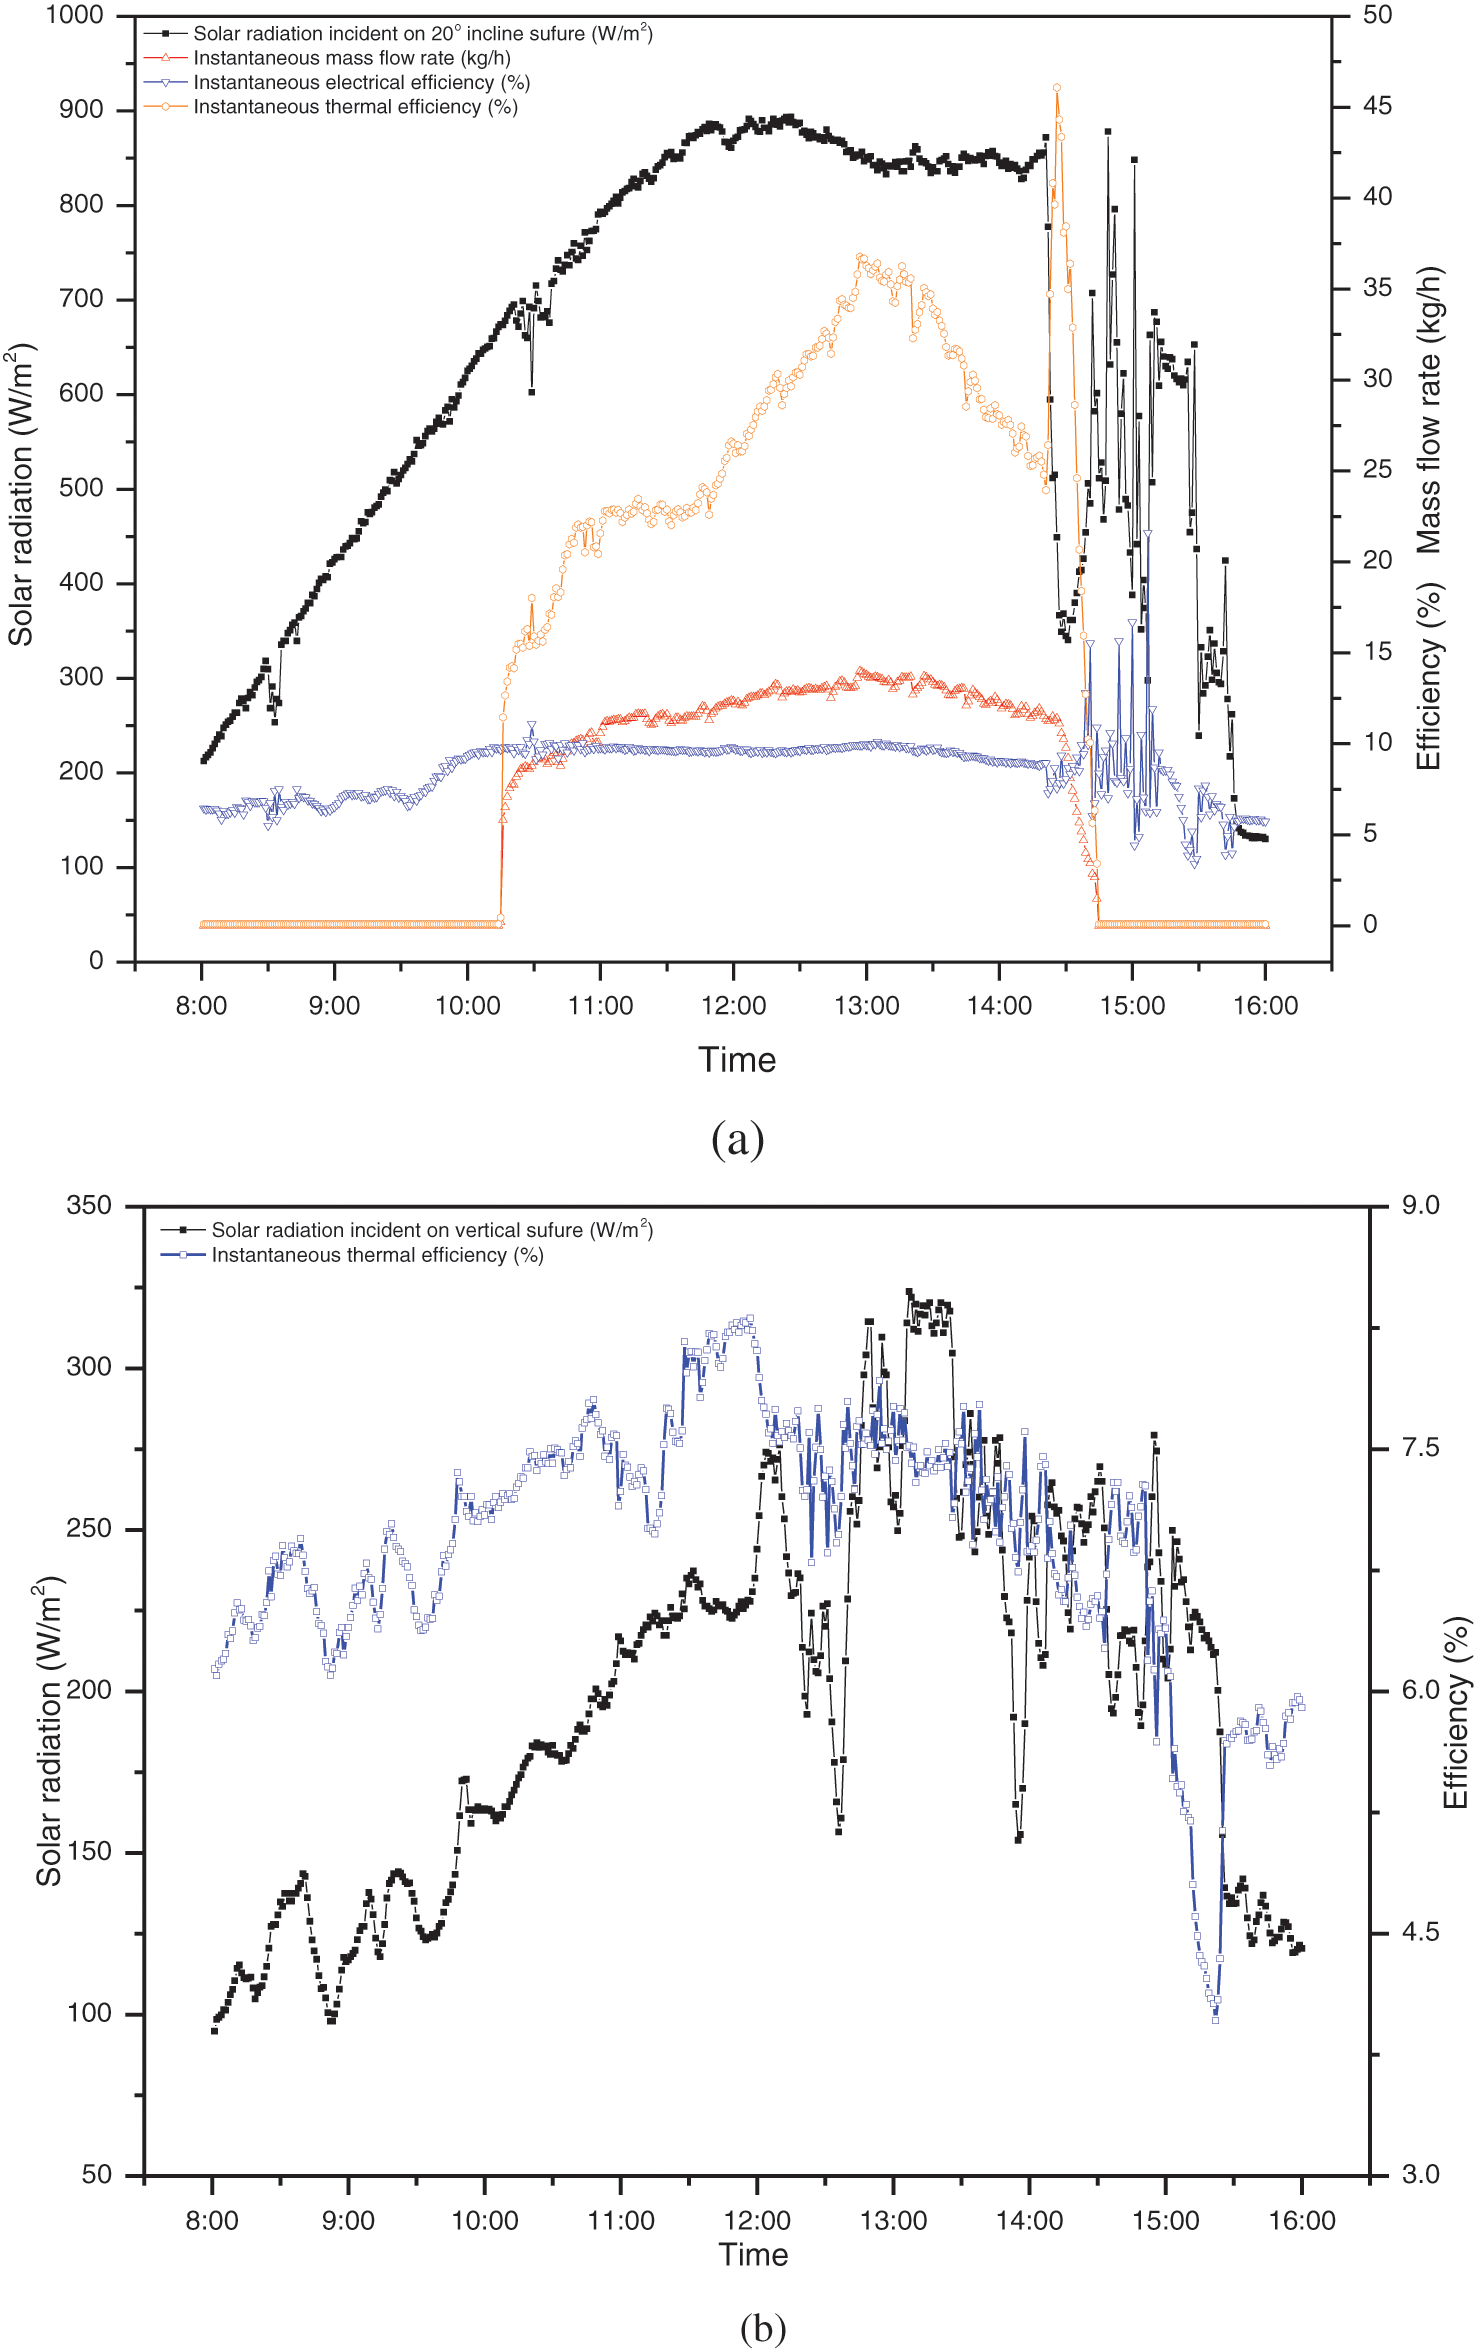
Figure 8: Relationships among solar radiation and efficiencies (a) Apr. 22nd (mode B), (b) May 6th (mode C)
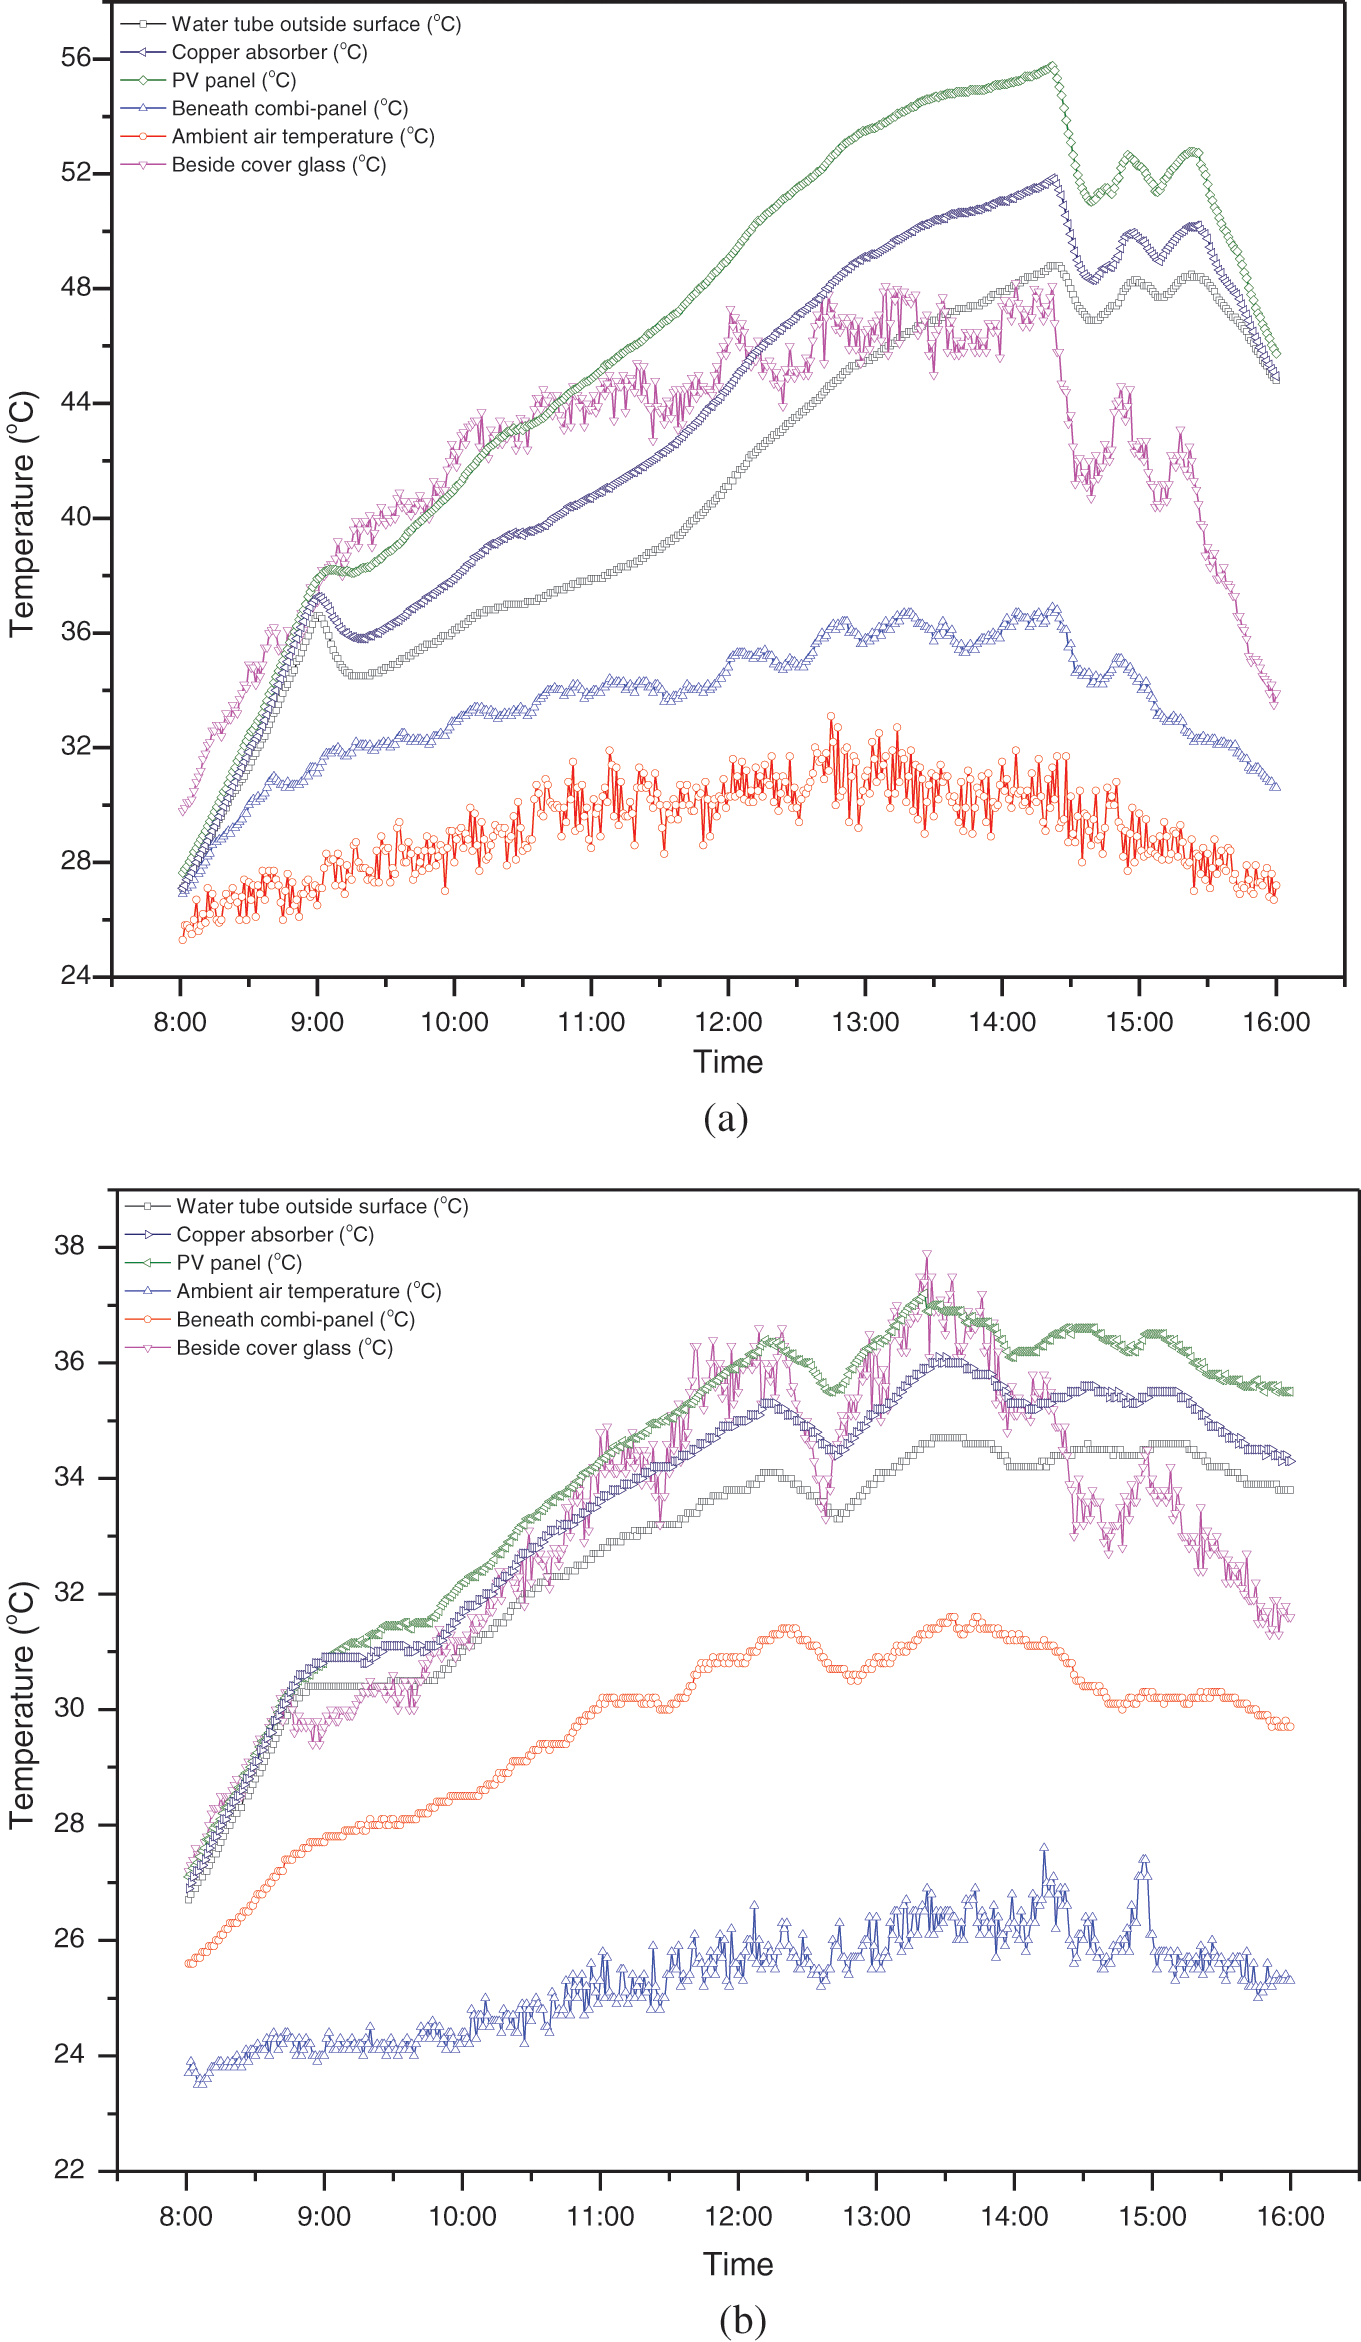
Figure 9: Relationships among structure temperatures (a) Apr. 22nd (mode B), (b) May 6th (mode C)
As shown in Fig. 7, there were water temperature differences between the inlet of the collector and the outlet of the tank, for water heat loss by friction and heat transfer when it flows in the pipes. When the circulation began, the water temperature went up from bottom to top layer in the tank and solar radiation increased. It is because the density of water decreases while the temperature increases, which leads to hot water floating up to the top with buoyancy, concurrently, cool water sinking to the bottom. At the end of the one-day test period,
Regarding mass flow rate, as shown in Fig. 8b, the determination of the relationship between flow rate and solar radiation was preceded. On Apr. 22nd, the flow rate remained zero from 8:00 to 10:00 due to the low solar radiation. Afterward, the flow rate had the same variation tendency with solar radiation, increased until noon, particularly sharply from 0 to 8.5 kg/h in 10 min after 10:00, achieved the maximum value 14 kg/h at 13:00, and then decreased gradually, declined to zero when the circulation stopped, that is,
One of the key factors in thermal performance is the quality of thermal contact and insulation among the components of the system. As illustrated in Fig. 9, the temperatures of PV cells, silicone gel, absorber plate, the surface of the water tube, back of the frame, cover glass, and ambient air were tested in a vertical line. It was found that the PV/T collector has good thermal contact; in this regard, the heat transfer of the thermal absorber was better than that of PV cells due to the copper bond between absorber and tube enhancing heat transfer. The silicone gel played an important role as not only a heat transfer medium but also an insulator. What’s more, the large average temperature difference was 10.8°C between the tube and back surface of insulation material, as shown in Fig. 9a, as well as illustrated in Fig. 9b, the average temperature difference between ambient air and back surface of insulation material was 3.8°C on both days, indicated that the thermal insulation materials performed well. Among them, the temperature of the cover glass, which fluctuated by the common influence of the temperatures of ambient air and PV cells, was approximately equal to the temperature of PV cells on May 6th, but on Apr. 22nd was lower. In addition, the temperature differences among the components were larger on Apr. 22nd than on May 6th, leading to higher thermal efficiency on Apr. 22nd. These phenomena occurred mainly because of the mass flow rate. The mass flow rate was smaller on May 6th, so the water could not take away as much heat produced by PV cells as that on Apr. 22nd. The water in the vertical collector of mode C needed to overcome the gravity of the longer process than that in the collector with an inclination of 20° of mode B. Therefore, even if the temperature difference for driving circulation is close in modes B and C, the mass flow rate of mode C will be smaller.
For practical application, the electric auxiliary heater in the tank should begin to work if the average tank water temperature is below 45°C when users needed. Assuming that hot water would be needed between 16:00 and 00:00, as shown in Fig. 10,
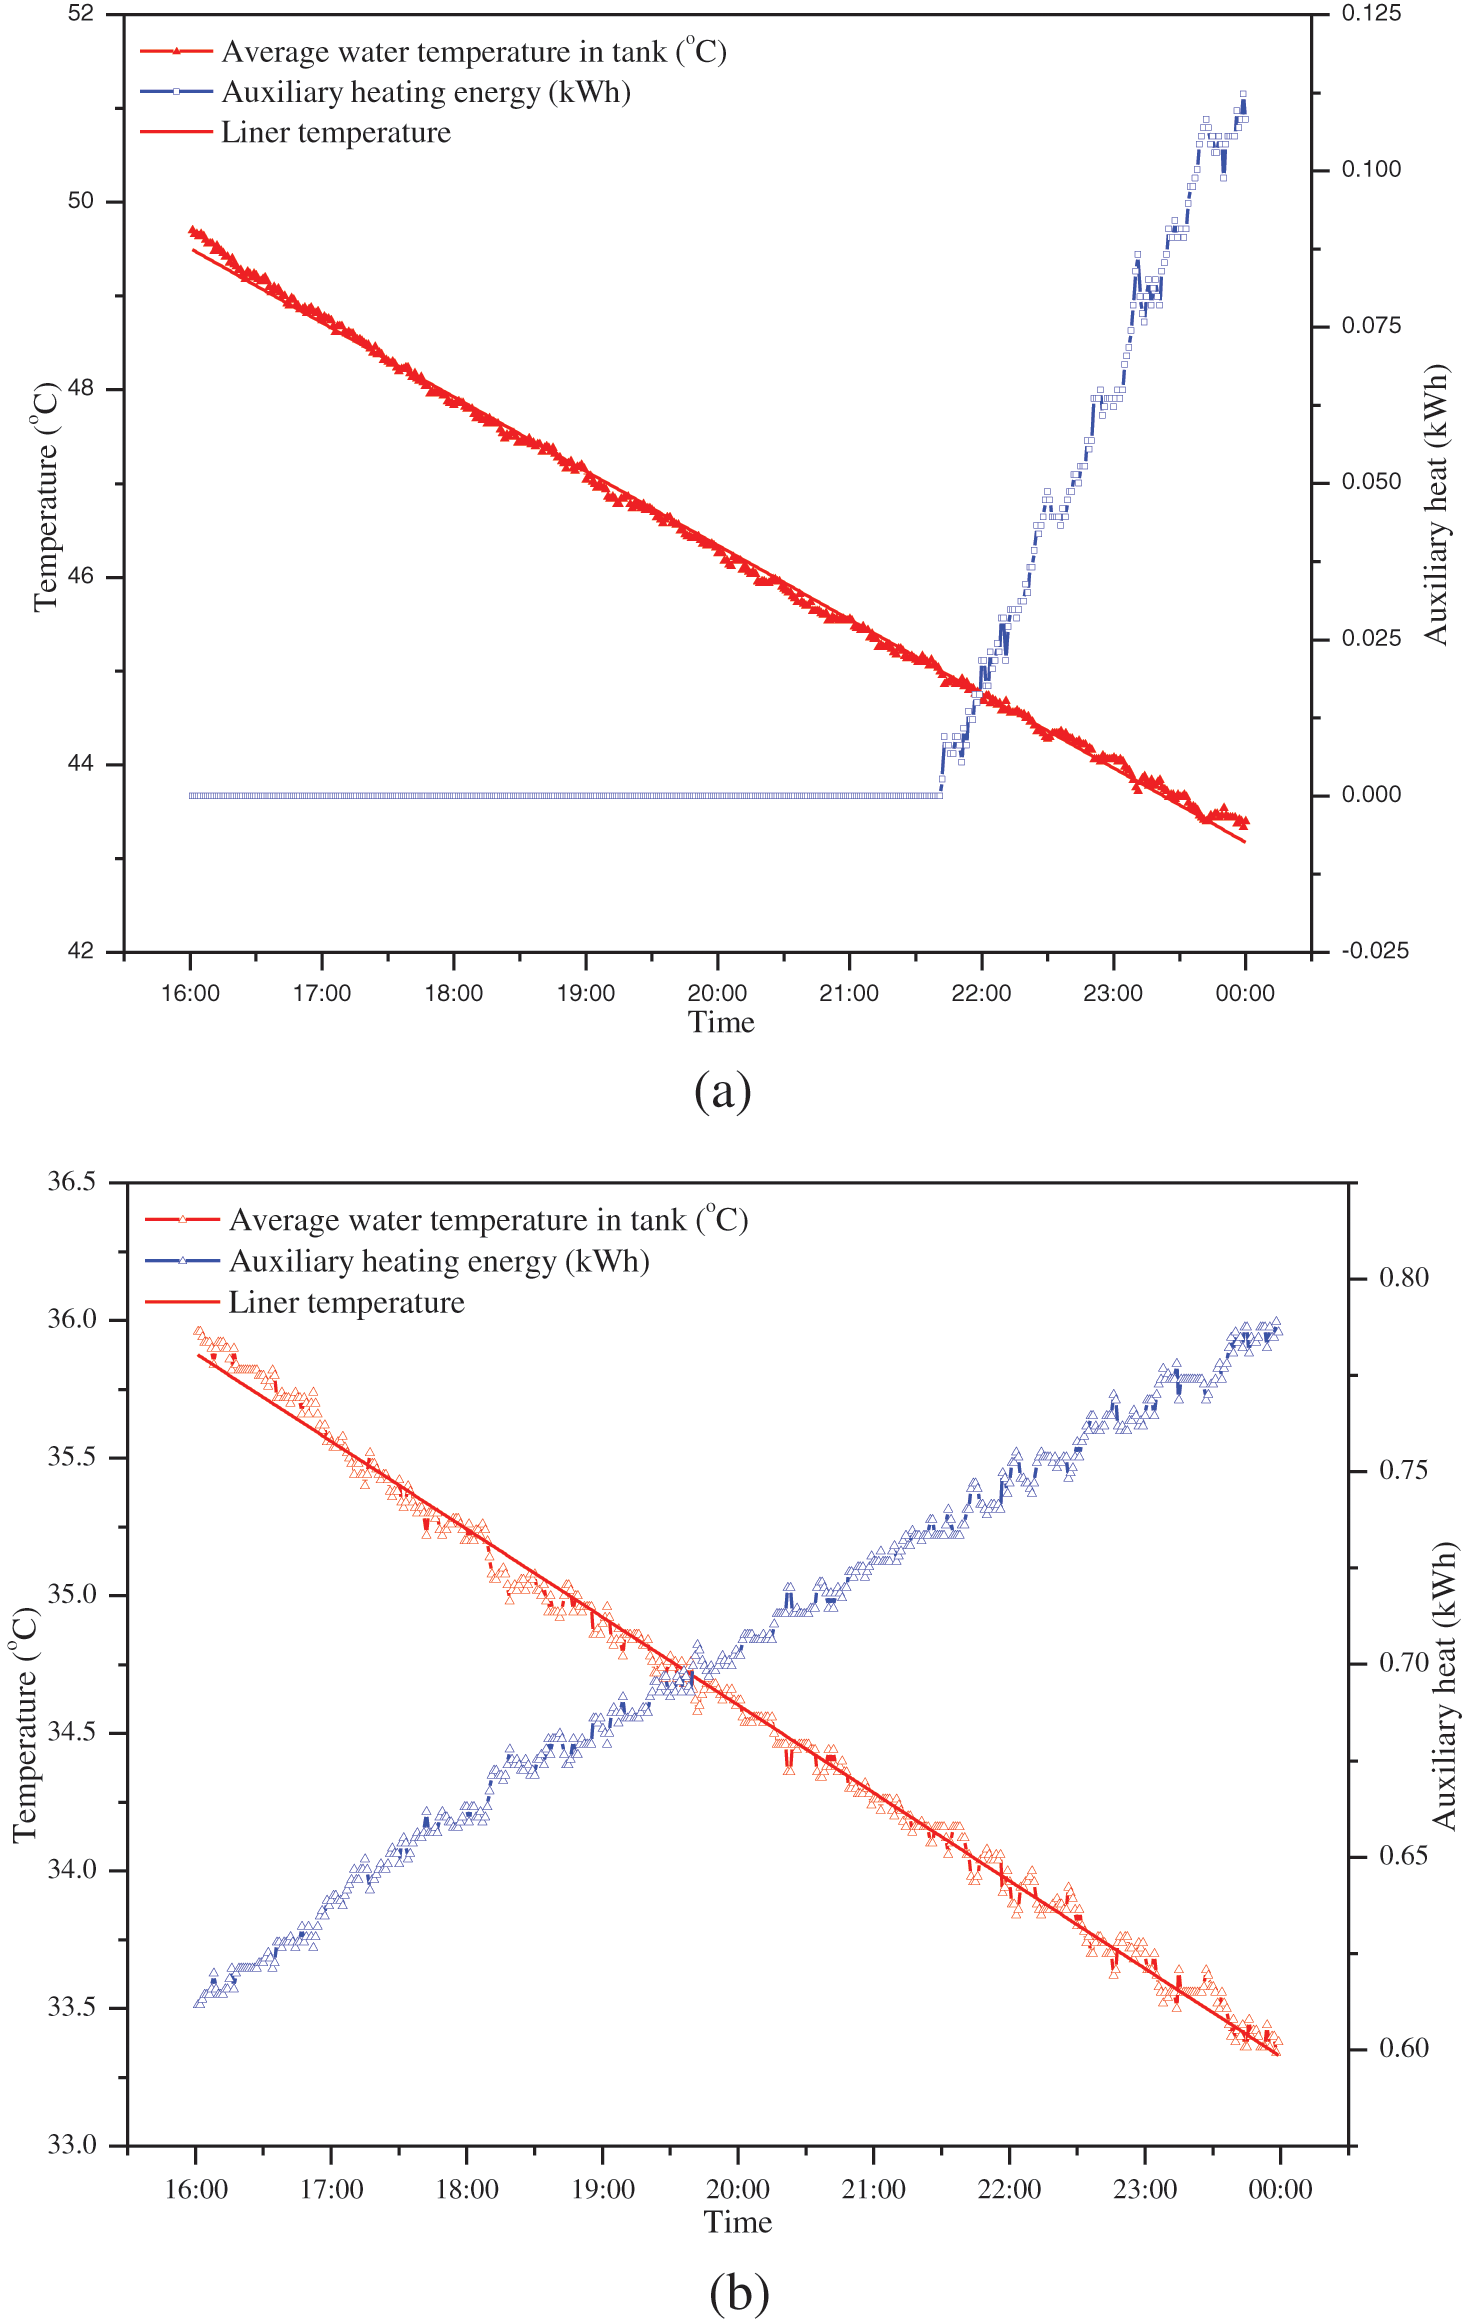
Figure 10: Relationship between average water temperature in the tank and auxiliary heat needed (a) Apr. 22nd (mode B), (b) May 6th (mode C)
and in Fig. 10b:
The deceasing rate of water temperature and the temperature difference between water in the tank and ambient air were smaller on May 6th, which leads to lower heat loss from the system. It is further proved that the system loss in mode C was less than that in mode B. The heat loss from the tank could be designed as:
where
The cost and life of the BIPV/T system for a nuclear family in Hong Kong were estimated and is provided in Table 5. The corresponding manufacturer provided the average life and cost of the water tank, electricity auxiliary heater, structure, battery, and converter. The cost of the collector included the cost of PV cells, cupper tube, absorber plate, frame, and assembling. The average life of a PV panel is 25 years given by PV panel manufacturers [8,28].
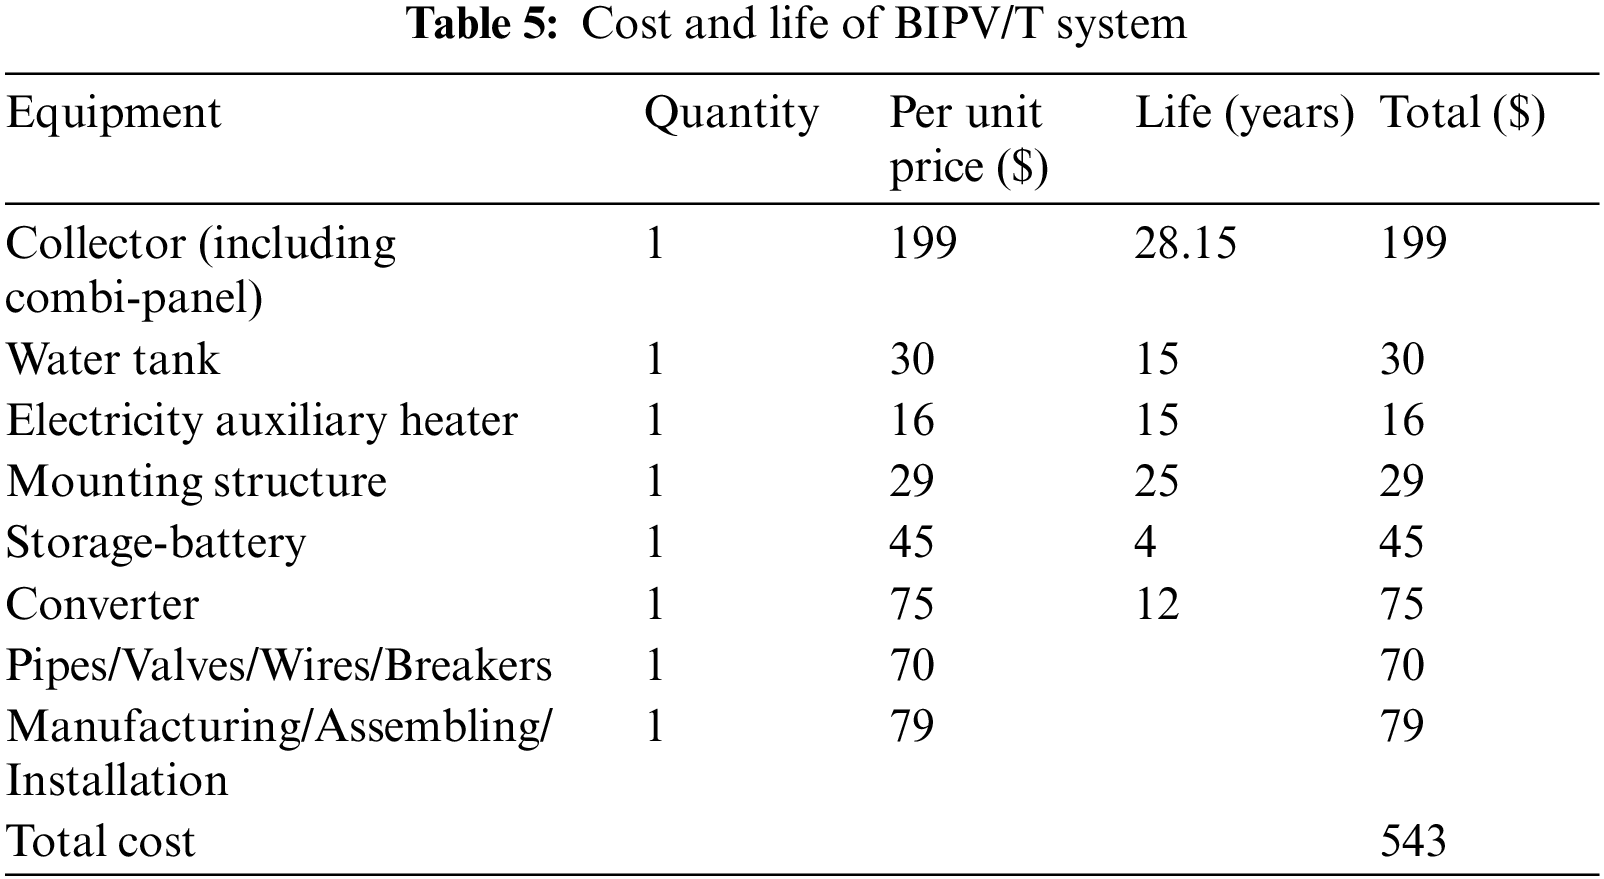
Temperature derating was 12.6% in the BIPV/T case (mode C), which means BIPV/T resulted in 3.15 years increase in the life of PV. So, the life of a BIPV/T collector would be 28.15 years. During its lifetime, the stability of BIPV/T is important, which is affected by the usage habits and the operational hours depending on the surrounding environment, including solar radiation, temperature, and wind speed etc.
BIPV/T system costed $543, whereas for conventional standalone-PV system costing approximately $319. Based on the results of the experiment, for one BIPV/T system (mode C) on each day of the year, the average
The cost-efficient hybrid photovoltaic/thermal system is favorable for improving the overall utilization efficiency of solar energy by getting both electricity and thermal heat simultaneously. A hybrid water-type flat-plate PV/T system was designed and taken outdoor tests with three different modes from winter to spring. The results show that the thermal efficiency at zero reduced temperature of each mode was 33.6%, 52.0%, and 48.3%, respectively. Meanwhile, the overall efficiency was 43.2%, 60.9%, and 55.2%, respectively. Besides, the average electrical efficiency was 9.97% for mode A, 10.5% for mode B and 7.5% for mode C. It is obvious that all modes had higher overall efficiency than the conventional water-type flat-plate solar collector with the identical area and
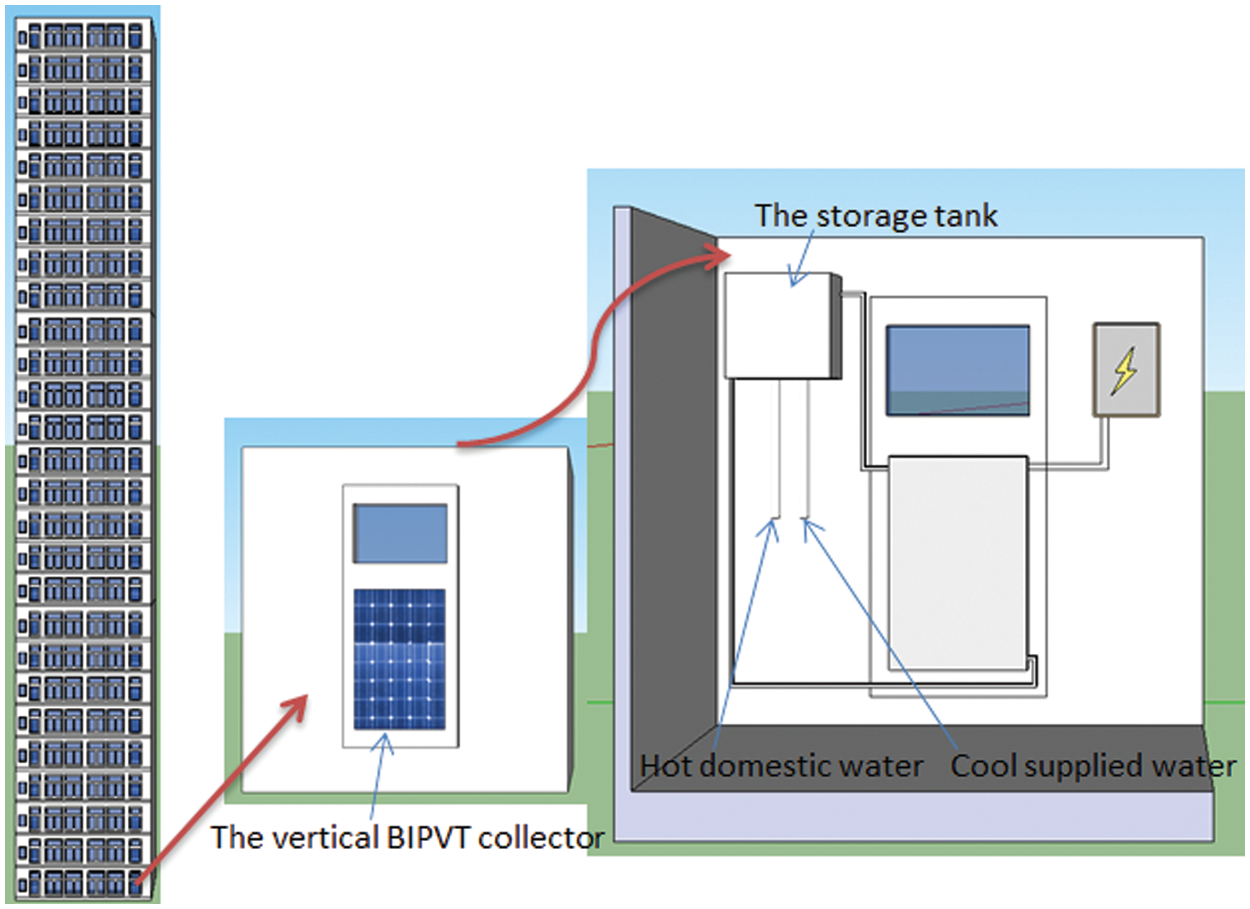
Figure 11: Vertical BIPVT system installed in the residential building
• Vertical BIPVT is particularly useful when the mounted space is limited, because the tilted one needs more space, although total energy is produced a little bit more than the vertical one;
• Vertical BIPVT collector, installed combining with external wall, could reduce temperature of internal wall in summer and increase it in winter, leads to lowering cold/heat load of the building;
• Vertical BIPVT system, $543 initial investment and 4.2 years payback period, is perfect for residential buildings aging 30–40 years in Hong Kong;
• The storage tank of vertical BIPVT system, installed indoor and using electric auxiliary heater instead of gas, is much safer and energy-saving than the traditional water heater in Hong Kong;
• The structure of vertical BIPVT system is simpler without vibrating equipment, and the life the system is increased;
• Vertical BIPVT not only provides architectural uniformity on the external wall, but also has no influence on natural lighting or shades other collectors;
• Vertical BIPVT system is easy to operate. Meanwhile, it can reduce CO2 emissions by 775.647 kg throughout the year for one nuclear family.
On the whole, the vertical BIPVT system proposed in this study is suitable for civil utilization and encouraging to be applied in high-rise residential-intensive buildings in Hong Kong.
Acknowledgement: Thanks to the help of Hong Kong Polytechnic University, the experiment was carried out smoothly.
Funding Statement: This research was funded by the Science & Technology Development Fund of Tianjin Education Commission for Higher Education (Project No. 2020ZD03), and Tianjin Science and Technology Plan Project Technical Innovation and Guide Special Project Science and Technology Commissioner Project (Grant No. 21YDTPJC01000).
Conflicts of Interest: The authors declare that they have no conflicts of interest to report regarding the present study.
References
1. Nasrin, R., Hasanuzzaman, M., Rahim, N. A. (2018). Effect of high irradiation on photovoltaic power and energy. International Journal of Energy Research, 42(3), 1115–1131. DOI 10.1002/er.3907. [Google Scholar] [CrossRef]
2. Kern, E. C.Jr, Russell, M. C. (1978). Combined photovoltaic and thermal hybrid collector systems. IEEE Photovoltaic Specialists Conference, Washington DC, USA. [Google Scholar]
3. Anand, A., Shukla, A., Panchal, H., Sharma, A. (2021). Thermal regulation of photovoltaic system for enhanced power production: A review. Journal of Energy Storage, 35, 102236. DOI 10.1016/j.est.2021.102236. [Google Scholar] [CrossRef]
4. Pang, W., Cui, Y., Zhang, Q., Wilson, G. J., Yan, H. (2020). A comparative analysis on performances of flat plate photovoltaic/thermal collectors in view of operating media, structural designs, and climate conditions. Renewable and Sustainable Energy Reviews, 119(7), 109599. DOI 10.1016/j.rser.2019.109599. [Google Scholar] [CrossRef]
5. Pathak, S. K., Sharma, P. O., Goel, V., Bhattacharyya, S., Aybar, H. et al. (2022). A detailed review on the performance of photovoltaic/thermal system using various cooling methods. Sustainable Energy Technologies and Assessments, 51, 101844. DOI 10.1016/j.seta.2021.101844. [Google Scholar] [CrossRef]
6. Javidan, M., Moghadam, A. J. (2021). Experimental investigation on thermal management of a photovoltaic module using water-jet impingement cooling. Energy Conversion and Management, 228(1–3), 113686. DOI 10.1016/j.enconman.2020.113686. [Google Scholar] [CrossRef]
7. Reihaneh, A. (2019). Evaluation of supply and demand in building energy performance: Application of retrofit scenarios in residential building. Energy Engineering, 116, 60–79. DOI 10.1080/01998595.2019.12043339. [Google Scholar] [CrossRef]
8. Ehab Hussein, B. H., Ahmad, S., Abdulrahman, F., Abdullatif, A. M., Ahmad, A. B. et al. (2018). Photovoltaic system as source of power in residential buildings: Technical and economical study. Energy Engineering, 115, 6–22. DOI 10.1080/01998595.2018.12002415. [Google Scholar] [CrossRef]
9. Shahsavar, A., Jha, P., Arıcı, M., Nižetić, S., Ma, Z. J. (2021). Energetic and exergetic performances of a nanofluid-based photovoltaic/thermal system equipped with a sheet-and-grooved serpentine tube collector: Indoor experimental tests. Solar Energy, 225, 918–933. [Google Scholar]
10. Kiwan, S. M., Khlefat, A. M. (2021). Thermal cooling of photovoltaic panels using porous material. Case Studies in Thermal Engineering, 24, 100837. [Google Scholar]
11. Kahani, M., Zamen, M., Rostami, B. (2022). Modeling and empirical study of TiO2/water nanofluid flows in a modified configuration with new layer arrangement of a photovoltaic/thermal system. Sustainable Energy Technologies and Assessments, 51, 101932. [Google Scholar]
12. Junaid, K., Rashid, A., Muzammil, Z., Syed Mohd, Y. (2022). Energy and life cycle assessment of zinc/water nanofluid based photovoltaic thermal system. Energy Engineering, 119(2), 827–846. DOI 10.32604/ee.2022.016344. [Google Scholar] [CrossRef]
13. Nikbakht, S., Rafee, R., Saedodin, S., Ahmadi, P. (2022). Dynamic thermal analysis and 3E evaluation of a CCHP system integrated with PVT to provide dynamic loads of a typical building in a hot-dry climate. Sustainable Energy Technologies and Assessments, 52(3), 101970. DOI 10.1016/j.seta.2022.101970. [Google Scholar] [CrossRef]
14. Han, Z. H., Liu, K. X., Li, G. Q., Zhao, X. D., Shittu, S. (2021). Electrical and thermal performance comparison between PV/T-ST and PV-ST systems. Energy, 237, 121589. DOI 10.1016/j.energy.2021.121589. [Google Scholar] [CrossRef]
15. Bae, S., Oh, J., Kim, J., Baek, E. R., Nam, Y. (2022). Energy performance analysis of textile and capillary tube composite panel system by computational fluid dynamics and real-scale experiments. Energy and Buildings, 258(3), 111825. DOI 10.1016/j.enbuild.2021.111825. [Google Scholar] [CrossRef]
16. Alomar, O. R., Ali, O. M. (2021). Energy and exergy analysis of hybrid photovoltaic thermal solar system under climatic condition of North Iraq. Case Studies in Thermal Engineering, 28(215), 101429. DOI 10.1016/j.csite.2021.101429. [Google Scholar] [CrossRef]
17. Kazem, H. A., Chaichan, M. T., Al-Waeli, A. H. A., Sopian, K. (2021). Comparison and evaluation of solar photovoltaic thermal system with hybrid collector: An experimental study. Thermal Science and Engineering Progress, 22(4), 100845. DOI 10.1016/j.tsep.2021.100845. [Google Scholar] [CrossRef]
18. Cabral, D., Gomes, J., Hayati, A., Karlsson, B. (2021). Experimental investigation of a CPVT collector coupled with a wedge PVT receiver. Solar Energy, 215(3), 335–345. DOI 10.1016/j.solener.2020.12.038. [Google Scholar] [CrossRef]
19. Brottier, L., Bennacer, R. (2020). Thermal performance analysis of 28 PVT solar domestic hot water installations in Western Europe. Renewable Energy, 160(I 1), 196–210. DOI 10.1016/j.renene.2020.06.072. [Google Scholar] [CrossRef]
20. Shao, N., Ma, L., Zhou, C., Zhang, D. (2022). Experimental study on the heat transfer performance of the PVT ventilated roof as heat exchanger for heat pump system. Renewable Energy, 187(9), 995–1008. DOI 10.1016/j.renene.2022.01.084. [Google Scholar] [CrossRef]
21. Maghrabie, H. M., Elsaid, K., TahaSayed, E., Abdelkareem, M. A., Wilberforce, T. et al. (2021). Building-integrated photovoltaic/thermal (BIPVT) systems: Applications and challenges. Sustainable Energy Technologies and Assessments, 45(3), 101151. DOI 10.1016/j.seta.2021.101151. [Google Scholar] [CrossRef]
22. Asefi, G., Habibollahzade, A., Ma, T., Houshfar, E., Wang, R. Z. (2021). Thermal management of building-integrated photovoltaic/thermal systems: A comprehensive review. Solar Energy, 216, 188–210. DOI 10.1016/j.solener.2021.01.005. [Google Scholar] [CrossRef]
23. Jalalizadeh, M., Fayaz, R., Delfani, S., Mosleh, H. J., Karami, M. (2021). Dynamic simulation of a trigeneration system using an absorption cooling system and building integrated photovoltaic thermal solar collectors. Journal of Building Engineering, 43(2), 102482. DOI 10.1016/j.jobe.2021.102482. [Google Scholar] [CrossRef]
24. Gagliano, A., Tina, G. M., Aneli, S., Chemisana, D. (2021). Analysis of the performances of a building-integrated PV/Thermal system. Journal of Cleaner Production, 320(3), 128876. DOI 10.1016/j.jclepro.2021.128876. [Google Scholar] [CrossRef]
25. Barthwal, M., Rakshit, D. (2021). Artificial neural network coupled building-integrated photovoltaic thermal system for Indian montane climate. Energy Conversion and Management, 244(2), 114488. DOI 10.1016/j.enconman.2021.114488. [Google Scholar] [CrossRef]
26. Ali, K., Oscar Ricardo Sandoval, R., Behnam, T., Timo, L., Juan Jose Garcia, P. et al. (2021). New correlations for determination of optimum slope angle of solar collectors. Energy Engineering, 117, 249–265. DOI 10.32604/EE.2020.011024. [Google Scholar] [CrossRef]
27. Huang, B. J., Lin, T. H., Hung, W. C., Sun, F. S. (2001). Performance evaluation of solar photovoltaic/thermal systems. Solar Energy, 70(5), 443–448. DOI 10.1016/S0038-092X(00)00153-5. [Google Scholar] [CrossRef]
28. Shahid, H., Ahmad, A., Ahmad, U., Raza, G., Rashid, M. (2022). Thermal stabilization, energy, cost and life analyses of hybrid photovoltaic-phase change composite system–Part 1. Journal of Energy Storage, 52(1), 104771. DOI 10.1016/j.est.2022.104771. [Google Scholar] [CrossRef]
29. Cotfas, D. T., Cotfas, P. A., Machidon, O. M. (2018). Study of temperature coefficients for parameters of photovoltaic cells. International Journal of Photoenergy, 2018(1), 5945602. DOI 10.1155/2018/5945602. [Google Scholar] [CrossRef]
30. Ministry of Housing and Urban-Rural Development of the People’s Republic of China, Standard for building carbon emission calculation. GB/T 51366-2019. [Google Scholar]
Cite This Article
 Copyright © 2022 The Author(s). Published by Tech Science Press.
This work is licensed under a Creative Commons Attribution 4.0 International License , which permits unrestricted use, distribution, and reproduction in any medium, provided the original work is properly cited.
 Downloads
 Citation Tools