
 Submit a Paper
 Propose a Special lssue
 Open Access
ARTICLE
Research on Representative Engineering Applications of Anemometer Towers Location in Complex Topography Wind Resource Assessment
1 CSSC Windpower Development Co., Ltd., Beijing, 100097, China
2 School of Energy and Power Engineering, Inner Mongolia University of Technology, Hohhot, 010051, China
3 Institute of Engineering Thermophysics, Chinese Academy of Sciences, Beijing, 100190, China
4 Key Laboratory of Wind Energy Utilization, Chinese Academy of Sciences, Beijing, 100190, China
5 University of Chinese Academy of Sciences, Beijing, 100049, China
* Corresponding Author: Zhongjie Yan. Email:
(This article belongs to the Special Issue: Wind Energy Development and Utilization)
Energy Engineering 2023, 120(1), 163-179. https://doi.org/10.32604/ee.2022.019927
Received 24 October 2021; Accepted 31 March 2022; Issue published 27 October 2022
 View Full Text
 Download PDF
Abstract
The typical location and number of anemometer towers in the assessed area are the key to the accuracy of wind resource assessment in complex topography. As calculation examples, this paper used two typical complex topography wind farms in Guangxi, Yunnan province in China. Firstly, we simulated the wind resource status of the anemometer tower in the Meteodyn WT software. Secondly, we compared the simulated wind resource with the actual measured data by the anemometer tower in the same situation. Thirdly, we analyzed the influence of anemometer tower location and quantity in the accuracy of wind resource assessment through the comparison results. The results showed that the range which the anemometer tower can represent is limited (<5 kilometers), and the prediction error more than 5%. Besides, the anemometer towers in special terrain areas (such as wind acceleration areas) cannot be used as a representative choice. The relative error of the simulated average annual wind speed by choose different number of anemometer towers is about 4%, and the grid-connected power generation more than 6%. The representative effect of anemometer towers is of crucial for improving the accuracy of wind resource assessment in engineering applications.Keywords
Notations
| Density | |
| Average wind speed and random component in the x, y and z directions | |
| Hydrodynamic viscosity | |
| Component of the volume force in the x, y, z directions on the fluid mass | |
| Average Reynolds pressure | |
| Turbulent viscosity |
Wind power generation is significant for promoting sustainable economic and social development [1]. In China, the mountain area accounts for about 1/3 of the total land. With the proposal of the “30⋅60” policy and “carbon peak and carbon neutral” goals, wind power generation in China will be developed on a large scale in the next ten years [2,3]. The complex topography, such as mountains and valleys, which have significant topography change and rich wind energy resources have become investment targets in the wind power generation industry. Therefore, it is necessary to research greater and even more complex topography wind resource assessment technology [4–6]. Different from plain areas, the distribution of wind resources in mountainous regions of time and space is highly uneven because of the influence of the surrounding topography, altitude, and other factors [7,8]. Therefore, it is necessary to conduct a complete and accurate assessment of the wind resources in the estimated mountainous area before building a wind farm. The result of wind energy resource assessment is crucial for national governments to formulate wind power generation development plans and evaluate wind farm economic benefits [9–11].
Many researchers have studied the impact of topography size, surface roughness, atmospheric boundary layer, and surrounding forest on wind resources simulation through the computational fluid dynamics (CFD) method [12]. Computational fluid dynamics (CFD) is a distinct discipline. RANS equation solvers are at the core of all CFD models. Reference [13] WAsP was based on the Jackson-Hurt model, which is a linearized model of the Navier–Stokes equations. When compared to the Jackson–Hunt model, CFD solves more full forms of RANS equations without linearization and makes assumptions such as minimal perturbations, attached flow, and first-order closure. As a result, they can simulate nonlinear flow phenomena, including flow separation and recirculation, and are expected to perform better in difficult terrain. They also simulate topographical effects as a whole, as opposed to WAsP, which relies on discrete modules.
Castellani et al. [14] had fully considered the impact of vegetation, roughness, boundary pressure, and other factors on the surface on the simulation results. They studied two onshore wind farms in southern Italy through numerical methods and supervisory control and data acquisition (SCADA) technology and analyzed the interaction of complex topography and wake effects. But they did not involve too much in the assessment of wind resources in complex topographic areas. They are more focused on studying the wake characteristics of complex topography and the response of wind turbines. Dhunny et al. [15] verified wind resource evaluation indicators such as the average wind power predicted by the WindSim using nine wind measurement data from weather stations at multiple altitudes around complex topography. They carried out a thorough investigation, including grid correlation verification, the influence of calculation parameters such as the discretization scheme sequence, the turbulence model, and the iterative convergence criterion on the results.
The research results showed that the complex topography significantly affects the geographical distribution of local seasonal wind speed. In addition, the mountainous environment has a pronounced wind acceleration effect [16] and the foehn effect. It can be combined with the existing electrical infrastructure, which has potential wind energy utilization value. Therefore, Yang et al. [17] took Camarasa Dam as a research example and proposed a method to improve the evaluation of wind resources in complex topographical areas. It can quickly and preliminarily select candidate locations for installation based on the estimated wind density and determine whether hot wind effects occur. However, because this analysis method is based on the assumption of linear wind speed, the accuracy of some specific regions in the wind resource assessment process is low, and accurately describing the wind speed at these specific locations is impossible. To overcome these problems and improve the accuracy of wind resource evaluation, researchers have made efforts in different aspects, such as optimizing wind resource evaluation and wind turbine micro-site selection through an improved genetic algorithm (GA) [18], and optimizing the Meteodyn WT modeling Intra-domain conditions (such as boundary conditions such as forest density), using advanced turbulence models [19], etc.
The above studies on wind resource assessment are conducted based on the wind measurement data is accurate and representative. However, they seldom pay attention to whether the wind measurement data provided by anemometer towers have representativeness at or in wind farms. This is the prerequisite to ensure the accuracy of the assessment results of complex topography wind resources.
The representativeness of the wind anemometer tower is one of the important elements influencing the accuracy of wind resource assessment in wind farms, and wind resource assessment has a direct impact on wind power project investment decisions. The properties of wind resources in diverse terrain areas vary amongst wind farms, particularly those in complex terrain, and cannot be generalized. As a result,-determining where to place the wind anemometer tower so that it is fully representative of the wind farm is a critical pre-task for our subsequent wind resource evaluation.
This paper’s conclusion is based on the anemometer tower data from a specific area of the wind farm. In other areas, the Meteodyn WT software is used to simulate and evaluate wind resource conditions. We compared the simulation results with the actual measurement wind resource data. We analyzed the influence of the location and number of anemometer towers on complex topography wind resource assessment accuracy. In addition, we gave some suggestions for the site selection of anemometer towers according to the characteristics of complex topographical wind resources.
CFD simulates and analyzes fluid mechanics problems by solving mass conservation equations, momentum conservation equations, and other governing equations. Meteodyn WT, as a CFD tool based on a non-linear flow model [20,21], has become a standard tool for wind resource assessment of complex topography in the global wind power generation industry.
There are currently three major methods for using CFD to simulate turbulence models: direct numerical simulation (DNS), large eddy simulation (LES), and Reynolds averaged Navier-Stokes simulation (RANS) [22]. Meteodyn WT simulates the spatial wind flow field by solving the nonlinear Navier–Stokes momentum equation with the MIGAL solver under constrained boundary conditions, which implements a ‘coupled resolution’ that simultaneously updates the wind speed components and the pressure on the entire computational domain using an iterative linear equation solver. And Meteodyn WT selects a suitable turbulence model according to the assessed area flow characteristics [23–26]. The fluid is assumed to be stable, constant in temperature, and incompressible. The calculation methods are as follows.
Mass conservation equation [27]:
Momentum conservation equation [28]:
Single equation closed form of Reynolds stress tensor [29,30]:
where
In addition, Meteodyn WT will select an appropriate turbulence model and generate corresponding boundary conditions according to the specific needs around the flow field (such as whether there is forest, etc.). Then it calculates and solves the flow field [20].
2.2 Layout Principle of Anemometer Towers
The measured wind data provides essential support for the design of a wind farm. Wind measurement data can be used to determine the wind energy status in a certain area, which is used for wind turbine selection and deployment schemes [25]. The location of the wind anemometer tower has a greater impact on the estimation of the annual on-grid electricity of the wind farm, particularly in wind farms with complex topography [31].
The representativeness of each wind measurement point should be carefully and comprehensively considered before the establishment of the wind anemometer tower, and the following principles and steps should be referred to for its layout:
(1) The representativeness of the region should be fully reflected, and the area should be divided according to the surface type and topography conditions. The location of the wind anemometer tower should be able to reflect the average wind energy resource status of the region (as shown in Fig. 1). For different topography, select representative locations of corresponding types, such as flat topography, mountains, topography similar to the coastline, topography that is more consistent with the height and shape of the mountain, etc. The popularization of point data, furthermore, saves economic expenditure for observational projects too.
(2) The wind anemometer tower should be arranged in the wind farm at the location where the wind energy resources are expected to be the best (the top of the mountain, the “little head” as shown in Fig. 2) and the lower limit area where the wind energy resources can be used (low altitude, or under certain obscuration). In this way, we have a more comprehensive grasp of the overall situation of the wind farm. The location of the critical point setting of the wind anemometer tower is selected at the lowest height in the mountain where the wind turbine can be installed. It is also used to measure the offline position of the wind turbine arrangement.
(3) Most parts of China are monsoon climate areas with noticeable seasonal differences in wind direction. For mountainous areas, seasonal shielding is apparent. Windward hillsides in winter may become leeward slopes in summer. Therefore, it is necessary to set up wind anemometer towers on the monsoon leeward slopes that may have utility value to measure the seasonal difference between the windward and leeward winds.
(4) The places with good wind energy resources are mostly sparsely populated, difficult to reach, and remote areas with rugged construction. The site selection of wind anemometer towers must consider the operability of the project and ensure the integrity of the observation data. Make wind measurement activities have better maneuverability.
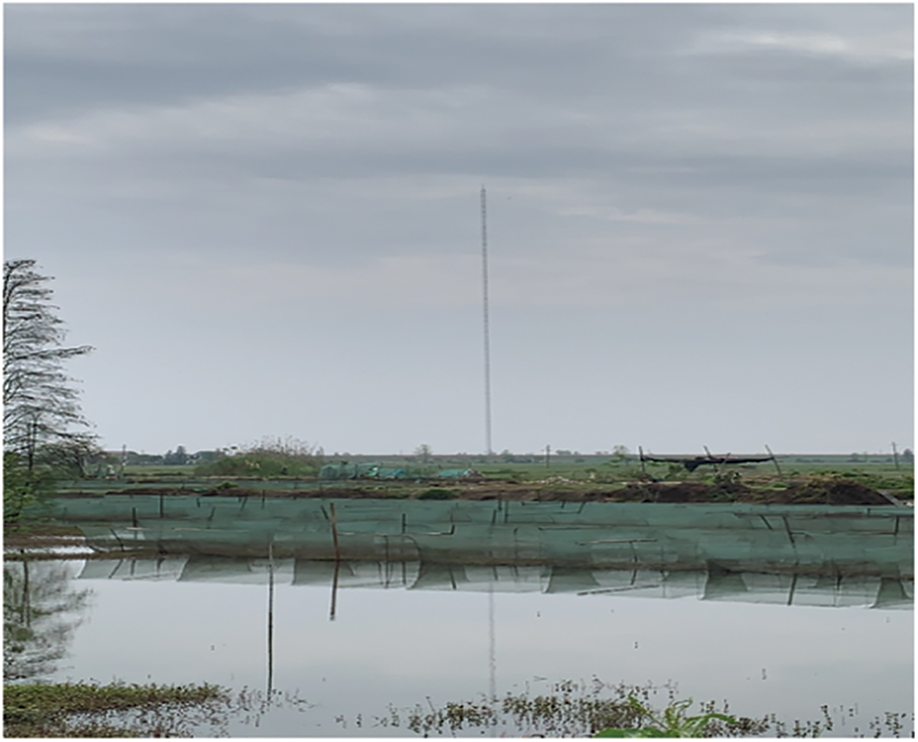
Figure 1: Anemometer tower on the plain topography
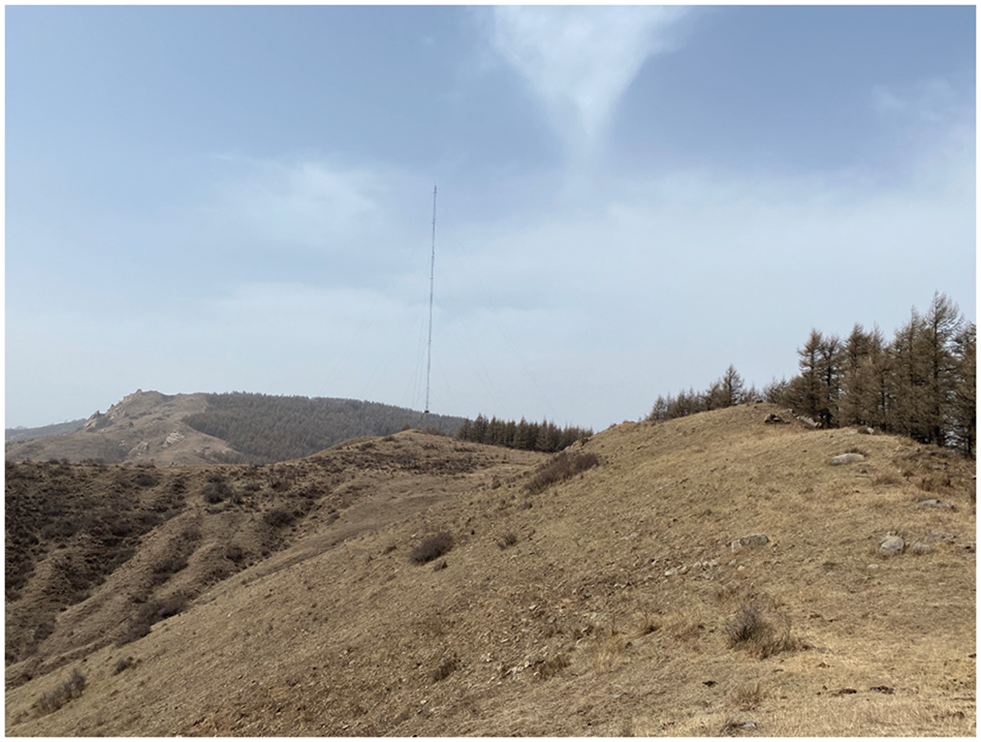
Figure 2: Anemometer tower on a complex topography
2.3 Layout Steps of Wind Anemometer Tower
The purpose of setting up a wind anemometer tower in a wind farm is to accurately reflect the resource situation in the proposed wind farm [32]. In the early stage of wind farm development, the site selection of the proposed wind turbine, wind energy resources, and economic evaluation of the wind farm all require data support from the wind anemometer tower. Therefore, accurately arranging the wind measuring building is related to the smooth progress of wind power development, especially in a complex topography environment. The location of wind anemometer towers has a significant impact on the wind resource assessment of wind farms [33]. The basic process of wind anemometer tower site selection is shown below.
According to SRTM, EDM topographic maps, and mesoscale wind data, the wind energy resource simulation of the entire wind farm is conducted through professional wind energy resource assessment software. Second, perform the preliminary layout of wind farm fan locations based on the simulated site wind resource map and the preliminarily planned installed capacity. Finally, the wind farm area is partitioned according to the wind farm’s preliminary wind farm site layout and the topography of the site area. Each subarea should have at least one wind anemometer tower. Furthermore, the layout of the wind anemometer tower should be combined with the characteristics of different topography (such as narrow-mouth acceleration topography, uplift topography, leeward topography, positive pressure topography), and fully consider factors such as altitude and slope under different topography. It should be noted that, in complex topography, segmented ridges should not be divided into the same subarea. It is because the topographic changes in the same area are small.
The vast majority of wind farms in Guangxi and Yunnan provinces of China are wind farms in complex topography. This paper selects a typical complex topography wind farm as a case in each of the two provinces. In addition, it analyzes the influence of the representativeness (position and number) of wind anemometer towers on the wind energy resource assessment of complex topography wind farms from the perspective of wind speed and different calculation and simulation schemes.
The design capacity of project A is 50 MW. As shown in Fig. 3, it composed the project site of a ridge, roughly in a northeast-southwest direction. Two wind anemometer towers are on the project, numbered 2939# and 1498#. The wind anemometer towers are based on the same period data, and the altitudes are 1922 and 1878 m, respectively, which are typically complex topography wind farm projects. The wind speed acceleration effect is prone to appear in the mountainous environment, increasing the wind turbine capacity coefficient and benefiting wind power development. The 2939# wind anemometer tower is located in the center of the field, but it is far from the wind turbine location in the south of the field, about 9.5 km. The wind anemometer tower is only representative of the location of the surrounding wind turbines, and it is less representative of the location of the distant wind turbines.
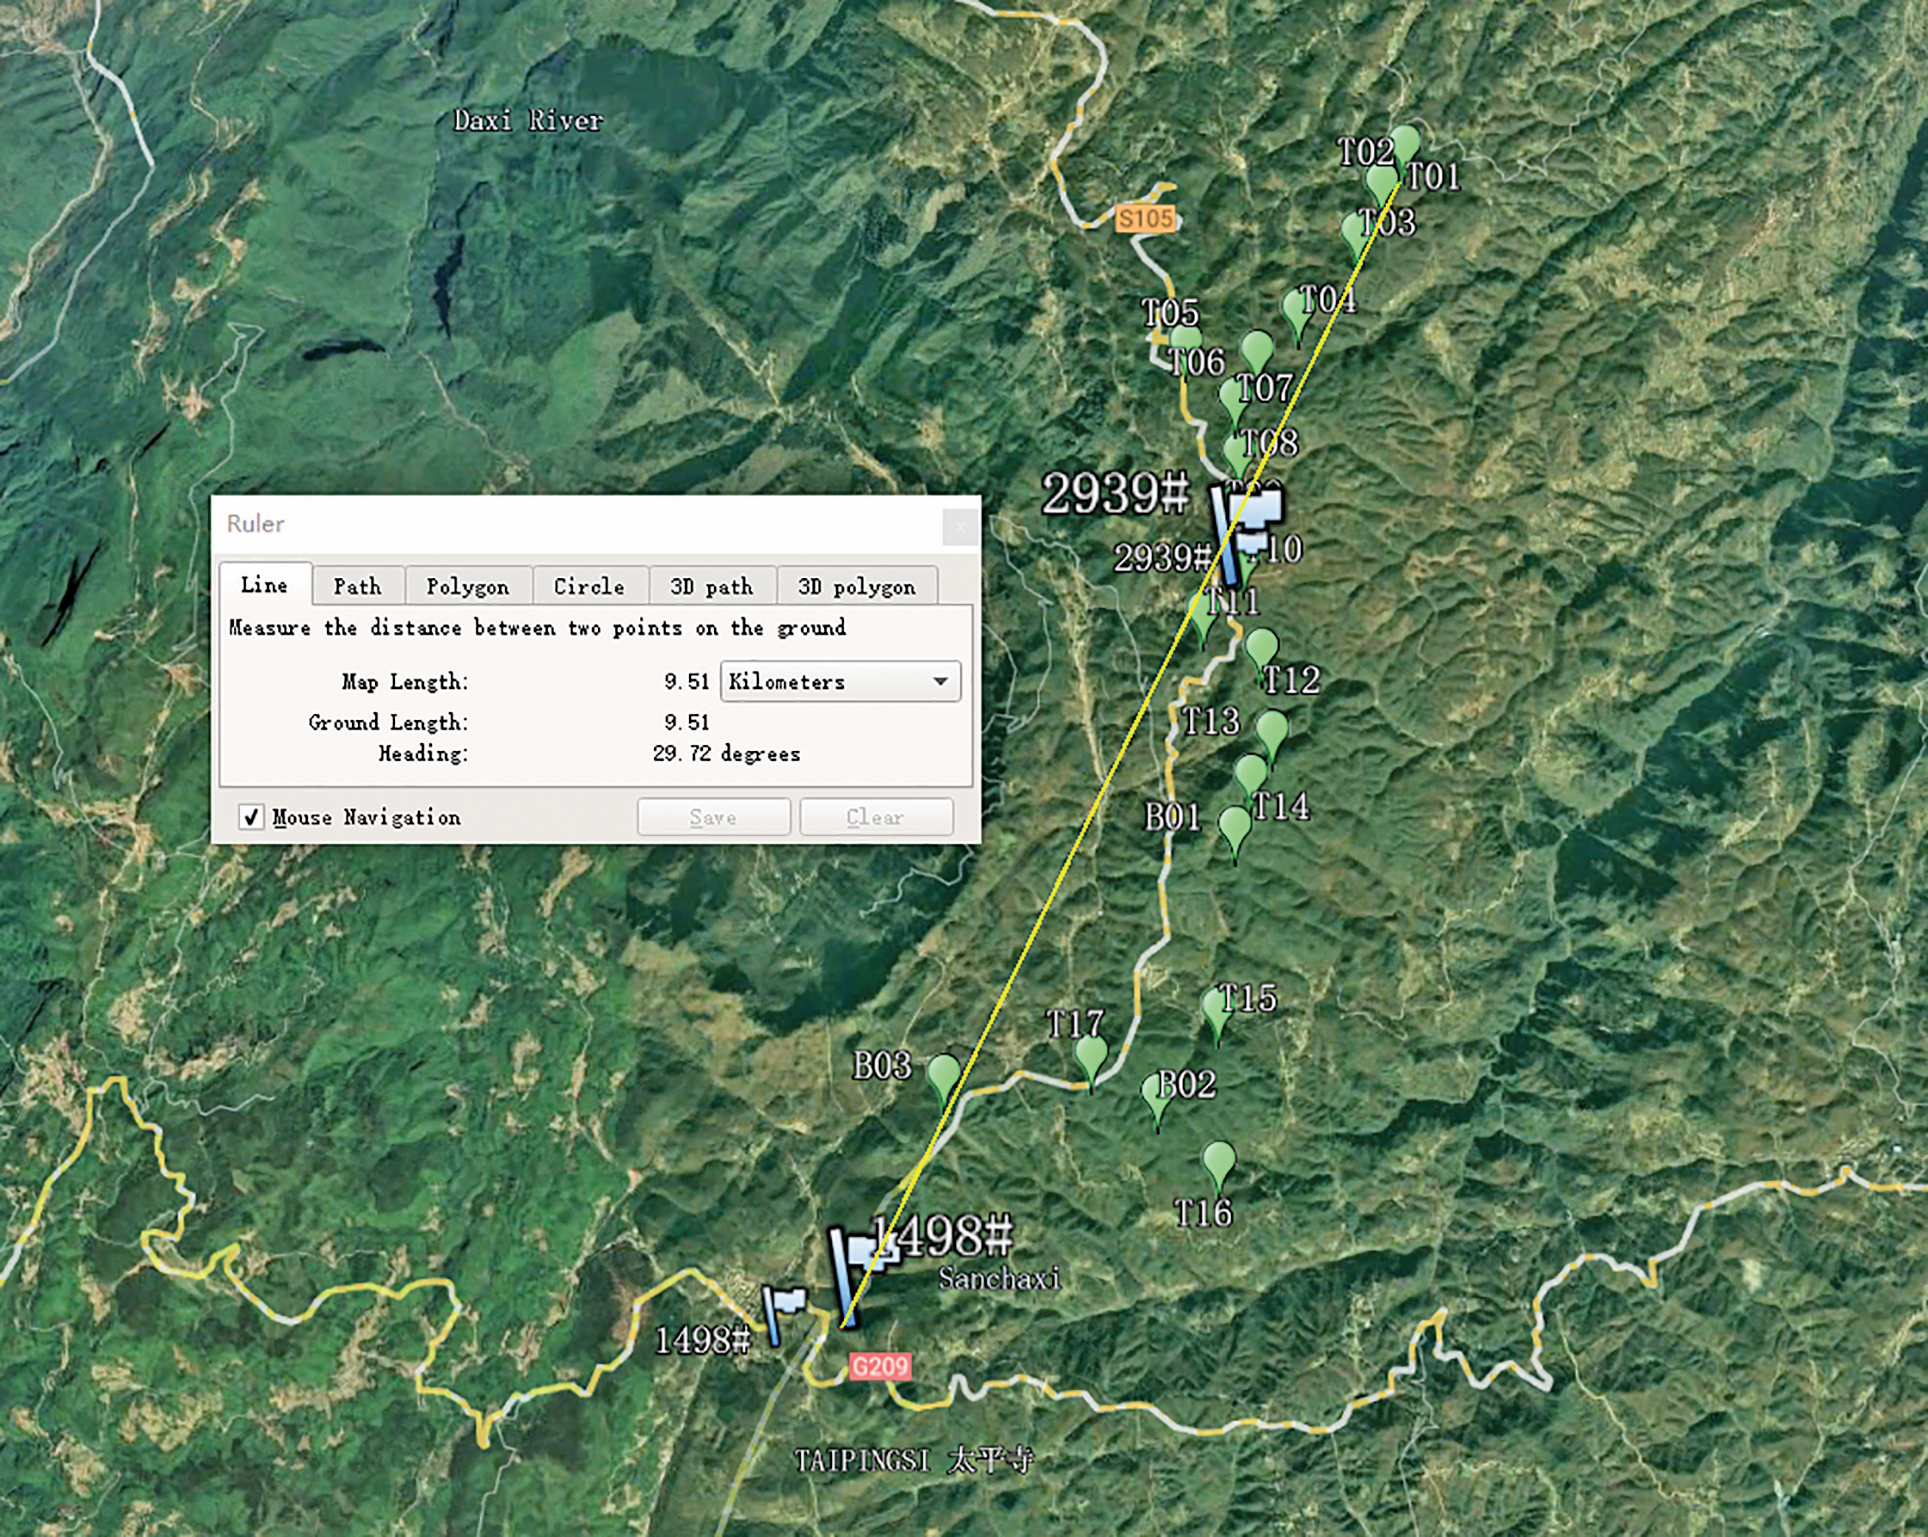
Figure 3: The location of wind turbines and anemometer towers in wind farm A
3.1.2 Wind Resource Assessment Plan and Results
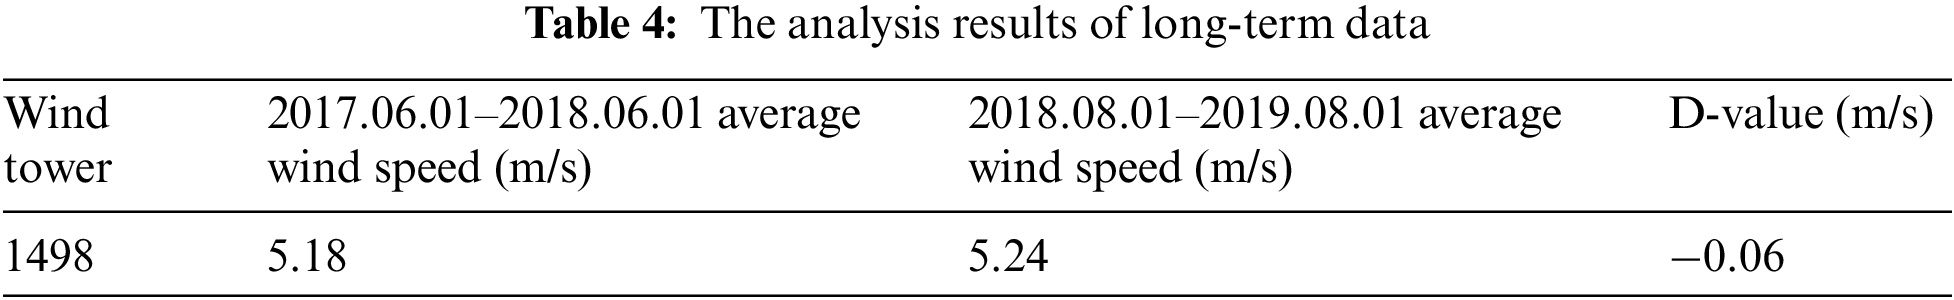
In this case, the complete annual data of 2939# wind anemometer towers from June 01, 2017, to May 31, 2018, is adopted. The Meteodyn WT software was used to simulate the wind speed at the position of the 1498# wind anemometer tower, and the comparison was made by comparing the measured data of the 1498# wind measuring tower over the same period. It is used to analyze the influence of the location and number of wind anemometer towers on wind resource assessment. Using Meteodyn WT to analyze the wind energy resources at the 1498# wind anemometer tower, the grid has a horizontal resolution of 25 m, a vertical resolution of 4 m, and the wind direction sector interval is 22.5°. WT6.0 calculates and analyzes the wind condition of each tower. The parameters of the WT model are shown in Table 1. The evaluation period is from June 01, 2017, to May 31, 2018. During the assessment period, the annual average wind speed at 100 m height of 2393# wind anemometer tower is 5.55 m/s. According to the input of Meteodyn WT software 2939# wind anemometer tower data 1:2000 measured topographic map and topography roughness data simulation, the wind speed at 100 m height at 1498# wind anemometer tower is 5.67 m/s. As shown in Table 2, compared with the measured wind speed of 5.39 m/s at 100 m height of 1498# wind anemometer tower in the same period, there is a big difference between the two results, which overestimated the wind speed simulation value and the forecast error reached 5.19%. The correlation between long-term data and measured data and the analysis results of wind direction distribution is shown in Fig. 4. In addition, Table 3 and Fig. 5 show the MERRA2 data for the past 30 years used in this analysis. In particular, the wind speed correlation coefficient between the MERRA2 data and the measured data is
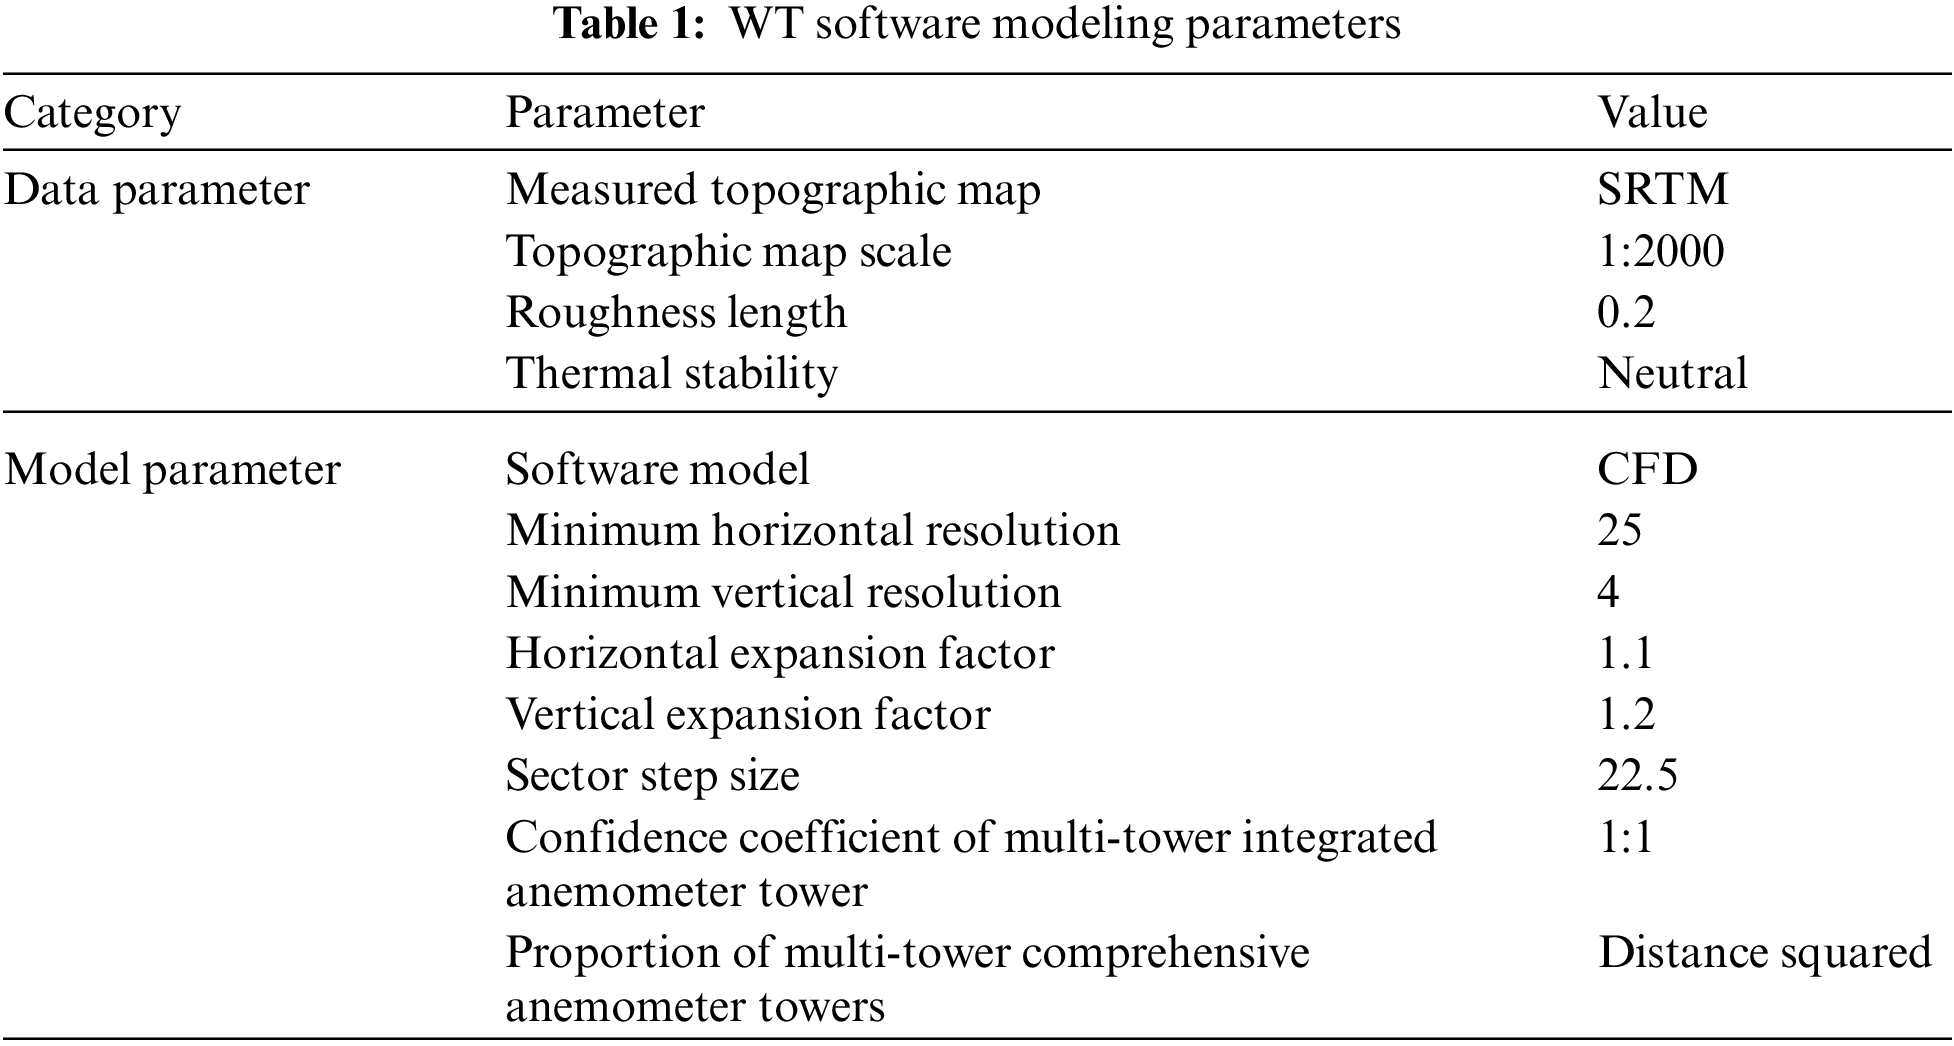
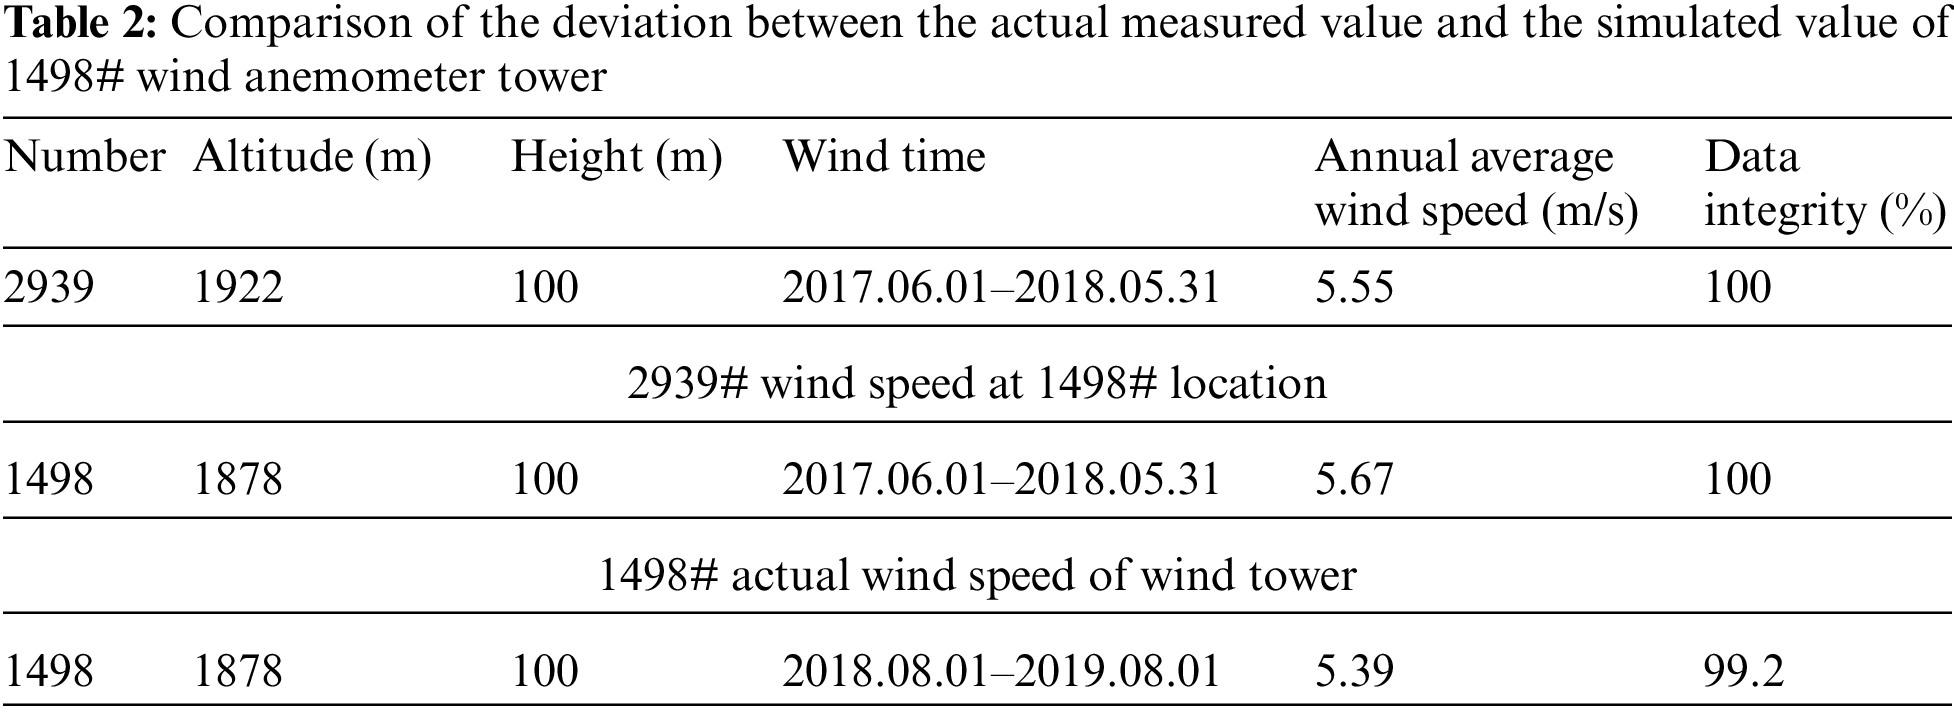
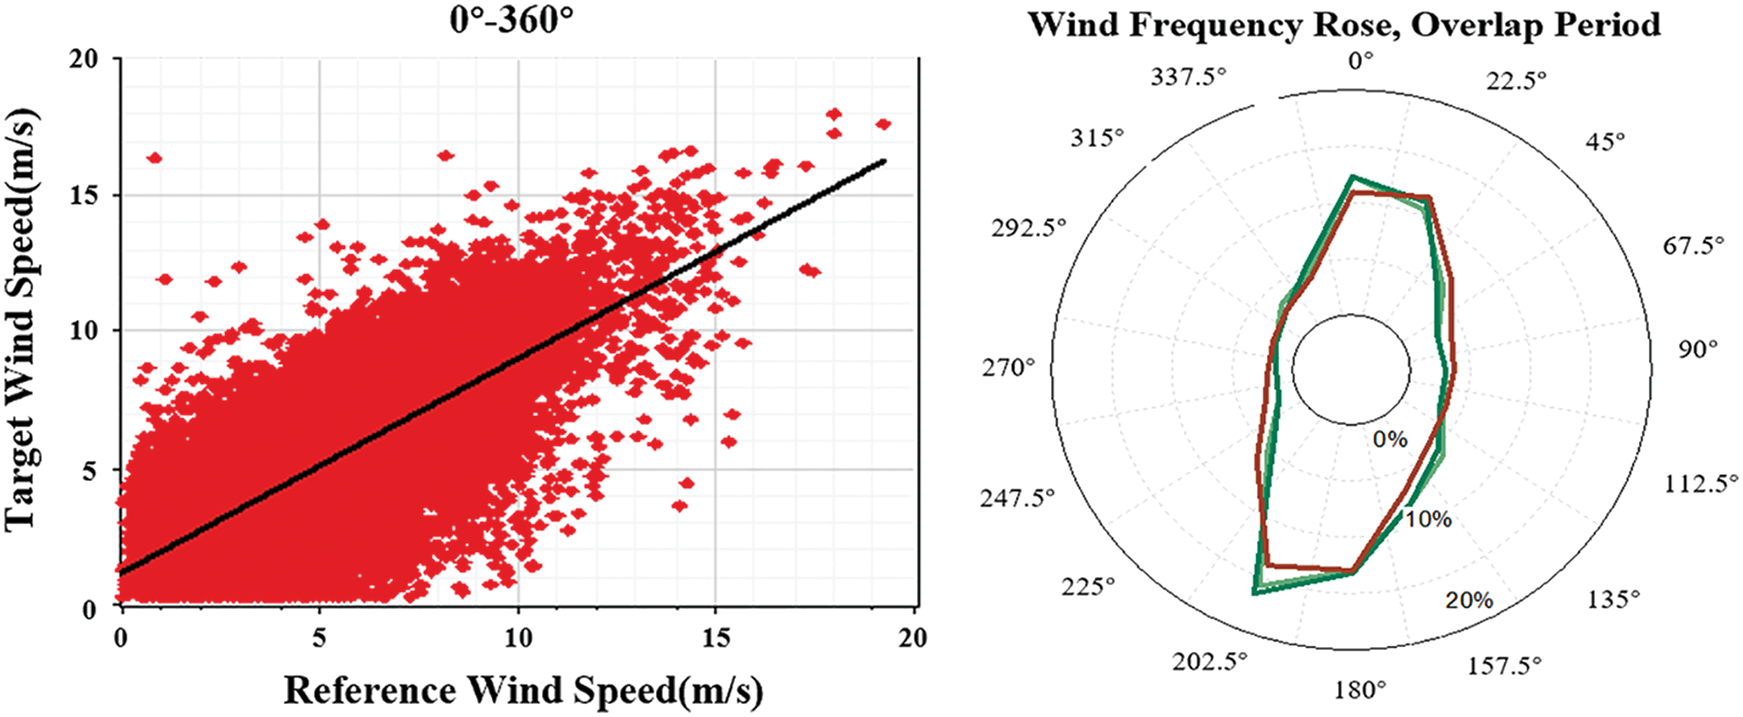
Figure 4: The correlation between long-term data and measured data and the analysis results of wind direction distribution

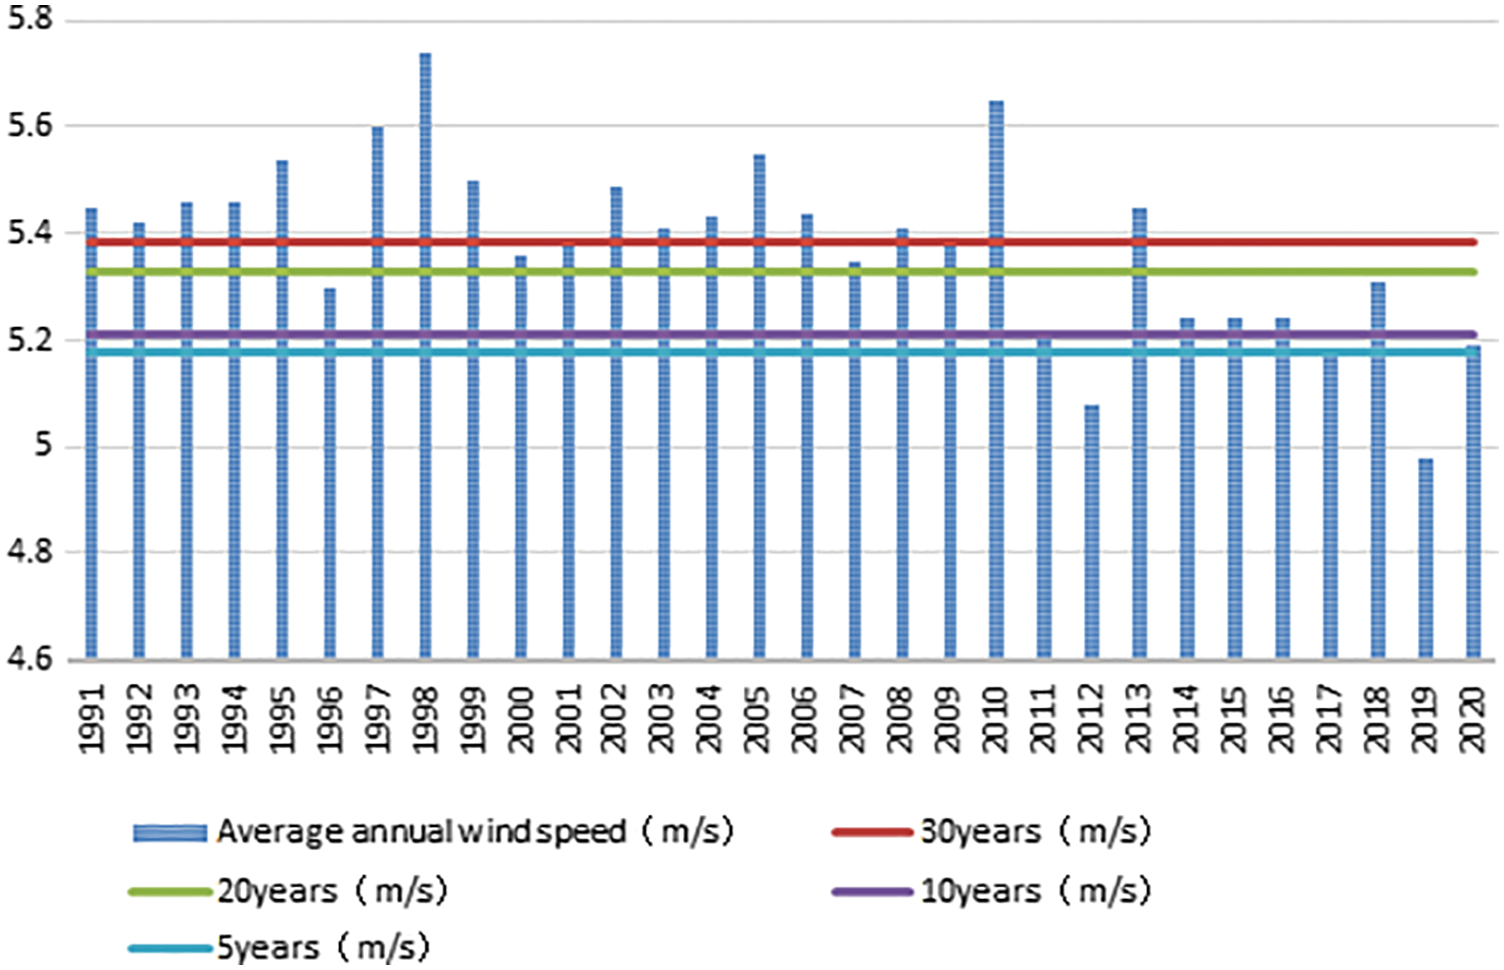
Figure 5: Wind speed distribution for long-term data
It can be seen that the complex topography wind farm is obviously affected by the topography, and the range that the wind anemometer tower can represent is minimal. Therefore, in determining the location of representative wind anemometer towers, it is necessary to partition different topography. This can more accurately clarify the distribution of wind energy resources in complex topography wind farms and improve the reliability of wind energy resource evaluation results.
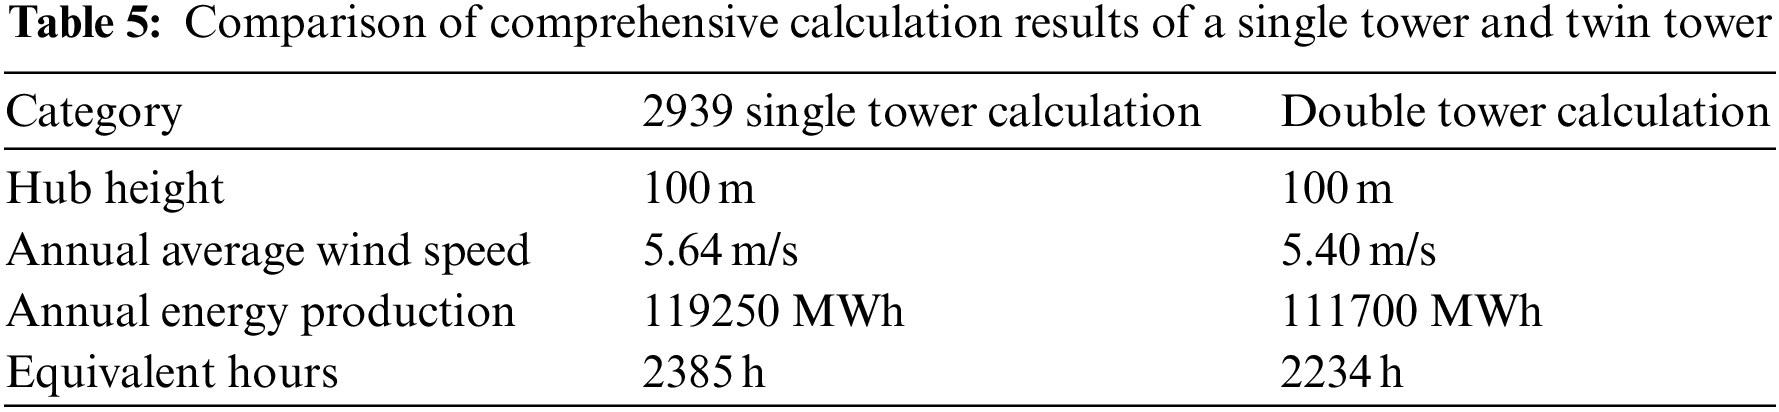
In addition, this case simulates the distribution of wind resources in the field through a single-tower and double-tower integrated calculation scheme. First, it uses the actual measurement data of a single wind tower to perform single tower calculations. Second, it performs multi-tower comprehensive calculations on the results of single tower calculations and simulates the distribution of wind energy resources in the field. Finally, according to the complete calculation results of the multi-tower, the wind turbines are micro-sited, and then the grid power generation is calculated. The results are shown in Table 5 Wind anemometer towers cannot accurately capture the wind characteristics of a wind farm in complex terrain, and encrypted measurement can improve the accuracy of wind resource assessment [34]. Therefore, Wind Farm A uses the comprehensive calculation result of the twin towers as the “accurate value” standard to calculate the relative errors of other schemes. The data shows that the relative error of the annual average wind speed calculated by a single tower (5.64 m/s) is 4.44%, which is 5.40 m/s compared to the yearly average wind speed calculated by the two towers. The relative error of the grid-connected power generation calculated by a single tower reached 6.76%. The annual average wind speed of 5.40 m/s in the calculation results of the twin towers can better represent the measured wind speed levels of the 2939# and 1498# wind measuring towers. And under the equivalent hours of 2234 h, the grid-connected power generation is expected to reach 111,700 MWh. Therefore, a sufficient number of representative wind anemometer towers should be set up as much as possible within the allowable range of the wind anemometer tower construction cost. This can meet the needs of the multi-tower calculation scheme while also making the wind resource assessment result closer to the true value.
Wind farm B is located in the northern mountainous area of Shiping County, Honghe Hani, and Yi Autonomous Prefecture, Yunnan. The center of the site is about 30 km away from Shiping County as a straight line. The project area is mountainous, and the topography is relatively complex. The overall elevation of the site is between 2157–2535 m, with high mountains and dense forests. As shown in Fig. 6, in this wind farm area, the resource side has set up two wind anemometer towers (7337#, 2097#) in the wind acceleration zone. Since the wind speeds at the two wind anemometer towers are relatively high, the wind energy resources for simulating the whole site with the above two wind anemometer towers are relatively abundant.
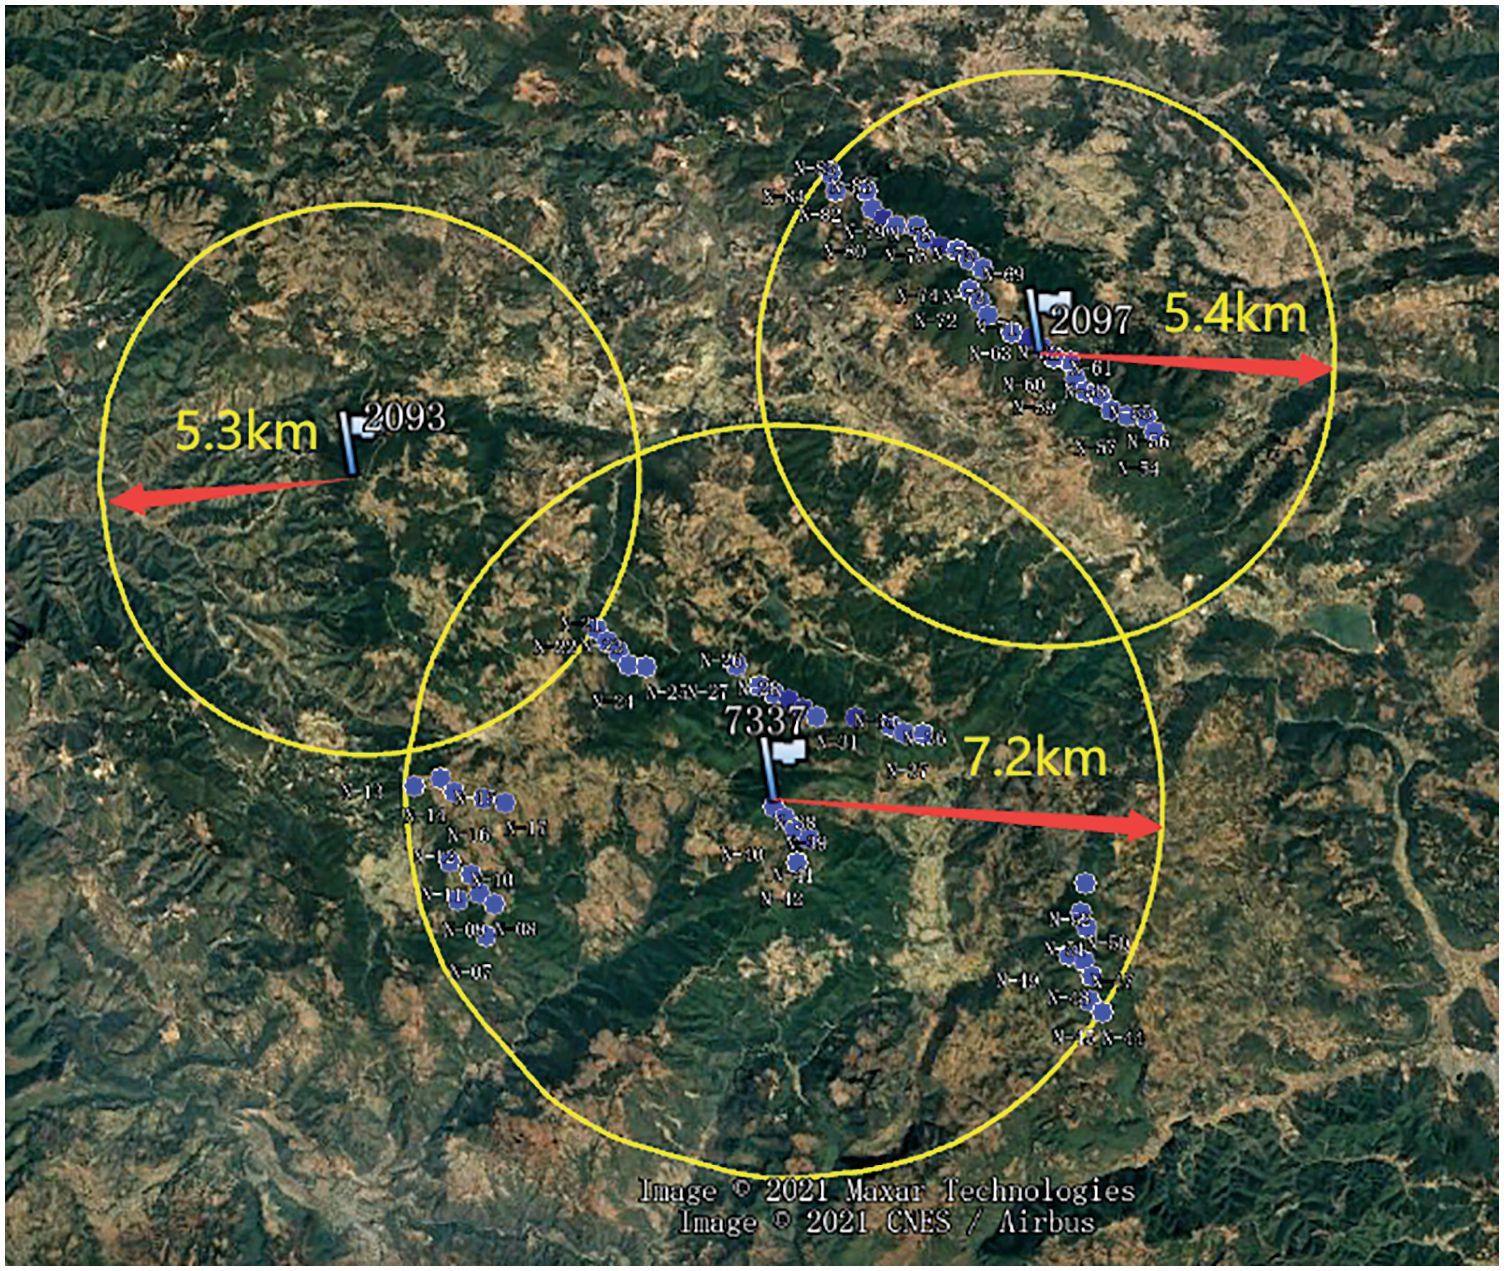
Figure 6: The scope of the wind farm B and the distribution of anemometer towers
3.2.2 Wind Resource Assessment Plan and Results
We analysis wind farm B using the same analysis method of wind farm A above. The correlation between long-term data and measured data, and also the analysis results of wind direction distribution, is shown in Fig. 7. In addition, Table 6 and Fig. 8 show the MERRA2 data used in this analysis for the past 30 years. Between the MERRA2 data and the measured data, the wind speed correlation coefficient is
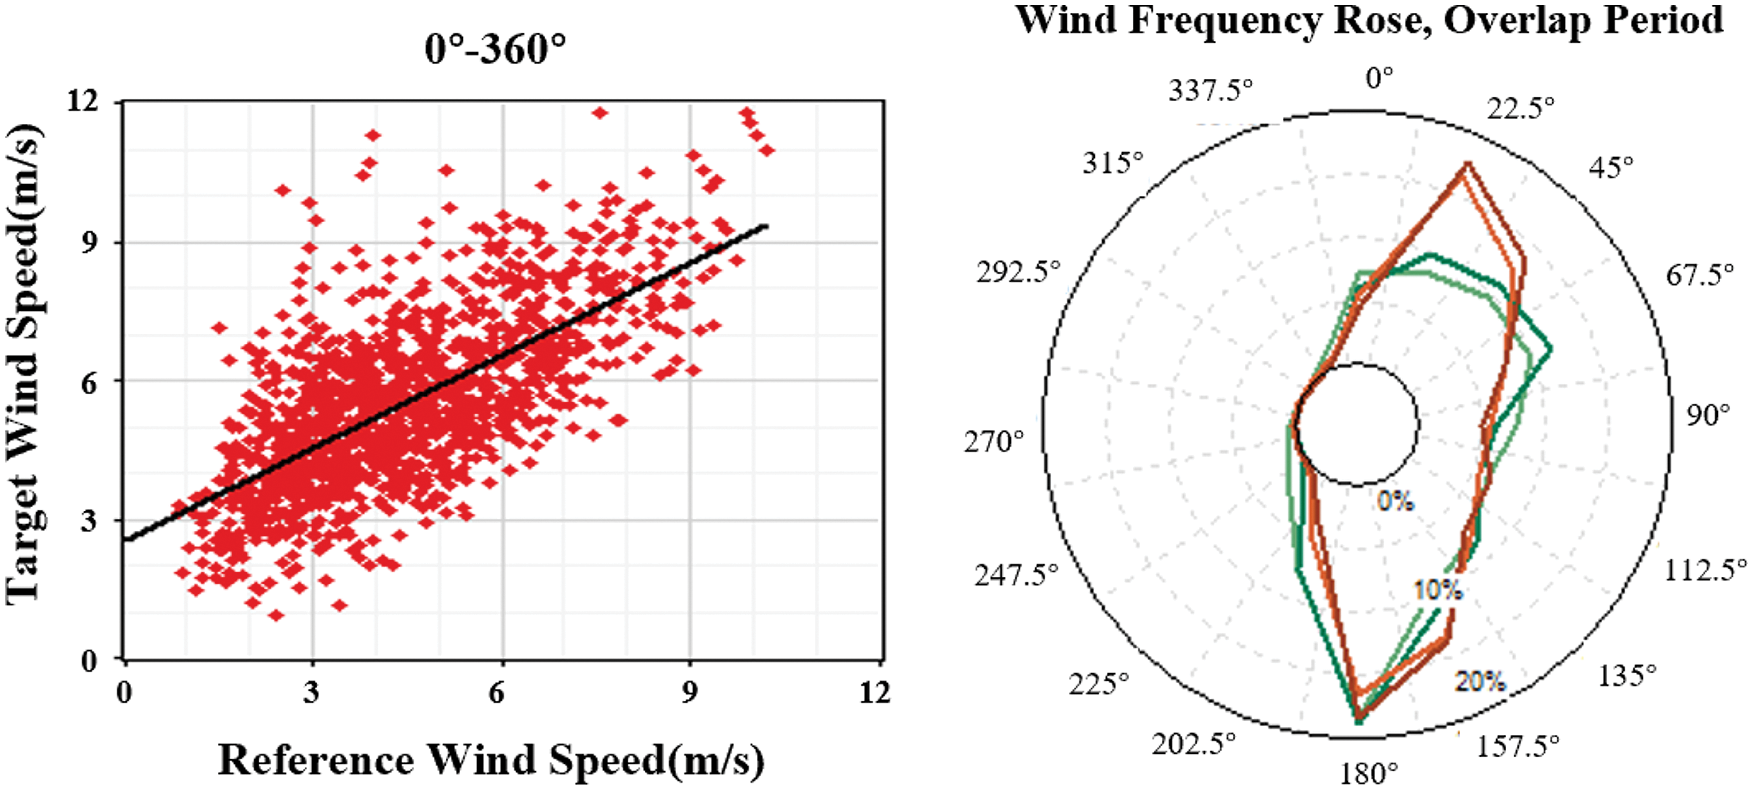
Figure 7: The correlation between long-term data and measured data and the analysis results of wind direction distribution
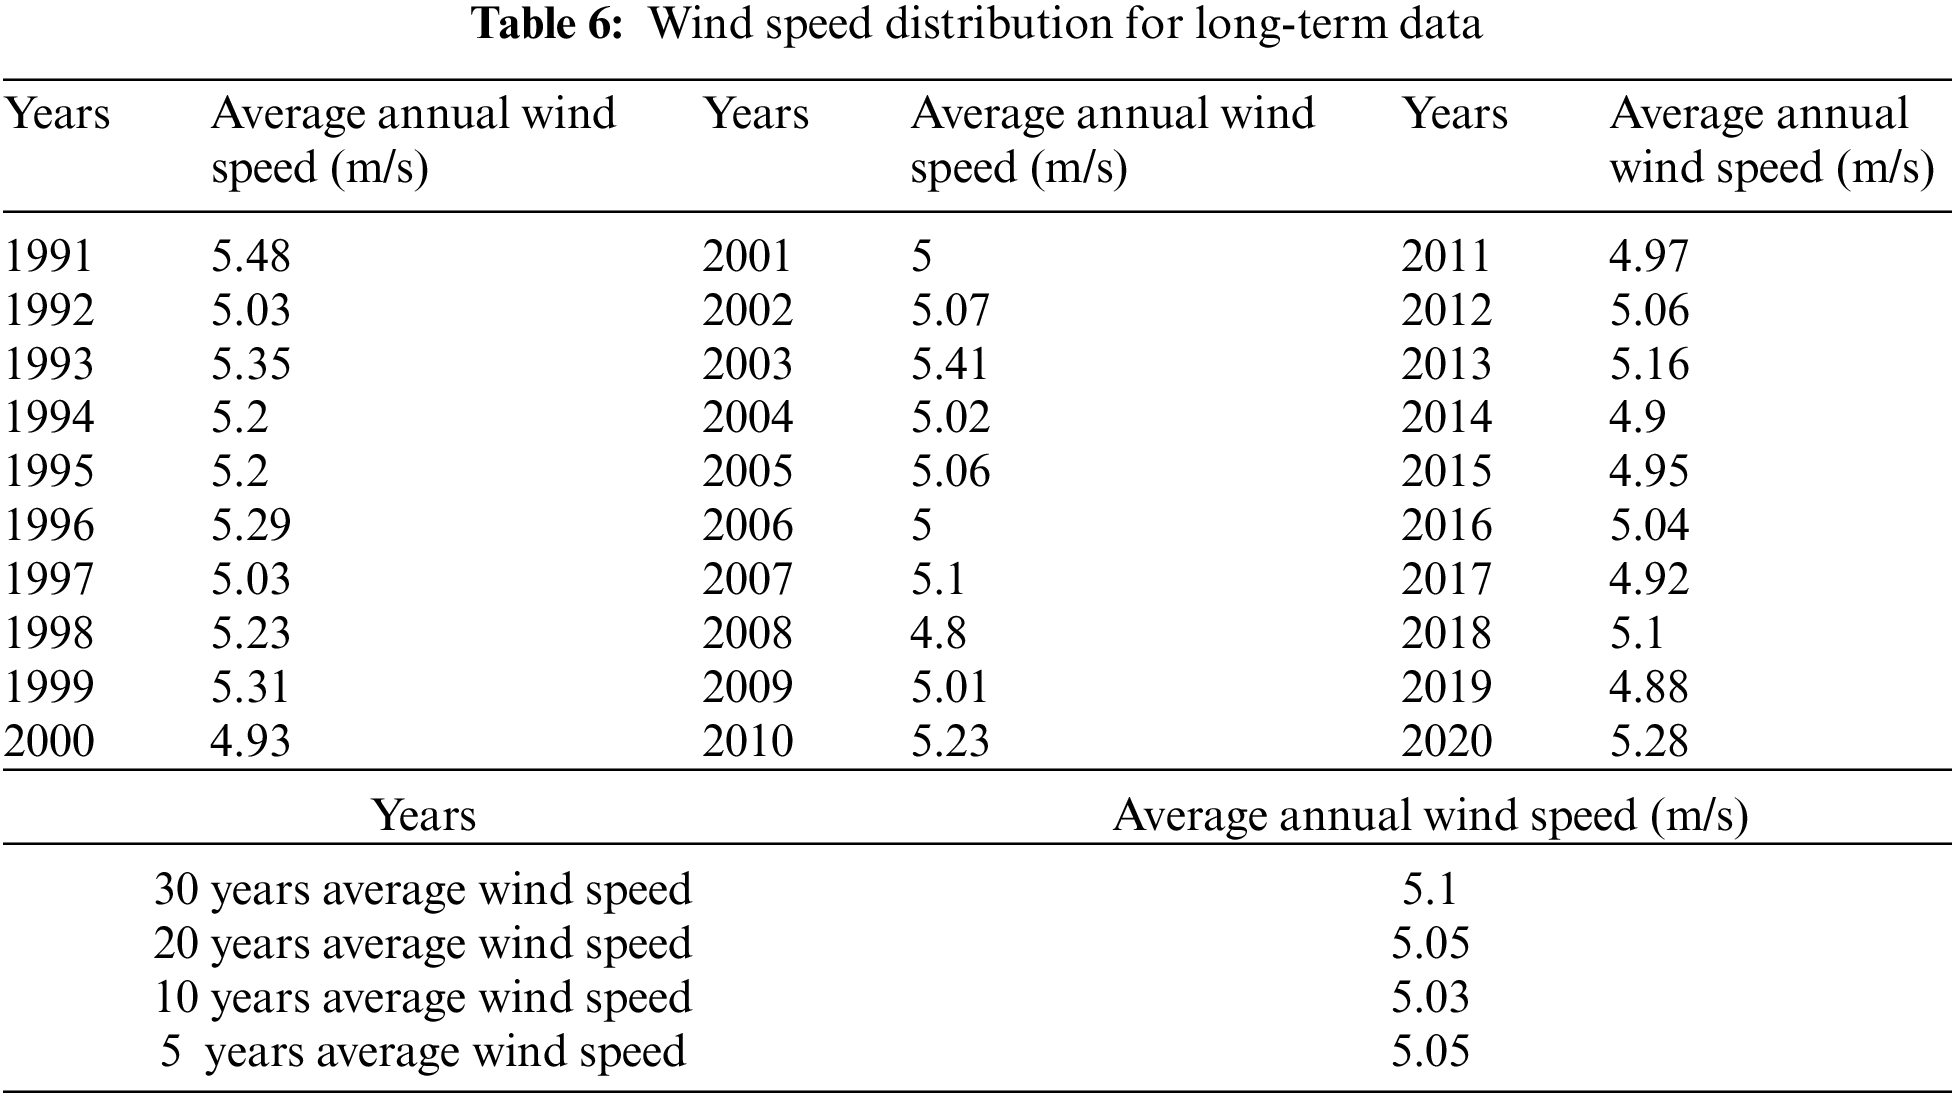
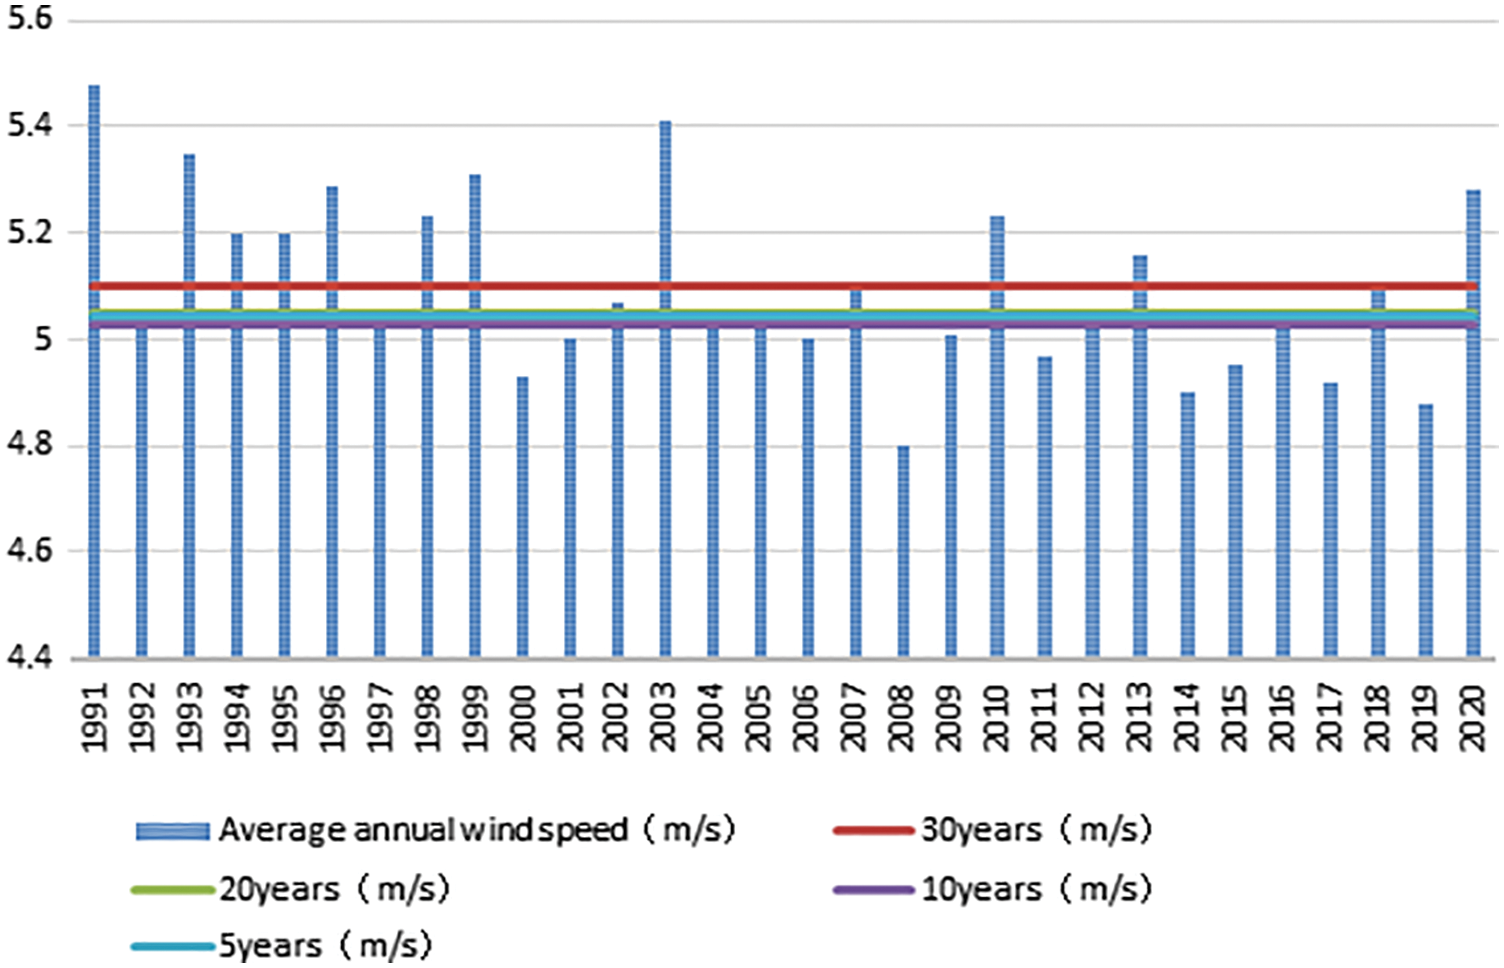
Figure 8: Wind speed distribution for long-term data
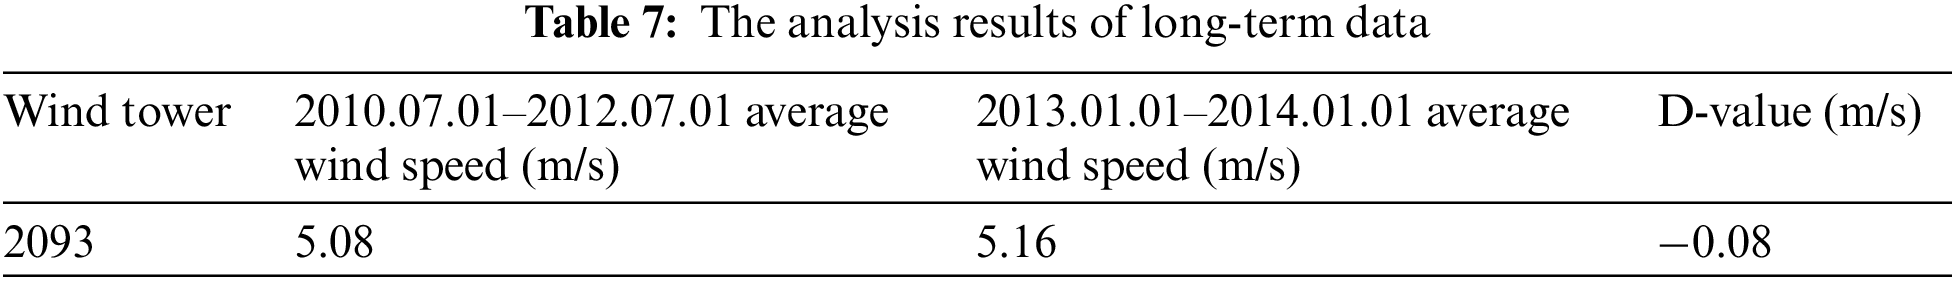
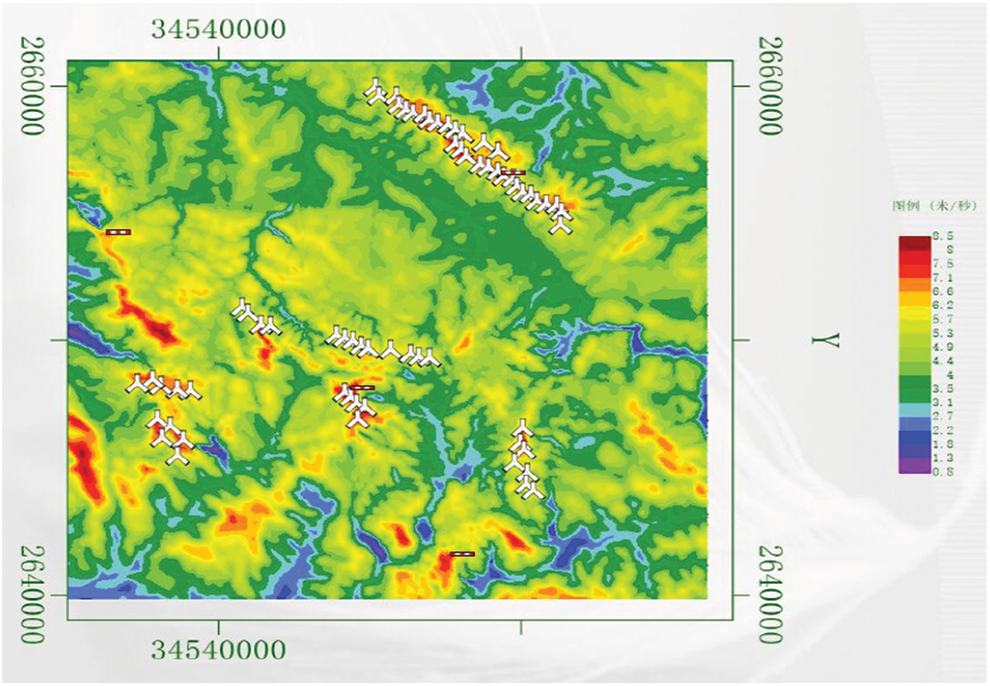
Figure 9: The wind resource at 2093# anemometer tower in Meteodyn WT
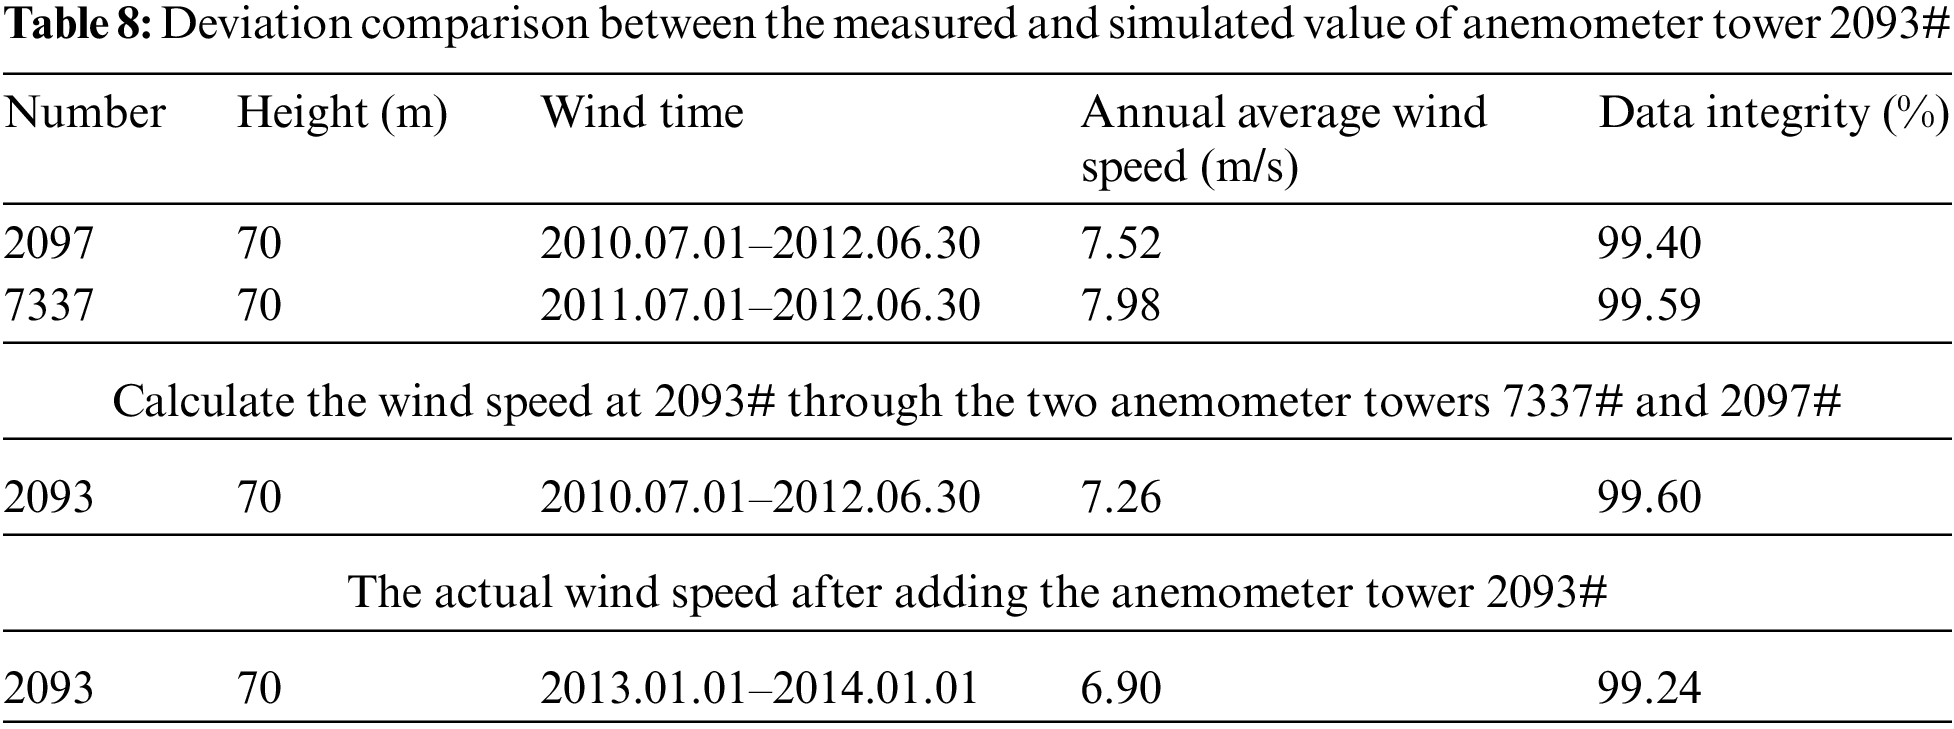
Afterward, a wind energy resource review was conducted based on the data of the three wind anemometer towers on the site. After the review, it was found that the wind energy resource distribution of the wind farm was very different from the evaluation results of the two wind anemometer towers. The wind energy resource assessment result is basically unreliable when the 7333# wind anemometer tower is 5 km away. It can be seen that wind anemometer towers in particular topography areas cannot be used as representative wind anemometer towers for wind energy resource assessment of the entire wind farm.
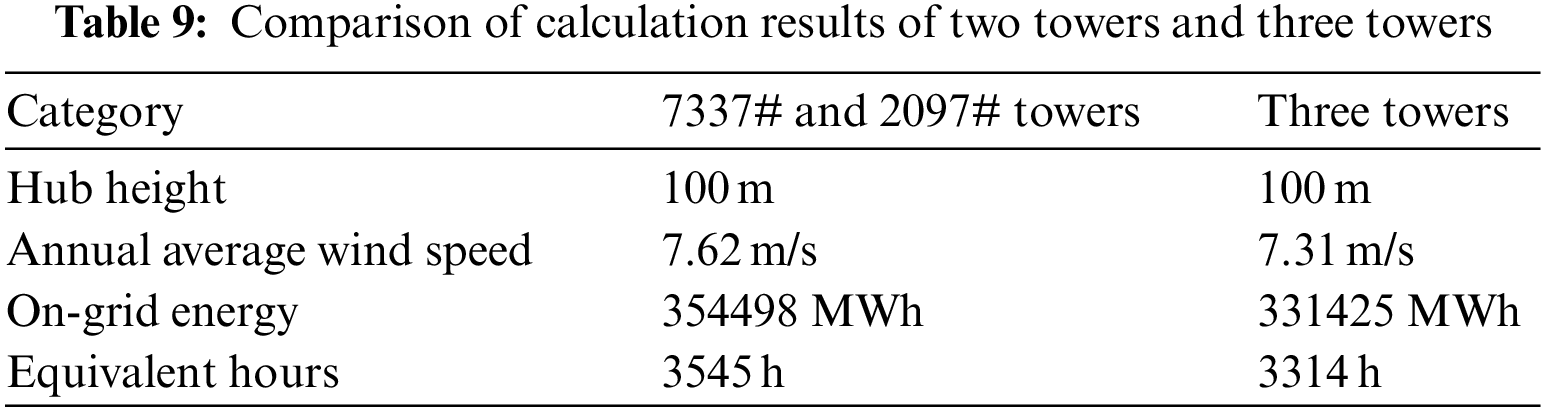
Table 9 shows the simulation results of wind resources in the field by the comprehensive calculation scheme of two towers and three towers. Similarly, in wind farm B, the calculation results of the three towers are used as the “accurate value” standard to calculate the relative errors of other schemes. The annual average wind speed calculated by the 7337#, 2097#, and 2093# three towers is 7.31 m/s, and the grid power can reach 331425 MWh under the equivalent hours of 3314 h. The annual average wind speed calculated by the 7337# and 2097# twin towers is 7.62 m/s, and the on-grid power can reach 354498 MWh under the equivalent hours of 3545 h. The relative error of the average annual wind speed is 4.24%, and the relative error of the grid-connected power generation has reached 6.96%. It can be seen that the number of wind anemometer towers has a significant influence on the accuracy of wind resource assessment, especially in the evaluation of on-grid power generation.
Wind resource assessment is a method to determine the regional wind resource reserves. It can be used as a basis for selecting a wind farm location, wind turbines, arrangement scheme and wind farm investment planning. Wind farms located on complex topography have the advantages of wind acceleration and the foehn effect. This paper took two typical complex topography wind farms in Guangxi, Yunnan province in China, as calculation examples. We compared the wind resources obtained by the simulation with the measured data during the same situation. The calculation results showed that the accuracy of wind resource assessment is greatly affected by the location and number of anemometer towers.
(1) The complex topography has a significant impact on wind resource distribution. The evaluation results of the wind resource at 5 km away from anemometer towers are not referential. And the prediction result error is more than 5%.
(2) Anemometer towers in unique topography (such as narrow pipe topography, windward slope, leeward slope, platform, saddle, etc.) cannot reflect the situation of wind resources in other regions.
(3) The number of representative anemometer towers significantly influences the wind resource assessment results. Compared with the two-tower calculation results, the single-tower relative error of the annual average wind speed (5.64 m/s) is 4.44%, and the grid-connected power generation reaches 6.76% in case A. Compared with the three-tower calculation results, the two-tower relative error of the annual average wind speed is 4.24%, and the grid-connected power generation reaches 6.96% in case B.
Even a minor error in the wind resource assessment indicator will have a larger influence on economic indicators for wind farms with complex topography. As a result, it is even more important to thoroughly analyze the representativeness of the wind anemometer tower and conduct a refined assessment of wind resources. According to the wind farm topographic conditions, arranging representative anemometer towers on wind farms is an effective measure to increase the accuracy of wind resource assessment. At the same time, it is necessary to use a multi-tower calculation scheme on the wind resource simulation in the estimated area to make the results more authentic. It has a significant impact on the wind resources utilization rate, economic benefits and investment costs of wind farms.
Acknowledgement: We would like to thank all those who have reviewed and contributed to this paper for their valuable assistance.
Funding Statement: The authors are grateful for the financial support by the National Natural Science Foundation of China (No. 52176212).
Conflicts of Interest: The authors declare that they have no conflicts of interest to report regarding the present study.
References
1. Kumar, Y., Ringenberg, J., Depuru, S. S. (2016). Wind energy: Trends and enabling technologies. Renewable & Sustainable Energy Reviews, 53, 209–224. DOI 10.1016/j.rser.2015.07.200. [Google Scholar] [CrossRef]
2. He, Z., Drozdov, D., Wang, J. (2020). Competitiveness of the wind power industry in China: An analysis based on the extended diamond model. Journal of Renewable and Sustainable Energy, 12(5), 052701. DOI 10.1063/5.0012007. [Google Scholar] [CrossRef]
3. Zhang, S., Wei, J., Chen, X. (2020). China in global wind power development: Role, status and impact. Renewable & Sustainable Energy Reviews, 127, 109881. DOI 10.1016/j.rser.2020.109881. [Google Scholar] [CrossRef]
4. Li, Q. A., Maeda, T., Kamada, Y. (2017). Experimental investigation of flow over two-dimensional multiple hill models. Science of the Total Environment, 609, 1075–1084. DOI 10.1016/j.scitotenv.2017.07.259. [Google Scholar] [CrossRef]
5. Dai, J., Tan, Y., Shen, X. (2019). Investigation of energy output in mountain wind farm using multiple-units SCADA data. Applied Energy, 239, 225–238. DOI 10.1016/j.apenergy.2019.01.207. [Google Scholar] [CrossRef]
6. Dai, J., Tan, Y., Yang, W. (2017). Investigation of wind resource characteristics in mountain wind farm using multiple-unit SCADA data in Chenzhou: A case study. Energy Conversion and Management, 148, 378–393. DOI 10.1016/j.enconman.2017.05.075. [Google Scholar] [CrossRef]
7. Jung, C., Schindler, D. (2019). The role of air density in wind energy assessment--A case study from Germany. Energy, 171, 385–392. DOI 10.1016/j.energy.2019.01.041. [Google Scholar] [CrossRef]
8. Gualtieri, G. (2018). Surface turbulence intensity as a predictor of extrapolated wind resource to the turbine hub height: Method’s test at a mountain site. Renewable Energy, 120, 457–467. DOI 10.1016/j.renene.2018.01.001. [Google Scholar] [CrossRef]
9. Zhang, J., Zhang, M., Li, Y. (2020). Analysis of wind characteristics and wind energy potential in complex mountainous region in southwest China. Journal of Cleaner Production, 274, 123036. DOI 10.1016/j.jclepro.2020.123036. [Google Scholar] [CrossRef]
10. Ambrosini, G., Benato, B., Garavaso, C. (1992). Wind energy potential in Emilia Romagna, Italy. Journal of Wind Engineering and Industrial Aerodynamics, 39(1–3), 211–220. DOI 10.1016/0167-6105(92)90547-N. [Google Scholar] [CrossRef]
11. Tagle, F., Genton, M. G., Yip, A. (2020). A high-resolution bilevel skew-t stochastic generator for assessing Saudi Arabia’s wind energy resources. Environmetrics, 31(7), e2628. [Google Scholar]
12. Zhang, M., Zhang, J., Li, Y. (2020). Multi-site measurement for energy application of small distributed wind farm in complex mountainous areas. Energy Reports, 6, 1043–1056. DOI 10.1016/j.egyr.2020.04.019. [Google Scholar] [CrossRef]
13. Jackson, P. S., Hunt, J. C. R. (1975). Turbulent wind flow over low hill. Quarterly Journal of the Royal Meteorological Society, 101, 929–955. DOI 10.1002/(ISSN)1477-870X. [Google Scholar] [CrossRef]
14. Castellani, F., Astolfi, D., Burlando, M. (2015). Numerical modelling for wind farm operational assessment in complex terrain. Journal of Wind Engineering and Industrial Aerodynamics, 147, 320–329. DOI 10.1016/j.jweia.2015.07.016. [Google Scholar] [CrossRef]
15. Dhunny, A. Z., Lollchund, M. R., Rughooputh, S. D. D. V. (2017). Wind energy evaluation for a highly complex terrain using computational fluid dynamics (CFD). Renewable Energy, 101, 1–9. DOI 10.1016/j.renene.2016.08.032. [Google Scholar] [CrossRef]
16. Xydis, G. (2016). A wind resource assessment around large mountain masses: The speed-up effect. International Journal of Green Energy, 13(6), 616–623. DOI 10.1080/15435075.2014.993763. [Google Scholar] [CrossRef]
17. Yang, L., Rojas, J. I., Montlaur, A. (2020). Advanced methodology for wind resource assessment near hydroelectric dams in complex mountainous areas. Energy, 190, 116487. DOI 10.1016/j.energy.2019.116487. [Google Scholar] [CrossRef]
18. Hu, W., Yang, Q., Zhang, J., Hu, J. (2020). Coupled on-site measurement/CFD based approach for wind resource assessment and wind farm micro-siting over complex terrain. IOP Conference Series: Earth and Environmental Science, vol. 455, no. 1, 012037. Nanchang, China, IOP Publishing. [Google Scholar]
19. Roy, L., Macphee, D. (2018). Meso-scale CFD simulation for wind resources: A case study of complex mountainous terrain. Energies, 11(6), 1366. DOI 10.3390/en11061366. [Google Scholar] [CrossRef]
20. Ayala, M., Maldonado, J., Paccha, E., Riba, C. (2017). Wind power resource assessment in complex terrain: Villonaco case-study using computational fluid dynamics analysis. Energy Procedia, 107, 41–48. DOI 10.1016/j.egypro.2016.12.127. [Google Scholar] [CrossRef]
21. Zhang, Y., Zhang, H., Ou, H. (2015). Application of SRTM data in wind resource assessment of mountainous wind farms. Electric Power, 48(3), 122–126. [Google Scholar]
22. Zhang, Z., Zhao, N., Zhong, W. (2013). Progresses in application of computational fluid dynamics to large scale wind turbine aerodynamics. Applied Mathematics and Mechanics, 34(10), 1048–1058. [Google Scholar]
23. Yan, B. W., Li, Q. S. (2016). Coupled on-site measurement/CFD based approach for high-resolution wind resource assessment over complex terrains. Energy Conversion and Management, 117, 351–366. DOI 10.1016/j.enconman.2016.02.076. [Google Scholar] [CrossRef]
24. Zhang, S., Hu, F. (2017). Application of GlobeLand30 land cover product in refined wind energy resource assessment. Resources Science, 39(1), 125–135. [Google Scholar]
25. Petersen, E. L., Troen, I., Jorgensen, H. E. (2013). Are local wind power resources well estimated? Environmental Research Letters, 8(1), 011005. DOI 10.1088/1748-9326/8/1/011005. [Google Scholar] [CrossRef]
26. Ha, T., Lee, I. B., Hong, S. W. (2019). CFD assisted method for locating and processing data from wind monitoring systems in forested mountainous regions. Biosystems Engineering, 187, 21–38. DOI 10.1016/j.biosystemseng.2019.08.012. [Google Scholar] [CrossRef]
27. Li, L., Chan, P. W., Zhang, L. (2013). Numerical simulation of a lee wave case over three-dimensional mountainous terrain under strong wind condition. Advances in Meteorology, 2013, 304321. DOI 10.1155/2013/304321. [Google Scholar] [CrossRef]
28. An, K., Wong, S. M., Fung, J. C. H. (2020). Revisit of prevailing practice guidelines and investigation of topographical treatment techniques in CFD-based air ventilation assessments. Building and Environment, 169, 106580. DOI 10.1016/j.buildenv.2019.106580. [Google Scholar] [CrossRef]
29. Thordal, M. S., Bennetsen, J. C., Capra, S. (2020). Engineering approach for a CFD inflow condition using the precursor database method. Journal of Wind Engineering and Industrial Aerodynamics, 117, 104210. DOI 10.1016/j.jweia.2020.104210. [Google Scholar] [CrossRef]
30. Ying, Y., Shen, X., Jiang, T. (2021). Research on wind resource assessment method based on the coupled mesoscale-microscale framework. Renesable Energy Resources, 39(2), 195–200. [Google Scholar]
31. Feng, B. C., Xing, Z. Q. (2009). Comments on key issues of wind resource assessment. Water Resources and Hydropower Engineering, 40(9), 46–49. [Google Scholar]
32. Orlando, S., Bale, A., Johnson, D. A. (2011). Experimental study of the effect of tower shadow on anemometer readings. Journal of Wind Engineering and Industrial Aerodynamics, 99(1), 1–6. DOI 10.1016/j.jweia.2010.10.002. [Google Scholar] [CrossRef]
33. Lubitz, W. D., Michalak, A. (2018). Experimental and theoretical investigation of tower shadow impacts on anemometer measurements. Journal of Wind Engineering and Industrial Aerodynamics, 176, 112–119. DOI 10.1016/j.jweia.2018.03.012. [Google Scholar] [CrossRef]
34. Brower, M. (2012). Wind resource assessment: A practical guide to developing a wind project. NY: John Wiley & Sons. [Google Scholar]
Cite This Article
 Copyright © 2023 The Author(s). Published by Tech Science Press.
This work is licensed under a Creative Commons Attribution 4.0 International License , which permits unrestricted use, distribution, and reproduction in any medium, provided the original work is properly cited.
 Downloads
 Citation Tools