
 Submit a Paper
 Propose a Special lssue
 Open Access
ARTICLE
Two-Stage Low-Carbon Economic Dispatch of Integrated Demand Response-Enabled Integrated Energy System with Ladder-Type Carbon Trading
1 State Grid Shandong Electric Power Company, Jinan, 250000, China
2 State Grid Shandong Electric Power Company Economic and Technical Research Institute, Jinan, 250000, China
3 State Nuclear Electric Power Planning Design & Research Institute Co., Ltd., Beijing, 100095, China
* Corresponding Author: Xiaoning Ge. Email:
(This article belongs to the Special Issue: Innovative Energy Systems Management under the Goals of Carbon Peaking and Carbon Neutrality)
Energy Engineering 2023, 120(1), 181-199. https://doi.org/10.32604/ee.2022.022228
Received 28 February 2022; Accepted 24 May 2022; Issue published 27 October 2022
 View Full Text
 Download PDF
Abstract
Driven by the goal of “carbon neutrality” and “emission peak”, effectively controlling system carbon emissions has become significantly important to governments around the world. To this end, a novel two-stage low-carbon economic scheduling framework that considers the coordinated optimization of ladder-type carbon trading and integrated demand response (IDR) is proposed in this paper for the integrated energy system (IES), where the first stage determines the energy consumption plan of users by leveraging the price-based electrical-heat IDR. In contrast, the second stage minimizes the system total cost to optimize the outputs of generations with consideration of the uncertainty of renewables. In addition, to fully exploit the system’s emission reduction potential, a carbon trading cost model with segmented CO2 emission intervals is built by introducing a reward-penalty ladder-type carbon trading mechanism, and the flexible thermal comfort elasticity of customers is taken into account by putting forward a predicted mean vote index on the load side. The CPLEX optimizer resolves the two-stage model, and the study results on a modified IES situated in North China show the proposed model can effectively reduce carbon emissions and guarantee economical efficiency operation of the system.Keywords
Rapid economic development has brought enormous pressure to the cause of environmental protection, among which, global warming caused by greenhouse gas emissions is a major problem facing the entire world. According to the survey, carbon dioxide emission is a key factor of climate warming; from the perspective of the composition of the total CO2 emissions, the carbon emissions generated by the energy industry occupy a major part, and for the energy industry, the power system occupies a dominant position. Hence reducing carbon dioxide emission has become an important research hotspot in power system dispatching [1]. The primary energies used in traditional power systems are mainly fossil fuels such as coal and oil, which are the main fuels that generate a large amount of CO2. Due to the emergence of the energy crisis and increasing requirements for environmental protection, the penetration rate of distributed power sources such as wind power generation, solar power generation, and natural gas power generation in the power grid has gradually increased, which provides a favorable guarantee for reducing CO2 emissions. However, how to take effective measures to fully tap the emission reduction potential of clean and distributed generations is the key to accelerating the low-carbon development. At the same time, the integrated energy system (IES) integrates various energy forms and includes the links between energy production, transmission, and consumption [2]. The construction of IES is an important technical means to improve the consumption of high-proportion renewable energies and control carbon dioxide emissions, which is of great practical significance for promoting energy transformation and ensuring low-carbon economic operation of the system [3].
In recent years, the carbon trading mechanism (CTM) has attracted the attention of researchers owing to its advantages in reducing system carbon emissions. Reference [4] utilized CTM to allocate the outputs of power supply units and considered the fairness of carbon trading and the uncertainty of wind generation; Reference [5] considered the carbon trading cost in the electricity-gas joint optimization, which ensured the low-carbon and economical properties of IES in stochastic scenarios. The ladder-type carbon trading (LTCT) operation mechanism was analyzed in reference [6] and applied to the IES to verify the effectiveness in reducing system carbon emissions and promoting wind power consumption. Reference [7] utilized CTM to improve the economics and environmental benefits of IES with multiple stakeholders. The above references have successfully introduced the CTM into the optimal scheduling of IES; however, most carbon trading is traditional trading with fixed trading prices. Although this method has made a certain impact, the performance has not yet achieved a satisfactory level.
Demand response (DR), as an effective means to stimulate the flexibility of users’ energy consumption, plays an important role in improving the economy, its energy conservation, and emission reductions in general. An IES optimization operation model is presented in reference [8], which considers the energy consumption characteristics of users to implement DR. Reference [9] utilized price and incentive-based demand response to promote wind power consumption. Reference [10] evaluated the DR potential of the time-shiftable loads in Inner Mongolia and analyzed the impact of the electricity sale price on DR potential. Reference [11] leveraged DR as a flexible resource on the load side to improve the flexibility of system operation, thereby promoting the consumption of variable renewable energies. IDR strategies such as electric power substitution and load shifting are leveraged in reference [12] to excavate the demand elasticity of smart buildings. However, the existing references which consider the IDR generally determines the controllable heat load based on a fixed percentage of the total heat load or a function related to the outdoor temperature, which fails to flexibly adjust the controllable heat load according to the changes in the temperature needs of customers at different periods. In addition, most of the current research on IDR is aimed at system economy and promoting renewable energy consumption but lacks analysis on the effect of CO2 emission reduction.
Given the above problems, this paper introduces reward-penalty LTCT to exploit the emission reduction potential of distributed energy fully, and utilize the user’s flexible thermal comfort elasticity to implement the IDR strategy. In addition, to improve the low carbon and economy of the power system through the synergy of multiple parties, a low-carbon economic scheduling method of IES with consideration of the coordinated optimization of LTCT and IDR is constructed respectively from the perspective of CO2 emission management on the energy supply side and the load side. The contributions mainly include the following three aspects:
(1) To reduce the carbon emissions of the system effectively, a novel two-stage low-carbon economic dispatch framework is established for the IDR-enabled IES with LTCT, where the first stage utilizes price-based IDR to guide users to take emission reduction behaviors. The second stage minimizes the total cost to optimize the output of generations and the purchased energy with consideration of the uncertainty of renewables and LTCT.
(2) To fully exploit the CO2 emission reduction potential, a reward-penalty LTCT program is implemented. A carbon trading cost model with carbon emission interval segments is proposed, which manages to guide high-carbon units to reduce emissions outputs and low-carbon units to increase outputs through changing carbon trading prices.
(3) A heat load demand model is established by constructing the building transient heat balance equation. The flexible thermal comfort elasticity of customers is taken into account by the time-based constraints of the predicted mean vote (PMV) index.
2 Structure Modeling of the IES
2.1 Overall Framework of the IES and Low Carbon Operating Mechanism
Fig. 1 presents the overall structure of the IES. The electric loads are supplied by the wind turbine (WT), photovoltaic (PV), gas turbine (GT), as well as the main grid; the GT and gas boiler (GB) is responsible for supplying energy to the heat load. A battery energy storage device improves the flexibility of the system operation by storing and releasing electric power. Power to gas (P2G) device converts electric power into natural gas to provide part gas energy for GT and GB and consumes renewable energies. For ease of analysis, the electric power purchased from the primary grid is assumed to be generated by thermal power units, which are high-carbon emission sources. At the same time, GT and GB are low-carbon emission sources [13].
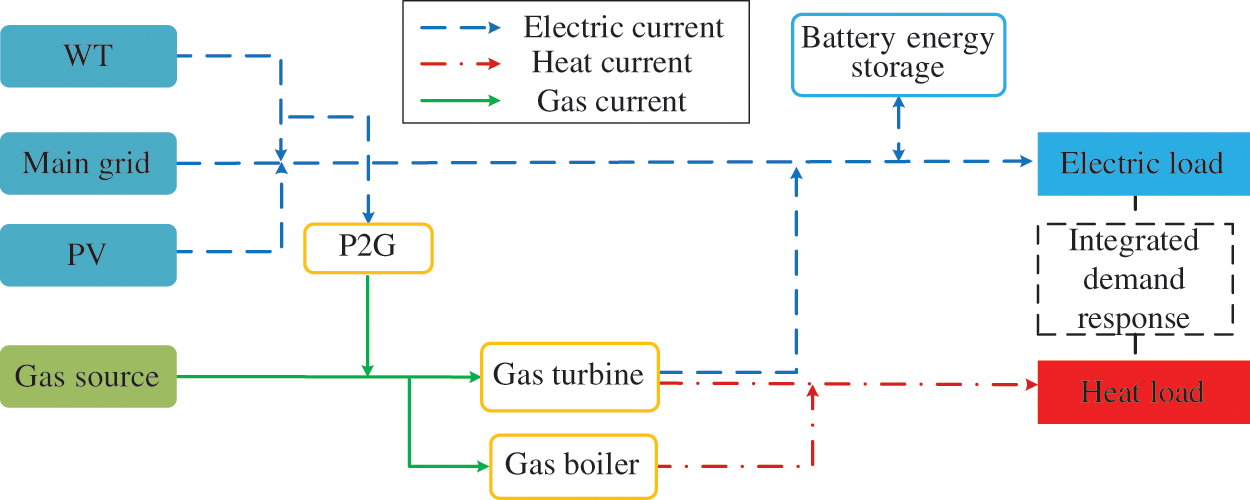
Figure 1: Structure diagram of the IES
To qualitatively analyze the low-carbon operation mechanism for coordinated optimization of LTCT and IDR, the schematic comparison of multiple power generation outputs whether applying LTCT and IDR in IES is shown in Fig. 2. Four modes are set for comparative analysis, i.e., no carbon trading, traditional carbon trading, ladder-type carbon trading, and ladder-type carbon trading + IDR. The low carbon units refer to GB and GT, and the high carbon units refer to thermal power generations. Taking the peak load period as an example, the introduction of CTM will increase the outputs of low-carbon sources and reduce the outputs of high-carbon emission units. However, the implementation effect of the traditional CTM with the fixed carbon trading price is limited; although the CO2 emission has been reduced to a certain extent, it has not reached a satisfactory level. In contrast, the LTCT, which has fluctuating carbon trading prices, gives full play to the emission reduction potential of low-carbon generators and dramatically increases the power generation ratio of low-carbon sources. In addition, after considering the IDR, the system’s CO2 emissions are further decreased due to the shift of electric demand during peak periods and the cutting heat load.
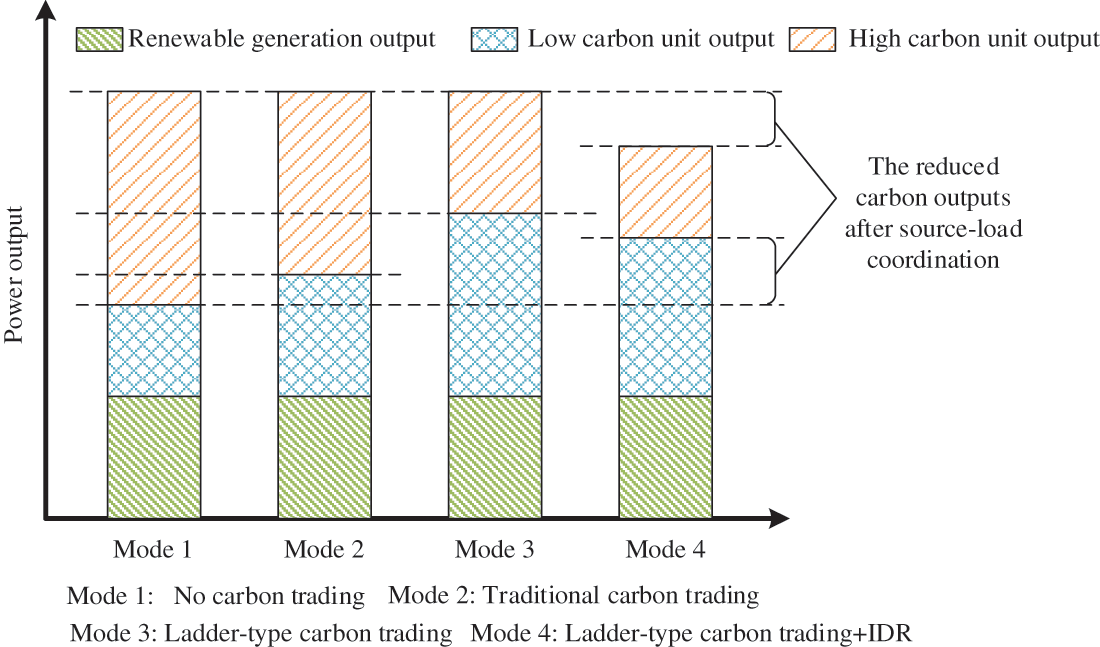
Figure 2: Low-carbon schematic diagram of source-load coordinated optimization during peak load period
2.2 Reward-Penalty Ladder-Type Carbon Trading Model
CTM is an effective management way to limit CO2 emissions, carbon emission sources could sell or buy carbon emissions in the carbon trading market according to the allocated carbon emission quota and the actual carbon emissions, thereby realizing the control of the total carbon emission of the system [14].
The carbon emission quota is generally related to the output power of the generation. WT and PV are renewable energy sources and are considered to have no carbon emissions. The GT provides both electric and heat energy; the carbon emission quota for GT is allocated according to the total heat supply, which is obtained by converting the electric power into heat supply and adding the original heat supply [15]. Therefore, the carbon emission quota of GT can be expressed as follows:
where,
The GB only supplies heat energy to the system, so its carbon emission quota is [16]:
where,
The carbon emission quota of the primary grid is:
where,
Therefore, the total carbon emission quote B of the IES is:
Corresponding to the carbon emission quota, the IES has three carbon emission sources, namely GT, GB, and the purchased electricity.
Besides, P2G equipment absorbs CO2 in converting electricity to gas, thereby offsetting part of the CO2 emitted by carbon emission sources [17]. Therefore, the actual CO2 emission D of the system is:
where,
LTCT refers to dividing carbon emissions into multiple ranges for carbon trading. In this work, the reward-penalty LTCT is introduced for the purchase and sale of CO2. The relationship between carbon trading price and the amount of carbon emission is shown in Fig. 3. When the actual carbon emission is greater than the carbon emission quota, the carbon emission source needs to purchase the carbon emission quota from the carbon trading market; the higher the CO2 emissions, the higher the carbon trading price of excess carbon. While on the contrary, when the actual carbon emission of the system is less than the carbon emission quota, the carbon emission source can sell the carbon emission quota to the carbon trading market; the smaller the CO2 emission, the higher the carbon trading price [18], and the government would also provide certain subsidies. The reward-penalty ladder carbon trading cost model is expressed as [19]:
where,
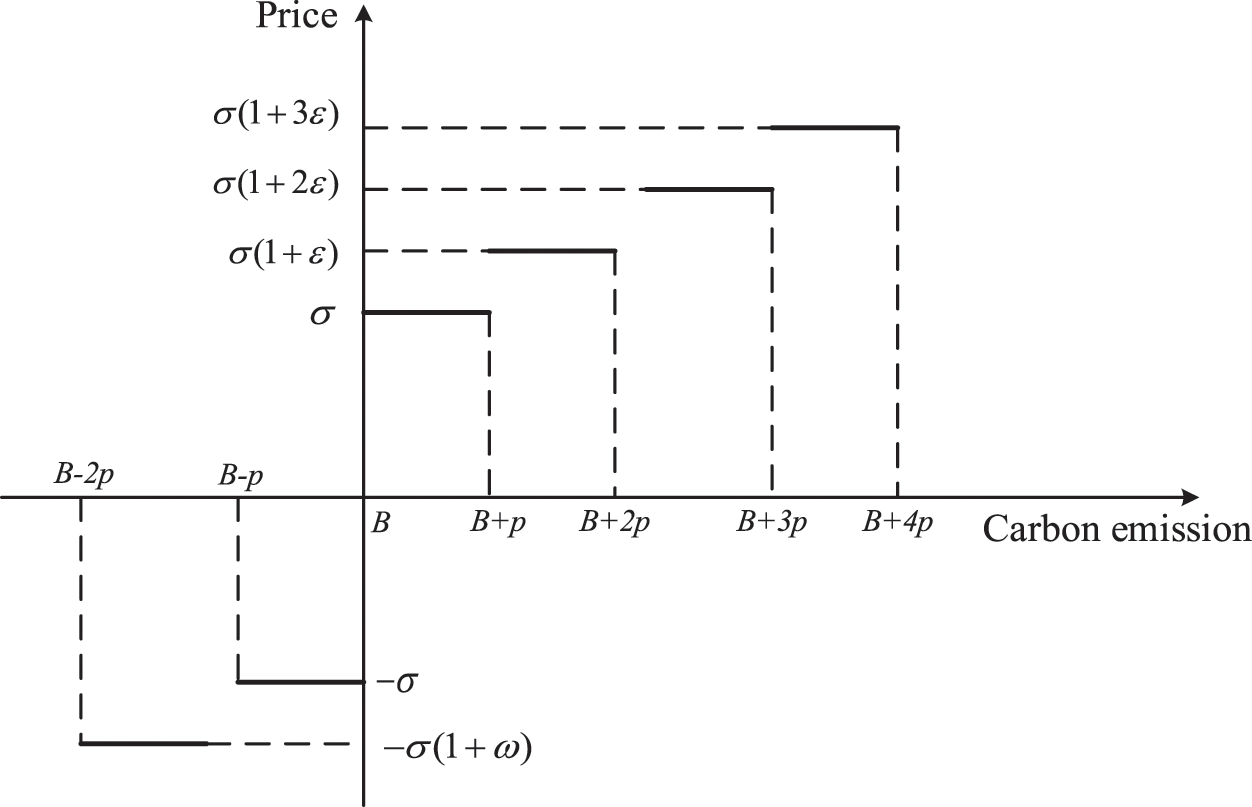
Figure 3: Schematic diagram of reward-penalty LTCT
IDR is one of the important ways to motivate users to participate in system scheduling actively. The mathematical models of time-shiftable electrical load and cuttable heat load are respectively established, which fully uses the coupling and complementary relationship between electric and heat energy. In addition, the time-of-use price is generally applicable and simple to implement [20], so this paper adopts this incentive method.
2.3.1 Time-Shiftable Electric Load
Except for the fixed electric load, there has a part of the time-shiftable load that can adjust the power consumption amount and period according to the electricity price information to reduce the users’ energy consumption cost and smooth the load peak-to-valley power difference [21]. Therefore, the total electricity load of users is expressed as:
where,
Considering that the heating load accounts for 80%--90% of the users’ heat load in winter and has great adjustment potential, the heat load in this paper refers to the heating load of users [22]. The relationship between the heat load demand and indoor temperature can be reflected by the transient heat balance equation of the building to link the heat load demand and temperature [23] as follows:
where,
Eq. (8) is a first-order differential equation. Since the outdoor temperature does not change much during a short period, it can be regarded as a constant within a short period. Solving Eq. (8), the heat balance equation can be linearized as follows:
Shift and transform Eq. (9), the terminal heat load model can be given as:
Generally, the thermal comfort temperature of users is ambiguous, so they can reduce a certain amount of heat load within an acceptable range according to their own requirements for thermal comfort, which not only can save the energy cost for users, but also reduce the outputs of power generations and the system carbon emission [24]. Therefore, the heat load demand after IDR is:
where,
To accurately reflect the users’ temperature feeling during heating, the PMV index is introduced to quantify the users’ thermal comfort as [25]:
where,
Table 1 presents the thermal comfort state of the human body under different index values [26]. Studies have shown that PMV values between ±1 could also meet the thermal comfort request of customers [25]. In addition, since the users are generally in a sleep state at night and hence are less sensitive to thermal sensation than that during the day, this paper limits the PMV value by different time periods within a scheduling cycle. As shown in Fig. 4, the PMV value during the daytime is limited to the range of ±0.5, and at night is relatively relaxed to the range of ±1.
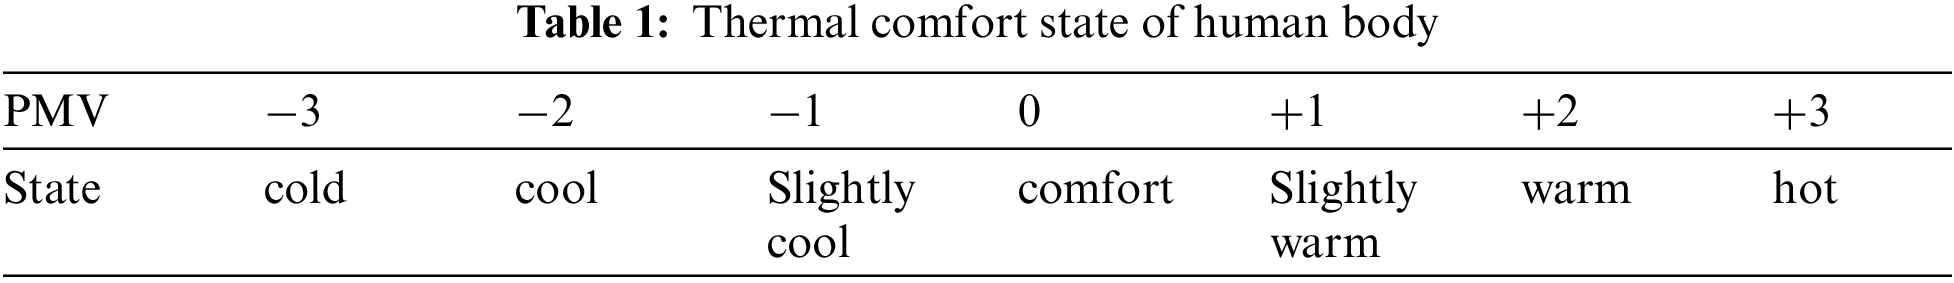
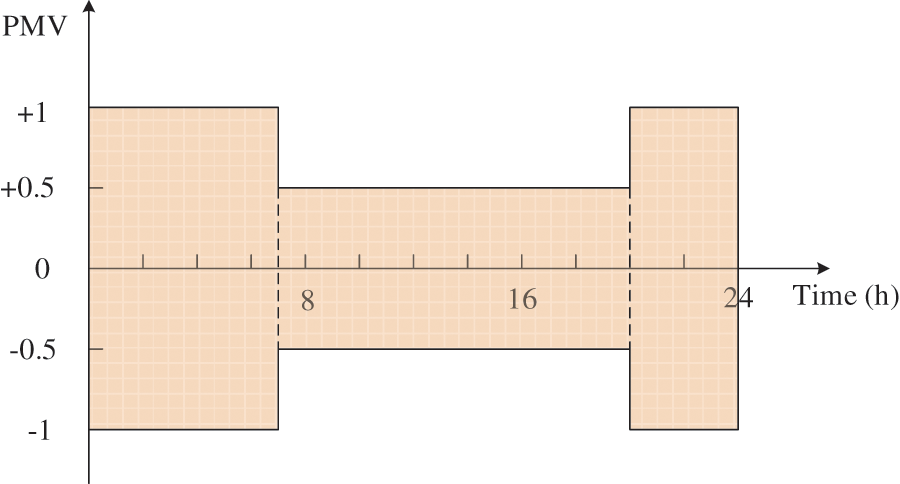
Figure 4: The range of PMV value
3 Two-Stage Dispatch Model of IES for Source-Load Coordination
A two-stage low-carbon dispatch model of IES for source-load coordination optimization is constructed considering the LTCT on the energy supply side and IDR on the load side. The first stage utilizes time-of-use price to determine the energy consumption plan of users; the second stage optimizes the output of generations and the purchased energy. Taking into account the volatility of renewables then, the spinning reserves are provided by the system in the form of a chance constraint.
To fully mobilize users to participate in IDR, the target of the first-stage actively is set to minimize the energy cost of users, i.e.,
where,
1) Electric Load Constraints
2) Heat Load Constraint
where,
3) PMV Index Constraints
The energy consumption plan of users solved by the first-stage model is taken into the second-stage model for system energy balance. Due to the randomness of renewables, the battery energy storage, GT, and the purchased electric energy provide a spinning reserve for the IES. The target is to minimize the total cost of the purchased electricity energy, natural gas energy, and carbon trading:
where,
1) Energy Balance Constraints
2) Device Constraints
The operating constraints of GT, GB, and P2G devices are as follows [6]:
where,
3) Spinning Reserve Constraints [28]
When the output of renewables fluctuates, its predicted value will deviate from the actual value. Therefore, the spinning reserve provided by the battery energy storage, GT, and the purchased electricity must ensure that the difference can be filled to guarantee the safe operation of the system. The spinning reserve constraint expressed by the chance constraint form is [28]:
where,
4) Main Grid Constraints
where,
5) DC Power Flow Constraints
where,
6) Gas grid constraints [29]
where,
The battery storage constraints can be found in [26], which are not repeated in this paper.
Eq. (21) is a chance constraint that is difficult to solve directly by the CPLEX solver. Therefore, a new 0–1 variable W is introduced to transform the original constraint into a deterministic form. The variable satisfies the following relationship:
Eq. (25) shows that when the total spinning reserves provided by the battery energy storage, GT, and the purchased electric energy are not less than the difference between the expected and the actual outputs of the renewables, this variable is taken as 1; otherwise it is 0. The natural gas network constraints are linearized using the iterative algorithm in [30]. Thus the original uncertain model with the chance constraint is transformed into a deterministic mixed-integer linear programming (MILP) form that CPLEX solver could directly resolve. The solution process is presented in Fig. 5.
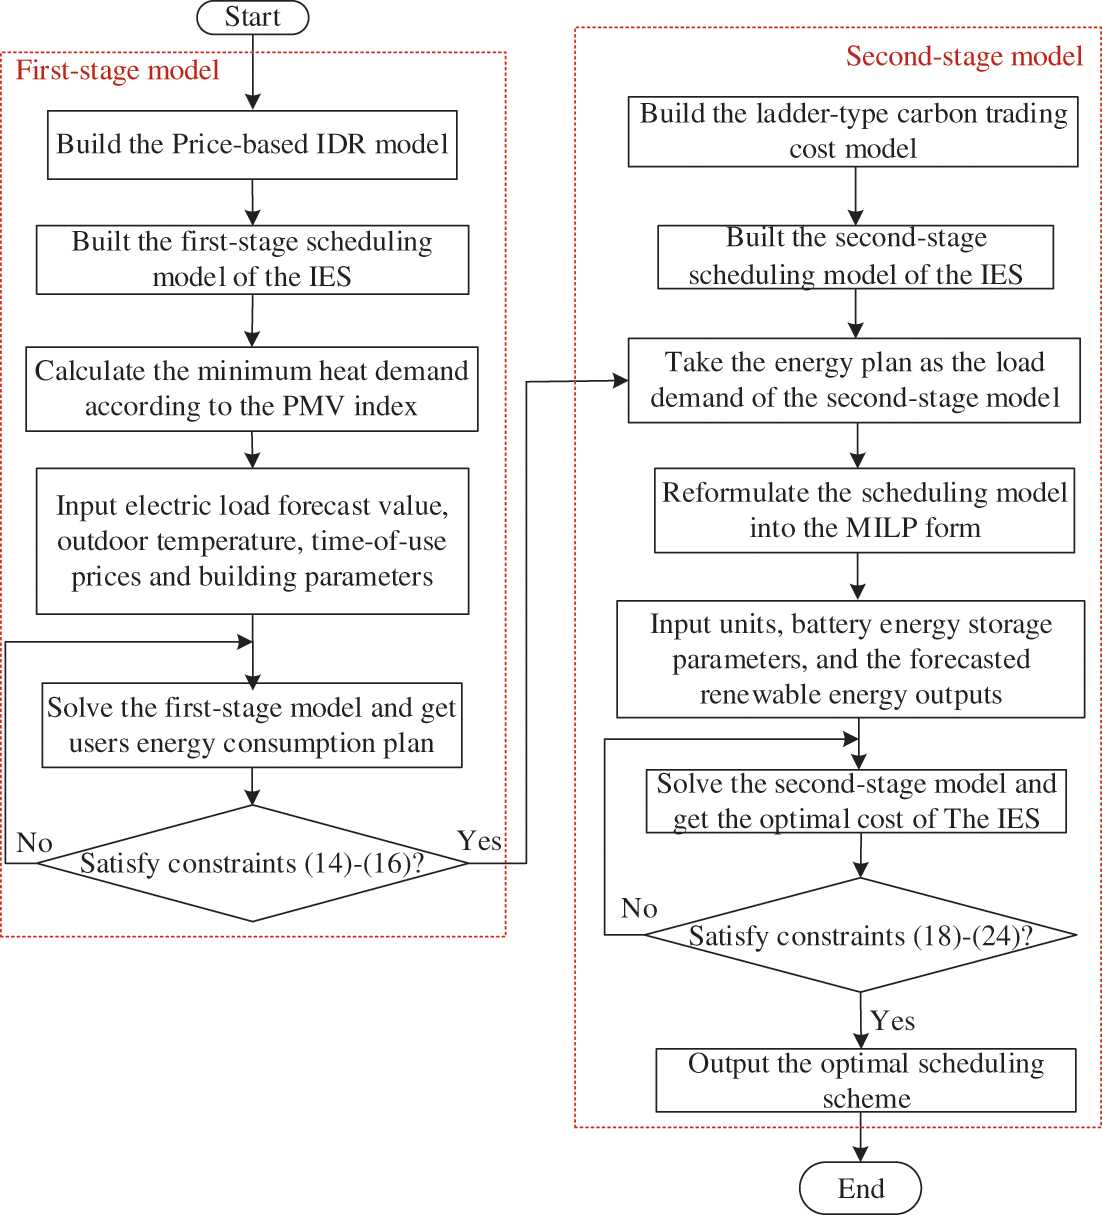
Figure 5: Solution flow chart
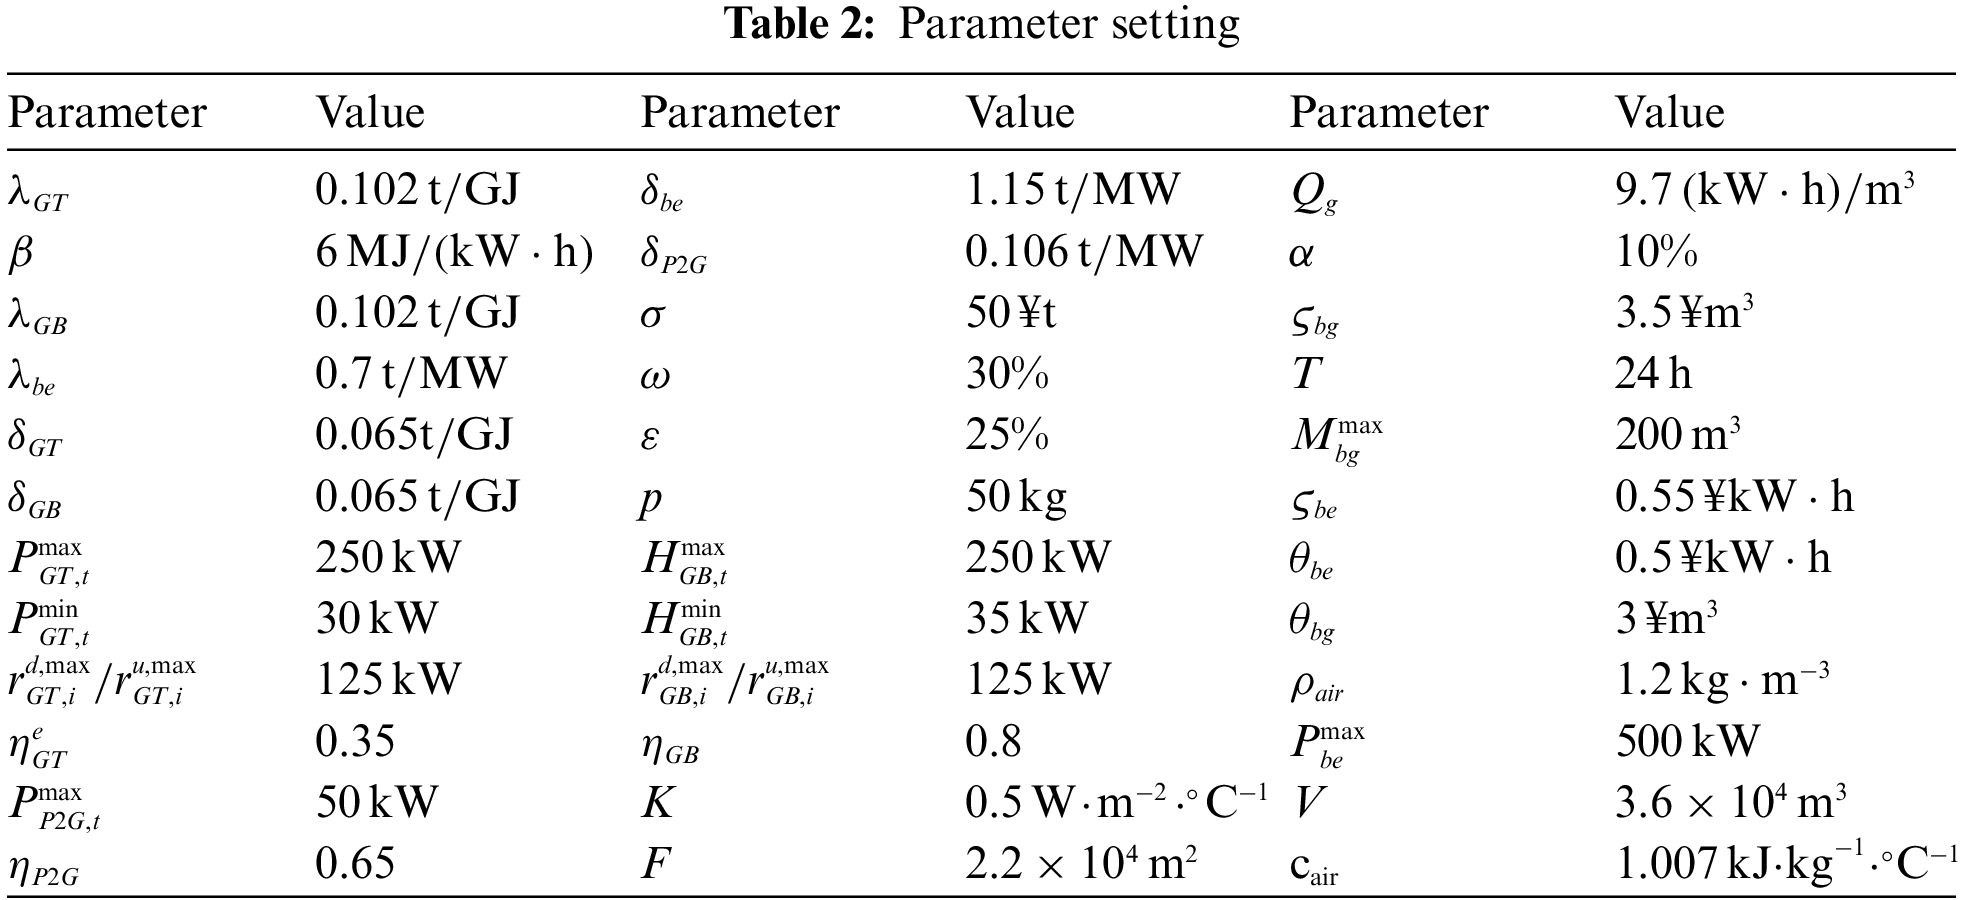
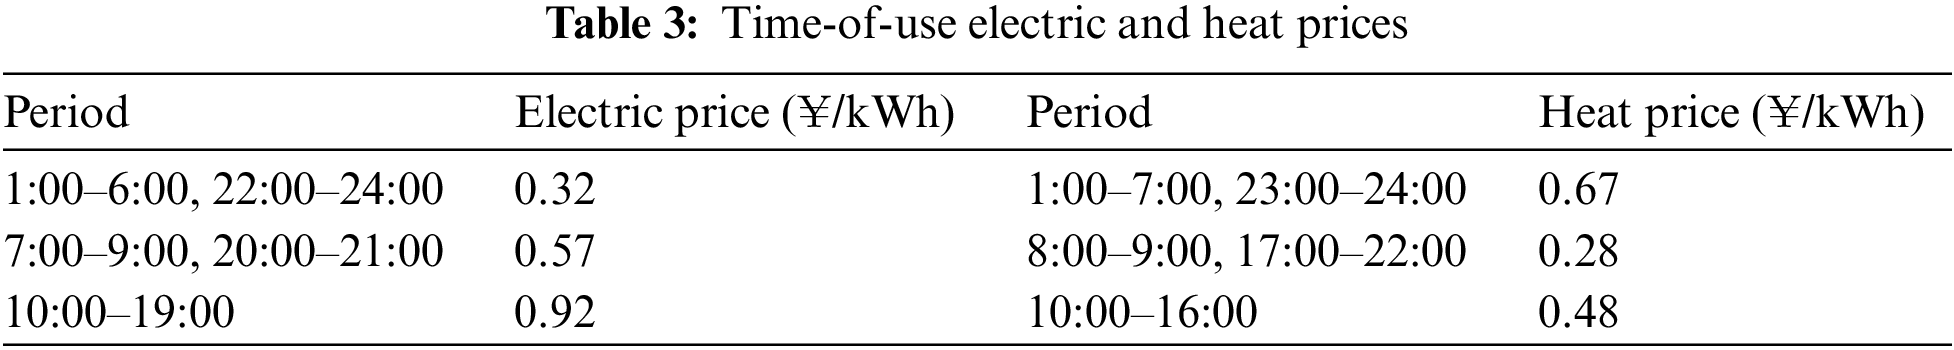
To illustrate the model’s low-carbon economic effect, a modified IES based on a real system in North China is used for the case study, which employs the typical IES structure shown in Fig. 1. The system integrates three forms of energy: heat, electricity, and gas. Furthermore, a wind farm, a PV power station, three natural gas wells, and representative energy conversion equipment such as GB, GT, and P2G devices, as well as battery energy storage, are integrated into the IES. The predicted curves of the electric load, WT-PV combined outputs, and outdoor temperature on a typical winter day is presented in Fig. 6. The parameter settings are shown in Table 2 [19,26], PMV index parameters refer to reference [24], and the time-of-use electric and heat price is shown in Table 3.
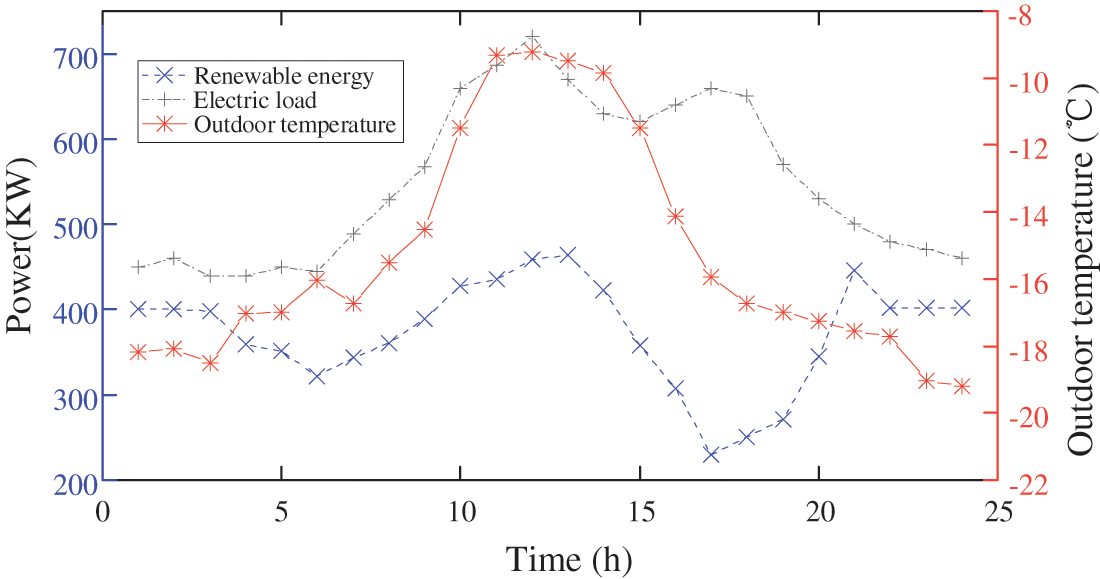
Figure 6: Forecast values of renewable outputs, electric load, and outdoor temperature
To demonstrate the superiority of the combined optimization of LTCT and IDR, four operating cases are set up for comparative analysis, among which the carbon trading price in traditional carbon trading is fixed as the initial carbon price. The confidence level selection of the chance constraint needs to consider the economy and reliability of system operation comprehensively. This paper refers to [26] and takes a 95% confidence level to reach a trade-off between economy and reliability.
Case 1: traditional carbon trading without IDR;
Case 2: traditional carbon trading with IDR;
Case 3: ladder-type carbon trading without IDR;
Case 4: ladder-type carbon trading with IDR.
4.1 Carbon Emissions and Economic Analysis
The CO2 emissions, carbon trading cost, energy purchase cost and the total cost under different cases are shown in Table 4.
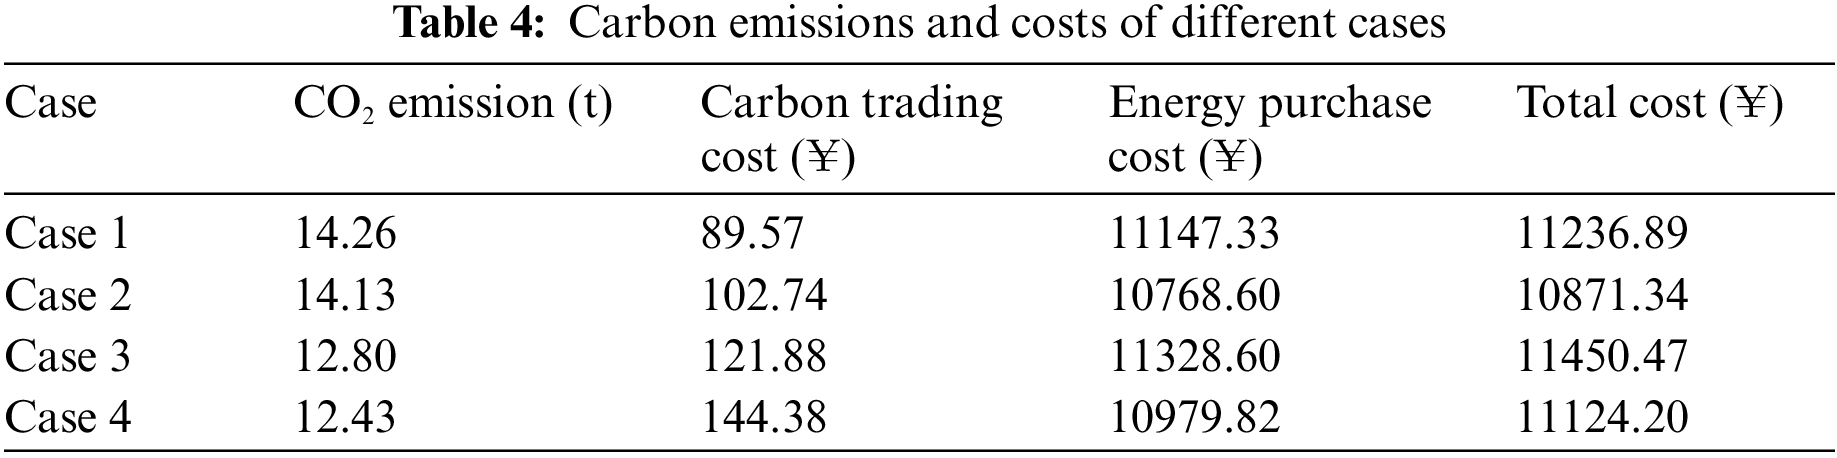
Table 4 shows that the CO2 emissions from case 1 to case 4 gradually decrease, which indicates that considering the LTCT and IDR is beneficial to suppress the CO2 emissions of the system; Specifically, case 4 considers IDR compared with case 3, although the carbon trading cost increases, the energy purchase cost and the total cost are reduced; case 4 considers LTCT compared with case 2, the carbon emissions reduces by 12.03%, while the total cost only increases by 2.33%, which shows that the proposed model can effectively reduce carbon emissions while ensuring the operating economy of the system.
4.2 Integrated Demand Response Analysis
After considering the IDR, the electric and heat load changes are shown in Figs. 7 and 8.
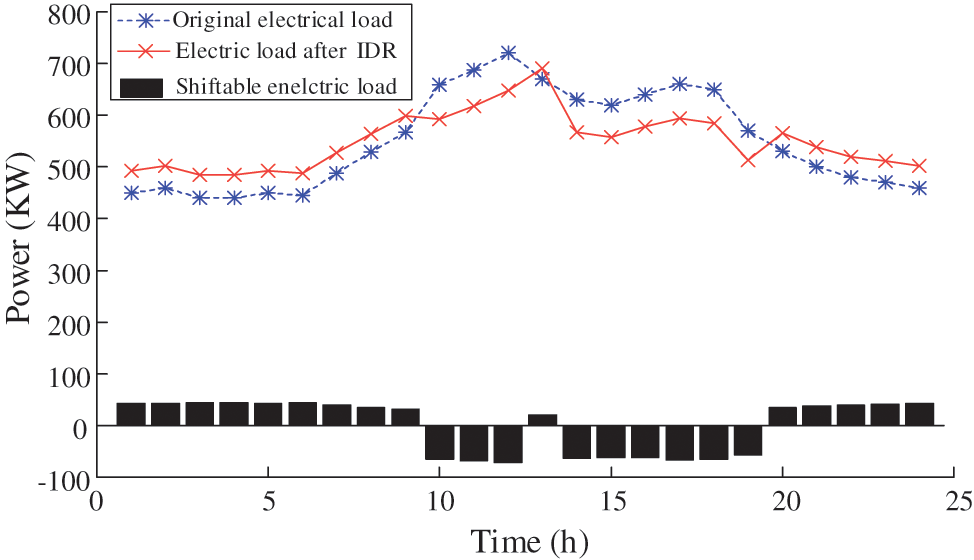
Figure 7: Power of the electric load
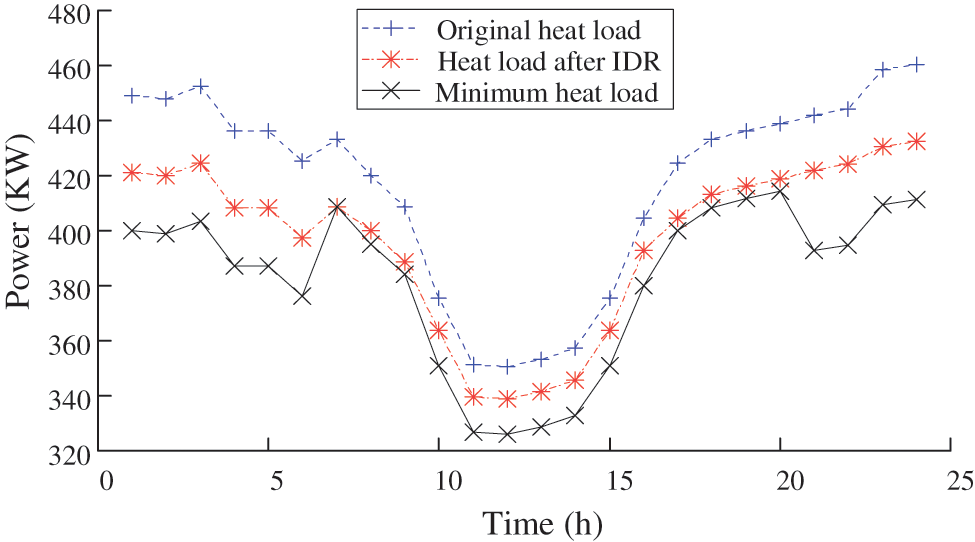
Figure 8: Power of the heat load
Fig. 7 shows that after considering IDR, the fluctuation of the overall electrical load curve is significantly slowed down, which reflects the advantages of peak-shaving and valley-filling. Fig. 8 shows the heat loads are cut to different degrees in different periods when considering the IDR, but they do not exceed the minimum heat load demand. This illustrates that the proposed IDR model ensures the basic thermal comfort request of customers under the PMV index. The cuttable heat load is conducive to decreasing the output of the generations to reduce the overall CO2 emission level.
The penalty factor reflects the users’ request for thermal comfort. To analyze the influence of the penalty factor on system scheduling, therefore, the total amount of heat load reduction and the system carbon emissions under different penalty factors are presented in Fig. 9.
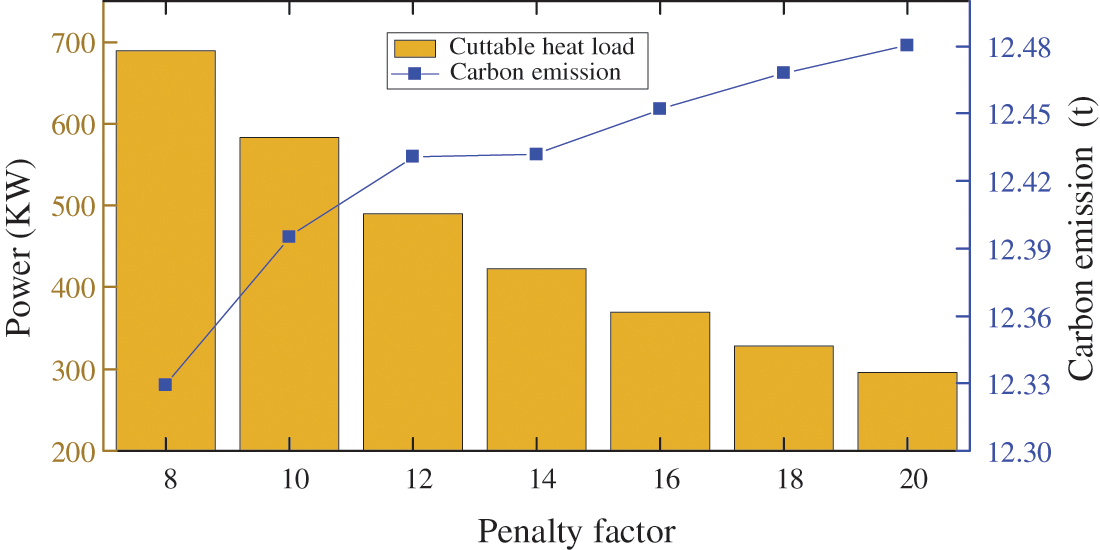
Figure 9: Cuttable heat load and carbon emissions under different penalty factors
Fig. 9 illustrates that the penalty factor affects the amount of the cuttable heat load and the carbon emissions. The cuttable heat load decreases as the penalty factor increases, while the carbon emission gradually increases. The penalty factor reflects the customers’ requests for thermal comfort; the larger the value, the higher the requirements of users for thermal comfort. Therefore, the penalty factor should be reasonably set according to the user’s thermal comfort requirements and the system’s emission reduction demands under the actual situation to achieve the trade-off between the user’s thermal comfort and the system’s carbon emissions.
Fig. 10 presents the total amount of the purchased electricity and the heat outputs of the GT and GB under the four cases in a scheduling cycle. Due to the thermo-electric ratio constraint of the GT, the change trends of the electric and the heat output of the GB are roughly the same, so only the change of the heat output is shown here.
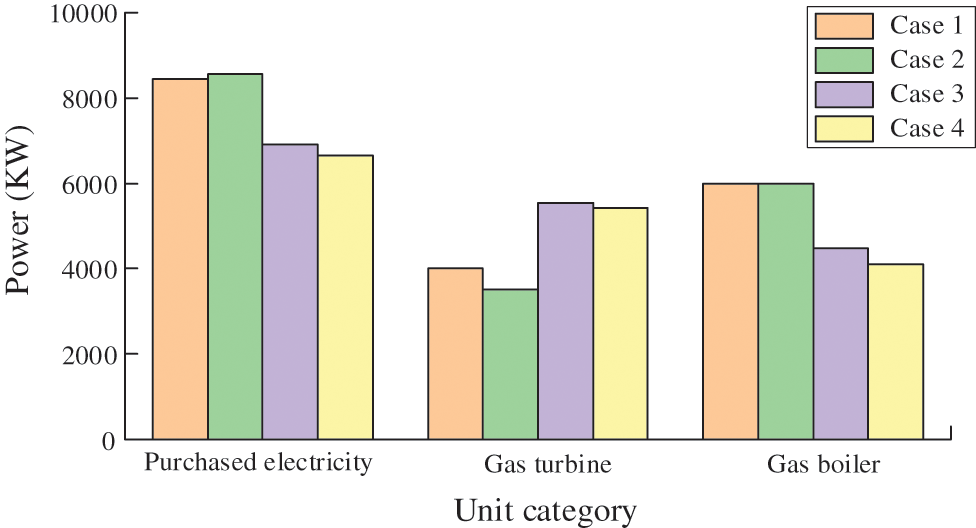
Figure 10: The total outputs of GT, GB, and the purchased electric energy under different cases
It can be seen from Fig. 10 that under cases 3 and 4, which consider the LTCT, the purchased electricity, and outputs of the GB decrease, while the outputs of GT increase. The reason is that the LTCT restrains the purchase of electric energy which has high CO2 emissions, and increases the electric outputs of the GT with low CO2 emissions by changing the carbon trading price. Owing to the thermo-electric ratio constraint, the heat outputs of the GT also increase, hence the GB reduces the outputs to maintain the balance of the heat load. The above shows that the LTCT can efficiently restrain the high-carbon generators and increase the output of low-carbon sources, accordingly reducing the system’s overall carbon emission degree.
The input power of the P2G device under different cases is shown in Fig. 11.
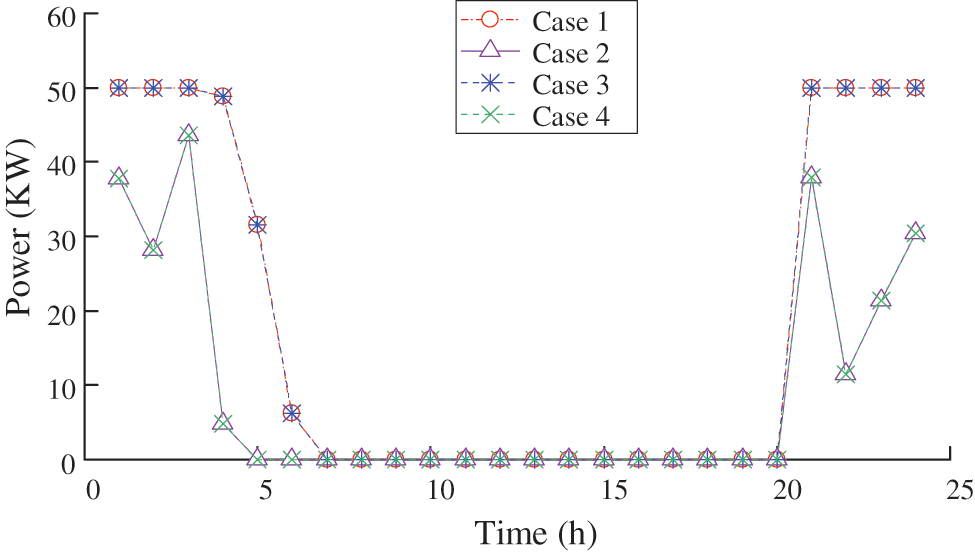
Figure 11: Input power of P2G device under different cases
It can be seen from Fig. 11 that the P2G device has no input in all cases during the daytime, the reason is that the electric demand is high during the daytime, and correspondingly, there is no excess power output to supply P2G; Besides, due to the increment of the electric load demand at night after IDR, the power supplied to P2G is reduced during the night under case 2 when compares with case 1. Moreover, the inputs of P2G remain unchanged under cases 1 and 3, this is because the energy transfer is mainly reflected in the spinning reserve aspect due to the price of spinning reserve, so the spinning reserves purchased from the main grid are reduced and supplied from the GT is increased after considering LTCT, while the P2G device mainly consumes renewable generations, therefore the inputs of the P2G remains the same.
4.4 Carbon Trading Price Analysis
Fig. 12 shows the changes in energy purchase cost, total cost and CO2 emissions under different carbon trading prices in case 4.
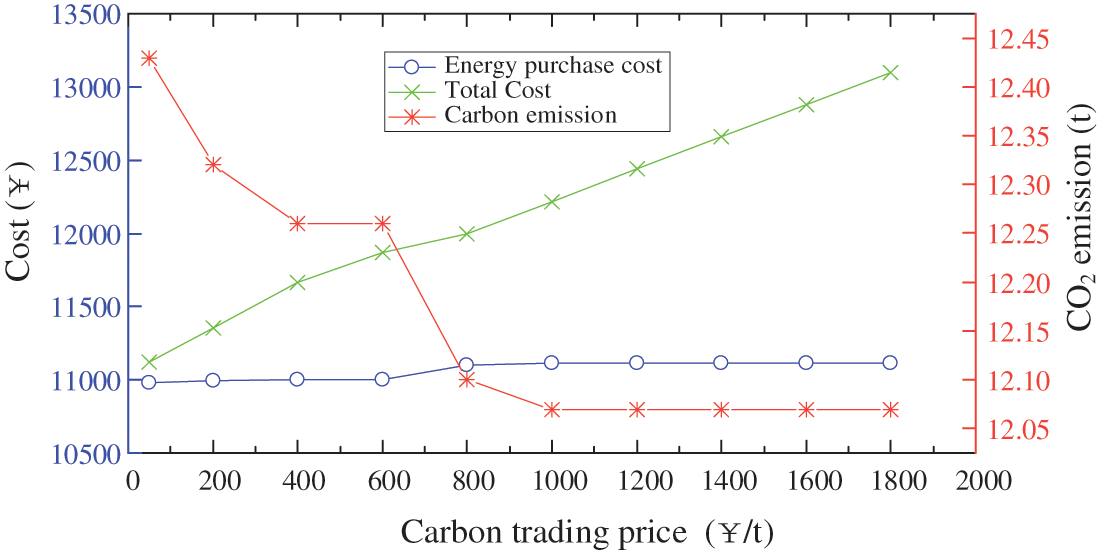
Figure 12: CO2 emissions and system costs under different carbon trading prices
From Fig. 12, it can be observed that CO2 emissions decrease with the increase in carbon trading price, and the carbon trading cost continues to increase. This is because the LTCT reduces the power outputs of high carbon units and increases the outputs of low carbon units to reduce CO2 emissions. When the carbon trading price is 1000 ¥/t, the CO2 emissions and the energy purchase cost of the system remain unchanged; the reason is that the GT has reached the maximum output. Besides, the capacity of the GT is smaller than the purchased electric power, so the system’s actual CO2 emission will not be less than the quota, and the total cost increases proportionally with the increase of the carbon trading price.
To reduce the carbon emission level of power systems, a two-stage low-carbon economic scheduling framework for the coordinated optimization of ladder-type carbon trading and IDR for an IES is proposed in this paper. In this framework, a reward-penalty ladder-type carbon trading mechanism with segmented CO2 emission intervals is built to exploit the system’s emission reduction potential fully, and the flexible thermal comfort elasticity of customers is taken into account by putting forward a predicted mean vote index on the load side. According to the simulation results, the following conclusions can be drawn:
(1) The proposed IES two-stage low-carbon economic dispatch model manages to reduce the system’s overall carbon emissions simultaneously from the energy supply and the demand side, and meanwhile guarantee the economy of the system operation, which provides an effective way to accelerate the low-carbon development.
(2) Compared with traditional carbon trading, the ladder-type carbon trading can further restrain the output ratio of the purchased electricity with high-carbon emissions and increase the outputs of GT and GB with low-carbon emissions, which effectively guides the system towards a low-carbon and clean operation to a greater extent; Besides, the increase of carbon trading price can restrain the carbon emissions of the system, but at the same time could increase carbon trading cost. Therefore, the carbon trading price should be reasonably selected to trade off the low-carbon economy of the system.
(3) The proposed IDR can smooth the load fluctuation, reduce the load peak-to-valley difference and decrease the system carbon emissions while guaranteeing the thermal comfort requirements of users within an acceptable range; The user’s flexible thermal comfort elasticity can stimulate the emission reduction potential of IDR by introducing the predicted mean vote index, which provides a new perspective for utilizing IDR to achieve carbon reduction.
In our future work, the deep mining of the model will be studied, and the IDR model will be improved by combining carbon flow tracking. In addition, it is assumed that the electric power purchased from the main grid is generated by thermal power generations, while a more realistic scenario shall be considered.
Funding Statement: This work was supported by the State Grid Shandong Electric Power Company Economic and Technical Research Institute Project (SGSDJY00GPJS2100135).
Conflicts of Interest: The authors declare that they have no conflicts of interest to report regarding the present study.
References
1. Gu, H., Li, Y., Yu, J., Wu, C., Song, T. et al. (2020). Bi-level optimal low-carbon economic dispatch for an industrial park with consideration of multi-energy price incentives. Applied Energy, 262, 114276. [Google Scholar]
2. Stennikov, V., Barakhtenko, E., Mayorov, G., Sokolov, D., Zhou, B. (2022). Coordinated management of centralized and distributed generation in an integrated energy system using a multi-agent approach. Applied Energy, 309, 118487. [Google Scholar]
3. Zhang, G., Wang, W., Chen, Z., Li, R., Niu, Y. (2022). Modeling and optimal dispatch of a carbon-cycle integrated energy system for low-carbon and economic operation. Energy, 240, 122795. [Google Scholar]
4. Jin, J., Zhou, P., Li, C., Guo, X., Zhang, M. (2019). Low-carbon power dispatch with wind power based on carbon trading mechanism. Energy, 170, 250–260. [Google Scholar]
5. Tan, Z., Fan, W., Li, H., De, G., Ma, J. et al. (2020). Dispatching optimization model of gas-electricity virtual power plant considering uncertainty based on robust stochastic optimization theory. Journal of Cleaner Production, 247, 119106. [Google Scholar]
6. Li, H., Ye, Y., Lin, L. (2021). Low-carbon economic bi-level optimal dispatching of an integrated power and natural gas energy system considering carbon trading. Applied Sciences, 11(15), 6968. [Google Scholar]
7. Wang, R., Cheng, S., Zuo, X., Liu, Y. (2022). Optimal management of multi stakeholder integrated energy system considering dual incentive demand response and carbon trading mechanism. International Journal of Energy Research, 46(5), 6246–6263. [Google Scholar]
8. Wang, Y., Wang, Y., Huang, Y., Yu, H., Du, R. et al. (2018). Optimal scheduling of the regional integrated energy system considering economy and environment. IEEE Transactions on Sustainable Energy, 10(4), 1939–1949. [Google Scholar]
9. Tan, Z., Ju, L., Reed, B., Rao, R., Peng, D. et al. (2015). The optimization model for multi-type customers assisting wind power consumptive considering uncertainty and demand response based on robust stochastic theory. Energy Conversion and Management, 105, 1070–1081. [Google Scholar]
10. Pang, Y., He, Y., Jiao, J., Cai, H. (2020). Power load demand response potential of secondary sectors in China: The case of Western Inner Mongolia. Energy, 192, 116669. [Google Scholar]
11. McPherson, M., Stoll, B. (2020). Demand response for variable renewable energy integration: A proposed approach and its impacts. Energy, 197, 117205. [Google Scholar]
12. Shao, C., Ding, Y., Siano, P., Lin, Z. (2017). A framework for incorporating demand response of smart buildings into the integrated heat and electricity energy system. IEEE Transactions on Industrial Electronics, 66(2), 1465–1475. [Google Scholar]
13. Qin, T., Liu, H., Wang, J., Feng, Z., Fang, W. (2018). Carbon trading based low-carbon economic dispatch for integrated electricity-heat-gas energy system. Automation of Electric Power Systems, 42(14), 8–13+22. [Google Scholar]
14. Sun, P., Hao, X., Wang, J., Shen, D., Tian, L. (2021). Low-carbon economic operation for integrated energy system considering carbon trading mechanism. Energy Science & Engineering, 9(11), 2064–2078. [Google Scholar]
15. Lu, Q., Guo, Q., Zeng, W. (2021). Optimization scheduling of an integrated energy service system in community under the carbon trading mechanism, a model with reward-penalty and user satisfaction. Journal of Cleaner Production, 323, 129171. [Google Scholar]
16. Yan, H., Hu, B., Wang, R. (2020). Air-source heat pump for distributed steam generation: A new and sustainable solution to replace coal-fired boilers in China. Advanced Sustainable Systems, 4(11), 2000118. [Google Scholar]
17. Clegg, S., Mancarella, P. (2016). Storing renewables in the gas network: Modelling of power-to-gas seasonal storage flexibility in low-carbon power systems. IET Generation, Transmission & Distribution, 10(3), 566–575. [Google Scholar]
18. Wang, R., Wen, X., Wang, X., Fu, Y., Zhang, Y. (2022). Low carbon optimal operation of integrated energy system based on carbon capture technology, LCA carbon emissions and ladder-type carbon trading. Applied Energy, 311, 118664. [Google Scholar]
19. Zhang, X., Liu, X., Zhong, J., Gao, W. (2019). Electricity–gas-integrated energy planning based on reward and penalty ladder-type carbon trading cost. IET Generation, Transmission & Distribution, 13(23), 5263–5270. [Google Scholar]
20. Gong, C., Tang, K., Zhu, K., Hailu, A. (2016). An optimal time-of-use pricing for urban gas: A study with a multi-agent evolutionary game-theoretic perspective. Applied Energy, 163, 283–294. [Google Scholar]
21. Wang, S., Bi, S., Zhang, Y. (2018). Demand response management for profit maximizing energy loads in real-time electricity market. IEEE Transactions on Power Systems, 33(6), 6387–6396. [Google Scholar]
22. Gu, W., Wang, J., Lu, S., Luo, Z., Wu, C. (2017). Optimal operation for integrated energy system considering thermal inertia of district heating network and buildings. Applied Energy, 199, 234–246. [Google Scholar]
23. Li, Y., Han, M., Yang, Z., Li, G. (2021). Coordinating flexible demand response and renewable uncertainties for scheduling of community integrated energy systems with an electric vehicle charging station: A bi-level approach. IEEE Transactions on Sustainable Energy, 12(4), 2321–2331. [Google Scholar]
24. Li, Y., Wang, B., Yang, Z., Li, J., Chen, C. (2022). Hierarchical stochastic scheduling of multi-community integrated energy systems in uncertain environments via stackelberg game. Applied Energy, 308, 118392. [Google Scholar]
25. Mao, N., Hao, J., He, T., Song, M., Xu, Y. et al. (2019). PMV-based dynamic optimization of energy consumption for a residential task/ambient air conditioning system in different climate zones. Renewable Energy, 142, 41–54. [Google Scholar]
26. Li, Y., Wang, C., Li, G., Chen, C. (2021). Optimal scheduling of integrated demand response-enabled integrated energy systems with uncertain renewable generations: A stackelberg game approach. Energy Conversion and Management, 235, 113996. [Google Scholar]
27. Liu, N., He, L., Yu, X., Ma, L. (2017). Multi-party energy management for grid-connected microgrids with heat and electricity coupled demand response. IEEE Transactions on Industrial Informatics, 14(5), 1887–1897. [Google Scholar]
28. Li, Y., Yang, Z., Li, G., Zhao, D., Tian, W. (2018). Optimal scheduling of an isolated microgrid with battery storage considering load and renewable generation uncertainties. IEEE Transactions on Industrial Electronics, 66(2), 1565–1575. [Google Scholar]
29. Wang, Y., Qiu, J., Tao, Y., Zhang, X., Wang, G. (2020). Low-carbon oriented optimal energy dispatch in coupled natural gas and electricity systems. Applied Energy, 280, 115948. [Google Scholar]
30. He, Y., Yan, M., Shahidehpour, M., Li, Z., Guo, C. et al. (2017). Decentralized optimization of multi-area electricity-natural gas flows based on cone reformulation. IEEE Transactions on Power Systems, 33(4), 4531–4542. [Google Scholar]
Cite This Article
 Copyright © 2023 The Author(s). Published by Tech Science Press.
This work is licensed under a Creative Commons Attribution 4.0 International License , which permits unrestricted use, distribution, and reproduction in any medium, provided the original work is properly cited.
 Downloads
 Citation Tools