
 Submit a Paper
 Propose a Special lssue
 Open Access
ARTICLE

Electricity-Carbon Interactive Optimal Dispatch of Multi-Virtual Power Plant Considering Integrated Demand Response
1 Hubei Provincial Key Laboratory of Operation and Control of Cascade Hydropower Station, China Three Gorges University, Yichang, 443002, China
2 College of Electrical Engineering & New Energy, China Three Gorges University, Yichang, 443002, China
3 China Yangtze Power Co., Ltd., Yichang, 443022, China
* Corresponding Author: Wei Xiong. Email:
(This article belongs to the Special Issue: Key Technologies of Renewable Energy Consumption and Optimal Operation under )
Energy Engineering 2023, 120(10), 2343-2368. https://doi.org/10.32604/ee.2023.028500
Received 21 December 2022; Accepted 06 April 2023; Issue published 28 September 2023
 View Full Text
 Download PDF
Abstract
As new power systems and dual carbon policies develop, virtual power plant cluster (VPPC) provides another reliable way to promote the efficient utilization of energy and solve environmental pollution problems. To solve the coordinated optimal operation and low-carbon economic operation problem in multi-virtual power plant, a multi-virtual power plant (VPP) electricity-carbon interaction optimal scheduling model considering integrated demand response (IDR) is proposed. Firstly, a multi-VPP electricity-carbon interaction framework is established. The interaction of electric energy and carbon quotas can realize energy complementarity, reduce energy waste and promote low-carbon operation. Secondly, in order to coordinate the multiple types of energy and load in VPPC to further achieve low-carbon operation, the IDR mechanism based on the user comprehensive satisfaction (UCS) of electricity, heat as well as hydrogen is designed, which can effectively maintain the UCS in the cluster within a relatively high range. Finally, the unit output scheme is formulated to minimize the total cost of VPPC and the model is solved using the CPLEX solver. The simulation results show that the proposed method effectively promotes the coordinated operation among multi-VPP, increases the consumption rate of renewable energy sources and the economics of VPPC and reduces carbon emissions.Graphic Abstract
Keywords
Decarbonization, especially for the power sector, is key to achieving net zero emissions as around 40% of global carbon emissions are closely linked to power generation activities. To reach the “3060” dual carbon target, China is striving to decrease the construction and generation of coal-fired units while expanding the development of renewable energy sources such as wind turbines (WT) and photovoltaic (PV). Against the background of global energy shortage and severe environmental pollution, the development of WT, PV and other new energy is of great importance to promote a low-carbon cycle economy and increase the share of non-fossil energy consumed [1]. In recent years, the growth of distributed energy resources especially WT and PV has been particularly rapid [2]. However, due to its strong volatility and randomness characteristics, connecting these resources to the power grid will result in severe consequences of abandoning WT and PV. The virtual power plant (VPP) can solve the above problems effectively. VPP can aggregate various distributed energy sources in different regions, such as WT, PV, energy storage systems and controllable loads, into a whole to achieve complementarity of resources, which can promote the consumption of WT and PV and further achieve decarbonization [3].
However, when VPP operates independently, this operation mode will still lead to insufficient consumption of new energy, high operating costs and carbon emissions [4]. Moreover, due to the relatively limited energy supply methods, with the increase of aggregated units, the energy supply pressure of VPP will also increase. With the expansion of clean energy, the growing demand for low-carbon economic operation and the development of the energy internet, the research trend has switched from single VPP to multi-VPP. Virtual Power Plant Cluster (VPPC) is a collection of geographically scattered VPPs, which may achieve cooperative operation and energy optimal scheduling. It can also enhance the operating efficiency and reliability of the system. Moreover, each member in VPPC can interact with electric energy and other forms of energy, allowing the system as a whole to realize the complementarity and maximum utilization of resources among VPPs. Thus, it is also conducive to energy saving and low-carbon operation of the system. The advantages of multi-VPP joint operation compared to single VPP operation can be summarised as follows [5]: (1) each VPP in VPPC contains distributed generations and loads with diverse characteristics. Joint operations allow more distributed generations to be absorbed over a wider space and time range. (2) the energy interaction of VPPC is the physical condition for the formation of VPPC and the benefits of cooperative operation will be greater than the sum of the benefits of each VPP operating independently, which is the economic basis for the existence of VPPC and an important means to promote the development of VPP; (3) each member in VPPC can participate in the electric energy and other energy interaction. Through coordinating the joint scheduling of VPPs, the utilization rate of clean energy can be improved, the power of coal-fired units and other carbon-emitting generating units can be reduced and the low-carbon and economic efficiency of VPPC can be improved.
In the research of multi-VPP, the existing research has achieved some achievements. In reference [6], a multi-VPP power interaction model was proposed, in which due to the sharing of electric energy among VPPs, the power interaction between VPP and the grid was effectively reduced. Reference [7] put forward the collaborative scheduling method, in which the power sharing among multi-VPP and electric demand response are considered. Reference [8] proposed a dispatch model for multi-regional VPP electric energy and thermal energy interaction, which realized the coordination and scheduling of VPP electric energy and thermal energy in different regions, enhancing the utilization efficiency of renewable energy and reducing the total operating cost. Reference [9] mainly studied the optimal scheduling of two VPPs and considered electric demand response. In view of the severity of carbon emissions and the necessity of carbon reduction, the carbon trading mechanism was introduced in the multi-VPP in reference [10], which effectively controlled carbon emissions while ensuring the economical operation of the system. According to the analysis of the literature on the optimal operation of multi-VPP, we can find that the majority of the research focuses on the impact of the sharing of electric energy or thermal energy on multi-VPP operation. Furthermore, part of the literature explores the impact of the carbon trading mechanism on low-carbon economic aspects of multi-VPP. However, many studies explore energy sharing among VPPs and the binding effect of the carbon trading mechanism on carbon emissions, but few existing studies consider the impact of carbon quotas sharing on the scheduling of multi-VPP. The studies involving the carbon trading mechanism without the sharing of carbon quotas are unable to maximize the economics and decarbonization, and fail to facilitate the utilization and complementarity of resources. Indeed, carbon quota can also be regarded as a shared resource to take part in the scheduling of multi-VPP [11]. Similar to power sharing among VPPs, sharing carbon quotas may help reduce the volume of carbon quotas purchased by VPP from the carbon market. Instead, VPP can obtain carbon quotas from other VPPs with excess carbon quotas to cover the deficit, which not only accomplishes the complementarity of resources and maximizes carbon quotas usage, but also promotes the low-carbon and economic operation of VPPC. As integrated energy systems and the energy internet gradually mature, the sharing of carbon quotas will certainly be recognized as a research priority in future work. As a result, it is imperative to explore the impact of carbon quota sharing on the scheduling of multi-VPP.
The most pressing issue of the day remains the reduction of carbon emissions. Consequently, low carbon is still a popular and significant topic. In the study of the low-carbon and economic dispatch of VPP, existing research mainly focuses on three aspects: source side, policy enforcement and load side. References [12–14] considered carbon capture technologies at the source side as a means to reduce the concentration of CO2 discharged into the atmosphere. Among them, reference [12] introduced carbon capture technologies in the combined heat and power unit (CHP), which reduced a large number of carbon emissions generated by the CHP due to power determined by heat while improving the economics of VPP. Reference [13] further considered power-to-gas (P2G) facilities based on the CHP aggregated carbon capture systems, which can utilize the CO2 captured by the carbon capture power plant (CCPP) as a raw material. The natural gas produced by P2G facilities can also be used as supplementary fuel for gas turbines (GT). Therefore, combining the two will have a greater carbon reduction effect [15]. Reference [16] considered VPP participation in carbon trading from a low-carbon policy perspective and analyzed the impact of the price of different carbon trading on carbon emissions. Simulation results showed that setting a reasonable carbon price can effectively contribute to CO2 reduction. In reference [17], the ladder-type carbon trading mechanism was introduced into VPP, which can limit carbon emissions more strictly and promote low-carbon operation compared with the traditional carbon trading mechanism. Reference [18] studied the combined effect of carbon capture technologies and the carbon trading mechanism and analyzed their effect on carbon reduction. Based on the summary and analysis of the above literature, we can find that most of the energy consumption of CCPP is provided by a single unit such as GT or coal-fired unit, while new energy such as WT and PV are all used for supplying the grid. It may lead to a decrease in the grid-connected power of the CCPP during peak load periods and the curtailment of WT and PV. In fact, the electricity from WT and PV may be used to supply carbon capture systems in addition to being connected to the grid. It can reduce the power supplied to the carbon capture system from coal-fired units, further reducing the power of the unit and helping the system operate with a low carbon footprint. Therefore, it is also imperative to explore the effect of the combined operation of WT-PV-CCPP.
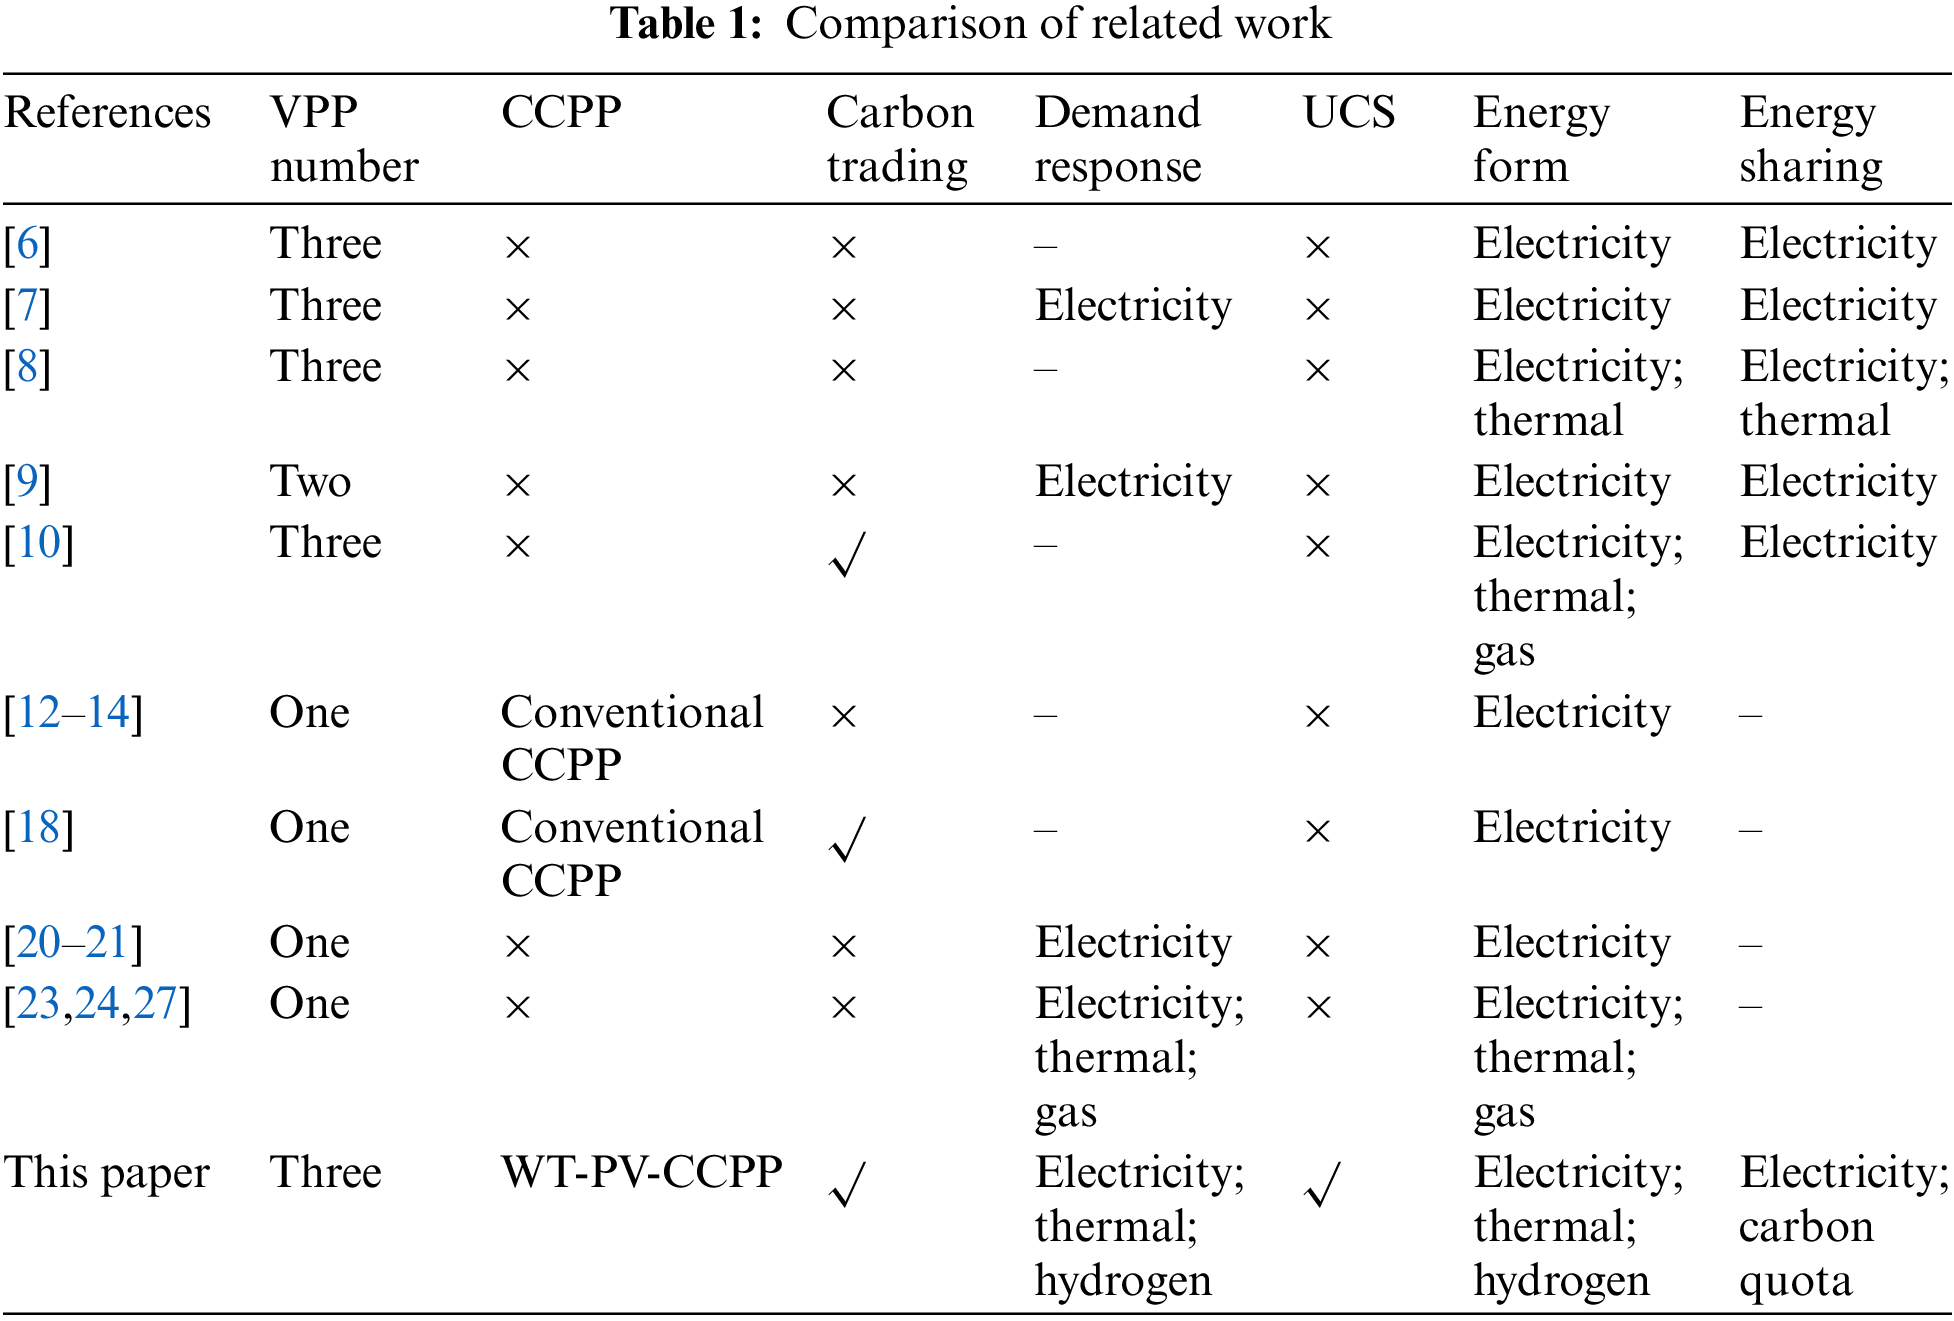
The aforementioned literature analyses the feasibility of carbon reduction on the source side and policy implementation and has made some progress. From the load side viewpoint, demand response can reduce carbon emissions by affecting the utilization and efficiency of coal-fired plants [19]. It can help deeply explore the coordination capability between the source side and the load side by mobilizing load side resources, so that the load curve can be more closely matched to the energy characteristics of the source side. Thus, the output power of carbon-emitting generating units can be decreased, which is beneficial to the economics and low-carbon operation of the system. Reference [20] put forward a multi-time scale VPP two-stage dispatch scheme considering power demand response. The simulation results showed that reducing peak load can directly limit carbon emissions. Reference [21] conducted accurate and detailed modeling of the demand response of different loads. However, the above literature only analyzes the role of power demand response and the energy types are relatively single. Integrated demand response (IDR) can mobilize a variety of energy sources, including electricity, heat and hydrogen, and is superior to traditional demand response in terms of energy scope and modifiability [22]. In references [23,24], the demand response of electric and heat loads was considered, and the impact of the combined function of electricity and heat on the economics of the system was evaluated. In references [25,26], alternative demand response was taken into account, which means that different energy sources such as electricity, gas, heat and cold can be substituted for each other, further improving energy utilization efficiency. Reference [27] constructed an IDR model for heat, electricity and gas and compared the effect of traditional demand response with IDR on carbon reduction. When users are guided to participate in demand response, they have to make adjustments in energy habits, including time of energy use and ways of energy use, which will undoubtedly affect their energy satisfaction. The indicators of user satisfaction are directly correlated with the degree of user comfort and satisfaction. However, the above literature does not consider the level of user satisfaction due to the load adjustment. Thus, the user satisfaction indicator is an important consideration in the scheduling process. The comparison between this article and other existing literature contributions is shown in Table 1.
Motivated by the abovementioned research gap, this paper focuses on the low-carbon economic operation and the interaction of electric energy and carbon quota of VPPC. The main contributions of this paper are as follows:
• Constructing a multi-VPP electricity-carbon interaction framework to solve the coordinated optimal operation problem among VPPs. The sharing of power and carbon quotas can realize energy complementarity, reduce energy waste and promote the low-carbon operation of VPPC.
• Aiming at the inadequacy of conventional CCPP in carbon emissions reduction, this paper considers that WT and PV can provide energy for carbon capture systems and establishes a framework for coordinated dispatch of WT-PV-CCPP.
• To further coordinate multiple types of energy and loads and promote the low-carbon operation of VPPC, an IDR mechanism based on the UCS of electricity, heat, and hydrogen is established.
2 Multi-VPP Electricity-Carbon Interaction Framework
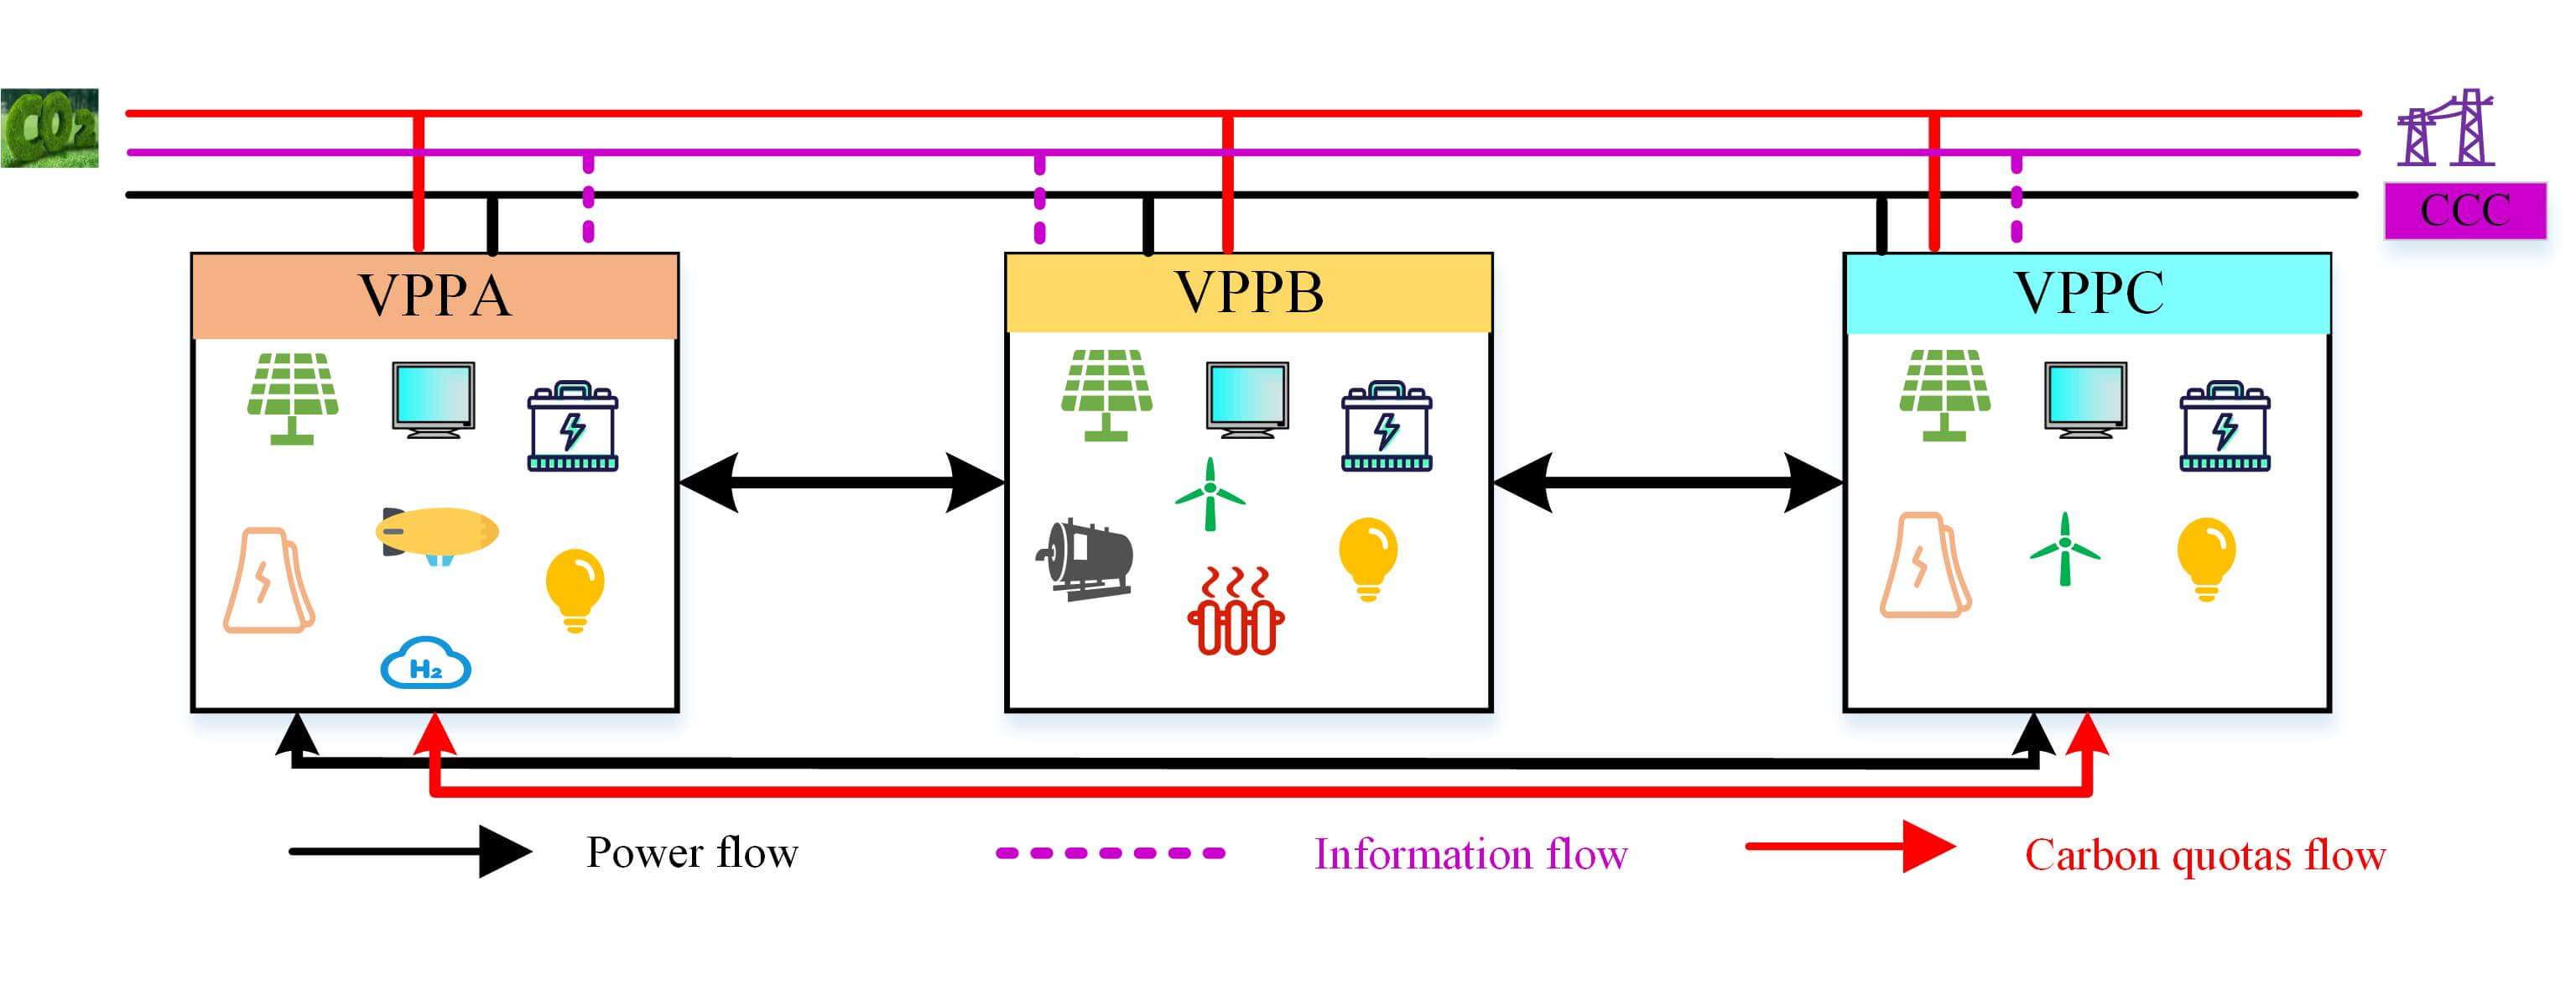
Different VPPs have their own characteristics. Limited by power transmission, the grid-connected power of VPP is inadequate, which results in energy waste and more carbon emissions. To solve the coordinated optimal operation problem in multi-VPP, the multi-VPP electricity-carbon interaction framework is established, as shown in Fig. 1.
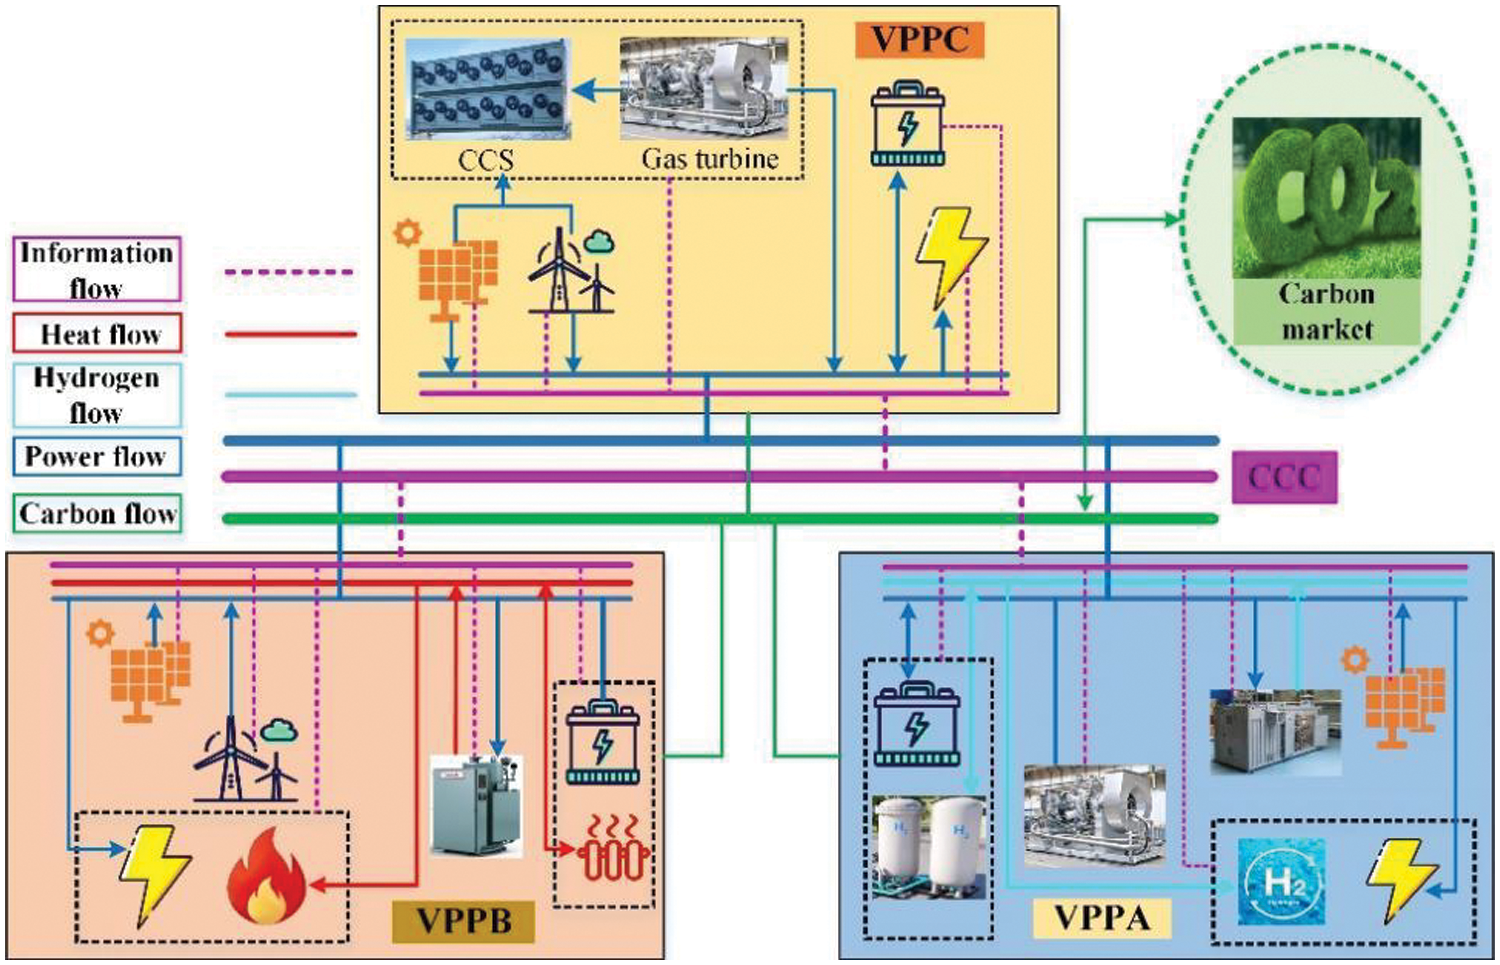
Figure 1: Multi-VPP electricity-carbon interaction framework
Compared with a single VPP, multi-VPP electricity interaction can comprehensively coordinate the unit output in each VPP, realize the power complementarity among VPPs and thus minimize the total cost of VPPC. Multi-VPP carbon quota interaction can further constrain the output of carbon-emitting generating units in VPP while maximizing the utilization of carbon quotas to reduce the cost of carbon trading. As a result, to make full use of electric energy and carbon quotas and make VPP more cost-effective, this paper comprehensively considers the interaction of electric energy and carbon quotas among multi-VPP.
Each VPP possesses an energy management system (EMS). Every transaction entity realizes the exchange of transaction information and the communication of scheduling instructions through EMS [28]. When VPPs are in operation, EMS first will receive unit information, including market electricity price, the output power of renewable energy and load. Next, EMS will transmit the received information to the centralized control center (CCC), which analyzes the information, formulates an optimal scheduling scheme and issues dispatch commands to EMS [29]. Finally, the interaction of electric energy and carbon quotas is accomplished according to dispatch commands. When the real-time power of one VPP is insufficient and that of the other VPP is excessive, the two VPPs can accomplish power trading through power transfer and complementarity. VPP will first meet the demands of its load. Then, surplus electricity can be supplied to other VPPs or sold to the grid. The trading model can also be applied to the interaction of carbon quotas among VPPs.
This paper considers three types of VPPs, of which VPPA is a heavy-load VPP, aggregating PV, GT, power-to-hydrogen device, electric energy storage and hydrogen tank. VPPB with rich new energy aggregates WT, PV, electric boiler, electric and thermal energy storage. VPPC is a balanced VPP that aggregates WT, PV, GT, carbon capture devices, and electric energy storage. When the load demand of VPP is too high and its energy is inadequate to meet the load demand, this VPP can obtain electric energy from other VPPs. When the carbon emission of VPP is less than the carbon quota allocated, the remaining emission quotas can be supplied to VPP with inadequate quotas.
2.1 Multi-VPP Interaction of Electricity
The interaction of electric energy provides a new energy source for VPP, which improves the reliability of the energy supply and realizes energy complementarity. Moreover, it also decreases the power of carbon-emitting generating units. The VPP electricity interaction can be expressed as follows:
where
2.2 Multi-VPP Interaction of Carbon Quotas
where
3 Integrated Demand Response Model
Demand response means that users actively adjust their energy consumption behaviour under the guidance of price and policy incentives to shave peaks, fill valleys, smooth the load curve and increase system stability and economy. Conventional demand response can deeply exploit the coordination capability between the power supply and load sides. However, it only considers the electricity user and does not involve other energy forms, which has certain limitations. IDR can be extended to a wide range of energy sources such as electricity, heat and hydrogen, which can help to make the most of the demand side regulation potential. This paper considers transferable and interruptible loads, involving three load users of electricity, heat and hydrogen. Transferable loads enable space and time shifting of load, shifting peak to valley load. Interruptible loads can reduce the peak-regulating pressure on generation units by reducing peak loads [30].
3.1 Electric and Hydrogen Load Demand Response
The shiftable load:
where
The innterruptable load:
where
where
In the paper, the building heat demand is regarded as the heat load. The transient heat balance equation of the building can be expressed by the following differential equation of temperature and heat power [31].
The external temperature can generally be considered a constant when solving the differential equation. The following equation can be obtained based on knowledge of first-order differential equations [32].
The expression for the heat load with respect to temperature can be obtained by simplifying Eq. (9), as follows:
where
Similar to electric load demand response, heat load demand response can also achieve the purpose of time and space transfer and interruption. This paper also considers transferable heat loads and interruptible heat loads, as follows:
where
3.3 User Comprehensive Satisfaction
Under the guidance of policy incentives, users can appropriately interrupt and transfer loads to obtain corresponding economic benefits [33]. But it should be noted that excessively regulating load may affect the user comprehensive satisfaction (UCS) [34]. Inspired by the literature [35], to fully measure the impact of IDR on user experience, this paper comprehensively considers the UCS of electric, heat and hydrogen load. The model is as follows:
where
4 Multi-VPP Electricity-Carbon Interaction Scheduling Model
This paper considers that WT, PV and GT can simultaneously provide energy for carbon capture systems. The output and operating energy consumption of the CCPP can be expressed as follows:
where
where
In addition to WT and PV supplying the carbon capture system, the residual electricity can still be sold to the external grid by VPP, as follows:
where
WT, PV and GT are required to meet maximum output constraints:
where
In addition, the GT is required to meet the constraint of the ramp rate, as follows:
where
where
This paper considers electrical energy storage units, thermal energy storage units and hydrogen storage tanks. Since the three energy storage device models are similar, a general model of the three is established, as follows:
where
The electro-hydrogen reaction is carried out in an electrolyzer and the hydrogen energy generated can be supplied to the hydrogen load or stored in a hydrogen storage tank. The power-to-hydrogen equipment has good chemical stability for a small park virtual power plant. The conversion efficiency can be approximated as a quadratic function of the nominal value of the input electrical power. The power-to-hydrogen model is as follows:
where
4.2.1 Multi-VPP Electricity-Carbon Interaction Model Objective Function
where
where
4.2.3 The Cost of Electricity Market Trading
where
4.2.4 The Cost of Demand Response
where
4.2.5 The Cost of Energy Storage Maintenance
where
4.2.6 The Cost of Carbon Trading
where
4.2.7 The Cost of Abandoned WT and PV
where
4.2.8 The Loss Cost of Power Interaction
where
4.3.1 Power Balance Constraints
Electric power balance constraint:
Heat power balance constraint:
Hydrogen power balance constraint:
4.3.2 Energy Storage Constraints
where
4.3.3 Power Interaction Constraint between VPPs
where
4.3.4 Carbon Quotas Constraint between VPPs
where
4.3.5 Transmission Power Constraints with the Grid
where
In this case study, VPPC contains three types of VPP, namely VPPA, VPPB and VPPC. VPPA is a load-type VPP. VPPB is an energy-type VPP. VPPC is a balanced VPP with carbon capture devices. The time-of-use (TOU) tariffs are shown in Fig. 2. The equipment parameters of VPPC are shown in Table 2. The base data for WT output, PV output, electric load, thermal load and hydrogen load are shown in Figs. 3–5. The relevant parameters of heat load can be referred to [23]. The maximum interruptible electric, heat and hydrogen load are 50, 20 and 20 kW, respectively. The maximum shiftable electric, heat and hydrogen load are 50, 20 and 30 kW, respectively. The model was constructed in MATLAB and solved using the CPLEX solver version 12.9. CPLEX is regarded as a well-known commercial solver to solve mathematics and engineering problems with accurate solving capability and fast computation times. In terms of problem type, CPLEX can choose different methods. For example, CPLEX can use the primal simplex or dual simplex to solve the linear and quadratic programs; It can also provide the branch and cut algorithm to solve the mixed integer programming model; It can use the Benders algorithm to solve the mixed-integer linear programs [36]. Since this paper only considers three VPPs, which is not a large-scale problem, CPLEX is used to solve the proposed dispatch model, which can accurately obtain the optimal solution in a short time [37].
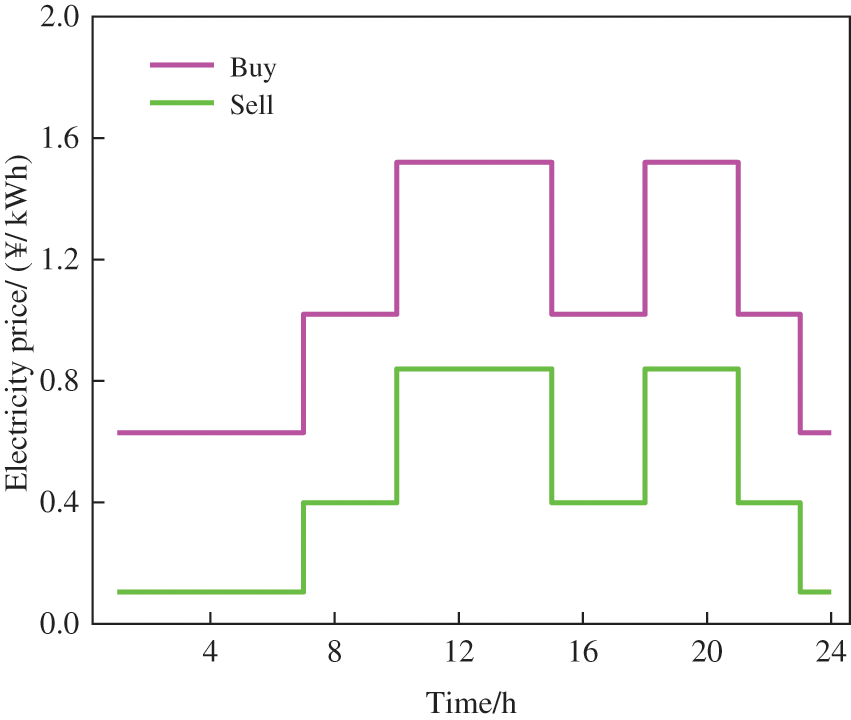
Figure 2: TOU tariffs
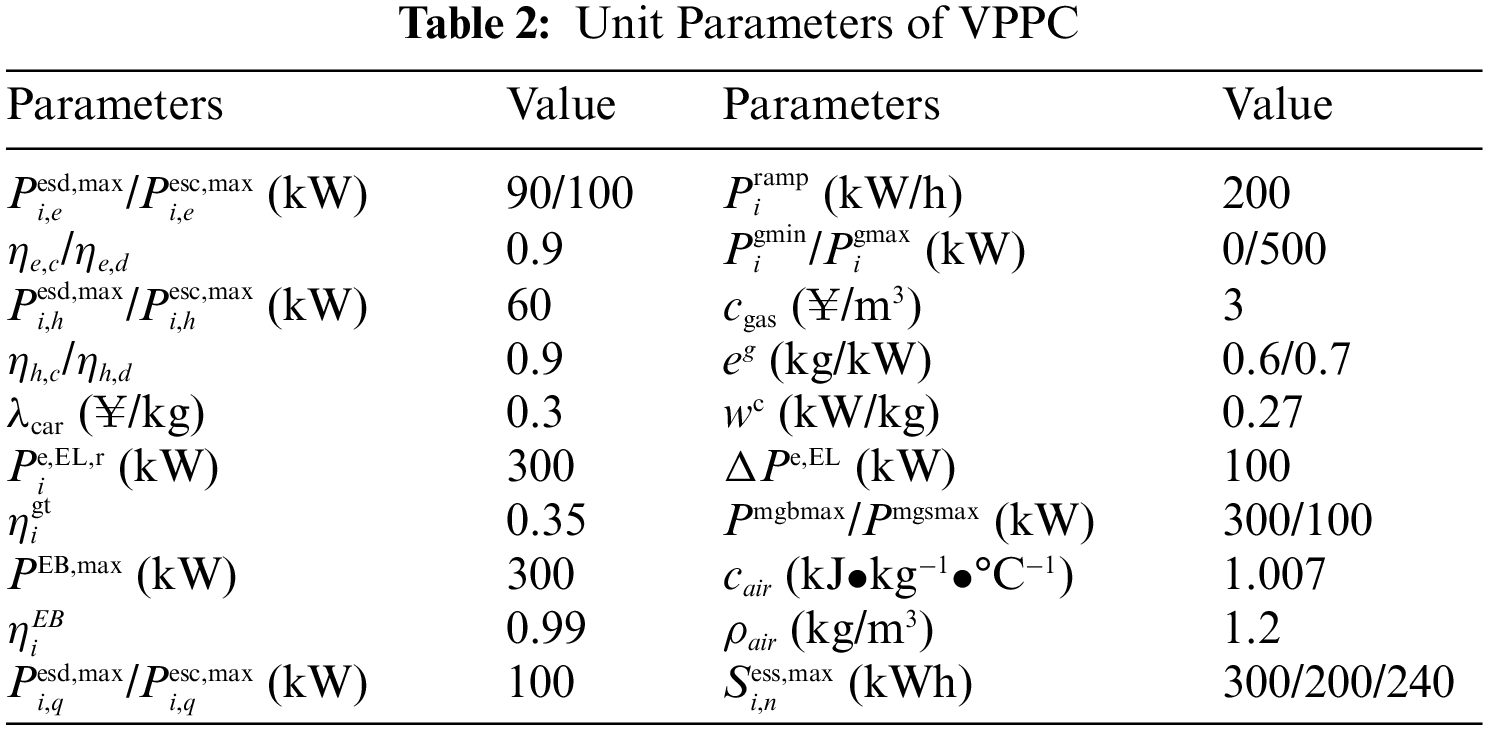
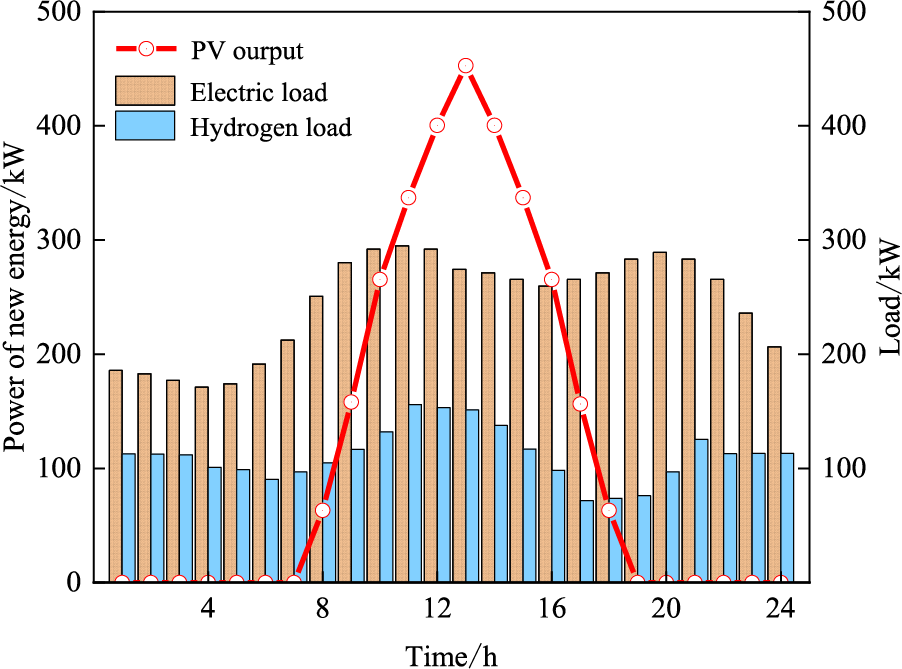
Figure 3: The predicted power of VPPA
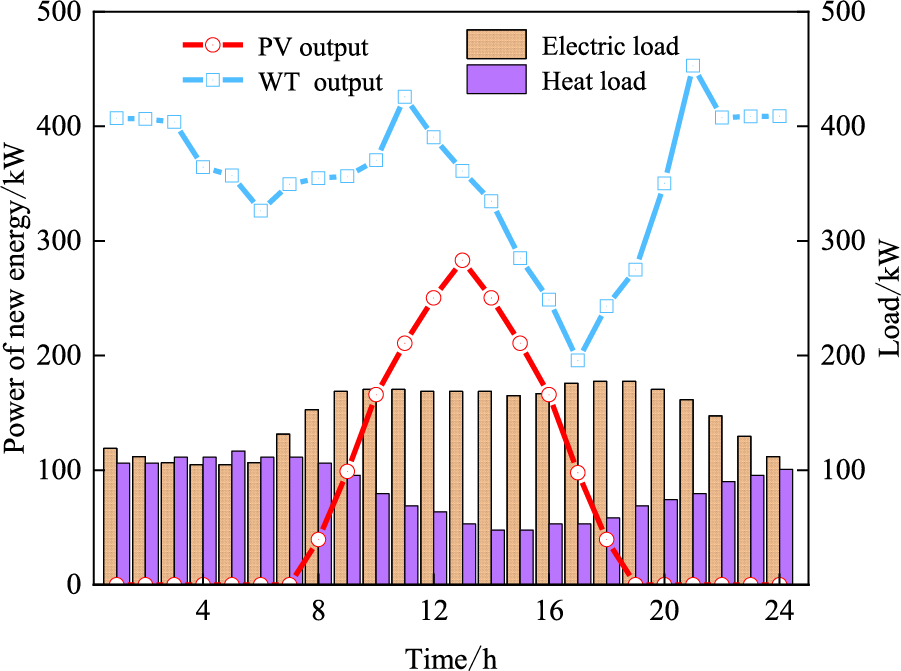
Figure 4: The predicted power of VPPB
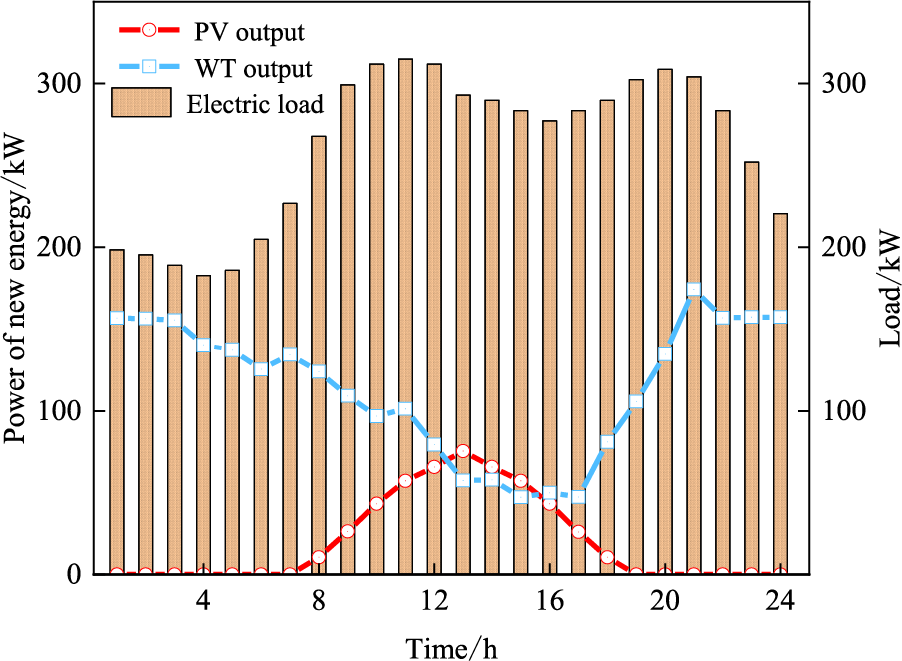
Figure 5: The predicted power of VPPC
5.2.1 Comparison and Analysis of Different Scenarios
Five scenarios are shown in Table 3 to demonstrate the advantages of the multi-VPP electricity-carbon interaction model proposed in the paper, as follows:
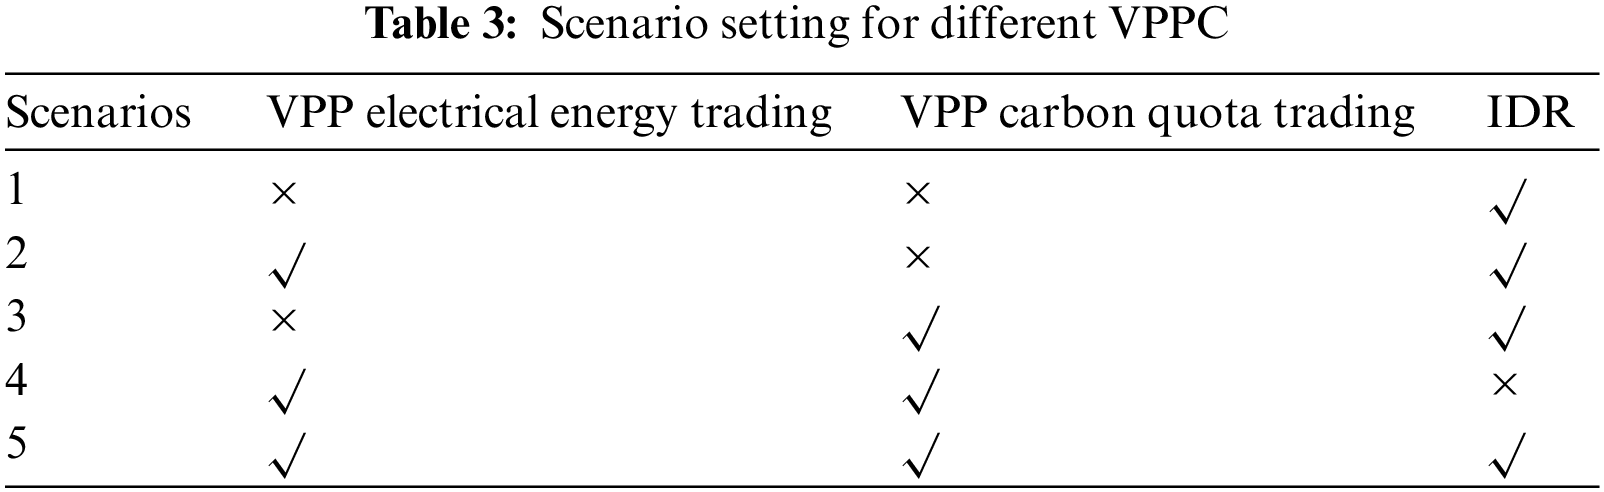
Table 4 shows the scheduling result of five scenarios. It can be seen that scenario 5 has the best economy, whereas scenario 1 has the worst economy. The total cost in scenario 2 is reduced by 1491.18 ¥ compared to scenario 1, and the cost of carbon trading is reduced by 737.06 ¥. The power of abandoned WT and PV is reduced from 2333.02 kW in scenario 1 to 0 kW in scenario 2, and the income obtained from the electricity market is decreased by 292.26 ¥. The analysis shows that scenario 2 considering the power interaction among VPPs reduces the power of GT in VPPA and VPPC. The power supplied to VPPA and VPPC comes from the excessive WT and PV in VPPB. As a result, the remaining new energy in VPPB can be consumed. Moreover, the feed-in tariff for VPPB is decreased as a result of power interaction. Consequently, there is a slight reduction in electricity market revenue. To sum up, the power interaction among VPPs can effectively improve the consumption level of new energy, reduce the output power of GT and promote the low-carbon and economic operation of VPPC.
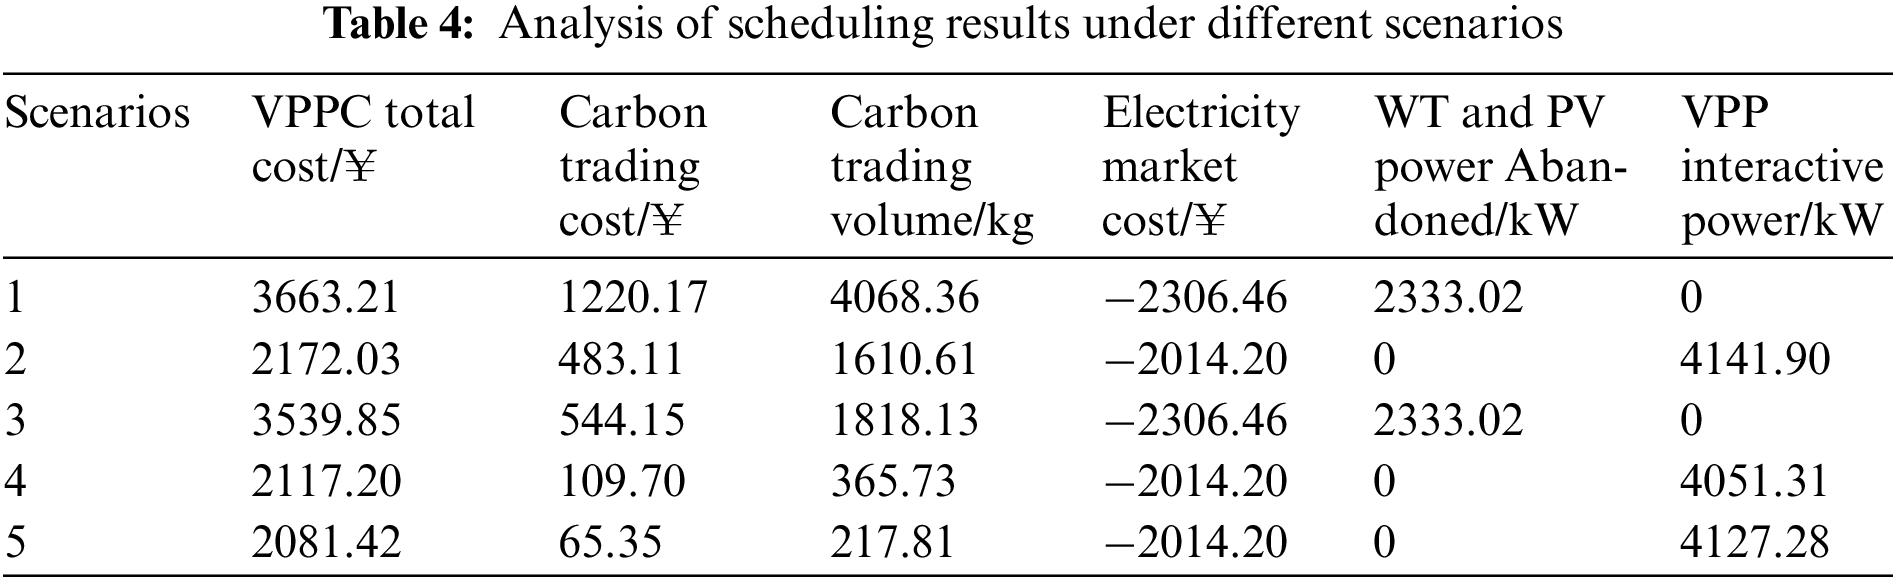
Compared with scenario 1, scenario 3, which considers the interaction of carbon quotas among VPPs, can effectively reduce the cost of carbon trading of VPPC, thus improving the economics of VPPC. The reason is that the carbon emission rights purchased by each VPP from the carbon market are reduced, the amount of CO2 that VPPC participates in carbon trading is reduced and the total operating cost of VPPC is reduced through the interaction of carbon quotas among VPPs.
The total cost of VPPC in scenario 5 is improved by 1.70% and the cost of carbon trading is decreased by 40.45% compared to scenario 4. It shows that the IDR changes the energy habits of different types of users, making them fit the power supply characteristics as closely as possible and reducing the power of GT. Hence, the economics of VPPC is improved and carbon emissions are reduced.
5.2.2 Analysis of Multi-VPP Electricity-Carbon Interaction
VPPA, VPPB, and VPPC are interconnected via contact lines. Through the interaction of electrical energy and carbon quotas among VPPs, the economics of VPPC is improved. This section analyzes the power interaction and carbon quota interaction among VPPs, as follows:
The result of the multi-VPP electrical energy interaction is shown in Fig. 6. It can be seen that during the entire dispatch period, the energy-type VPPB mainly transmits power to the load-type VPPA. During 9:00–16:00 and 19:00–21:00, VPPB supplies part of the power to the balanced VPPC. However, there is no electrical energy interaction during the rest of the time, and VPPC only transmits a small amount of electrical energy to the load-type VPPA at night. It shows that the renewable energy of VPPB is relatively abundant and its load demand is low. After meeting the load demand, the power of new energy is still available. Conversely, the load demand of VPPA is high and the renewable energy supply is insufficient. To reduce the total operating cost of VPPC, VPPB will choose to transfer the remaining power to VPPA, reducing the output of its GT. VPPC can meet its load demands at most times while maintaining the operating economics. However, at peak load times, it reduces the output of GT to improve the economics of the cluster through the power transmission of VPPB. In addition, the power of VPPB is supplied to the rest of VPP, which enhances its ability to absorb renewable energy and effectively decreases the penalty cost caused by the abandonment of WT and PV. It can be seen that the power complementarity among VPPs is effectively realized and the economics of VPPC is improved through the power interaction among the three VPPs.
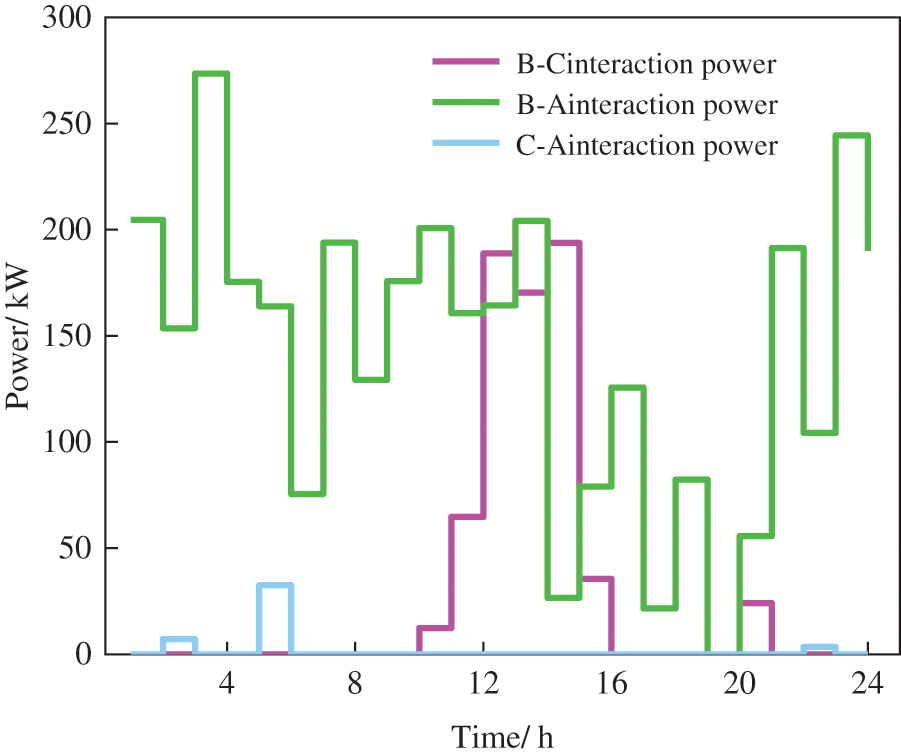
Figure 6: Multi-VPP electrical energy interaction
The interaction result of carbon quotas among multi-VPP is shown in Fig. 7. It can be seen that there is no carbon quota interaction between VPPB and other VPPs, and VPPC provides carbon quotas to VPPA in most periods. The reason is that new energy is sufficient in VPPB and the GT is not aggregated in VPPB that only sells electricity to the grid. As a result, VPPB will not generate CO2 during operation nor interact with the other two VPPs for carbon quotas. The carbon quota will be transferred from VPPC to VPPA because a carbon capture device aggregated in VPPC can capture a certain amount of CO2, resulting in a residual of the allocated carbon quotas. VPPC will provide the remaining carbon emission rights to VPPA with insufficient quotas, thereby reducing the cost of purchasing carbon quotas from the carbon market.
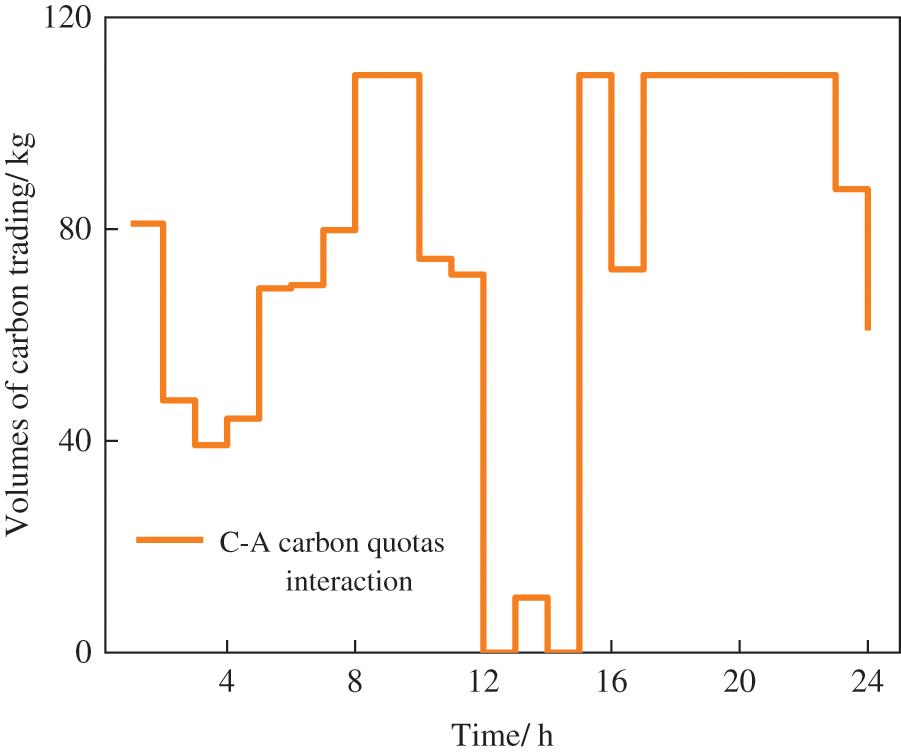
Figure 7: Interaction results of carbon quotas among multi-VPP
5.2.3 Analysis of Characteristics of IDR for Electric-Heat-Hydrogen Load
Demand response can change and smooth the load curve of users through incentives and policies to make it fit the power output characteristics, reducing the output power of GT and further improving the operating economics of VPPC. This section analyzes the impact of IDR on VPPC operation according to the change of load curve before and after demand response.
Figs. 8–10 compare the before and after results for the VPPC electric, heat and hydrogen load demand response. It can be seen that the hydrogen load of VPPA and the heat load of VPPB shift towards the middle period, while the electric load of VPPC moves to the sides. Combined with Fig. 6, it can be seen that VPPB transmits electrical power to VPPA at night, which indicates that the energy supply of VPPA is under pressure at that time, and VPPA will relieve the pressure on the system by shifting part of the load into the middle period. Meantime, to ensure the economical operation of the system, VPPB will transmit as much power as possible to VPPA, appropriately reducing its load at night and moving it into the middle period. Moreover, from 10:00 to 16:00, VPPB transmits part of its power to VPPC, indicating that VPPC is under a heavy energy supply burden during this period. Thus, VPPC chooses to move some of the power out to reduce the load demand during this time.
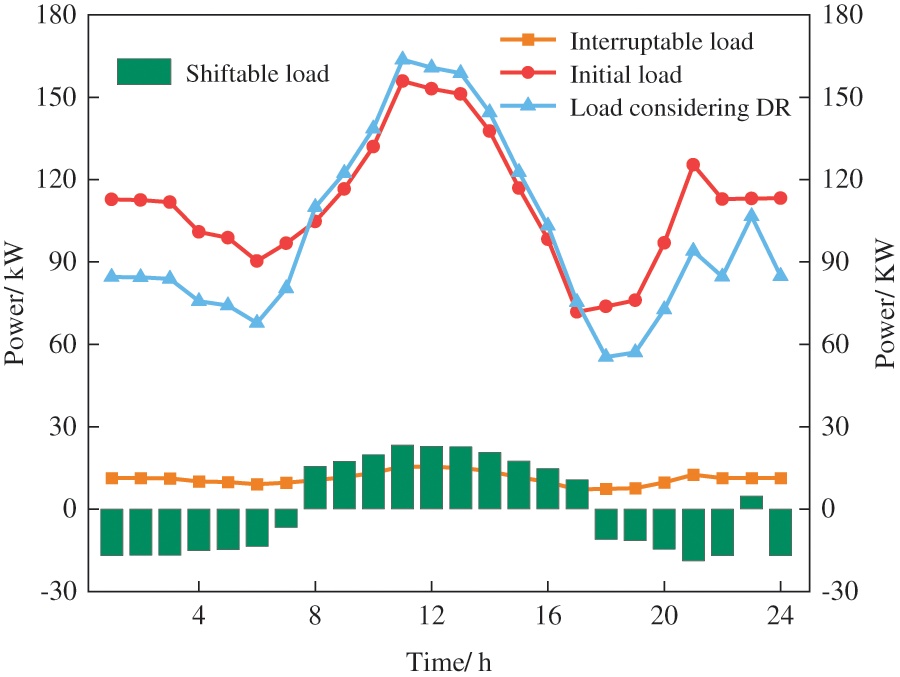
Figure 8: The result of hydrogen load demand response of VPPA
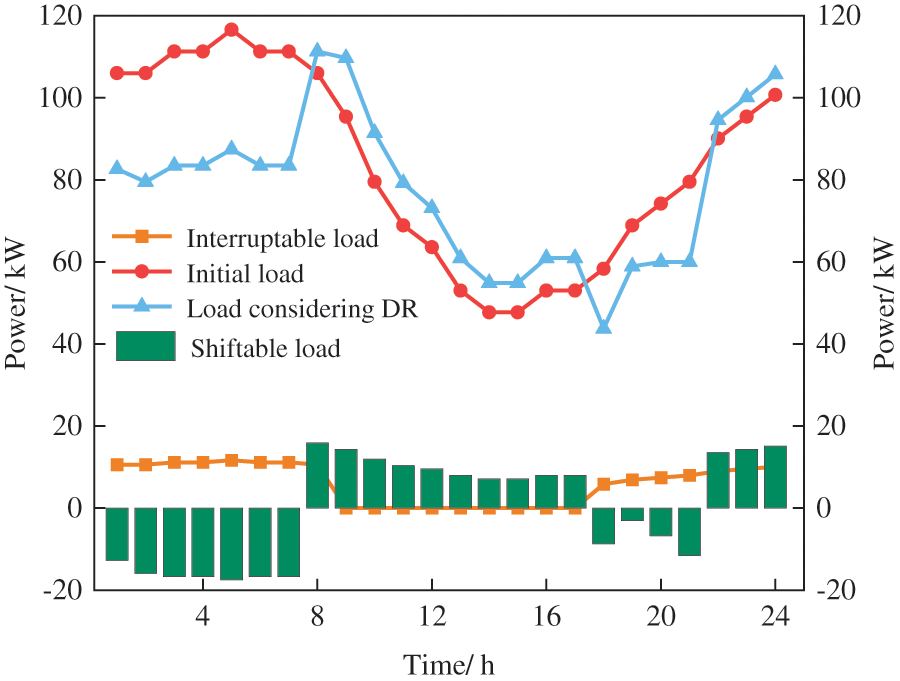
Figure 9: The result of heat load demand response of VPPB

Figure 10: The result of the electric load demand response of VPPC
The variation curve of UCS with time in the dispatch period is shown in Fig. 11. It can be seen that VPPC chooses to reduce its satisfaction of energy consumption by interrupting part of the load to relieve the pressure on the energy supply. From 18:00 to 21:00, the UCS reaches the minimum, indicating that all interruptible loads participate in demand response to alleviate the pressure on the energy supply.
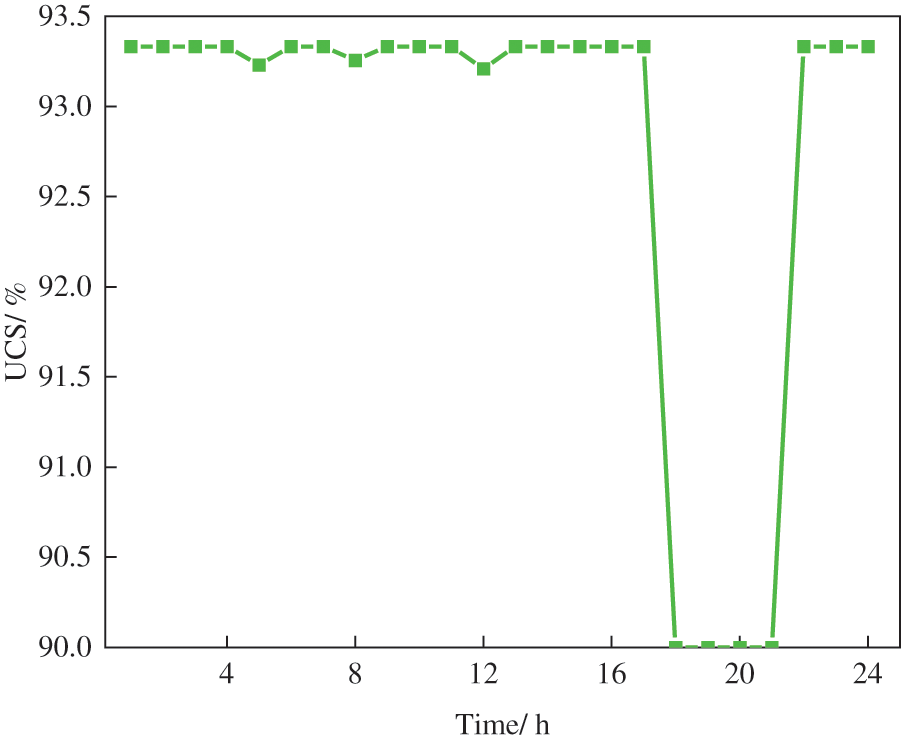
Figure 11: VPPC electricity-heat-hydrogen UCS curve
To further evaluate the impact of electricity-heat-hydrogen IDR on VPPC, 21 different electricity-heat-hydrogen IDR ratios are set to analyze the changes in the total cost of VPPC, carbon emissions and UCS. The simulation result is shown in Fig. 12. The IDR proportion is adjusted in increments of 5%, starting from 0% and increasing to 100% of the preset load value sequentially.
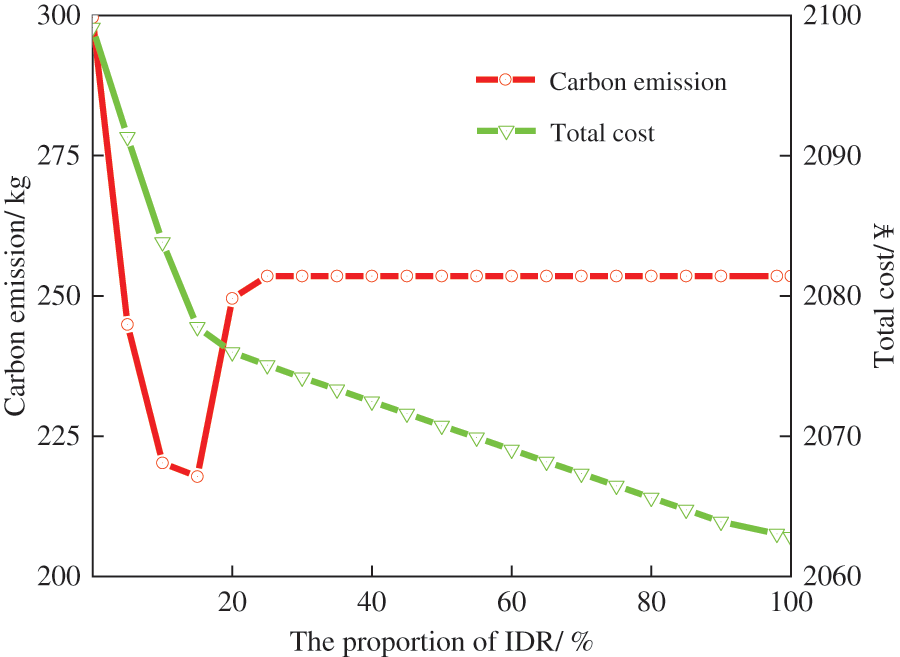
Figure 12: The effect of different IDR ratios on VPPC
As shown in Fig. 12, as the proportion of IDR increases, the operating cost of VPPC gradually decreases, and the system’s carbon emissions show a trend of first decreasing, then increasing and finally stabilizing. This is because the IDR changes the electricity consumption habits of the original customers, making the load distribution more in line with the power supply characteristics and reducing the output of GT. Thus, the total carbon emissions of VPPC gradually decrease. However, as the proportion of IDR increases consistently, VPPC will increase the output of GT appropriately and reduce the electricity purchased during peak hours to ensure economic operation, thus leading to increased carbon emissions. When the proportion of IDR reaches 25%, the carbon emissions of VPPC will level out.
To sum up, the proportion of IDR has an important impact on the operating cost and carbon emissions of VPPC. Thus, reasonably selecting the IDR ratio will help improve the economics and low-carbon performance of VPPC.
The value of UCS is an important indicator for evaluating the energy experience of users. The ratios of different demand responses are set to analyze the impact of different response levels on the UCS, as shown in Fig. 13. Note that the UCS here refers to the average value of UCS within a dispatch cycle.
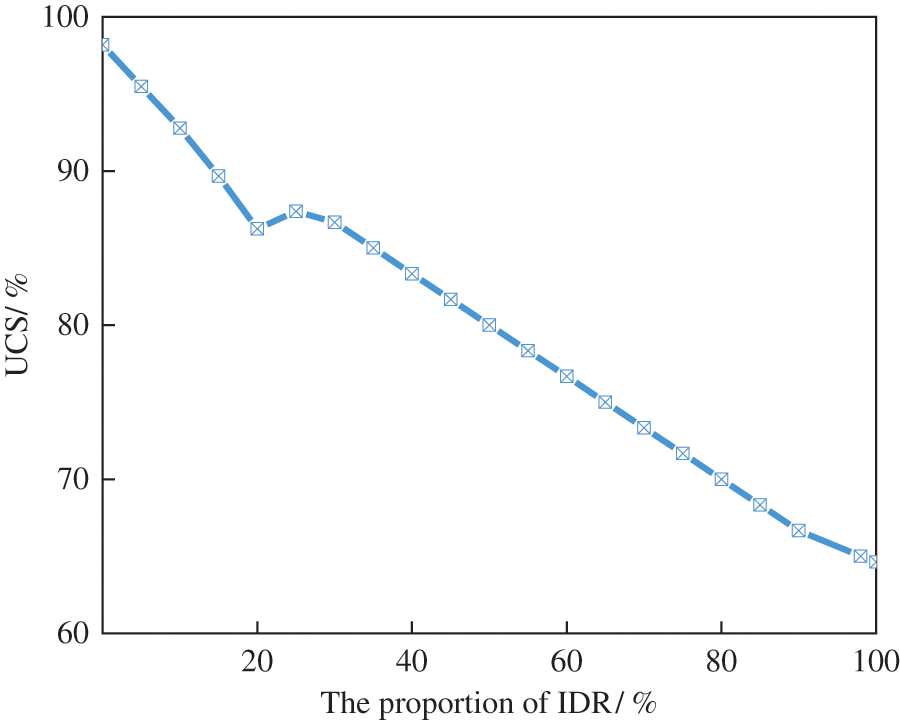
Figure 13: The impact of the IDR ratio on UCS
It can be seen from Fig. 13 that as the proportion increases, the UCS shows an almost linear downward trend. The increase in the proportion of IDR reduces the energy supply pressure of VPPC. However, it reduces the comfort of users on the load side. According to Figs. 12 and 13, it can be found that the UCS and the operating cost of VPPC are gamified.
5.2.4 Analysis of the Effectiveness of Different Types of Demand Response
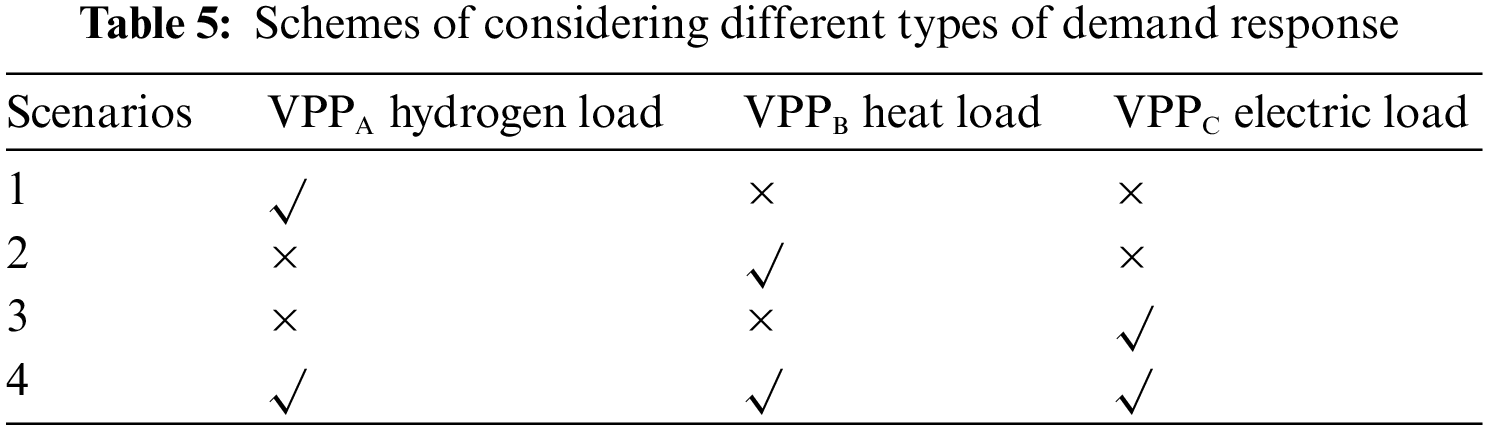
To explore the impact of the different load responses on system operating costs, the volume of carbon trading and energy satisfaction, four scenarios are set up for comparison, as shown in Table 5.
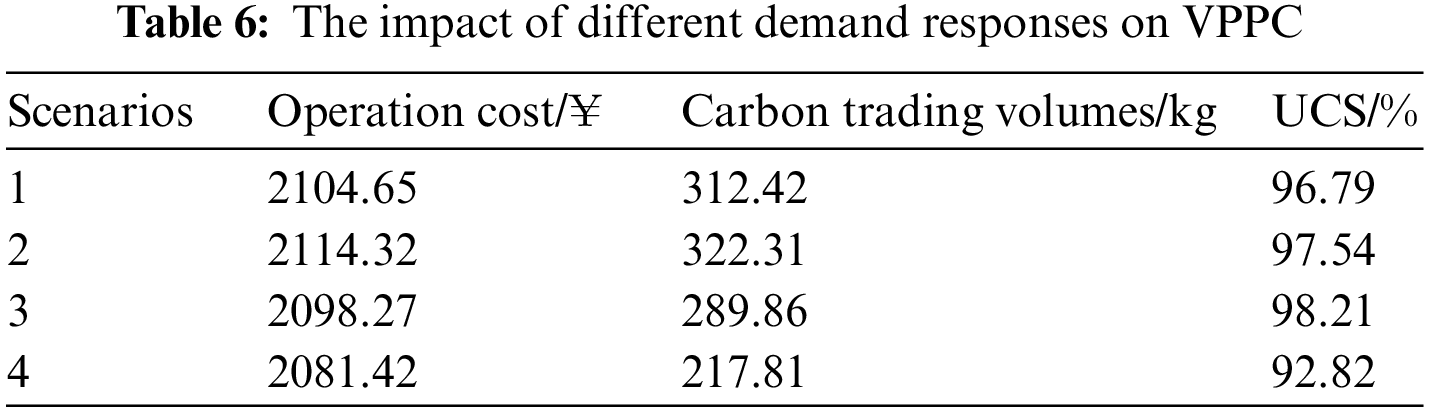
The impact of different demand responses on VPPC is shown in Table 6. Compared to scenarios 1 and 2, scenario 3 considering the electric load demand response of VPPC only can minimize the operating cost and carbon trading cost of VPPC while maintaining a high level of user satisfaction. Therefore, VPPC electrical load demand response has the greatest impact on the economic and low-carbon operation of VPPC. Compared with other scenarios, scenario 4 considers IDR, which reduces the cost of carbon trading and minimizes the operating cost, but the value of UCS is slightly reduced. It is because scenario 4 chooses to sacrifice user satisfaction to reduce the operating cost of VPPC.
5.2.5 Analysis of Operating Modes of Different CCPP
To prove the effectiveness of the new operation mode of WT-PV-CCPP proposed in the paper, two different operation modes are considered:
Case 1: Considering the operation mode of conventional CCPP
Case 2: Considering the new operation mode of WT-PV-CCPP
The results of VPPC operation in two cases are shown in Table 7. Compared with case 1, the total operating cost and carbon trading cost of VPPC can be reduced effectively, and the UCS is increased in case 2. It is because WT and PV can provide energy for CCPP, reducing the amount of electricity GT supplies to the carbon capture system in case 2. The excessive electricity of GT can be supplied to the load, which reduces the interrupted load and then increases the value of UCS. As a result, the operation mode of the proposed WT-PV-CCPP is superior to the conventional operation mode.
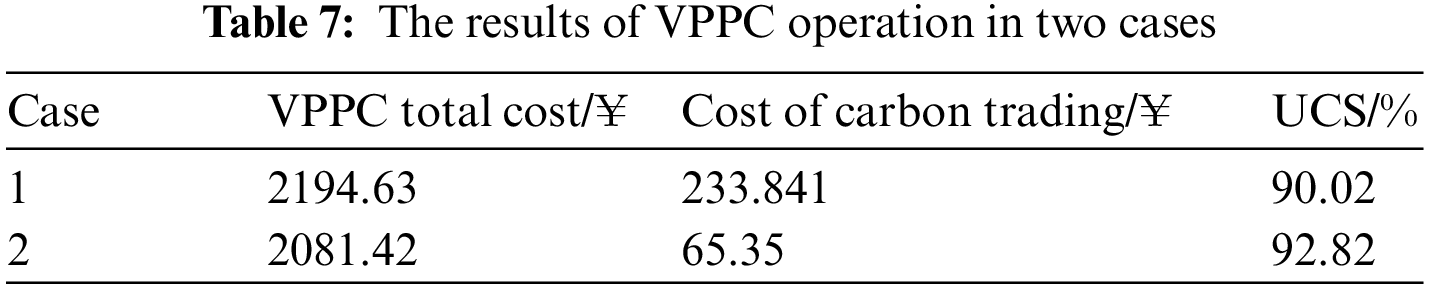
Fig. 14 shows the effect of the capacity of the carbon capture system on the operating cost and carbon emissions of VPPC. It can be seen that with the increase of the carbon capture capacity, the carbon emissions of VPPC present a trend of rising and then decreasing. It shows that the access of the carbon capture system raises the demand of electric energy. Thus, the system will increase the output of GT to ensure a balance of supply and demand, which will lead to a rise in carbon emissions. When the capacity of the carbon capture system is at a low level, the ability to capture carbon is insufficient and the amount of captured CO2 is lower than the CO2 generated by GT. The carbon emission of the system peak when the carbon capture capacity is increased to 30 kW. After capacity exceeds 30 kW, the ability to capture carbon exceeds the carbon emission generated by GT and thus the carbon emission of VPPC gradually decreases. With the increase of the carbon capture capacity, the carbon emissions of VPPC show a trend of decreasing first and then stabilizing. The increase in the carbon capture capacity may cause GT to increase its power output, thereby reducing the purchase of electricity from the grid. However, as the carbon capture capacity increases consistently, the carbon emission and carbon capture of the system will reach a dynamic balance to ensure the economics of VPPC.
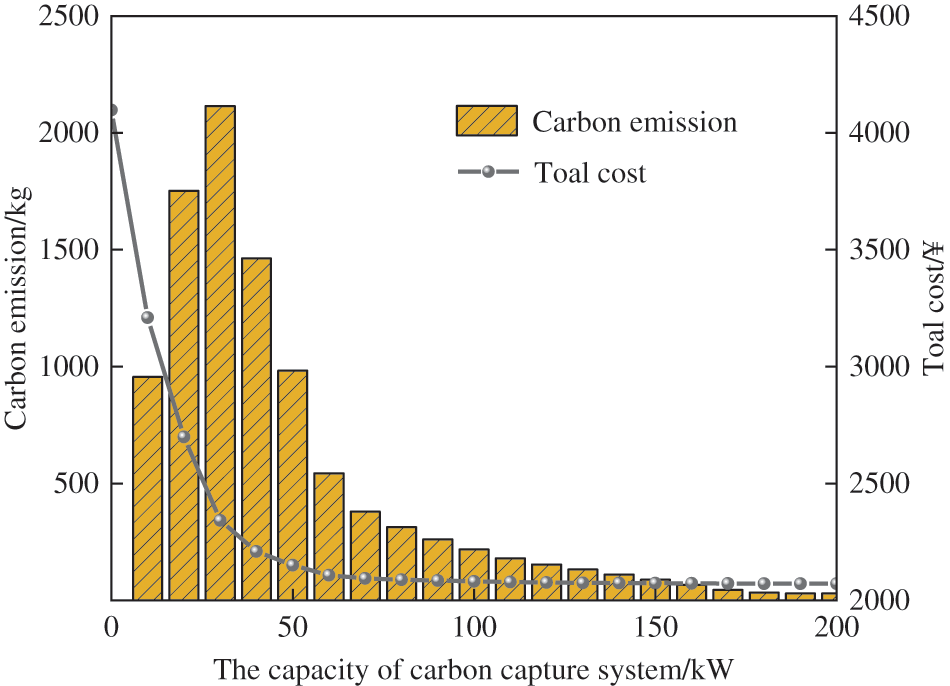
Figure 14: Effect of the power of the carbon capture system on the VPPC
Fig. 15 shows the effect of carbon capture capacity on the UCS. It can be seen that as the carbon capture capacity increases, the UCS of VPPC shows an upward trend. It shows that GT will appropriately increase the power when the carbon capture capacity increases, thereby reducing interruptable load and improving the UCS.
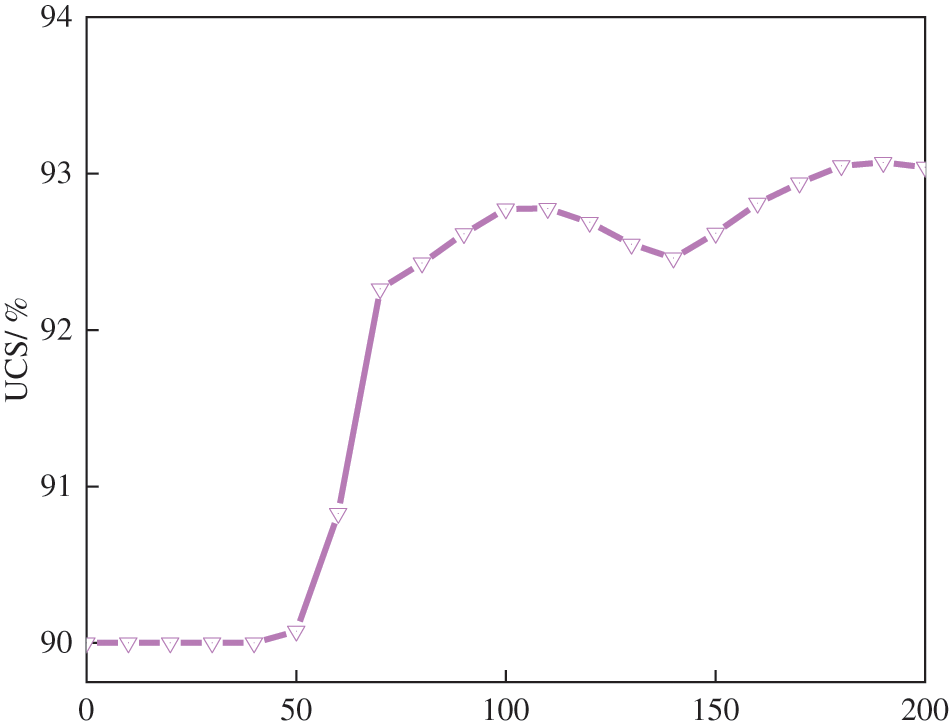
Figure 15: The effect of carbon capture capacity on the UCS
In this paper, a multi-VPP electricity-carbon interaction model considering integrated demand response has been proposed. Aiming at the limitation of independent operation of VPP and coordinated operation problems among VPPs, this paper considers the sharing of electric energy and carbon quota among multi-VPP. In addition, new operation modes of CCPP and IDR are considered to further constrain carbon emissions of VPPC. The contributions and findings of this paper can be summarized as follows:
1) The multi-VPP electricity-carbon interaction model proposed in this paper can effectively improve the economics and decarbonization of VPPC. Through the interconnection of electric energy, the complementarity of different VPP electric energy is realized. VPP with relatively sufficient new energy can supply power to VPP with heavy loads, reducing power purchased from the grid while promoting new energy consumption. Moreover, through the interaction of carbon quotas, the complementarity of carbon quotas among VPPs is realized. Both power sharing and carbon quota sharing benefit system economics and carbon reduction.
2) Considering the IDR of electricity, heat and hydrogen, this paper fully exploits the coordination capability of the source and load side and hence improves the economics of VPPC. The comparisons of different scenarios show that the electric load response of VPPC has the greatest impact on the operating cost and carbon emissions. In addition, setting an appropriate IDR radio can effectively reduce carbon emissions.
3) The operation mode of the proposed WT-PV-CCPP has better environmental and economic benefits. Compared with the conventional mode of CCPP, the cost of carbon trading is reduced by 168.49 ¥, and the operating cost is decreased by 113.24 ¥ in the proposed WT-PV-CCPP mode.
The research content of this paper still has some shortcomings. The VPPC studied in the paper contains only three VPPs, namely, the electricity-carbon interaction among three VPPs. However, in reality, the number of VPPs is far more than three. As a result, how should they interact with each other when the number of VPPs exceeds hundreds or even thousands? Can our present interaction strategy be applied to this model? In the follow-up work, we will explore and discuss it in detail.
Acknowledgement: None.
Funding Statement: This work was supported by the National Natural Science Foundation of China (NSFC) (Grant No. 52107107).
Author Contributions: Study conception and design: Guangyong Hu, Shiwei Su, Wei Xiong; Data collection: Guangyong Hu, Xin Li, Xianghua Li; Analysis and interpretation of results: Guangyong Hu; Draft manuscript preparation: Guangyong Hu; All authors reviewed the results and approved the final version of the manuscript.
Availability of Data and Materials: The authors confirm that the data supporting the findings of this study are available within the article.
Conflicts of Interest: The authors declare that they have no conflicts of interest to report regarding the present study.
References
1. Yi, Z., Ning, Y., Jing, B. (2022). Robust optimal dispatch for virtual power plant considering green certificate trading. 2022 IEEE 5th International Electrical and Energy Conference (CIEEC), pp. 4611–4617. Nanjing, China. https://doi.org/10.1109/CIEEC54735.2022.9846361 [Google Scholar] [CrossRef]
2. Vahedipour-Dahraie, M., Rashidizadeh-Kermani, H., Parente, M., Shafie-Khah, M., Siano, P. (2022). Investigating the impact of external demand response flexibility on the market power of strategic virtual power plant. IEEE Access, 10, 84960–84969. https://doi.org/10.1109/ACCESS.2022.3197908 [Google Scholar] [CrossRef]
3. Naval, N., Yusta, J. M. (2021). Virtual power plant models and electricity markets—A review. Renewable and Sustainable Energy Reviews, 149, 111393. https://doi.org/10.1016/j.rser.2021.111393 [Google Scholar] [CrossRef]
4. Dabbagh, S., Sheikh-EI-Eslami, M. (2015). Risk-based profit allocation to DERs integrated with a virtual power plant using cooperative Game theory. Electric Power Systems Research, 121, 368–378. https://doi.org/10.1016/j.epsr.2014.11.025 [Google Scholar] [CrossRef]
5. Rouzbahani, H., Karimipour, H., Lei, L. (2021). A review on virtual power plant for energy management. Sustainable Energy Technologies and Assessments, 47, 101370. https://doi.org/10.1016/j.seta.2021.101370 [Google Scholar] [CrossRef]
6. Yang, D., Yang, H., Tang, R. (2019). Trading decision for multiple virtual power plants considering power sharing. 2019 IEEE 3rd Conference on Energy Internet and Energy System Integration (EI2), pp. 1958–1963. Changsha, China. https://doi.org/10.1109/EI247390.2019.9061808 [Google Scholar] [CrossRef]
7. Li, X., Zhao, D., Guo, B. (2018). Decentralized and collaborative scheduling approach for active distribution network with multiple virtual power plants. Energies, 11(11), 3208. https://doi.org/10.3390/en11113208 [Google Scholar] [CrossRef]
8. Liu, X. (2022). Research on optimal dispatch method of virtual power plant considering various energy complementary and energy low carbonization. International Journal of Electrical Power & Energy Systems, 136, 107670. https://doi.org/10.1016/j.ijepes.2021.107670 [Google Scholar] [CrossRef]
9. Li, Y., Zhou, L., Gao, Z., He, K., Cai, H. et al. (2021). Optimal dispatch of multi-virtual power plants based on grey wolf optimization algorithm. Journal of Physics: Conference Series, 10, 2080. https://doi.org/10.1088/1742-6596/2005/1/012080 [Google Scholar] [CrossRef]
10. Yan, Q., Zhang, M., Lin, H., Li, W. (2022). Two-stage adjustable robust optimal dispatching model for multi-energy virtual power plant considering multiple uncertainties and carbon trading. Journal of Cleaner Production, 336, 130400. https://doi.org/10.1016/j.jclepro.2022.130400 [Google Scholar] [CrossRef]
11. Huang, Y., Wang, Y., Liu, N. (2022). Low-carbon economic dispatch and energy sharing method of multiple integrated energy system from the perspective of system of systems. Energy, 244, 122717. https://doi.org/10.1016/j.energy.2021.122717 [Google Scholar] [CrossRef]
12. Yang, D., Xu, Y., Liu, X., Jiang, C., Nie, F. et al. (2022). Economic-emission dispatch problem in integrated electricity and heat system considering multi-energy demand response and carbon capture Technologies. Energy, 253, 124153. https://doi.org/10.1016/j.energy.2022.124153 [Google Scholar] [CrossRef]
13. Zhang, Z., Du, J., Zhu, K., Guo, J., Li, M. et al. (2022). Optimization scheduling of virtual power plant with carbon capture and waste incineration considering P2G coordination. Energy Reports, 8, 7200–7218. https://doi.org/10.1016/j.egyr.2022.05.027 [Google Scholar] [CrossRef]
14. Fu, C., Guo, M., Liu, P., Mo, R. (2021). Optimal Operation strategy of low-carbon integrated energy system considering power to gas and carbon capture technology. 2022 IEEE 5th International Electrical and Energy Conference (CIEEC), pp. 404–409. Nanjing, China. https://doi.org/10.1109/CIEEC54735.2022.9846157 [Google Scholar] [CrossRef]
15. Zhang, Y., Zhang, X., Ng, T. S. (2021). Analysis of the carbon-gas-electricity trigger price for carbon capture and power-to-gas coupling system. Sustainable Production and Consumption, 28, 1164–1177. https://doi.org/10.1016/j.spc.2021.07.035 [Google Scholar] [CrossRef]
16. Liu, X., Li, X., Tian, J., Cao, H. (2021). Low-carbon economic dispatch of integrated electricity and natural gas energy system considering carbon capture device. Transactions of the Institute of Measurement and Control, 336, 130400. https://doi.org/10.1177/01423312211060572 [Google Scholar] [CrossRef]
17. Yang, P., Jiang, H., Liu, C., Kang, L., Wang, C. (2023). Coordinated optimization scheduling operation of integrated energy system considering demand response and carbon trading mechanism. International Journal of Electrical Power & Energy Systems, 147, 108902. https://doi.org/10.1016/j.ijepes.2022.108902 [Google Scholar] [CrossRef]
18. Tan, C., Wang, J., Geng, S., Pu, L., Tan, Z. (2021). Three-level market optimization model of virtual power plant with carbon capture equipment considering copula-CVaR theory. Energy, 237, 121620. https://doi.org/10.1016/j.energy.2021.121620 [Google Scholar] [CrossRef]
19. Wang, Y., Ai, X., Tan, Z., Yan, L., Liu, S. (2016). Interactive dispatch modes and bidding strategy of multiple virtual power plants based on demand response and game theory. IEEE Transactions on Smart Grid, 7(1), 510–519. https://doi.org/10.1109/TSG.2015.2409121 [Google Scholar] [CrossRef]
20. Cao, J., Zheng, Y., Han, X., Yang, D. (2022). Two-stage optimization of a virtual power plant incorporating with demand response and energy complementation. Energy Reports, 8, 7374–7385. https://doi.org/10.1016/j.egyr.2022.05.255 [Google Scholar] [CrossRef]
21. Zhang, S., Li, W., Li, Z., Zhang, X., Lu, Z. et al. (2023). Two-stage low-carbon economic dispatch of integrated demand response-enabled integrated energy system with ladder-type carbon trading. Energy Engineering, 120, 181–199. https://doi.org/10.32604/ee.2022.022228 [Google Scholar] [CrossRef]
22. Gong, H., Rooney, T., Akeyo, O. M., Branecky, B. T., Ionel, D. M. (2021). Equivalent electric and heat-pump water heater models for aggregated community-level demand response virtual power plant controls. IEEE Access, 9, 141233–141244. https://doi.org/10.1109/ACCESS.2021.3119581 [Google Scholar] [CrossRef]
23. Liu, N., He, L., Yu, X., Ma, L. (2018). Multiparty energy management for grid-connected microgrids with heat- and electricity-coupled demand response. IEEE Transactions on Industrial Informatics, 14(5), 1887–1897. https://doi.org/10.1109/TII.2017.2757443 [Google Scholar] [CrossRef]
24. Lu, J., Liu, T., He, C., Nan, L., Hu, X. (2021). Robust day-ahead coordinated scheduling of multi-energy systems with integrated heat-electricity demand response and high penetration of renewable energy. Renewable Energy, 178, 466–482. https://doi.org/10.1016/j.renene.2021.05.164 [Google Scholar] [CrossRef]
25. Yang, H., Li, M., Jiang, Z., Zhang, P. (2020). Multi-time scale optimal scheduling of regional integrated energy systems considering integrated demand response. IEEE Access, 8, 5080–5090. https://doi.org/10.1109/ACCESS.2019.2963463 [Google Scholar] [CrossRef]
26. Ali, S., Rehman, A., Wadud, Z., Khan, I., Murawwat, S. et al. (2022). Demand response program for efficient demand-side management in smart grid considering renewable energy sources. IEEE Access, 10, 53832–53853. https://doi.org/10.1109/ACCESS.2022.3174586 [Google Scholar] [CrossRef]
27. Zheng, S., Sun, Y., Qi, B. (2022). Incentive-based integrated demand response considering S&C effect in demand side with incomplete information. IEEE Transactions on Smart Grid, 13(6), 4465–4482. https://doi.org/10.1109/TSG.2022.3149959 [Google Scholar] [CrossRef]
28. Nosratabadi, S. M., Hooshmand, R., Gholipour, E. (2017). A comprehensive review on microgrid and virtual power plant concepts employed for distributed energy resources scheduling in power systems. Renewable and Sustainable Energy Reviews, 67, 341–363. https://doi.org/10.1016/j.rser.2016.09.025 [Google Scholar] [CrossRef]
29. Morales-Paredes, H., Bonaldo, J., Pomilio, J. (2018). Centralized control center implementation for synergistic operation of distributed multifunctional single-phase grid-tie inverters in a microgrid. IEEE Transactions on Industrial Electronics, 65(10), 8018–8029. https://doi.org/10.1109/TIE.2018.2801780 [Google Scholar] [CrossRef]
30. Yang, H., Yu, Q., Huang, X., Niu, B., Qi, M. (2021). Demand responsive market decision-makings and electricity pricing scheme design in low-carbon energy system environment. Energy Engineering, 118, 285–301. https://doi.org/10.32604/EE.2021.013734 [Google Scholar] [CrossRef]
31. Li, Y., Wang, C., Li, G., Chen, C. (2021). Optimal scheduling of integrated demand response-enabled integrated energy systems with uncertain renewable generations: A Stackelberg game approach. Energy Conversion and Management, 235, 113996. https://doi.org/10.1016/j.enconman.2021.113996 [Google Scholar] [CrossRef]
32. Mao, N., Hao, J., He, T., Song, M. J., Xu, Y. J. et al. (2019). PMV-based dynamic optimization of energy consumption for a residential task/ambient air conditioning system in different climate zones. Renewable Energy, 142, 41–54. https://doi.org/10.1016/j.renene.2019.04.099 [Google Scholar] [CrossRef]
33. Li, Y., Han, M., Yang, Z., Li, G. (2021). Coordinating flexible demand response and renewable uncertainties for scheduling of community integrated energy systems with an electric vehicle charging station: A Bi-level approach. IEEE Transactions on Sustainable Energy, 12(4), 2321–2331. https://doi.org/10.1109/TSTE.2021.3090463 [Google Scholar] [CrossRef]
34. Sheng, H., Wang, C., Li, B., Liang, J., Yang, M. et al. (2021). Multi-timescale active distribution network scheduling considering demand response and user comprehensive satisfaction. IEEE Transactions on Industry Applications, 57(3), 1995–2005. https://doi.org/10.1109/TIA.2021.3057302 [Google Scholar] [CrossRef]
35. Wang, Y., Ma, Y., Song, F., Ma, Y., Qi, C. et al. (2020). Economic and efficient multi-objective operation optimization of integrated energy system considering electro-thermal demand response. Energy, 205, 118022. https://doi.org/10.1016/j.energy.2020.118022 [Google Scholar] [CrossRef]
36. Feng, X., Lu, Y., Huo, Q., Yin, J., Qiu, P. et al. (2022). Flexible low-carbon optimal dispatch of honeycombed active distribution network. Energies, 15(19), 7107. https://doi.org/10.3390/en15197107 [Google Scholar] [CrossRef]
37. Anand, R., Aggarwal, D., Kumar, V. (2017). A comparative analysis of optimization solvers. Journal of Statistics and Management Systems, 20(4), 623–635. https://doi.org/10.1080/09720510.2017.1395182 [Google Scholar] [CrossRef]
Cite This Article
 Copyright © 2023 The Author(s). Published by Tech Science Press.
This work is licensed under a Creative Commons Attribution 4.0 International License , which permits unrestricted use, distribution, and reproduction in any medium, provided the original work is properly cited.
 Downloads
 Citation Tools