
 Submit a Paper
 Propose a Special lssue
 Open Access
ARTICLE

Conductor Arrangement and Phase Sequence Optimization Scheme for 500 kV Four-Circuit Transmission Lines on Same Tower
1 Power Grid Design and Research Institute, Shandong Electric Power Engineering Consulting Institute Co., Ltd., Jinan, 250012, China
2 School of Electrical Engineering, Shandong University, Jinan, 250061, China
* Corresponding Author: Hang Geng. Email:
Energy Engineering 2023, 120(10), 2287-2306. https://doi.org/10.32604/ee.2023.029140
Received 03 February 2023; Accepted 17 May 2023; Issue published 28 September 2023
 View Full Text
 Download PDF
Abstract
The four-circuit parallel line on the same tower effectively solves the problems faced by the line reconstruction and construction under the condition of the increasing shortage of transmission corridors. Optimizing the conductor and phase sequence arrangement of multiple transmission lines is conducive to improving electromagnetic and electrostatic coupling caused by electromagnetic problems. This paper uses the ATP-EMTP simulation software to build a 500 kV multi-circuit transmission line on the same tower. It stimulates the induced voltage and current values of different line lengths, tower spacing, vertical and horizontal spacing between different circuits, phase sequence arrangement, and nominal tower height. Moreover, use the BP neural network optimized by a genetic algorithm to predict the induced voltage and current under the unknown conductor and phase sequence arrangement. Finally, based on multi-objective particle swarm algorithm to construct the optimization model of conductor arrangement scheme of overhead transmission line, combined with electromagnetic environment control index, determine the optimal conductor arrangement scheme by the size of particle fitness function, a significant reduction in induced voltages and currents between transmission lines and the four-circuit conductor layout scheme meeting the requirements of the electromagnetic environment is obtained, which provides a reference for the tower design of the transmission station project.Keywords
With the continuous advancement of urbanization, the economy along the transmission lines is developing rapidly, and the shortage of land resources seriously restricts the erection of transmission lines, an engineering problem that needs to be solved urgently. Using parallel transmission lines with the same tower can effectively alleviate the contradiction between the large occupied area of transmission lines and the insufficient transmission capacity [1], significantly improve the utilization rate of unit transmission lines, and reduce the cost of long-distance erection of high-voltage transmission lines. The transmission method of multiple circuits on the same tower plays an important role in the electric power system [2]. However, the 500 kV parallel lines with the same tower with a length of tens of kilometers face technical problems such as wire arrangement and line parameter selection. Therefore, from optimizing the spatial arrangement and arrangement of conductors, it is of great engineering significance to use the ATP-EMTP [3] program for simulation calculation and to use artificial neural networks and optimization algorithms to implement prediction and optimization design.
The arrangement of multi-circuit transmission lines mainly includes six factors: transmission line length, line tower spacing, vertical spacing and horizontal spacing between different circuits, phase sequence arrangement, and tower height. Reference [4] used the electromagnetic transient calculation software ATP-EMTP to calculate the induced voltages and currents for each operating condition thereby modifying the grounding switch, but without considering the effects brought about by the line alignment scheme. The main prediction models commonly used in power systems are linear regression models and artificial neural networks. Reference [5] fitted the parameters of the mean-voltage ring structure using BP neural networks, but did not use optimization algorithms for optimal design. Reference [6] explored the correlation between electrode movement speed and discharge parameters using neural networks based on experimental data, but their linear neural network model had poor convergence. Reference [7] used BP neural networks to predict the shielding effect of transmission lines at unknown locations, but the prediction accuracy of the unoptimized neural network was low.
This paper proposes the BP neural network [8] based on genetic algorithm optimization and MOPSO (multi-objective particle swarm optimization algorithm) to establish a prediction optimization model for the conductor arrangement of long-distance transmission lines. The minimum value of induced voltage and current generated during the outage and maintenance of a line is used as the prediction and optimization objective to optimize the design of the overhead conductor location and the phase sequence arrangement. In the first part, taking the 500 kV transmission project of Zhongxing Power Penglai Power Plant as an example, using the transient electromagnetic simulation software ATP-EMTP to build a Multi-circuit parallel line model, calculate the electromagnetic coupling and capacitive coupling on the shutdown circuit under the conditions of different transmission line lengths, line tower spacing, vertical and horizontal spacing between different circuit lines, phase sequence arrangement, and tower call height. The simulation data obtained from it are taken as the original data. In the second part, the induced voltages and currents in some line arrangements are calculated by the simulation analysis method as the training values. The predicted values are compared with the actual values through the BP neural network [9] before and after the improvement of the genetic algorithm. Optimization is critical in the industry and scientific research [10]. In the third part, the simulation results are combined with the prediction model, and the MOPSO optimization algorithm is used to optimize the line erection and phase sequence arrangement of overhead towers to obtain the optimal layout and using ATP-EMTP to verify the reliability of the prediction model and the superiority of MOPSO optimization algorithm. The results obtained can provide a reference for optimizing the conductor layout of subsequent transmission line erection projects.
2 Electromagnetic Transient Calculation Model of Transmission Line
Research on electromagnetic fields of transmission lines at home and abroad shows that multiple circuit transmission lines on the same tower will have a strong coupling effect between the shutdown line and the normal operation line, thus generating large induced voltage and current [11]. In addition to the changes in induced voltage and current values with the line voltage level, transmission capacity, and other parameters, the spatial layout and phase sequence arrangement of conductors will also significantly impact them. In addition to changing the value of the line voltage level, transmission capacity, and other parameters, the wires’ spatial arrangement and phase sequence arrangement will also significantly impact it. Therefore, in order to study the conductor arrangement and phase sequence selection scheme of four circuit transmission lines on the same tower, this paper takes the 500 kV transmission project of Zhongxing Penglai Power Plant as the research object and analyzes the influence of different transmission line lengths, line tower spacing, vertical and horizontal spacing between multiple circuit lines, phase sequence arrangement mode and tower nominal height on line coupling. In order to make the language simple and clear, electrostatically induced voltage, electromagnetic induction voltage, electrostatic induced current and electromagnetic induction current are represented by SIV, MIV, SIC, and MIC, respectively.
Fig. 1 depicts the simplified simulation model for the 500 kV multiple parallel lines with the same tower developed using ATP-EMTP and the interface for configuring the LCC elements’ parameters. According to the design drawings, 2×LGJ-300/40 steel core aluminum stranded wires are used, the outer diameter of the conductor is 23.94 mm, the inner diameter is 6.66 mm, and the DC resistance is 0.09211 Ω/km. The wire split spacing is 400 mm, and the corresponding sag of the line type is 8.232 m. In order to optimize the spatial arrangement of overhead parallel lines, the corresponding induced voltage and current values can be obtained by changing the length of the transmission wire, the distance between the towers, the vertical and horizontal spacing of the circuit, the phase sequence, and the called height. Fig. 2 depicts the tower model for the four parallel circuits with the same tower.
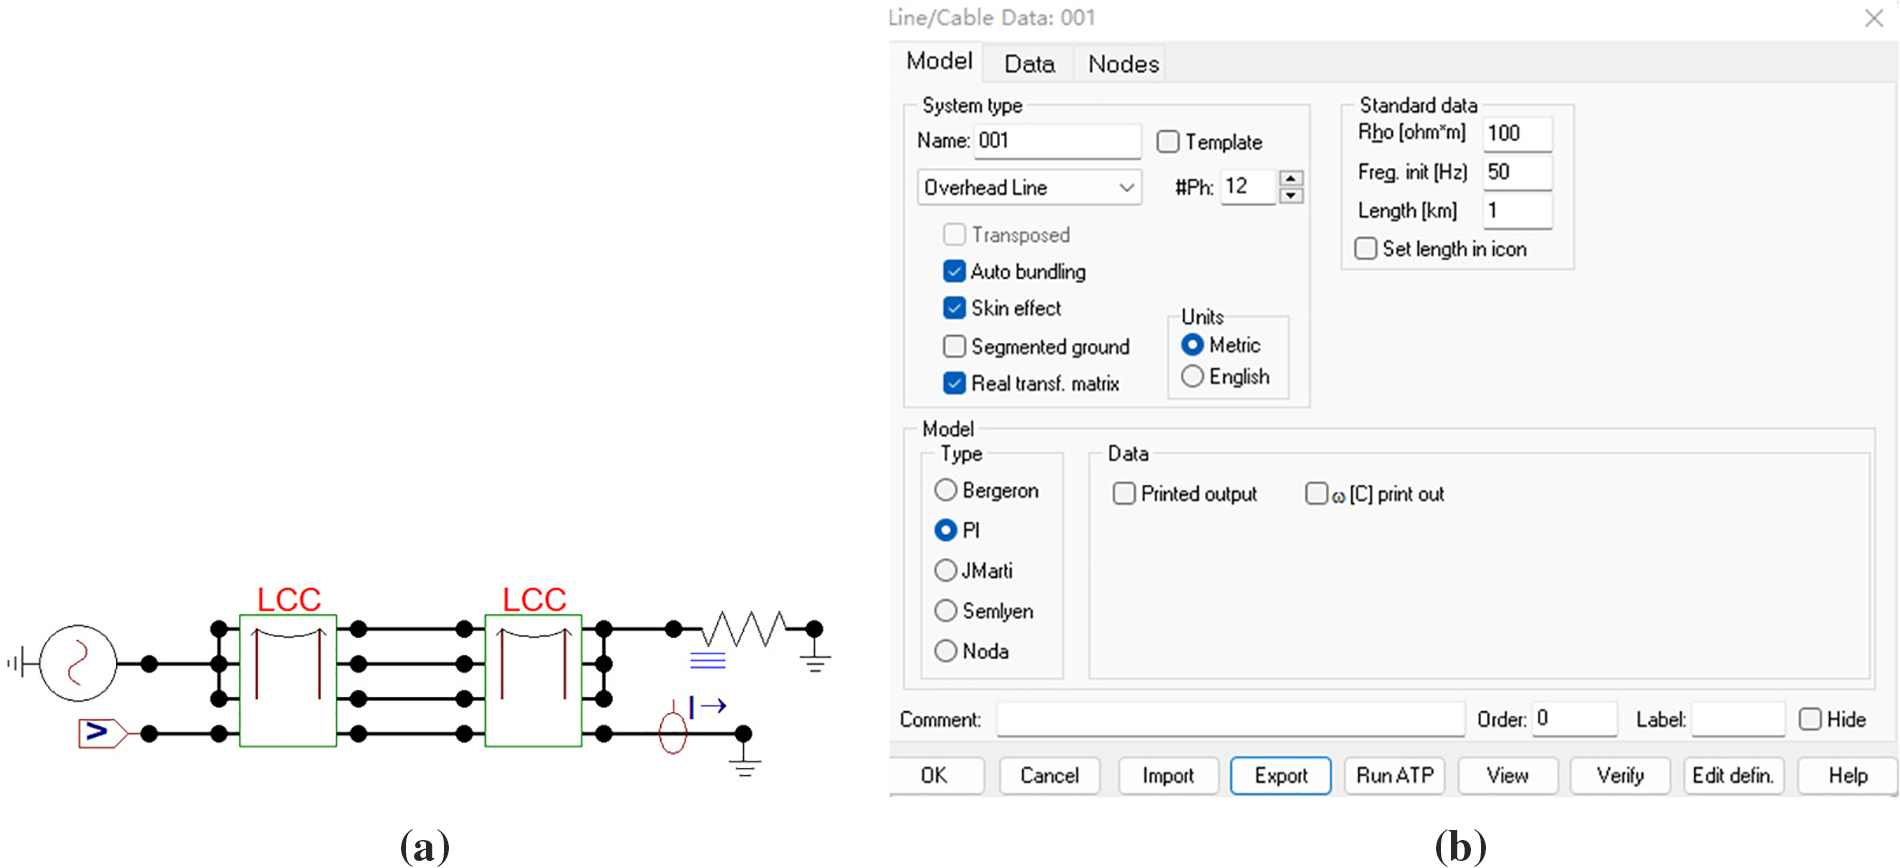
Figure 1: (a) Schematic diagram of multi-loop abbreviated simulation model on the same tower; (b) LCC element setting interface
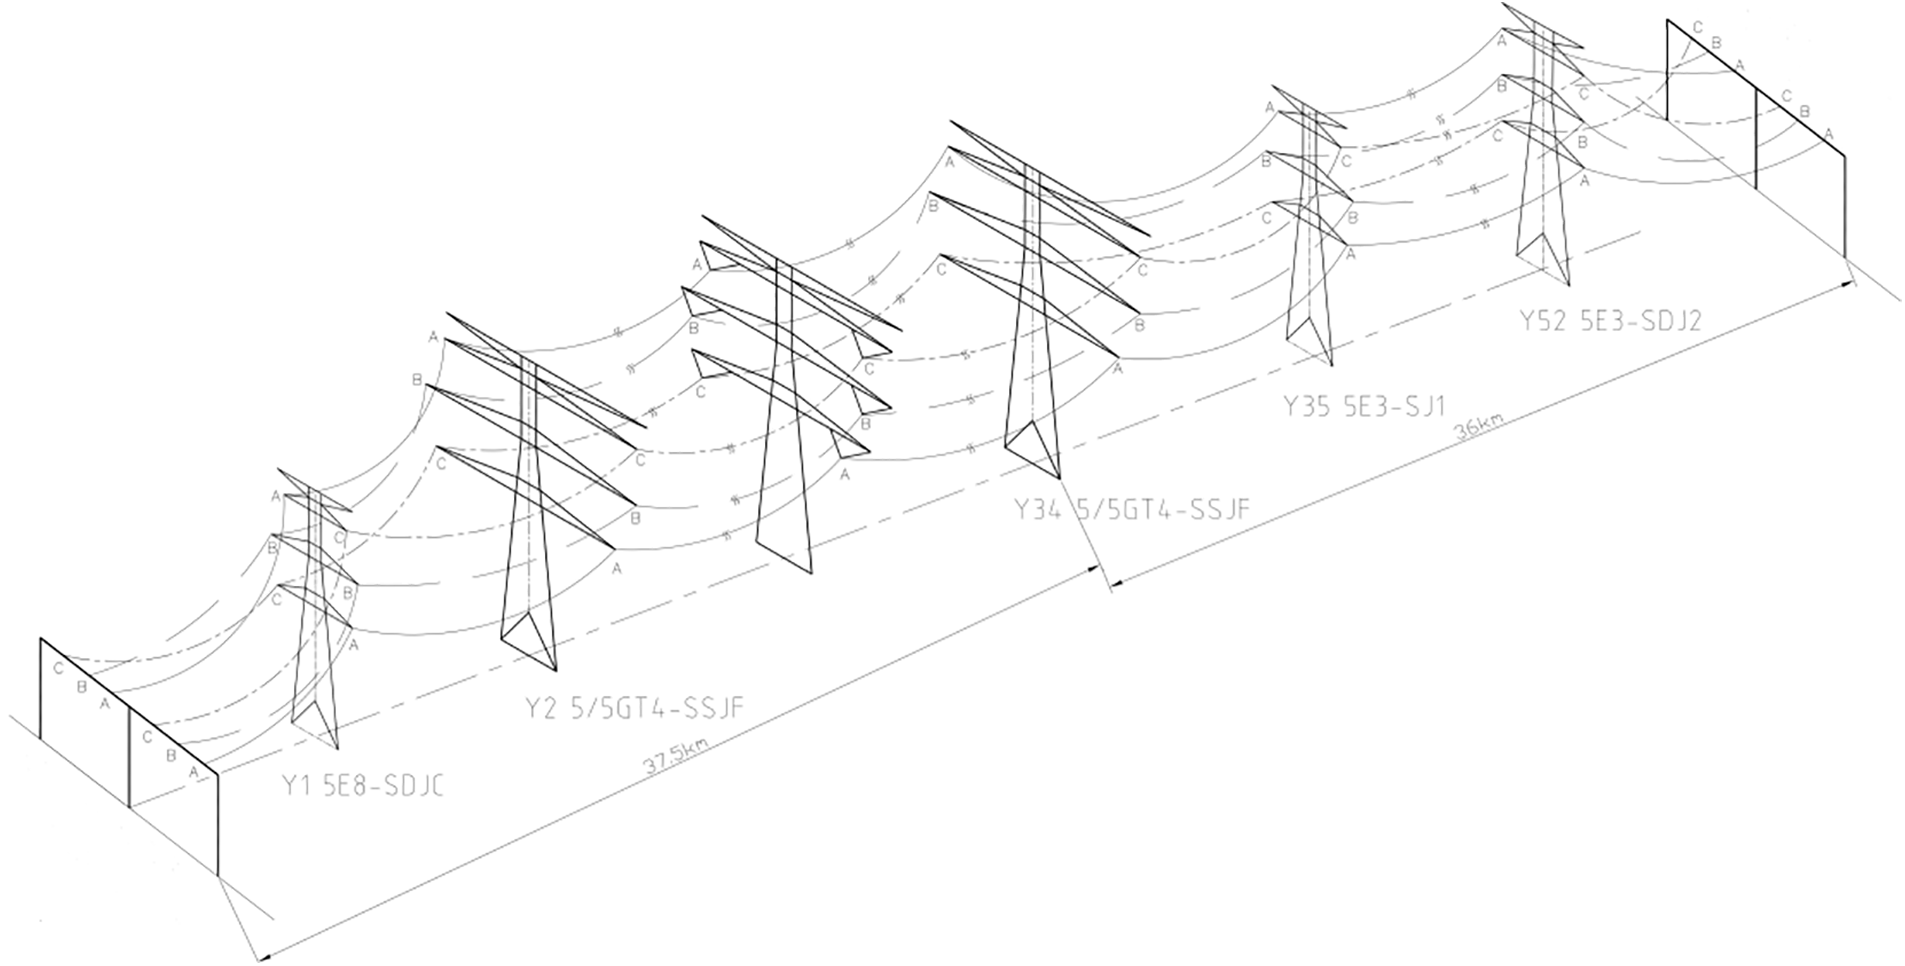
Figure 2: Model diagram of four-circuit parallel lines with the same tower
2.1 Impact of the Total Transmission Line Length
Keeping constant parameters such as tower spacing and alignment scheme, Figs. 3 and 4 depict the electrostatic coupling and electromagnetic coupling effects generated under various transmission line lengths.
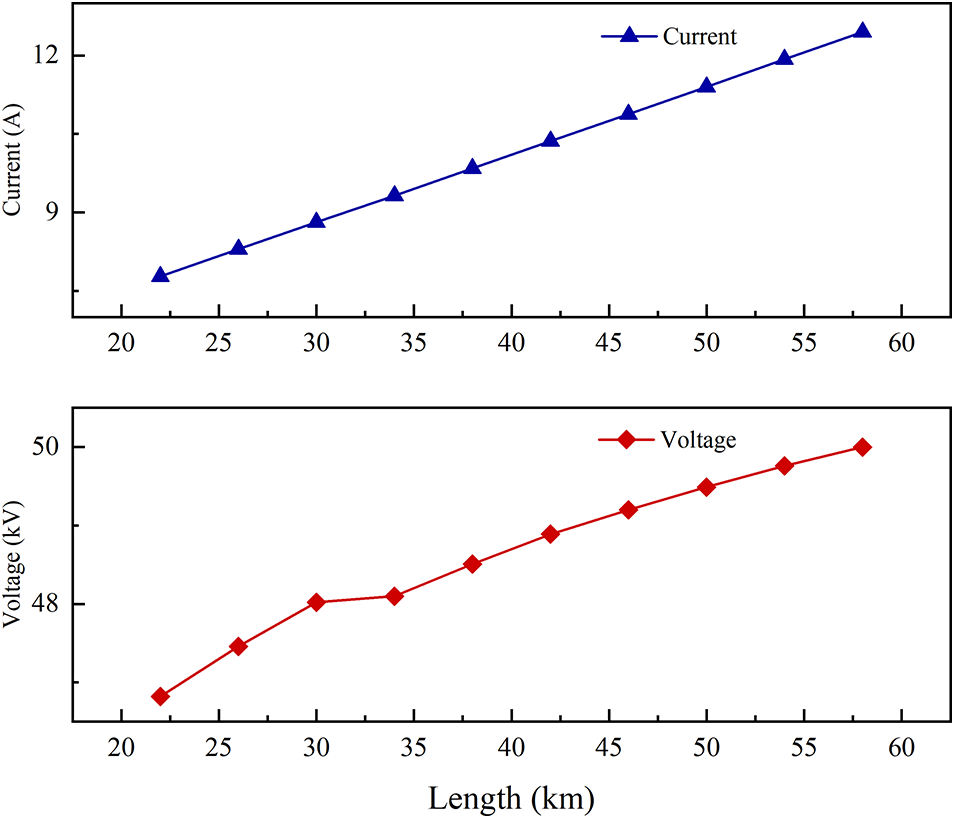
Figure 3: Influence of line length on electrostatic coupling

Figure 4: Influence of line length on electromagnetic coupling
It can be known from Figs. 3 and 4 that when the length of the line is changed, the SIV and SIC have a relatively significant change. As the line length increases, the MIV is almost proportional to the line length, while the MIC is almost unchanged.
Set the distance between towers to 0.5~1.0 km while maintaining all other layout plans and arrangement techniques. Through simulation using the ATPDraw program, the SIV, MIV, SIC, and MIC are calculated, and the results are recorded, as shown in Table 1.
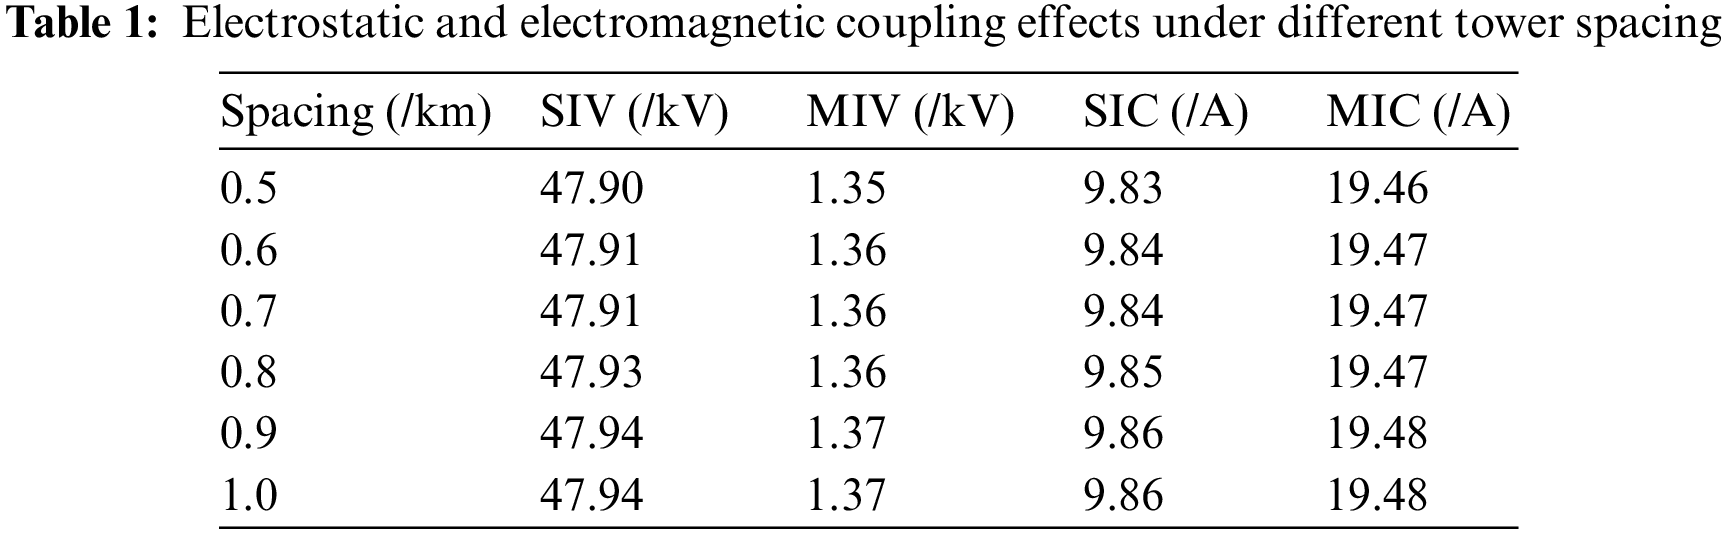
It can be learned that electrostatic and electromagnetic coupling is almost unaffected by the change in tower spacing, which is also consistent with the theoretical calculation results of the induced voltage and current.
2.3 Impact of Horizontal Spacing of Circuits
The capacitance and mutual inductance between lines will change due to a change in multi-circuit spacing [12], which will change the effects of electrostatic coupling and electromagnetic coupling as well as the SIV, MIV, SIC, and MIC. As a result, the SIV, MIV, SIC, and MIC produced by various horizontal spacing changes between multiple circuits are simulated in this paper. The results are displayed in Figs. 5 and 6.

Figure 5: Impact of horizontal spacing change on electrostatic coupling
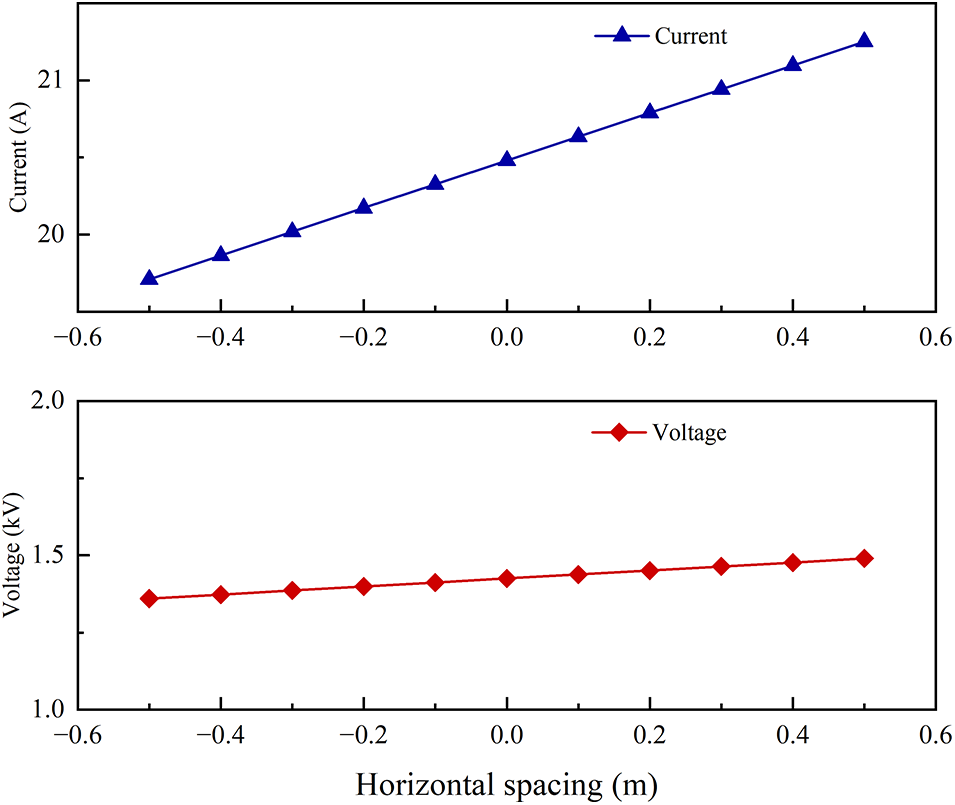
Figure 6: Impact of horizontal spacing change on electromagnetic coupling
When the change Δx of the horizontal spacing between the circuits is from −0.5 to 0.5 m, the electrostatic and electromagnetic coupling is significantly enhanced. The minimum spacing should be met when arranging the lines while ensuring the distance between the circuits. The horizontal spacing is as small as possible.
2.4 Impact of Vertical Spacing of Circuits
The coupling effect between multi-circuit parallel lines is affected by horizontal spacing and has essential engineering significance. The SIV, MIV, SIC, and MIC generated by the variation of vertical spacing between transmission lines are simulated and calculated, and the results are shown in Figs. 7 and 8. As the vertical spacing increases, the coupling between the lines is significantly weakened, and the corresponding induced voltage and current are reduced.

Figure 7: Impact of vertical spacing change on electrostatic coupling
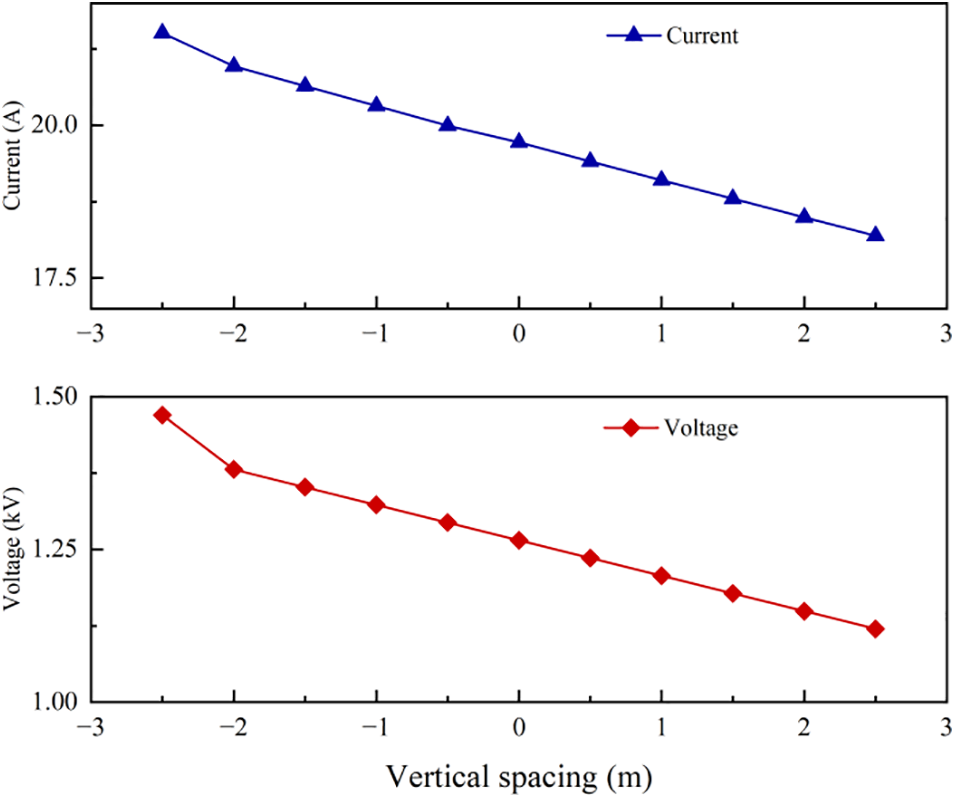
Figure 8: Impact of vertical spacing change on electromagnetic coupling
2.5 Impact of Phase Sequence Arrangement
Due to its symmetry in the horizontal direction, only the phase sequence arrangement of two-circuit parallel lines on the same side is considered for multi-circuit parallel lines. Six phase sequence arrangements of high-voltage transmission lines in the shared corridor are simulated to study their electrostatic and electromagnetic induction effects. The same phase sequence is represented by No. 1, the four heterophase sequence arrangements are represented by Nos. 2–5, and the reverse phase sequence is represented by No. 6; the results are shown in Table 2.
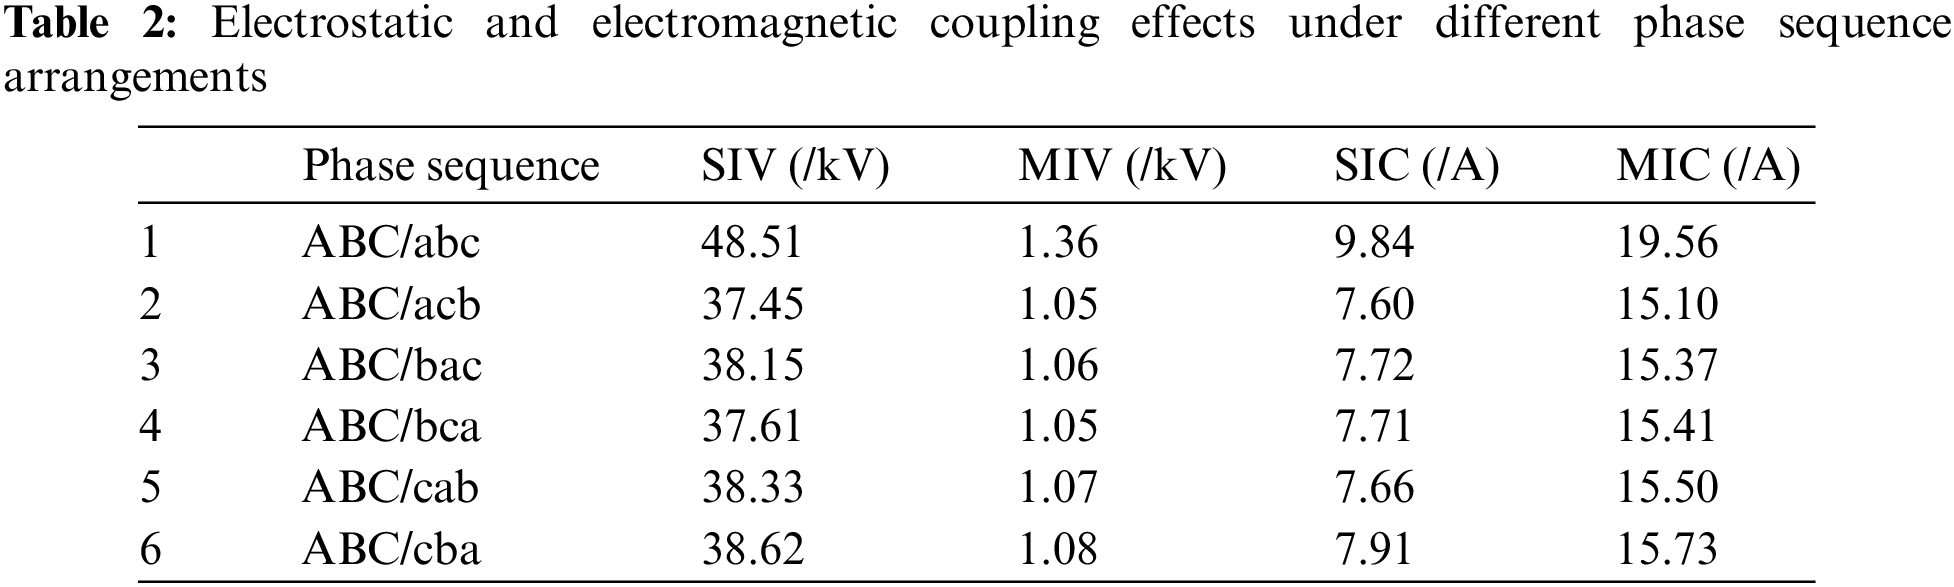
When other influencing factors remain unchanged, compared with other phase sequence arrangements, the SIV, MIV, SIC, and MIC generated by heterophase sequence 1 (ABC/acb) are the smallest. The induced components generated by the reverse phase sequence and four heterophase sequence arrangements are reduced by more than 20% compared with the same phase sequence.
2.6 Impact of Tower Nominal Height
The conductor sag of transmission lines will increase significantly with an increase in tower spacing, making erecting and maintaining multi-circuit parallel lines more challenging. The number of towers and the towers’ height should be considered in the erection of multi-circuit parallel lines. Examine the effects of increasing the tower’s nominal height from 32 to 42 m on the electrostatic and electromagnetic coupling effects depicted in Figs. 9 and 10.

Figure 9: Influence of nominal height on electrostatic coupling

Figure 10: Influence of nominal height on electromagnetic coupling
As the tower’s nominal height increases from 32 to 42 m, the electrostatic induction voltage increases by 8.8%. The other three inductive components increase slightly, which is less affected by the tower’s nominal height.
3 GA-BP Network to Predict Induced Voltage and Current
BP neural network (BPNN for short) is a feedforward neural network model [13] using error backpropagation learning, which can realize any nonlinear mapping from input to output. It was first proposed by Rumelhart et al. in 1985 in their research on multilayer perceptron neural networks. The schematic diagram of the traditional BP neural network is shown in Fig. 11, mainly including the input layer, hidden layer, and output layer.

Figure 11: Structure diagram of BPNN
In this paper, the six influencing factors of the four circuit lines are taken as the six nodes in the input layer and take the SIV, MIV, SIC, and MIC as the four nodes of the output layer. In order to avoid the over-complexity of the prediction model and the poor generalization ability caused by overfitting, the mean square error MSE is used as the evaluation index to select the best number of hidden layer nodes, which should be less than the total number of samples on the one hand. It shall be determined according to the following formula on the other hand [7]:
The number of input layer nodes m and output layer nodes n in Eq. (1) are 6 and 4, respectively; A is a constant with a value range of [1, 10]. Eq. (2) calculates the mean square error MSE [7]:
Too many nodes of the hidden layer will lead to over-learning of the neural network, and too few neurons will decrease in accuracy. The empirical Eq. (1) is generally referred to in the specific design, and the trial algorithm is adopted. The most appropriate network is selected by training and comparing the number of nodes in different hidden layers.
3.2 BPNN Optimized by Genetic Algorithm
Although BPNN is widely used in an artificial neural network, if the initial weight and threshold value are not properly selected, the neural network’s performance will be significantly affected. Genetic Algorithm (GA for short) is a global search evolutionary algorithm with an iterative process of “survival + detection” evolved by simulating the evolution law of nature [14]. Considering its robust scalability, it can effectively solve the problem of local extremum problems encountered in the operation process of traditional BP neural networks. This paper selects a genetic algorithm to optimize BPNN to solve the problem of optimal selection of initial value and threshold [15], so that BPNN can more quickly train the prediction model of multi-circuit parallel lines. The specific flow of GA-BPNN is shown in Fig. 12.
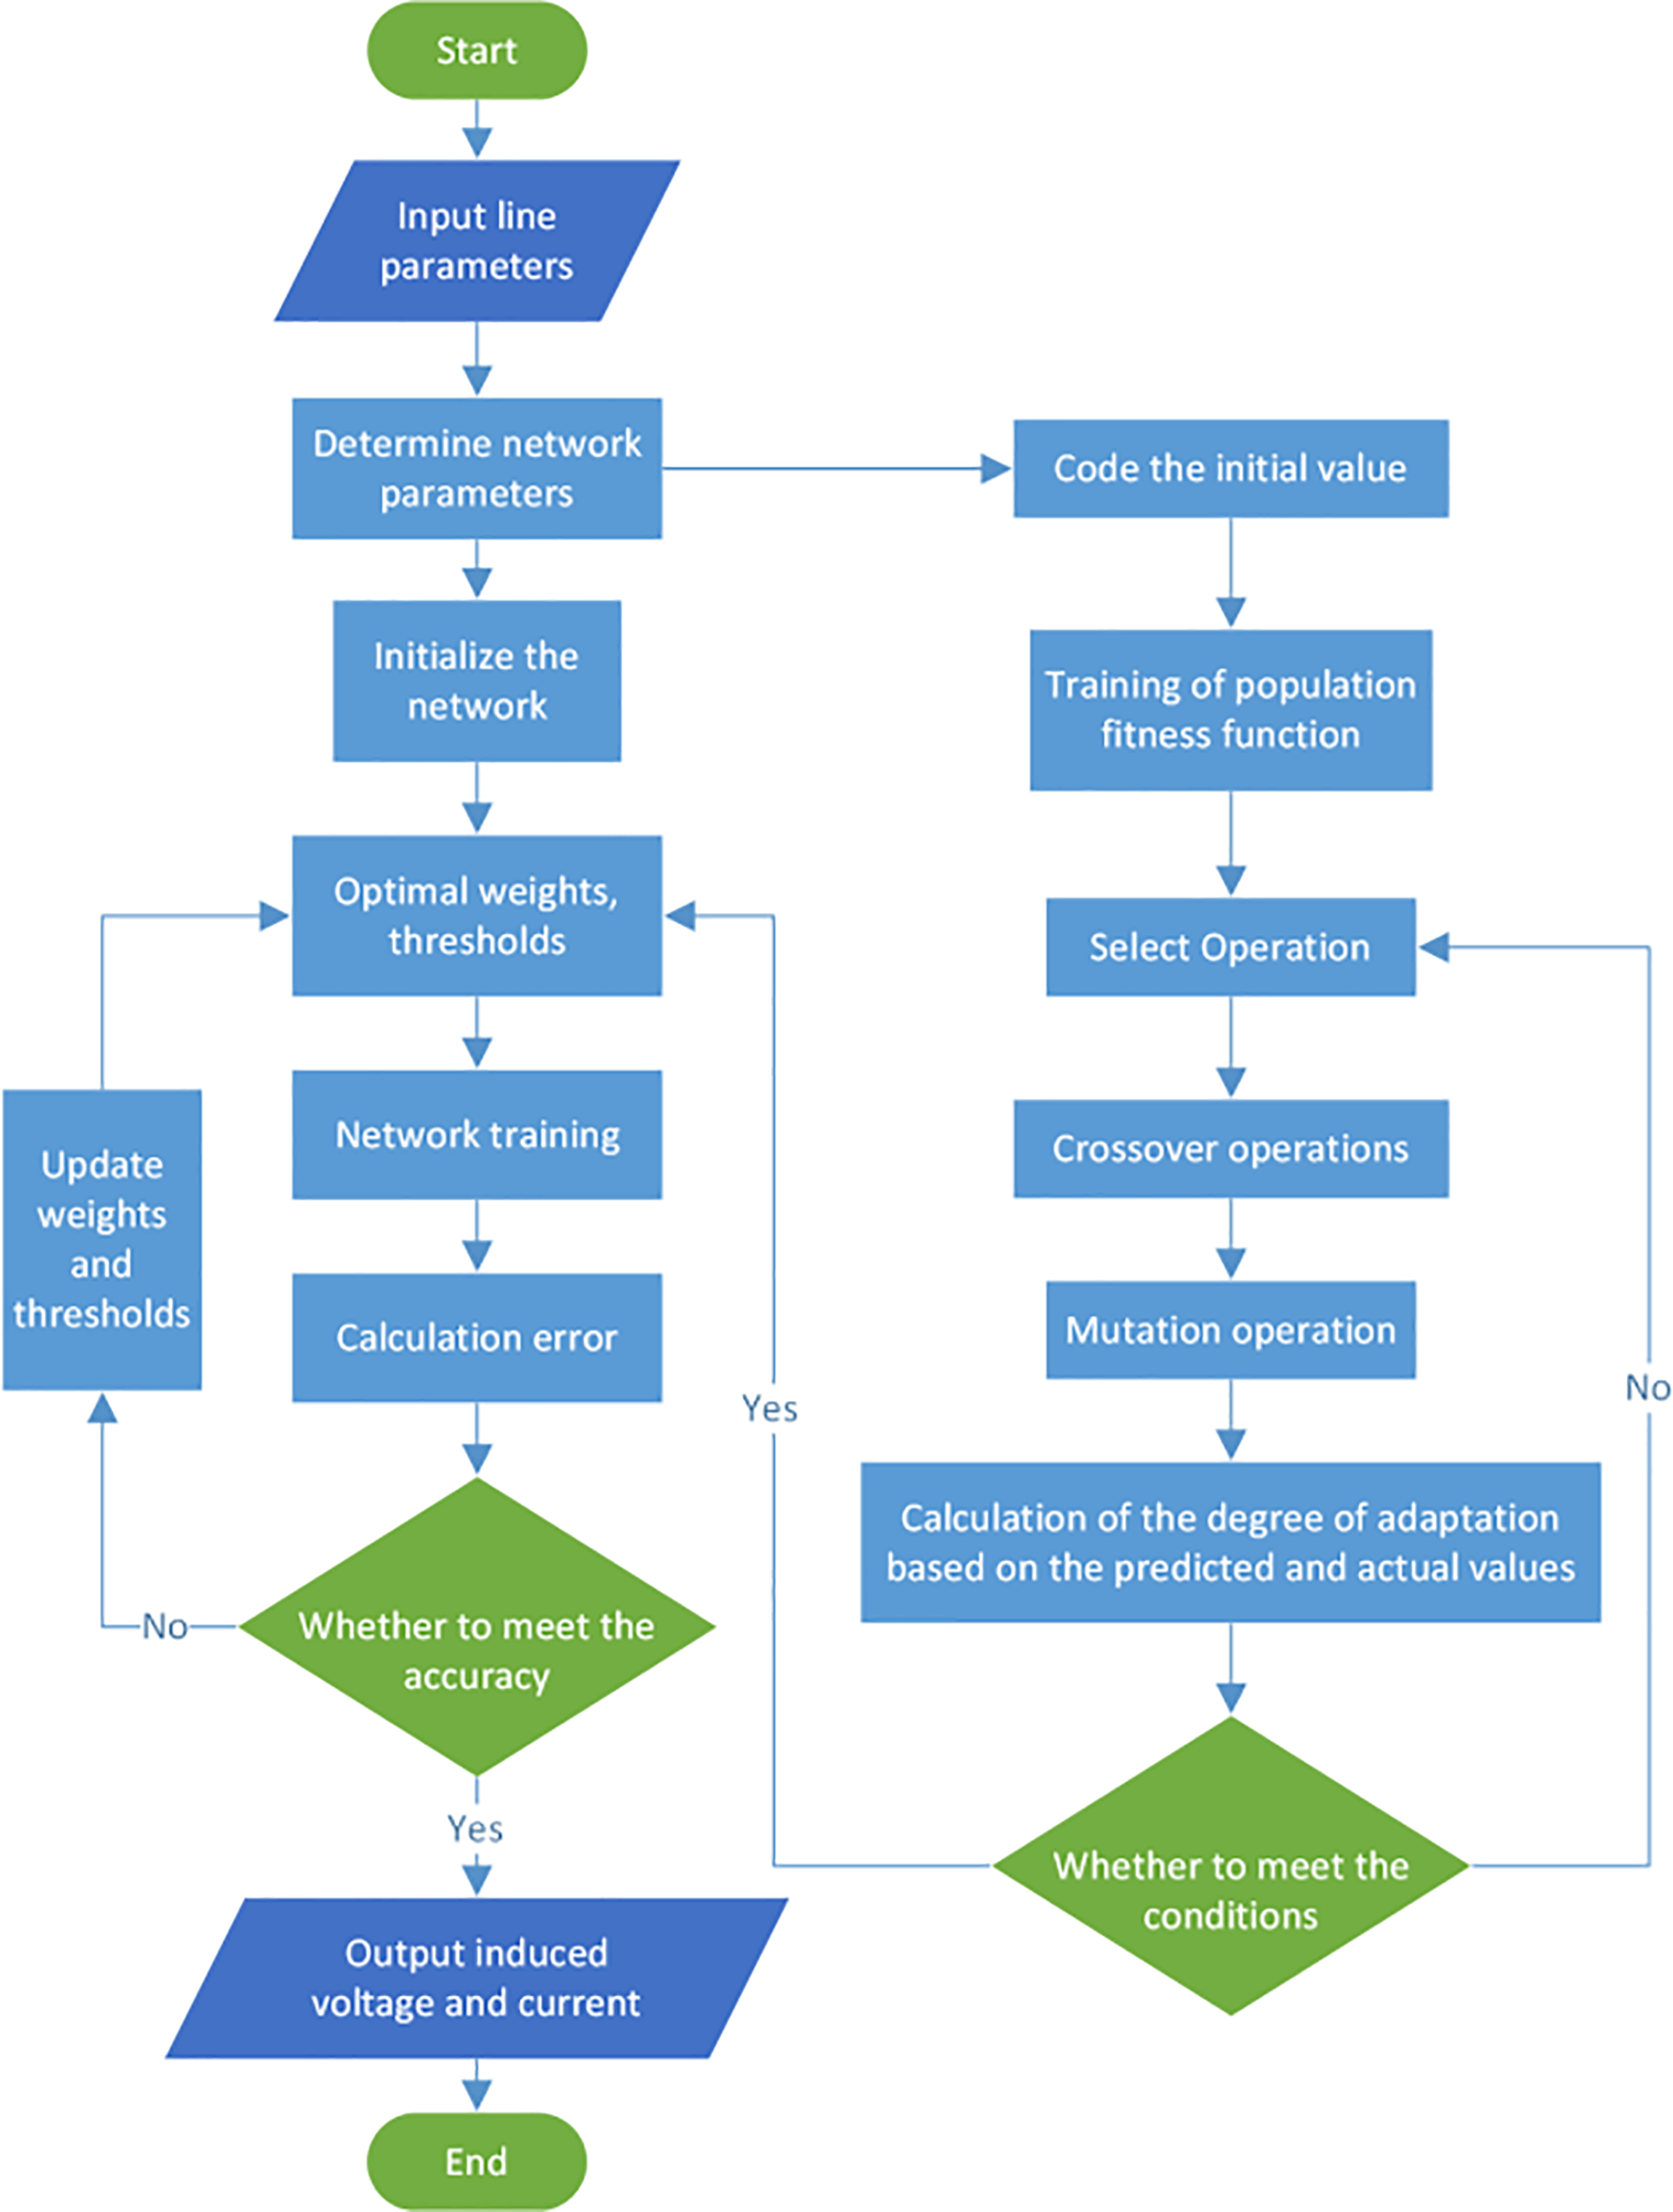
Figure 12: Flow chart of GA-BPNN
According to the calculation process in Fig. 12, the critical step of using the GA to optimize the BPNN is to select the optimal neural network weights and thresholds through the genetic algorithm to ensure that the neural network training can find the optimal limit solution faster. As an essential indicator of individual adaptability, fitness can simultaneously reflect the pros and cons of genetic operations, and its calculation formula is as follows [16]:
In the learning process of the neural network, the genetic algorithm not only optimizes the calculation process of the traditional neural network but also effectively improves the training speed and further improves the algorithm’s convergence speed and optimization ability [16].
4 Prediction of Electromagnetic Transient Effects with Different Arrangements
In order to verify the reliability and superior effect of GA-BP neural network in the prediction of electrostatic and electromagnetic coupling effects under different conductor layout modes, this paper takes the 500 kV transmission project as an example, takes the layout mode and phase sequence arrangement of multi-circuit parallel lines as the research object [17], and takes the SIV, MIV, SIC, and MIC generated during shutdown maintenance as the evaluation index, The induced voltage and current prediction models of traditional BP neural network and GA-BP neural network are built, respectively. The prediction results are compared with the actual simulation values.
Considering that the SIV, MIV, SIC, and MIC generated by the coupling effect of inductance and capacitance are important research indicators of multi-circuit parallel lines, excessive SIV, MIV, SIC, and MIC will directly affect the grounding operation, maintenance work of shutdown circuit, and the determination of equipment parameters such as line grounding switch. Therefore, this paper establishes the electromagnetic transient simulation model based on the transmission project and mainly uses the SIV, MIV, SIC, and MIC generated during the outage maintenance of a circuit line as the sample data to predict. Considering the space layout of four-circuit parallel lines and the phase sequence arrangement of transmission lines, 100 groups of simulation data obtained from the simulation model are chosen to form the neural network prediction model’s data set.
4.1 Establishment of Training Samples
The spatial layout of multi-circuit parallel lines includes six factors: line length, tower spacing, vertical and horizontal spacing between multi-circuit lines, phase sequence arrangement mode, and tower call height, which are taken as independent variables of prediction data. The six arrangement modes of the same phase sequence, heterophase sequence 1, heterophase sequence 2, heterophase sequence 3, heterophase sequence 4, and reverse phase sequence are respectively represented by 1, 2, 3, 4, 5, and 6 according to Eq. (1), the number of hidden layer nodes is between 4 and 13. Table 3 displays the training set’s corresponding mean square error (MSE). When four hidden layer nodes are selected; the corresponding MSE value is the minimum.
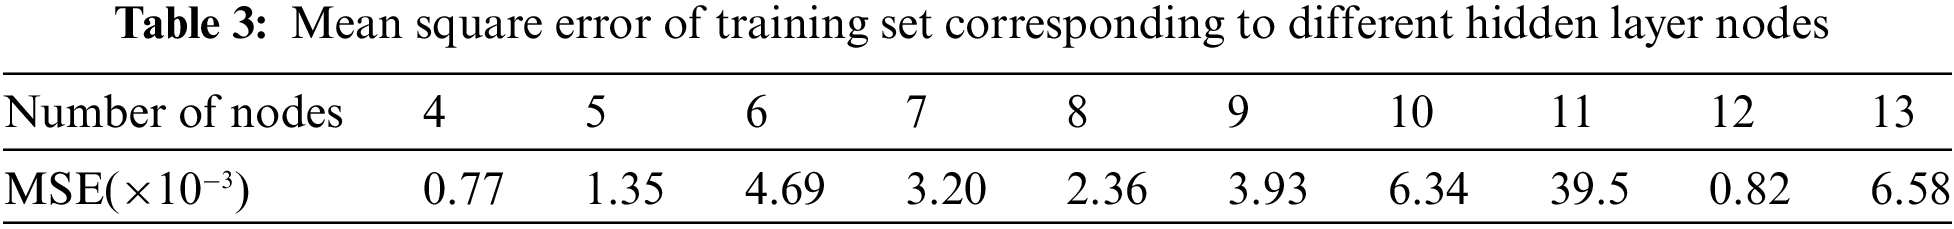
Fig. 13 depicts the training process for the improved genetic algorithm prediction model corresponding to a selection of four neurons in the hidden layer. Using the validation set as an example, Fig. 13 illustrates that the minimum MSE of 0.001748 is achieved when epochs reach 52.
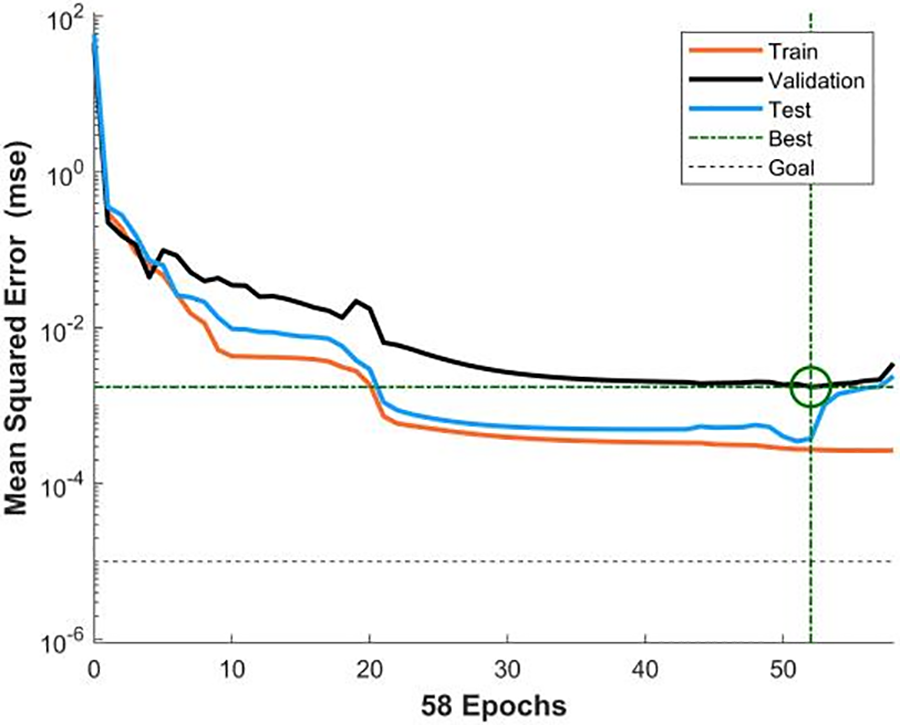
Figure 13: Training results of four hidden layer neurons
4.2 Setting up the Prediction Model
The processed data is separated into a training set and a test set. Since the BPNN optimized by the GA is strict in calculating nodes, 100 groups of data samples are processed in random order to prevent repeated inputs from not being recognized as input nodes. In order to avoid singular sample data in the prediction model, the premnmx function is used to map the original data to [−1, 1], and all data are normalized. Determine that the training times are 1000, the learning rate is 0.01, and the minimum error of the training target is set to 1.0 × 10⁻⁵.
4.3 Prediction Results and Analysis
The training results of the BPNN optimized by the GA are shown in Fig. 14. This figure also shows the degree of linear fit between the simulation value and the predicted value of the SIV, MIV, SIC, and MIC under different wire arrangements. The fitting regression coefficient R represents the correlation between the target and predicted output values. It can be seen from Fig. 14 that in the training set, verification set, test set, and all data sets, the fitting regression coefficients of the optimized BPNN prediction model are greater than 0.995, indicating that the prediction model has a high degree of fitting and can more accurately predict the SIV, MIV, SIC, and MIC under the unknown wire layout.
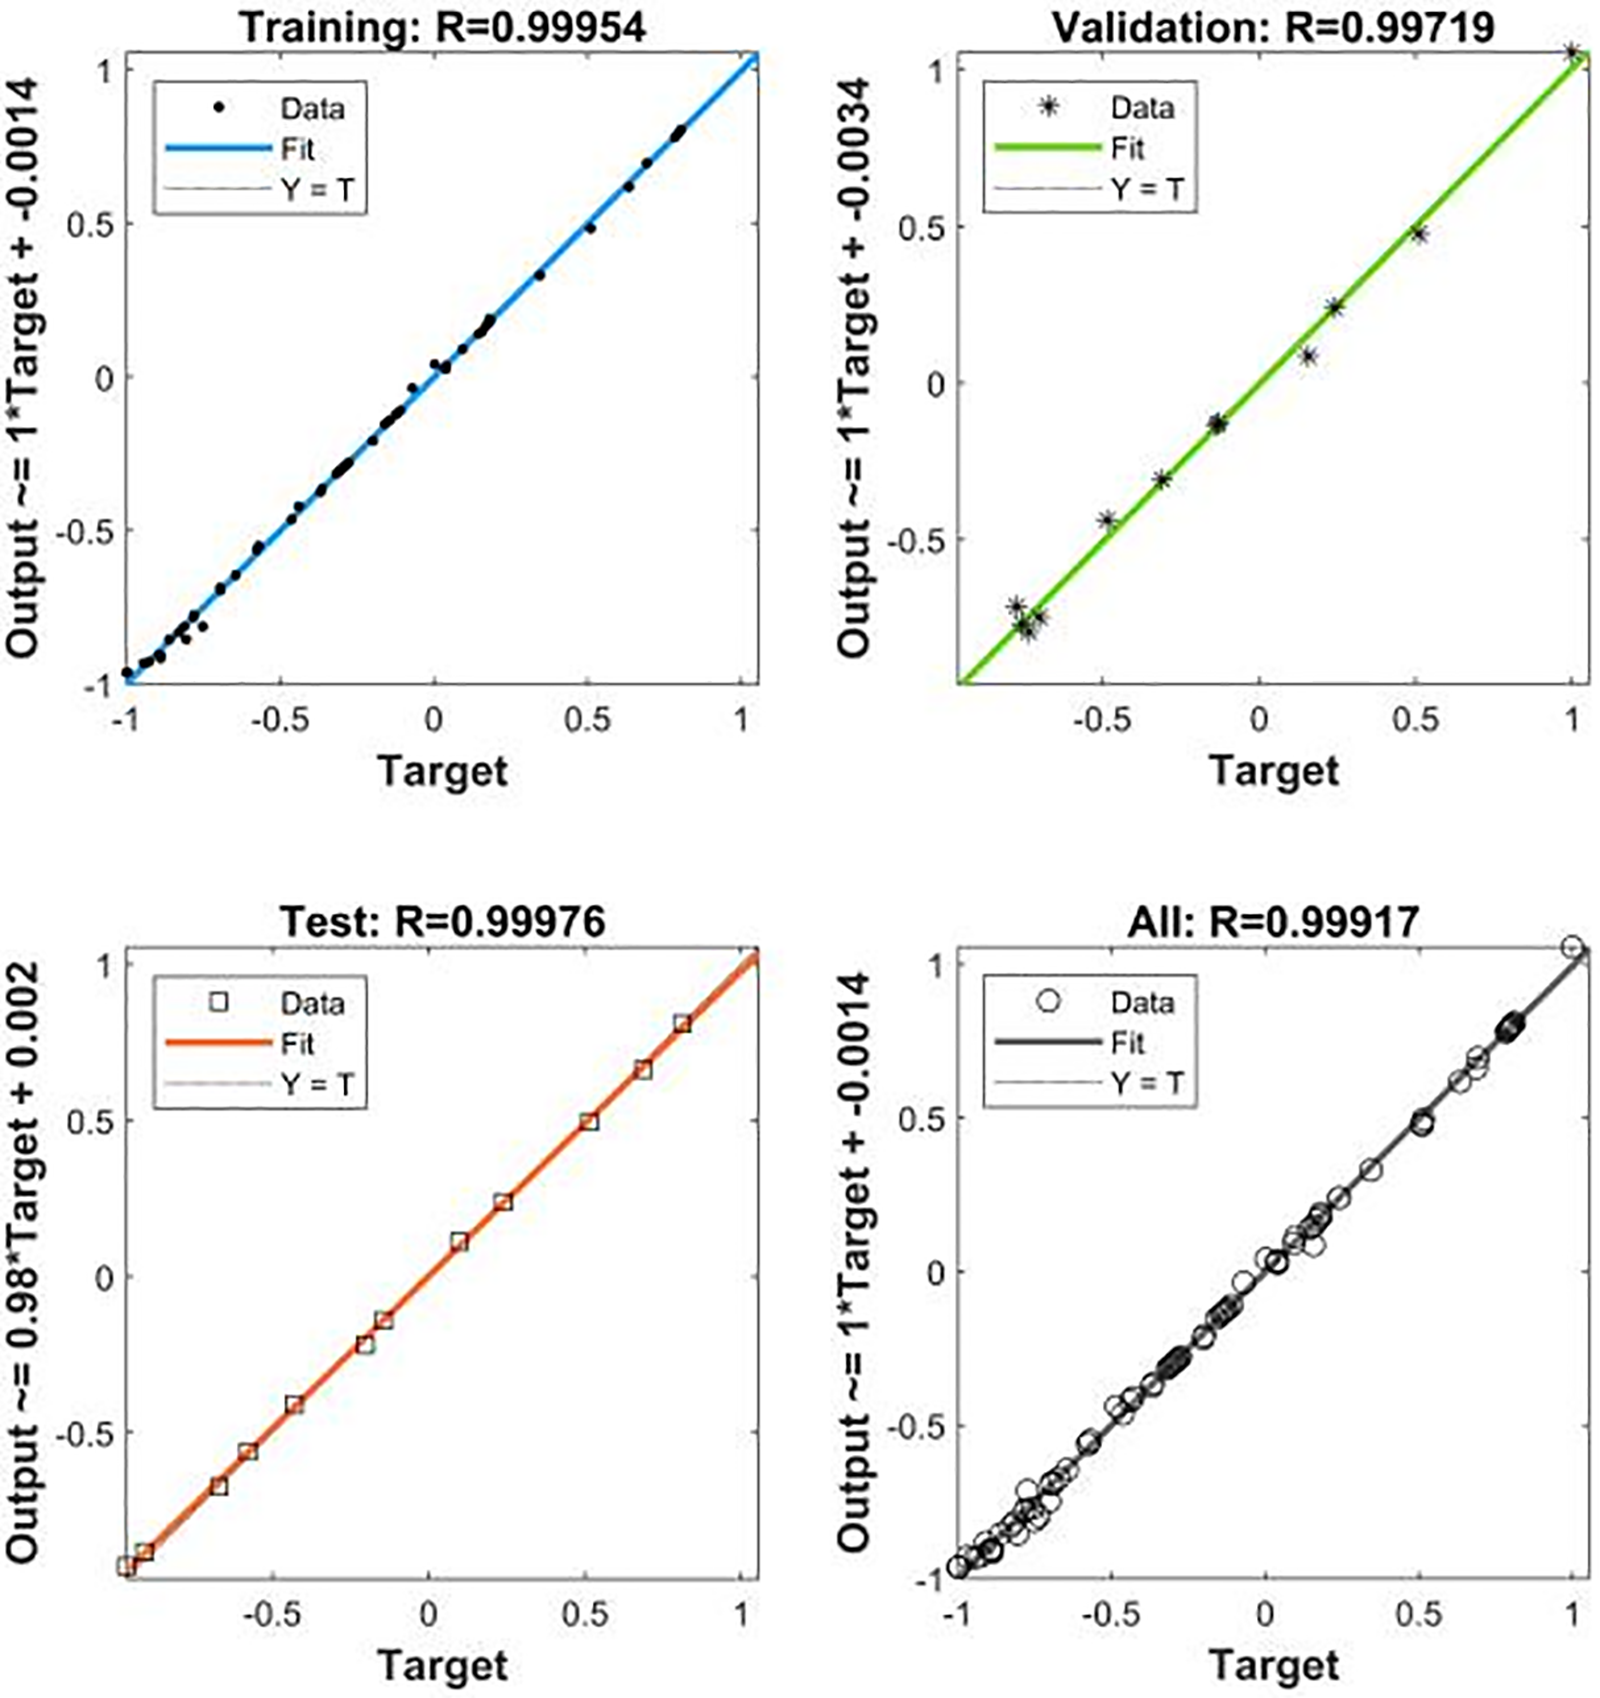
Figure 14: The optimized BP neural network training regression diagram
Figs. 15 and 16 depict the results of predicting the last 20% of sample data using the BPNN before and after optimization with the genetic algorithm. Using the MIV as an example, Fig. 15 demonstrates that, compared to the prediction results of the traditional BPNN, the predicted value of the BPNN delay prediction model optimized by the GA is closer to the real value of the MIV obtained by the simulation.
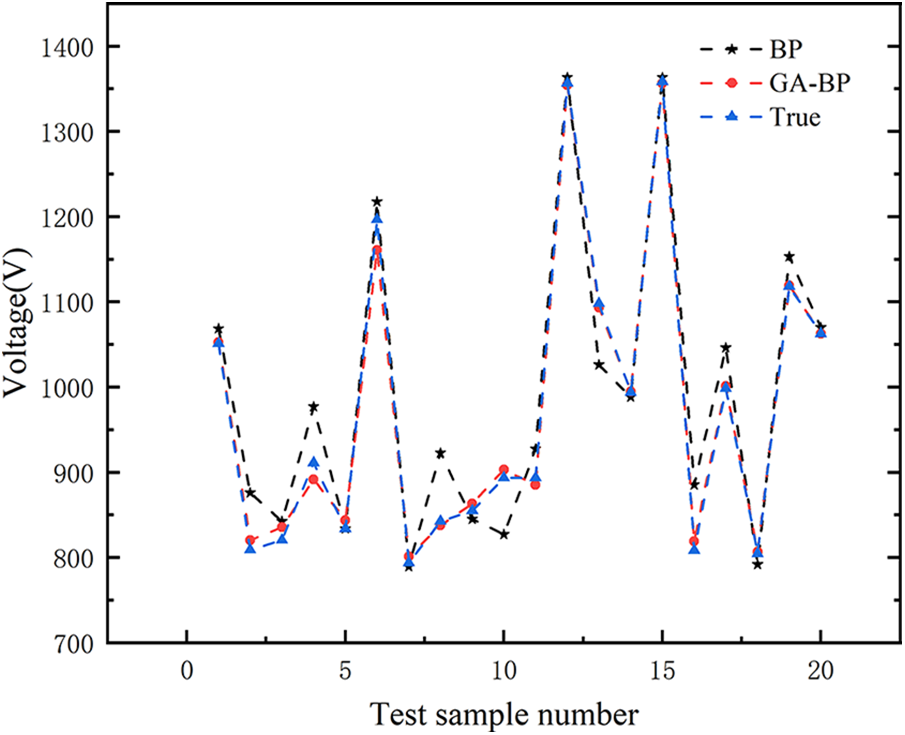
Figure 15: Comparison of the predicted and true values of voltage before and after optimization

Figure 16: Error comparison chart before and after optimization
The error comparison chart in Fig. 16 shows that the error of the traditional BP prediction model fluctuates greatly. The BPNN delay prediction model optimized by the GA significantly decreases the error of the prediction result. The specific comparison of model errors before and after optimization is depicted in Table 4. MAE, MSE, and MAPE represent the mean absolute error, mean square error, and mean absolute percentage error, respectively.
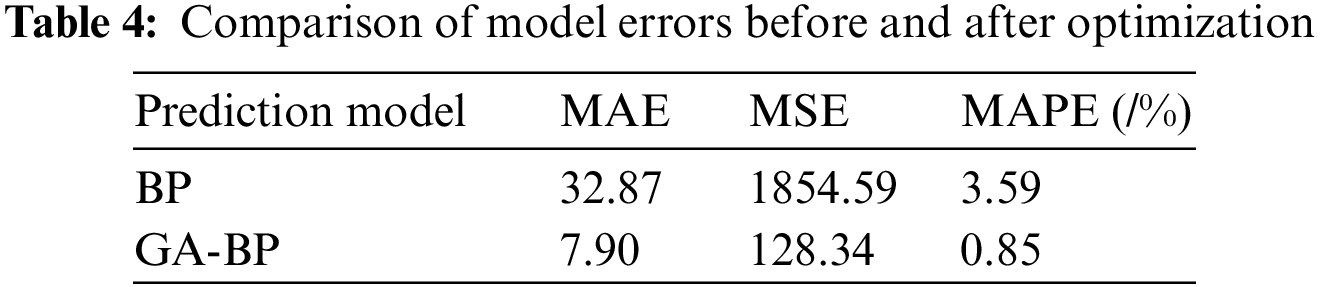
Among them, the MAPE of the traditional BP neural network is 3.5892%, while the MAPE of the BPNN optimized by the GA is only 0.8493%, that is, the prediction accuracy is above 99%, which is significantly higher than that of the traditional BPNN, indicating that the introduction of GA improves the global search ability and the prediction accuracy.
From the above analysis, it is observed that the research on the effects of multi-circuit parallel line arrangement on electrostatic and electromagnetic coupling effects fully demonstrates the advantages of GA-BPNN over traditional BPNN, as well as the important role of GA in optimizing BPNN to improve the accuracy of predicting electrostatic and electromagnetic coupling effects.
5 MOPSO Algorithm for Optimizing Wire Arrangement
The robust calculation and analysis function of ATP-EMTP enables it to quickly establish a multi-circuit parallel line model and conduct simulation and analysis on outage conditions under different conductor positions and arrangements, but it does not have the capability of multivariable optimization and needs to repeatedly modify model parameters and a large amount of calculation time. The multi-objective particle swarm optimization algorithm has the advantages of strong global optimization ability, high precision, fast convergence speed, etc. It can be used to optimize the arrangement of overhead line towers by combining it with the GA-BP prediction model.
The MOPSO algorithm is an effective method for multi-objective function global optimization. In each iteration, particles update their position and speed through the optimal solution of individual particles (Pbest for short) and the optimal solution of the whole population (Gbest for short). In the k+1 iteration, the updating equation of the ith particle velocity vik+1 and position sik+1 is [16]:
where the iterations are expressed in k; the inertia weight is expressed in w; c1 and c2 are learning factors, c1 is the “self cognition” part, and c2 is the “social cognition” part; r1 and r2 represent random numbers subject to a uniform distribution in the range [0, 1].
In the research on optimizing the spatial layout and arrangement of four circuit conductors, the coupling effect will differ depending on the line length, the distance between conductors, and the phase sequence arrangement scheme. The objective function value selected in this paper is SIV, MIV, SIC, and MIC, obtained by simulation calculation. The position of particles represents different conductor layout parameters, including line length, tower spacing, etc. Error comparison is used to determine if the iteration meets the specified requirements. If so, terminate the search. Simultaneously output the optimal wire position parameters and the electrostatically and electromagnetically induced voltage and current values. Otherwise, update the velocity and position of the particle to continue the search.
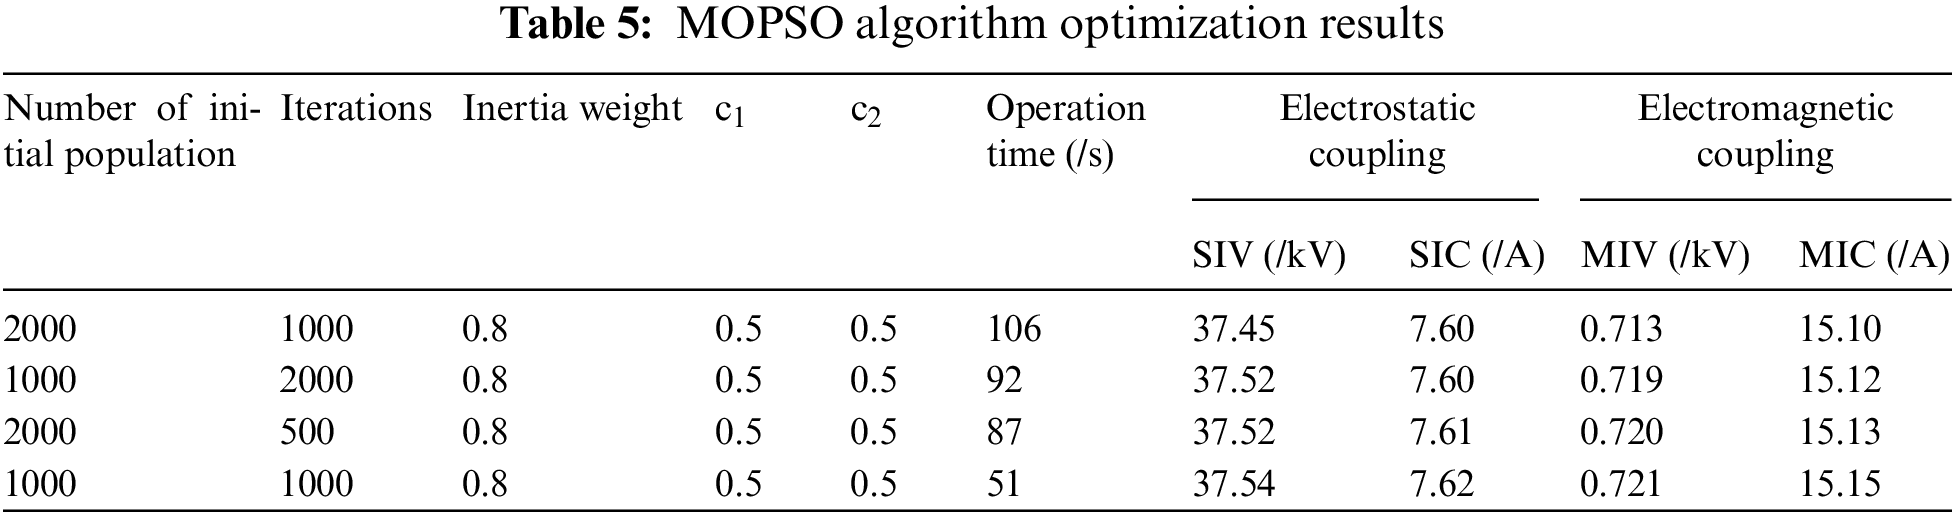
The MOPSO algorithm is used to optimize the spatial layout and phase sequence of wires, as shown in Fig. 17. Run the MOPSO algorithm and change the initial populations and the maximum number of iterations. The optimization of electrostatic and electromagnetically induced voltage and current values is shown in Table 5. This Table shows that when the inertia weight is set to 0.8, the self-learning factor is 0.5. The group learning factor is 0.5, and the wire arrangement optimization based on the MOPSO algorithm can find the optimal global value in about 106 s. When the initial number of populations and the maximum number of iterations are reduced, the computation time decreases accordingly, but the effect of the optimization search also decreases. Moreover, the results of multiple operations are similar, indicating that the sub-optimization scheme has a good convergence effect and a certain robustness. The number of the initial population and the maximum number of iterations of the MOPSO algorithm is reduced, the operation time is significantly reduced, it is very close to the optimal global value, and the convergence speed is effectively improved.
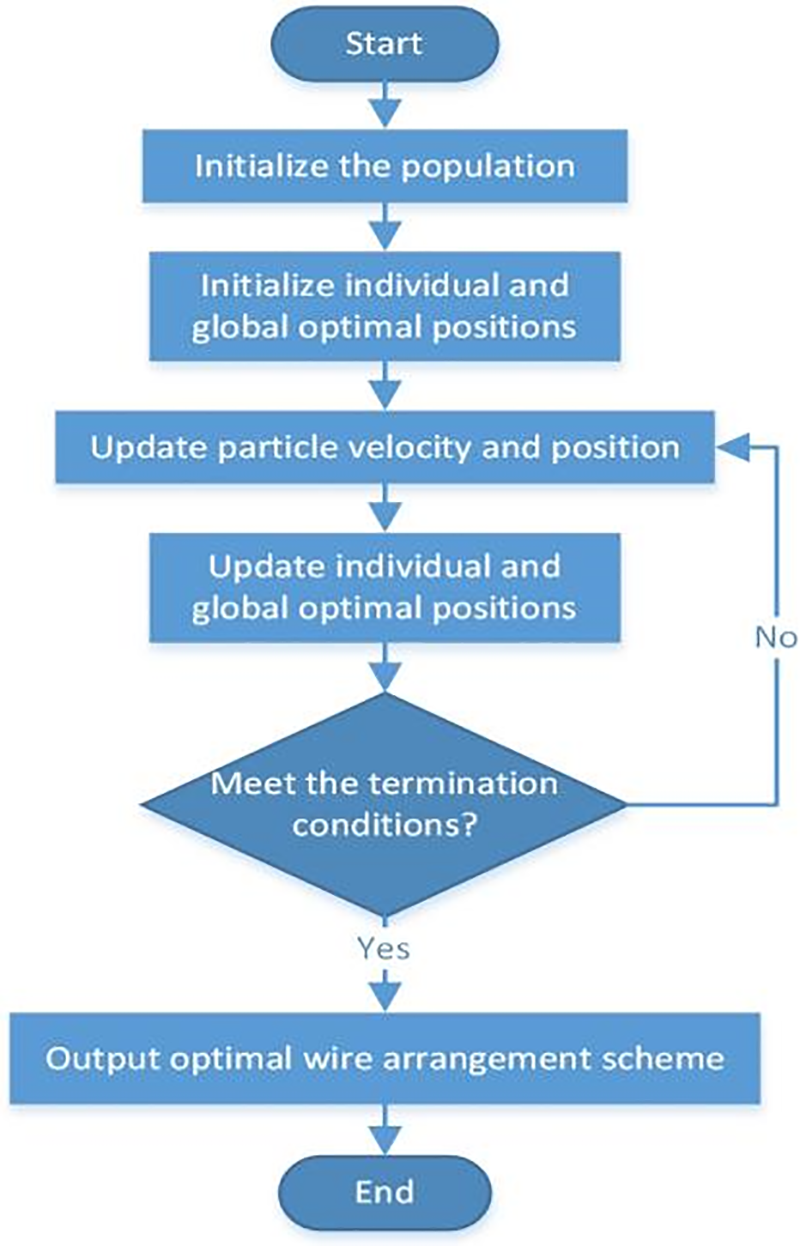
Figure 17: The flow chart of MOPSO algorithm optimization of wire arrangement and phase sequence arrangement
Considering the electrostatic and electromagnetic coupling effect comprehensively, the corresponding tower conductor layout and phase sequence arrangement scheme are shown in Table 6.
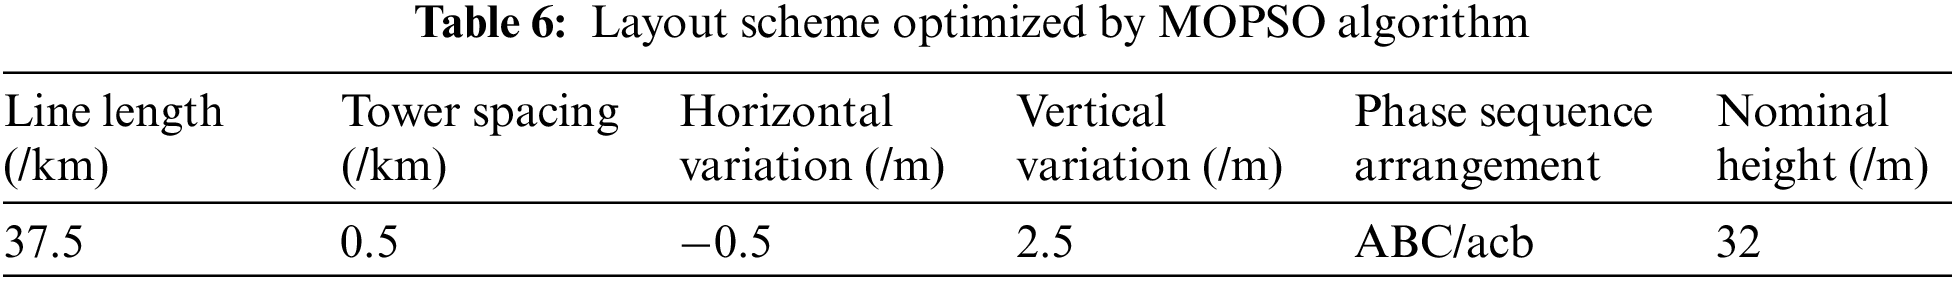
The optimal wire layout scheme and phase sequence arrangement method obtained by the multi-objective particle swarm optimization algorithm are used as LCC tower model parameters in ATP-EMTP for simulation verification. Using electromagnetically induced voltage as an example, the waveform diagram is shown in Fig. 18. The optimized MIV value is 0.732 kV, which is 24.64% lower than the pre-optimization value, indicating the accuracy of the GA-BP model and the feasibility of MOPSO algorithm to optimize wire layout scheme.
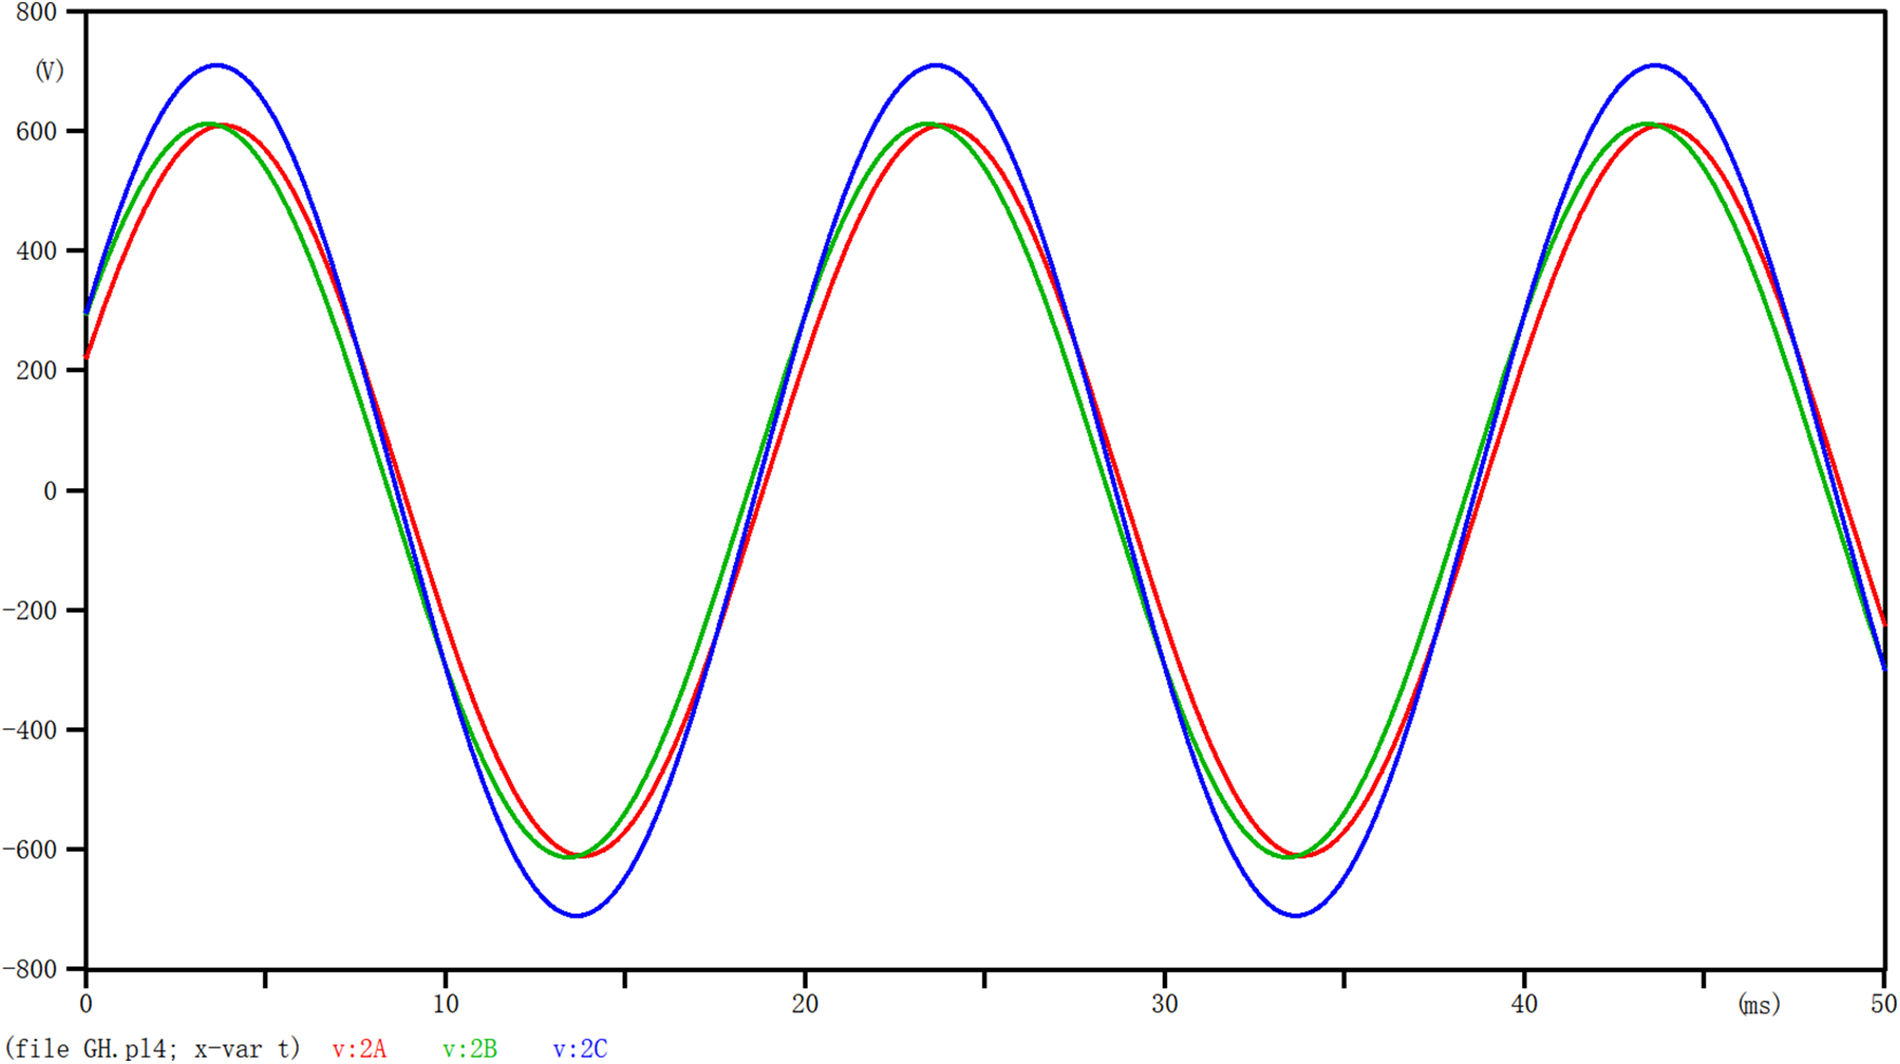
Figure 18: Waveform of electromagnetic induction voltage under optimal arrangement
By changing the wiring scheme and phase sequence arrangement of parallel lines, the coupling parameters between parallel circuits can be significantly changed, thus affecting the effects of electrostatic and electromagnetic induction. Line length, conductor spacing, and nominal height significantly influence electrostatic coupling, and electromagnetic coupling changes significantly with the increase in line length and vertical spacing. However, it is almost not affected by nominal height. At the same time, compared with other phase sequence arrangements, the induced voltage and current generated by heterophase sequence 1 (ABC/acb) are the smallest. The induced components generated by the reverse phase sequence and four heterophase sequence arrangements are reduced by more than 20% compared with the same phase sequence; under the condition of meeting other indicators such as imbalance, heterophase sequence one can be preferred as the phase sequence arrangement of multi-circuit lines on the same tower.
The GA-BPNN model established by adequately adjusting the weight and threshold of the BPNN through GA effectively solves the problem of local extreme value generated by the prediction model, and the accuracy of the prediction of electrostatic and electromagnetic coupling effects has also been greatly improved. The prediction accuracy of the GA-BPNN for the induced voltage and current is more than 99%, higher than 96.41% of the traditional BPNN. At the same time, the average absolute error of the improved neural network prediction model is 75.98% lower than that of the traditional BP model; The average relative error is 76.34% lower than that of BPNN. However, the genetic algorithm needs to be stronger in handling constrained optimization. There is no problem-independent general method for handling constraints other than upper and lower bound interval constraints on variables, and subsequent optimization for this problem will be performed.
The MOPSO algorithm is used to construct an overhead transmission line tower optimization model and combine the data obtained from simulation calculations to automate and determine the best conductor layout and phase sequence arrangement. The optimized arrangement scheme SIV, SIC, MIV, and MIC are reduced to 37.45 kV, 7.6 A, 0.713 kV, and 15.10 A, respectively. At the same time, the SIV, MIV, SIC, and MIC generated by the line layout scheme obtained by using the MOPSO algorithm meet the technical requirements of the switchyard design. With the implementation of the switchyard transmission project, the high-precision prediction and automatic optimization of the induced voltage and current values by the GA-BP neural network and MOPSO algorithm have reference values for the conductor layout and phase sequence optimization during the line erection process to ensure the smooth implementation of the project. At the same time, the monitoring data during the actual operation of the last line can continuously supplement the training data set to further optimize the parameters of the prediction model and improve the generalization ability and prediction accuracy.
Acknowledgement: The authors thank TopEdit (www.topeditsci.com) for its linguistic assistance during the preparation of this manuscript.
Funding Statement: The authors received no specific funding for this study.
Author Contributions: The authors confirm contribution to the paper as follows: study conception and design: Deng Lu, Xujun Lang; data collection: Xujun Lang; analysis and interpretation of results: Bo Yang, Ziyang Li, Hang Geng; draft manuscript preparation: Deng Lu. All authors reviewed the results and approved the final version of the manuscript.
Availability of Data and Materials: The data that support the findings of this study are available from the corresponding author, [H], upon reasonable request.
Conflicts of Interest: The authors declare that they have no conflicts of interest to report regarding the present study.
References
1. Ren, C. X., Li, W., Shi, H. G., Zou, D. H., Yan, Y. et al. (2018). 220 kV/500 kV maintenance of a mixed pressure with the four-line transmission line tower. Journal of Electric Power Science and Technology, 33(3), 147–153. [Google Scholar]
2. Shaikh, M. S., Hua, C. C., Hassan, M., Raj, S., Jatoi, M. et al. (2022). Optimal parameter estimation of overhead transmission line considering different bundle conductors with the uncertainty of load modeling. Optimal Control Applications & Methods, 43(3), 652–666. [Google Scholar]
3. Wang, R. Z., Chen, Z. H., Su, Z. G., Zhou, Z. S., Guan, L. et al. (2015). On the propagation of lightning wave considering impulse corona with Insulation flashover model and tower model. Science Technology and Engineering, 15(7), 85–91. [Google Scholar]
4. Huang, G. P., Huang, H. B. (2021). Transformation plan of grounding switches of 500 kV/220 kV four-loop mixed voltage transmission lines on the same tower. Guangdong Electric Power, 34(11), 67–74. [Google Scholar]
5. Dan, S. H., Wu, N., Li, H. D., Jiang, T. (2018). Optimization design of grading ring for 220 kV basin-type insulator based on finite element method and neural network method. High Voltage Apparatus, 54(3), 79–85. [Google Scholar]
6. Guan, S., Ruin, F., Zhou, K., Su, M., Wang, H. (2019). Electrostatic discharge parameters affected by velocity of electrodes based on neural network. Chinese Journal of Radio Science, 34(4), 455–461. [Google Scholar]
7. Yu, L. J., Tian, J., Wu, F., Gong, L. (2022). Prediction of electric field shielding effect of transmission line based on BP neural network. Transducer and Microsystem Technologies, 41(2), 108–110+114. [Google Scholar]
8. Hu, Y. H., He, M., Zhou, C. J., Ding, Z. H., Cai, C. G. et al. (2022). Study on vibration velocity prediction of millisecond delay blasting based on GA-BP neural network. China Mining Magazine, 31(2), 72–77. [Google Scholar]
9. Jiang, Q., Huang, R. M., Huang, Y. C., Chen, S. J., He, Y. Q. et al. (2019). Application of BP neural network based on genetic algorithm optimization in evaluation of power grid investment risk. IEEE Access, 7, 154827–154835. [Google Scholar]
10. Shaikh, M. S., Raj, S., Babu, R., Kumar, S., Sagrolikar, K. (2023). A hybrid moth-flame algorithm with particle swarm optimization with application in power transmission and distribution. Decision Analytics Journal, 6, 100182. [Google Scholar]
11. Zhang, W. B., Zhou, N. R., Tang, L. J., Qi, F. G., Zhao, L. (2017). Research on the non-contact early warning of dangerous electric field by overhead transmission lines. Integrated Ferroelectrics, 181(1), 141–150. [Google Scholar]
12. Wu, T., Xu, X. K., Li, P., Li, B. L., Lv, J. F. (2022). Multi factor analysis on induced voltage and current of 500 kV AC/DC transmission lines on the same tower. High Voltage Apparatus, 58(5), 47–55. [Google Scholar]
13. Wang, X. B., Fei, S. M., Xu, Q. Y., Jin, M. Y., Xue, H. et al. (2015). Constant current charging characteristic analysis of storage capacitor based on BP neural network PID control for permanent magnet vacuum switch. Transactions of China Electrotechnical Society, 30(10), 212–218. [Google Scholar]
14. Han, J. F., Xiao, C., Song, X. B., Lu, J. S., Wang, F. F. (2022). An identification method of electricity theft on energy internet based on GA-BP neural network. Electric Drive, 52(14), 38–44. [Google Scholar]
15. Xu, K. W. (2021). Deformation prediction of diaphragm wall of deep foundation pit based on BP neural network improved by genetic algorithm. Fly Ash Comprehensive Utilization, 35(5), 6–11. [Google Scholar]
16. Chen, Y. L., Shi, Q., Wang, E. Q. (2022). Short-term load forecasting method based on QPSO-ELM combined with GA theory. Hunan Electric Power, 42(1), 64–70. [Google Scholar]
17. Zheng, Y. L., Luo, R. C., Zou, M., Li, Z. Q., Hou, J. (2021). Induced voltage and current simulation of 380 V line parallel operating under 330 kV double-circuit transmission lines. Journal of Electric Power Science and Technology, 36(1), 216–222. [Google Scholar]
Cite This Article
 Copyright © 2023 The Author(s). Published by Tech Science Press.
This work is licensed under a Creative Commons Attribution 4.0 International License , which permits unrestricted use, distribution, and reproduction in any medium, provided the original work is properly cited.
 Downloads
 Citation Tools