
 Submit a Paper
 Propose a Special lssue
 Open Access
ARTICLE

Distribution Network Optimization Model of Industrial Park with Distributed Energy Resources under the Carbon Neutral Targets
College of Economics and Management, Shanghai University of Electric Power, Shanghai, 200090, China
* Corresponding Author: Xiaobao Yu. Email:
(This article belongs to the Special Issue: Advances in Modern Electric Power and Energy Systems)
Energy Engineering 2023, 120(12), 2741-2760. https://doi.org/10.32604/ee.2023.028041
Received 27 November 2022; Accepted 15 May 2023; Issue published 29 November 2023
 View Full Text
 Download PDF
Abstract
Taking an industrial park as an example, this study aims to analyze the characteristics of a distribution network that incorporates distributed energy resources (DERs). The study begins by summarizing the key features of a distribution network with DERs based on recent power usage data. To predict and analyze the load growth of the industrial park, an improved back-propagation algorithm is employed. Furthermore, the study classifies users within the industrial park according to their specific power consumption and supply requirements. This user segmentation allows for the introduction of three constraints: node voltage, wire current, and capacity of DERs. By incorporating these constraints, the study constructs an optimization model for the distribution network in the industrial park, with the objective of minimizing the total operation and maintenance cost. The primary goal of these optimizations is to address the needs of DERs connected to the distribution network, while simultaneously mitigating their potential adverse impact on the network. Additionally, the study aims to enhance the overall energy efficiency of the industrial park through more efficient utilization of resources.Keywords
Nomenclature
| DERs | Distributed Energy Resources |
| MPGA | Multi-Population Genetic Algorithm |
Following the continuous development and progress of comprehensive energy systems in China in recent years, new energy sources in various forms, such as wind, solar, and hydrogen, are connected to medium- and low-voltage distribution networks as distributed energy resources (DERs), which affects the security and economy of the distribution network to a certain extent. Improving the performance of the distribution network and reducing the network loss under the situation of more extensive access of DERs to optimize the operation of distribution networks needs to be addressed.
In September 2020, China established carbon peak and neutrality targets dubbed “carbon peak by 2030” and “carbon neutrality by 2060”. In March 2021, the Ninth Meeting of the Financial and Economic Commission of the Communist Party of China Central Committee stressed the need to deepen the reform of the power system, implement renewable energy replacement, and build a new power system with new energy resources as the main energy system. To achieve its carbon peak and neutrality targets, China will release implementation plans for peaking carbon dioxide emissions in key areas and sectors, as well as a series of supporting measures. In this context, this study constructs a distribution network optimization model for industrial parks with DERs, and verifies the feasibility and economy of the model using a numerical example.
Presently, numerous local and international experts and scholars have conducted in-depth studies on ways of achieving carbon peak and neutrality, the development strategy of DERs, and the construction of a distribution network optimization model.
1.1 Methods for Achieving Carbon Peak and Neutrality
Wang et al. [1] calculated the emission flux based on the concentration of greenhouse gases in the atmosphere. To enhance the capacity of carbon fixation in terrestrial ecosystems, which has been severely underestimated in the past, they constructed a carbon assimilation model and correctly concluded that terrestrial ecosystems absorb and transform 45% of carbon emissions every year in China. From the perspective of carbon emission reduction, Li et al. [2] considered innovation as the driving factor for the achievement of the targets of carbon emission reduction and economic growth, which mainly rely on technological progress to improve the efficiency of carbon dioxide emissions. Mojtaba et al. [3] used a computable general equilibrium (CGE) model to analyze the impact of a carbon tax on social welfare and the rate of emission reduction. They provided suggestions for the implementation of a carbon tax policy by considering Finland, a country with high-energy-intensive industries, as a typical example. Against the backdrop of global efforts to achieve carbon peak and neutrality targets, Zhou et al. [4] studied the prospect of natural gas as a clean and low-carbon fossil energy. They used the long-range energy alternatives planning model and set basic parameters, which concluded that it would show a general trend of stable growth in natural gas consumption in the subsequent 15 years.
1.2 Development Strategies for Distributed Energy Resources
Wu et al. [5] designed a three-level collaborative optimization model focusing on the primary energy utilization rate, carbon dioxide emissions, and operation cost as the objectives. This model was used for the combined cold-heat-power supply system where the gas boiler, internal combustion engine, and absorption refrigerator constitute the core. They considered a hospital in North China as an example to verify the method. Hao et al. [6] constructed a system operation optimization model focusing on the primary energy saving rate, equivalent carbon dioxide emissions, and life-cycle cost. By combining the distributed gas system with solar energy, an integrated photovoltaic thermal supply system (PVST-CCHP) and an integrated photovoltaic thermal generating unit and solar collector (PVCU-CCHP) were proposed. The number of integrated units and gas turbine capacity of the optimal system was also optimized. Ming et al. [7] established a bi-level programming model for the network planning of a regional distributed energy system based on the fluctuations of users’ demand for power and heat. This model aims to minimize the cost of the regional distributed energy system and can be used to solve problems of distributed energy system planning, including the optimal number, capacity, and location of energy suppliers and the optimal heat transmission network.
1.3 Construction of the Distribution Network Optimization Model
Zhang et al. [8] described the probability distribution of wind speed, where the Weibull distribution was used. Based on this, an expression for the divided function of wind power output and wind speed was established. When the wind speed was between the cut-in and cut-out wind speeds, the wind power output and wind speed had a linear relationship. To model and solve the day-ahead optimization of distribution network dispatching, Liu et al. [9] used the light intensity curve of a typical day to represent the photovoltaic output during the dispatching period and then established a multi-period optimization operation model with the target of minimizing energy losses; the output limits of energy storage, capacitors, and reactive compensators were also modeled. Chen et al. [10] used the LARIMA model to analyze the wind power output uncertainty. Based on this, a distribution network optimization operation opportunity constraint model with the minimum expected value of network loss was established. For the radial operation of the distribution network and limitations of voltage and feeder capacity, Wang et al. [11] constructed a fault recovery model of the distribution network to maximize the recovery of lost load and minimize the number of switch operations.
Given the above research background, most local and international scholars separately discuss the development of DERs and the optimization of distribution networks, focusing only on one of them. However, this study focuses on both aforementioned aspects. Considering an industrial park as an example, with the support of an increasing number of new energy enterprises, a large number of renewable energy resources, mainly wind energy resources and photovoltaics, are connected to the distribution network. Sometimes, these directly provide an energy supply for users in industrial parks. However, while the park supplies itself with DERs, the economy and reliability of its distribution network face new challenges. Therefore, this study uses an improved B-P algorithm to establish a relevant model for predicting the annual load of an industrial park. The results show that comparing the prediction to the actual load data improves the accuracy of the prediction of the annual load. After classifying users into three corresponding levels according to the power consumption characteristics, a multi-population genetic algorithm (MPGA) was used to construct and solve the optimal operation model of the distribution network. The innovations of this study are as follows.
First, Optimize the traditional BP algorithm, consider the dynamic error gradient change, incorporate dynamic weights, which is a momentum term to adjust the connection weight, effectively improve the convergence speed, and suppress the problem of locally optimal solutions.
Second, Quantify node voltage, current, and distributed power capacity constraint factors, and convert these technical constraints into cost constraints by setting penalty factors, and then build a distribution network planning model based on multi-objective optimization.
In addition, this research helps achieve optimal dispatching of the distribution network in an industrial park. Owing to the carbon peak and neutrality targets, this research is of certain practical significance for the optimal operation of the distribution network. The remainder of this paper is organized as follows. The first section is the introduction constituting a review of the results of local and international studies, and of innovations. The second section discusses theories and models, including construction of the load forecasting and distribution optimization models. The third section presents the results and analysis. An industrial park was selected for the simulation, and the simulation results were analyzed. The fourth section is the conclusion, and summarizes the results and scope for further study.
Load forecasting is a key factor in distribution network optimization. In contrast to the traditional optimization of distribution networks, the widespread adoption of DERs leaders to increased load diversity. Compared to traditional generation loads, DERs cannot be treated as conventional generation loads in load forecasting. DERs are characterized by high randomness, large volatility, and uncontrollability. Therefore, the increasingly widespread adoption of DERs necessitates relatively detailed load analysis and predictions. For the load forecasting of power systems, for decades, local and international researchers have used various calculation methods and forecasting models to continuously improve the accuracy of prediction [12–15]. In this study, an improved B-P algorithm is used to forecast the annual load of an industrial park and construct the corresponding model to prepare for subsequent user segmentation and distribution network optimization.
The load forecasting model of distribution network is generally constructed by BP neural network with 3 layers, which are composed of the input layer, the hidden layer and the output layer, as shown in Fig. 1. The ability of neural network to fit complex functions increases with the increase of the number of hidden layers, but the computational complexity and training difficulties increase as well.
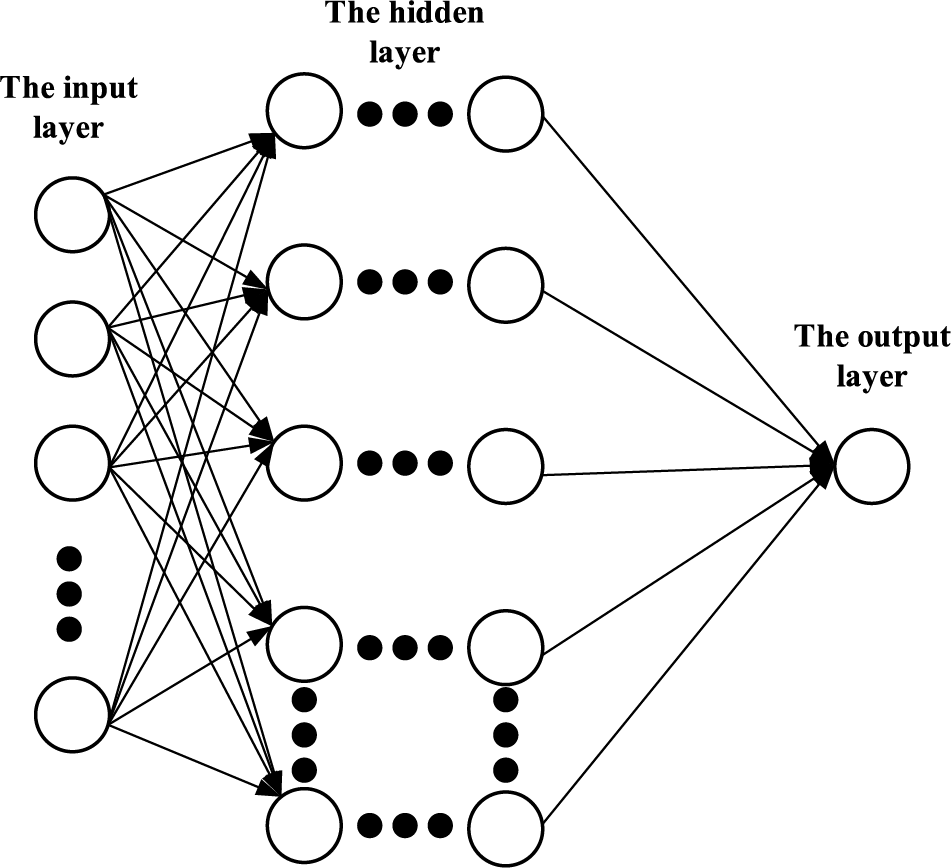
Figure 1: Deep neutral networks framework
For neutral networks with
where
Backpropagation training parameters based on B-P algorithm are:
where the number of training iterations is noted as
2.1.2 Traditional Back-Propagation Algorithm
The back-propagation (B-P) algorithm was first proposed in 1974. It is a multi-layer forward neural network based on error backpropagation and has been gradually applied in many fields [16]. The B-P neural network is composed of three parts: the input layer, the hidden layer, and the output layer. Being a classical feed-forward network, input samples pass through the input, hidden, and output layers, and are finally output. Each node between layers is connected by a weight, where the input and output can be single or diverse.
In the B-P neural network, the input vector of input layer is assumed to be
Among them, the output error
where
2.1.3 Improved Back-Propagation Algorithm
The deep neutral networks only consider the direction of the error gradient descent when adjusting the connection weights from the input to the hidden layer. As a result, the training process sometimes oscillates and consequently slows down the convergence. Therefore, this study improves the traditional B-P algorithm by adding a momentum term to adjust the connection weight, thus improving the accuracy of load forecasting, to comprehensively prepare for subsequent user segmentation and distribution network optimization.
To increase the training speed of neural networks, when adjusting the connection weights, a certain proportion of the adjustment quantity of the previous learning process, the momentum term, can be added.
Hence, the formula used to adjust the connection weight with the momentum term can be expressed as follows:
where
The addition of momentum terms is used to change the learning rate of the B-P algorithm with momentum instead of a constant value in the training process [18]. The momentum items interfered with the adjustment of the connection weight. After introducing momentum items, the adjustment of the connection weights from the hidden to the output layer in the same vector direction alleviated the oscillation in the training process. Even if the adjustment of connection weights has two different directions, it makes sense. The purpose is to speed up the training process of the B-P algorithm and the convergence of the neural network to simultaneously increase the load forecasting accuracy of the distribution network at the same time [19–21].
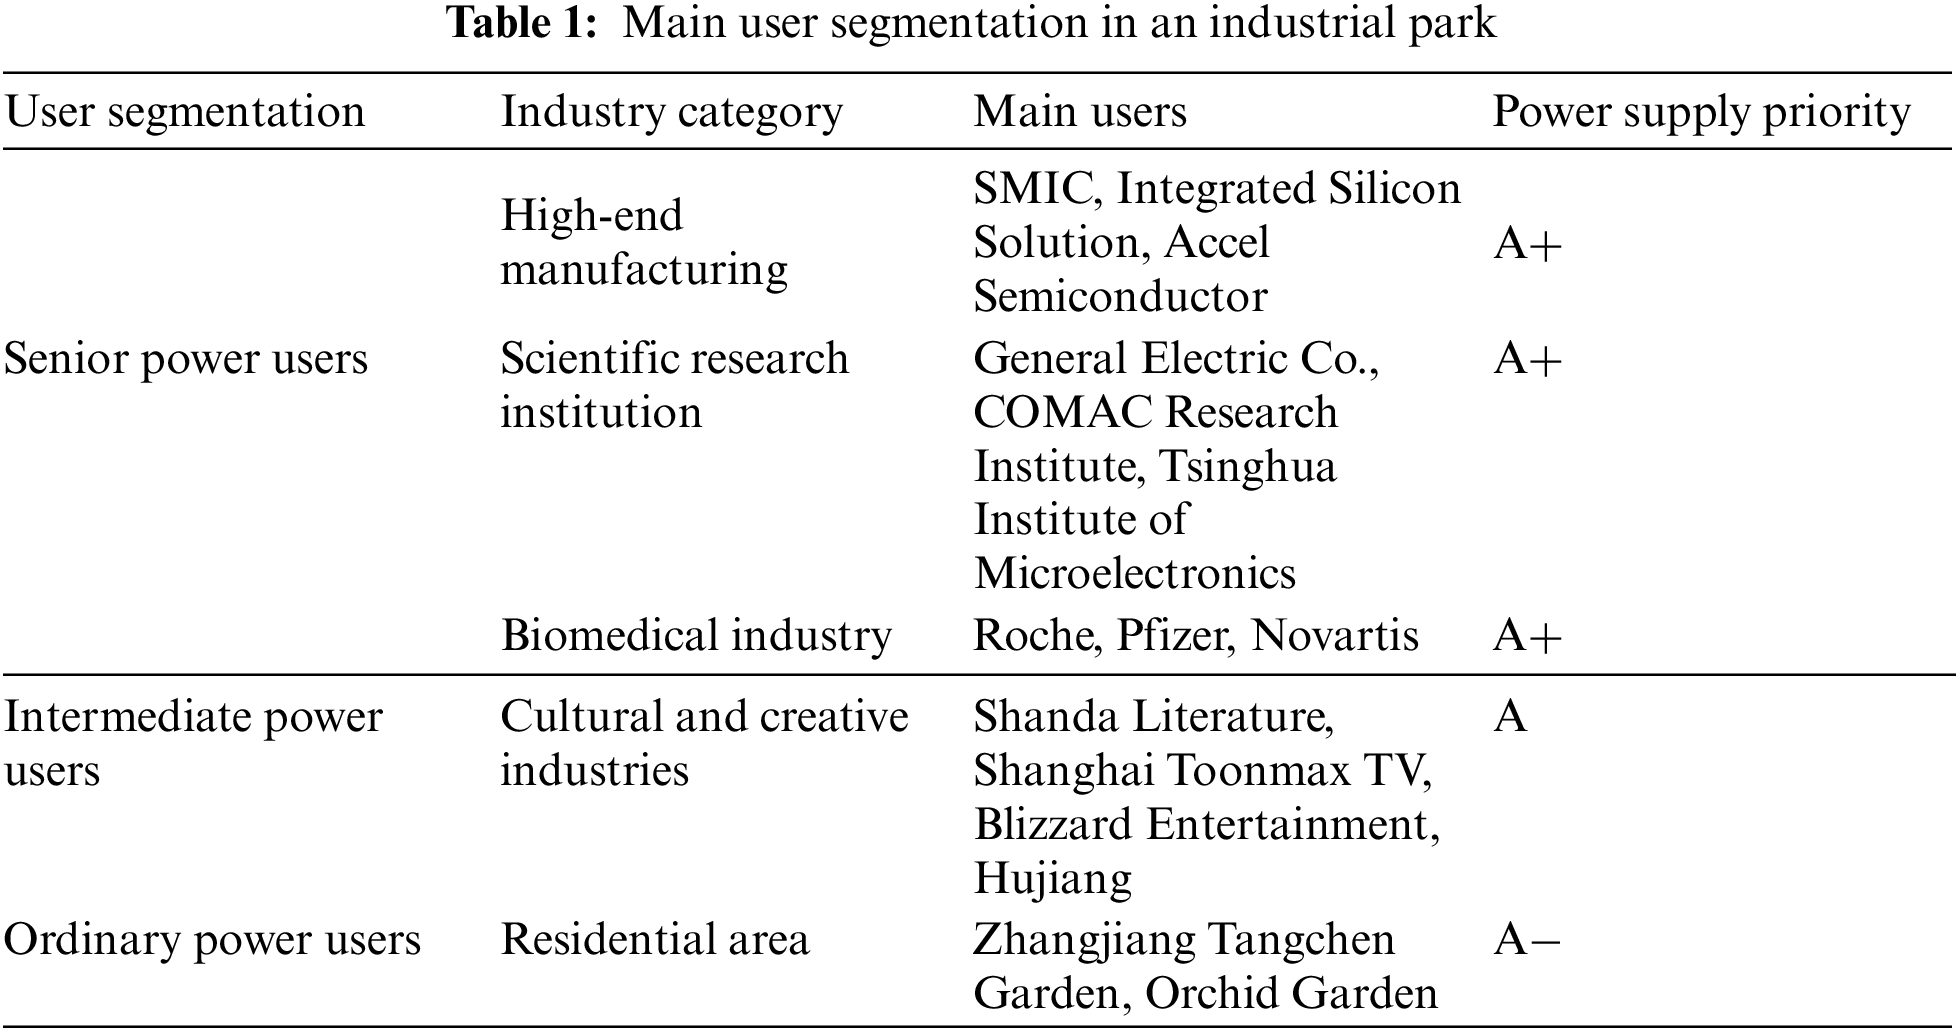
The industries in the park mainly include high-tech manufacturing, biomedical industry, scientific research institutions, cultural and creative industries, and residential communities. According to the characteristics of these leading industries and users’ different demands for electricity, the users’ economic value and social influence can be reflected. Combined with factors such as users’ nature of work, commercial electricity usage, and local power supply conditions, the stability of electricity usage, sensitivity of power cut, risk of arrearage, safety of electricity, and requirement of power quality in the industrial park exhibit different features. Therefore, all users in the industrial park are divided into three corresponding levels: senior, intermediate, and ordinary power users. All user levels are qualitatively analyzed separately.
These users have high socio-economic status and influence. They also exhibit high stability with respect to electricity usage, sensitivity to power cuts, and demand for power quality, but lower risk of arrearage. Disruption in power quality will considerably harm significant electrical equipment and produce a large amount of waste, thus complicating production resumption or normal operations. These users include high-end manufacturing, the semiconductor industry, and hospitals.
Senior power users have three power supply lines, including two frequently used power lines and one stand-by power line, which are supplied by a special power line and a warehouse. Three power lines should originate from three different substations (under stringent conditions, two frequently used power lines should originate from two different substations, and stand-by power lines from the same substation as one of the frequently used power lines. However, the bus segments and the main transformers should be different). When any one of the two power lines fails, the third power line can guarantee a normal power supply [22,23]. The dual power supply standards for senior power users are as follows. Users of 10 kV and above must originate from different upper substations that are traced back to different 220 kV substations. When the power supply originates from switch stations, it should be traced back to a different upper substation through a switch station. Incoming power lines for senior power users should come from different line channels, except the inbound end, and cables should be laid at certain intervals.
2.2.2 Intermediate Power Users
These users have moderate socioeconomic status and influence. They exhibit high stability with respect to electricity usage and sensitivity of power cuts, but certain requirements of power quality and risk of arrearage. Disruption of power quality will cause considerable harm to these power consumers, and consequently cause public disorder and the corresponding economic losses.
In principle, intermediate power users should have two power supply options that are provided by a special power line. The two power lines can originate from different bus segments of the same substation (corresponding to different main transformers). When one power supply is faulty, the other can supply power independently.
These users have low to moderate socioeconomic status and influence. They exhibit low stability with respect to electricity usage and sensitivity to power cuts, but high demand for power quality and risk of arrearage. Disruption in power quality will not cause significant economic loss. Such users do not have strict requirements regarding power quality but only need it to be within the limits of the national standard. They are only affected by a long-term continuous power cut or excessive voltage deviation.
For ordinary power users, a single power supply can be used after safety and technical proofs. Double-circuit power users should come from different substations or bus segments in the same substation. Common dual- and multi-power supplies are appropriate for the same voltage level. Generally, standby power is not provided, but emergency power is used for maintenance and security.
In summary, the corresponding power supply priority is given according to user segment as shown in Table 1: A+ means the users belong to the highest power supply priority, A to higher power supply priority, and “A−” to the general power supply priority.
The connection of a large number of DERs leads to inaccurate load prediction, complicated operation, and low power quality of the distribution network. It also has different degrees of impact on all three types of power users in the industrial park. However, if properly planned and analyzed, it can have positive effects on the distribution network of industrial parks. For example, the reliability of the power supply for users in the microgrid system was improved, the capacity demand of the distribution network was reduced, and the tidal distribution was optimized.
Therefore, should the accuracy of load prediction meet requirements, the operation of the distribution network can be planned and optimized through a MPGA, according to user segmentation. To meet the requirements of medium- and low-voltage DERs, the following model can reduce various adverse impacts on the distribution network caused by distributed energy, and ultimately facilitate more efficient energy utilization in the industrial park.
2.3 Distribution Network Optimization Model
2.3.1 Multi-Objective Genetic Algorithm
In this paper, MOGA is used to solve the immature convergence problem in the optimization process of the genetic algorithm. Given different control parameters to multiple objectives for evolutionary search at the same time, the corresponding optimal information of various groups is exchanged through proper function values. That is to realize the diversity of population evolution and ensure the superiority of the algorithm.
In addition, the genetic algorithm has strong global search ability. Considering the characteristics of DERs configuration in the park, the genetic algorithm is one of the best algorithms [24]. Therefore, MOGA is chosen to solve the distribution network optimization model of the park, and its algorithm flow is shown in Fig. 2:
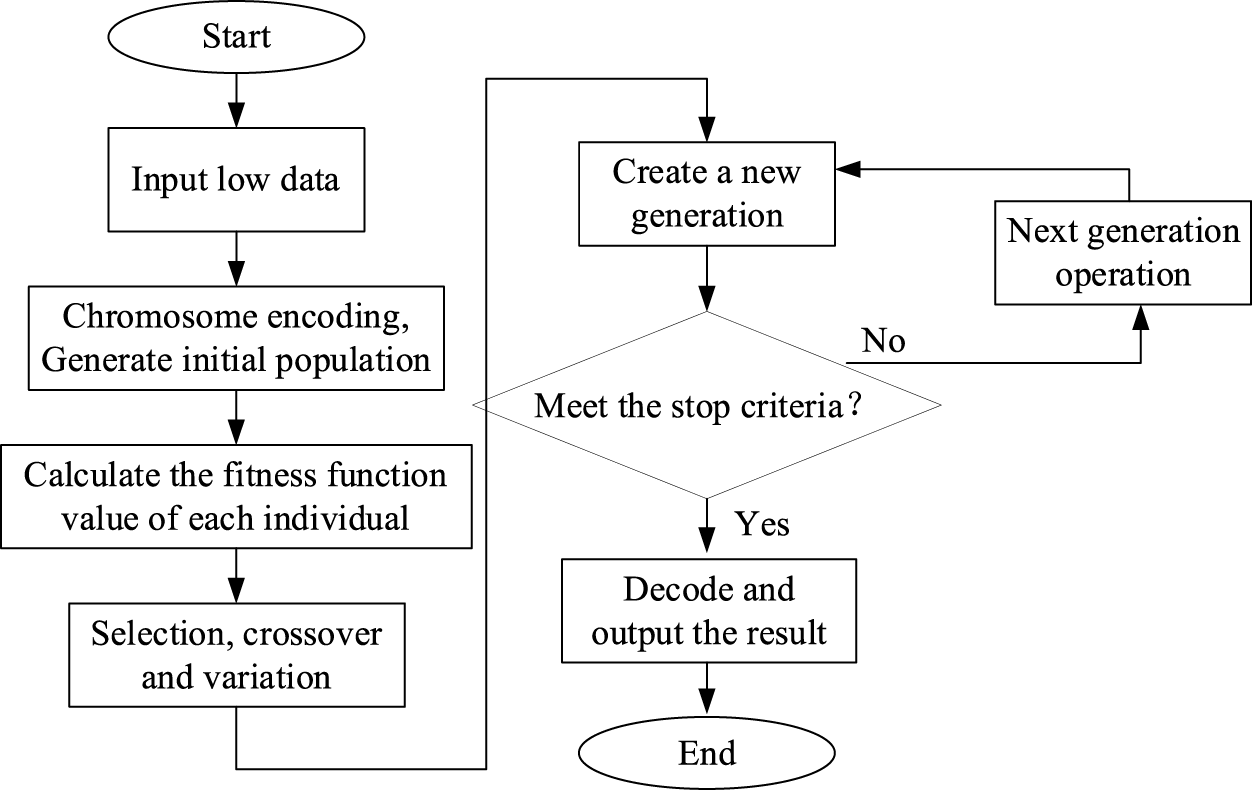
Figure 2: Steps of multi-population genetic algorithm
In this section, an optimization model of distribution network in industrial parks with DERs is constructed. Under the condition that the type, location and capacity of DERs are unknown, the minimum total cost of distribution network operation and maintenance needs to be reached. As the objective function after introduction of DERs, three inequality constraints of nodal voltage constraint, wire current constraint and capacity constraint of DERs are introduced in the form of penalty factor. Thus the normalized objective function is designed.
2.3.2 Construction of the Optimization Model
The distribution network optimization model in this study is based on the distribution network of an industrial park containing DERs. The objective is to minimize comprehensive investment in the distribution network system, thus achieving optimal economic benefits. Therefore, the consideration of multiple objective factors, such as line cost and active network loss, is required. Consequently, a multi-objective optimization model is established and solved using the MOGA for the multifactor problem of distributed power supply planning.
(1) Construction of the distribution network optimization model
Based on the premise of the deep neutral networks framework formulated above, a multi-objective model is constructed, considering the dispatching requirements of the distribution network. Appropriate constraints were set for the corresponding situations, and the specific model construction process was as follows:
1) The objective function is expressed as follows:
where
With the support of an increasing number of new energy enterprises in the industrial park, during distribution network optimization, the annual operation and maintenance cost (
The specific expressions for each sub-objective function selected in this study are as follows:
a) Costs required for line upgrading and transformation (
where
b) Annual operation and maintenance cost of distributed generation (
The annual operation and maintenance cost of distributed generation (
where
c) Network loss cost (
where
2) Constraint condition
The constraint conditions of this configuration problem can be divided into equality and inequality conditions. The following section introduces each constraint condition.
a) Node voltage constraint is expressed as follows:
where
b) Current constraint is expressed as follows:
where
c) Distributed power capacity is expressed as follows:
where
By incorporating the node voltage, branch current, and distributed power capacity constraints into the initial objective function, a new objective function can be obtained as shown below:
In summary, the construction of the optimization model was completed by setting the objective function and constraints. In addition, the constraints were elaborated to fully prepare for the subsequent solution of the distribution network optimization model.
(2) Solution of the distribution network optimization model
According to the solution process given, the specific steps of distribution network optimization of industrial parks based on MPGA are as follows, and the flow of the corresponding algorithm is shown in Fig. 2.
1) Input raw data such as wind, light and load of a certain day in the park.
Initialize the parameters of distribution network and the power consumption of the park during the study period. Calculate the distribution network operation cost of the park in this period. The variables are discretized.
2) The formation of initial population.
To ensure the diversity of population and to avoid the immature convergence of the genetic algorithm, MPGA are used to generate initial population of a certain size. In this paper, binary coding is used to correspond the population individual to the load of each node in distribution network. Each interval is discretized according to the load node. So the operation process of distribution network can be represented by binary information of these load nodes.
3) Solving the fitness of individual population.
According to the model, the power consumption priority division index of users in the park is obtained, through which the fitness of all individuals is calculated. At the same time, calculate the crowding distance of individuals in the same population layer, which is arranged in ascending order.
4) Migration among subpopulations.
In the process of evolution, each subpopulation exchanges some chromosome information according to the mobility. Afterwards, the immature convergence problem in the process of algorithm evolution is addressed, while the resulting population still maintains diversity.
5) First, the selection method of elite individual retention is used to select the optimal individual to form the next generation of new population, and then the other individuals in the population are selected to meet the selection conditions according to the roulette algorithm to form the next generation of new population.
6) After the improved adaptive crossover operator and mutation operator determined, crossover operation and mutation operation are carried out on the chromosome genes of population individuals. Then a new offspring was generated while subpopulation with the worst fitness eliminated.
7) Whether it has reached the set iteration should be judged in the process of population evolution.
If these conditions are not met, return to step 3) to step 6); If conditions satisfied, algorithm coms to an end. Save the optimal solution and output the optimized operation cost of the distribution network in the industrial park.
In this paper, the solution process above is brought into the optimization model of the distribution network. That is, input the raw data about nodal voltage, wire current and capacity constraint of DERs of each load node in a certain year in the park. Then the initial population is generated using the decimal random coding method. Based on the fitness function value of each individual, the solution whose power capacity is greater than 10% of the maximum load is eliminated and replaced with the solution meeting the conditions. At last, continuous information exchange within populations is realized and the global optimal solution is approached constantly [25].
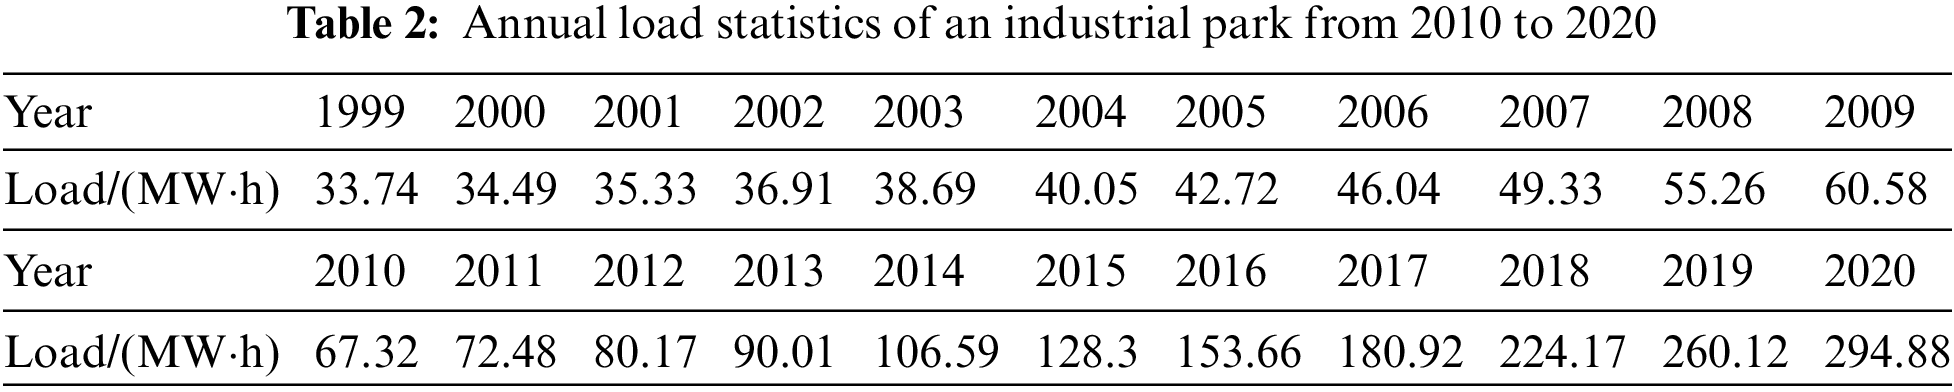
The annual loads on the industrial park from 2010 to 2020 are presented in Table 2. To distinguish the progress of the improved B-P algorithm compared with the traditional one, the traditional and improved B-P algorithms are used to train the annual load data of the industrial parks. The accuracies of the prediction results differed significantly.
First, determining the structure of the load forecasting model is necessary. In this study, a B-P neural network containing ten inputs and a single output along with a hidden layer was established under the simulation environment of MATLAB 2016a. The initial learning step was set as 0.5. The maximum number of training steps was set to 1000 and the expected error was 0.001. The activation function used by each layer was selected as a sigmoid function.
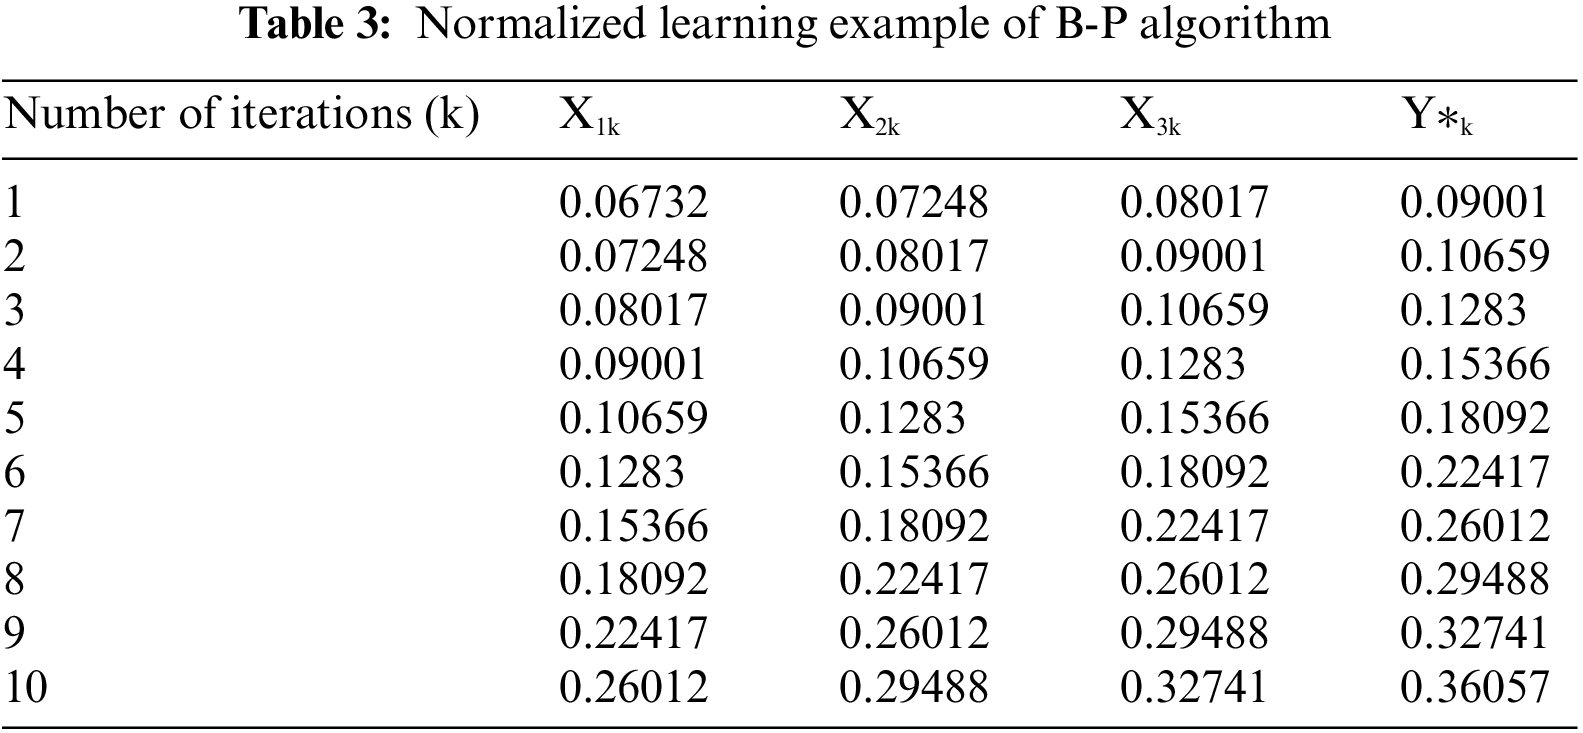
Upon construction of the model, the load for the subsequent year can be obtained at a single output node by iterating the load for ten consecutive years. For example, when choosing the load of ten consecutive input patterns, the number of input nodes is set to 10, that is n = 10. The load of the eleventh year is then obtained as an output. The following ten learning examples can be obtained. In other words, the load of the first ten years was used to predict the load of the eleventh year. After obtaining all the load forecasting data, they were compared with the original data. Finally, the accuracy of the load forecasting model was verified based on a detailed comparison. In addition, in the network training process, the original data must be normalized, as shown in Table 3.
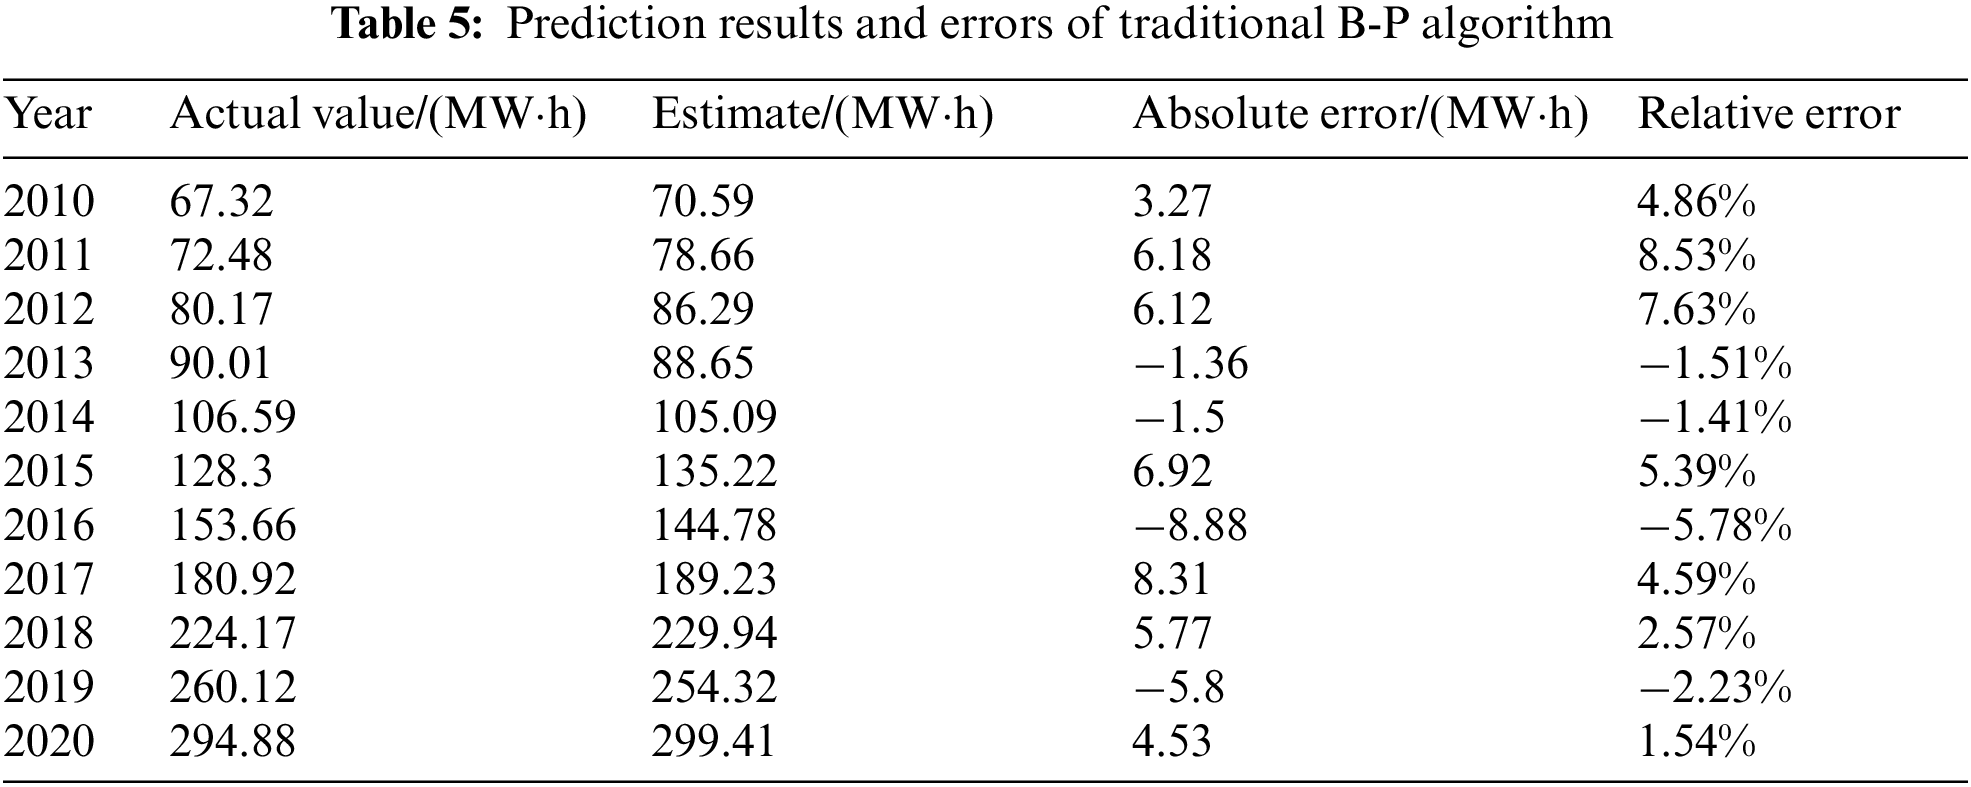
After the learning times met the accuracy requirement with these ten instances from Table 3, a load forecasting model based on the traditional B-P algorithm was successfully constructed. The annual loads of 1999 to 2009 were used as the input patterns for the load forecasting model. Then, the output value multiplied by 1000 was the prediction for 2010. Similarly, using loads for 2000 to 2010 as the input can yield the prediction for 2011. The final prediction results and errors when the maximum learning step was reached are listed in Tables 4 and 5.
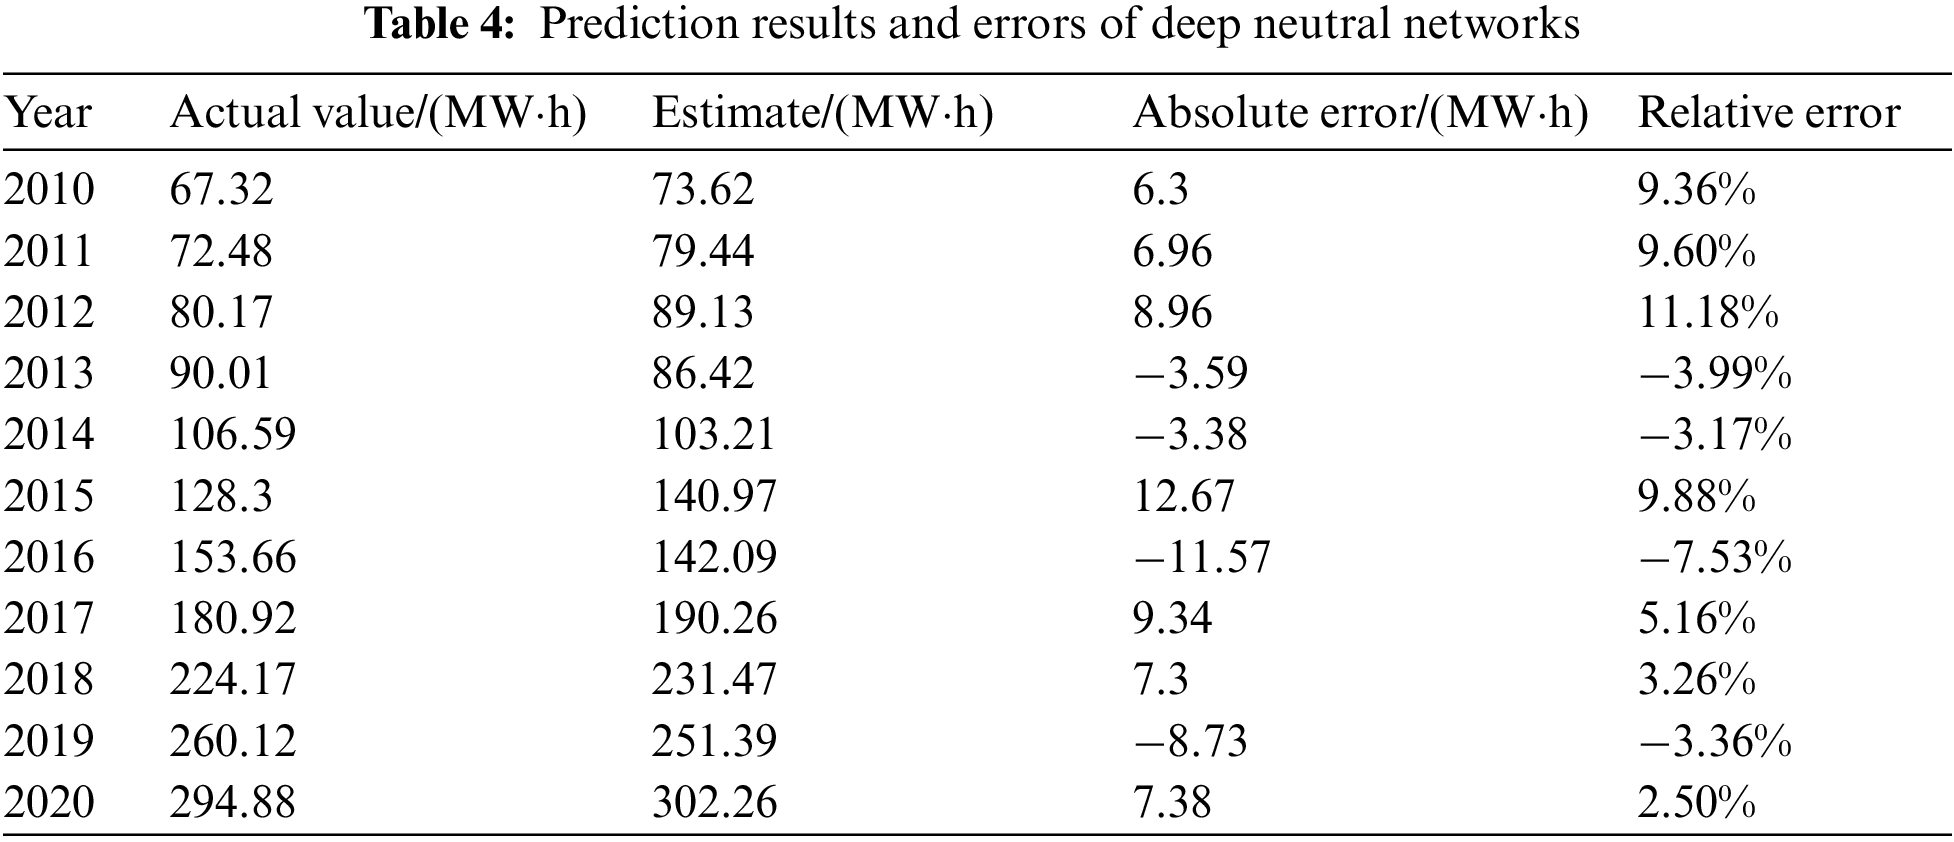
An improved B-P algorithm was constructed by introducing the momentum coefficient, as shown previously. The iterative process was repeated similarly. The simulation prediction results and errors after reaching the aforementioned maximum learning step set are presented in Table 6.
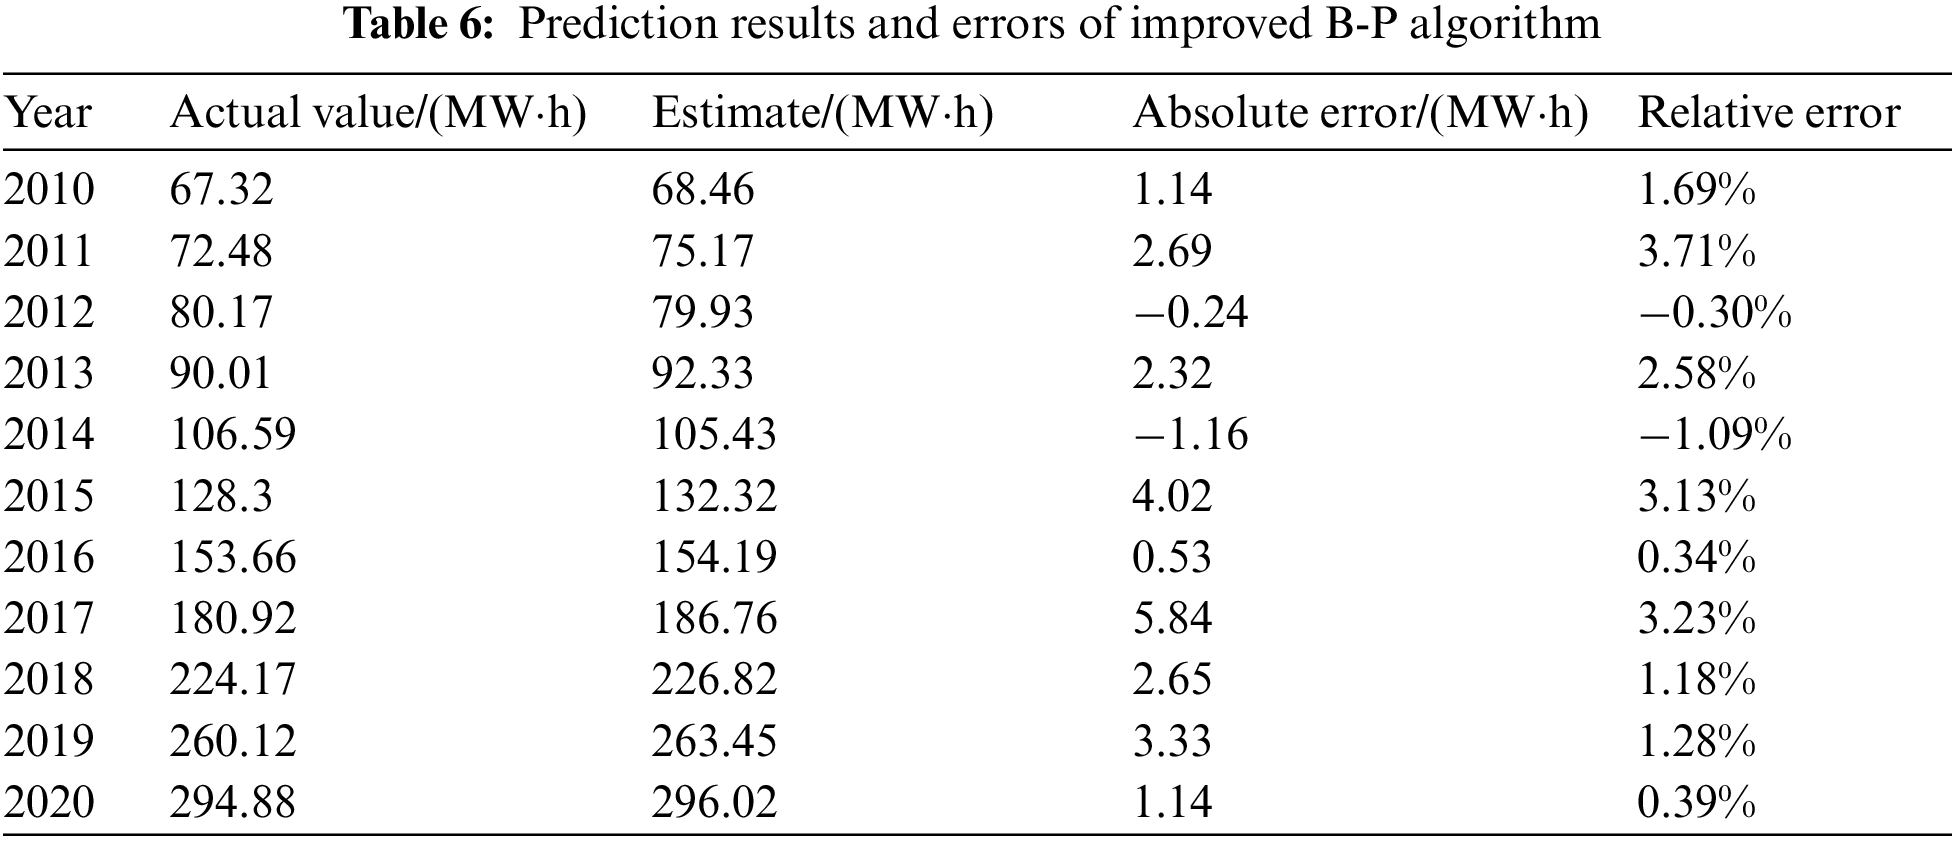
Based on the prediction results above, the maximum relative error of deep neutral networks for load forecasting is 11.18%, and the average absolute value relative error 2.73%. The maximum relative error of the traditional B-P algorithm for load forecasting is 8.53%, and the average absolute value relative error 2.20%. Correspondingly, the maximum relative error of the improved B-P algorithm for load forecasting was 3.71%, and the average absolute value relative error 1.47%. In conclusion, the prediction accuracy of the improved B-P algorithm is more stable than that of the traditional B-P algorithm.
Furthermore, the comparison in Fig. 3 shows that the prediction curve obtained by the improved B-P algorithm is closer to the actual load curve of the industrial park. This indicates that the improved B-P algorithm with the addition of the momentum factor is significantly more optimized than the traditional B-P algorithm in terms of the prediction accuracy. In addition, the prediction accuracy is stable compared with the traditional B-P algorithm; therefore, the improved B-P algorithm meets the application requirements for distribution network load forecasting in this industrial park.
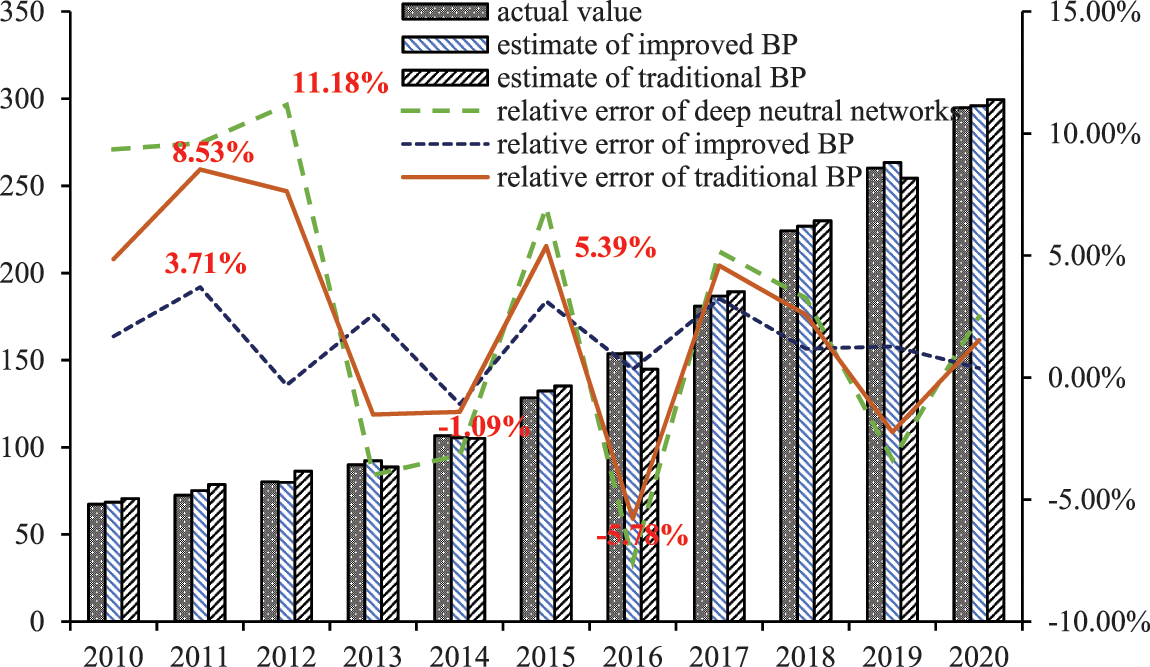
Figure 3: Simulation prediction results comparison of an industrial park from 2010 to 2020
Besides, according to the user segmentation in the industrial park and the response characteristics of each dispatching unit of the distribution network, some nodes and their lines were selected to create a 24-node 10 kV medium-voltage distribution network. As its distribution network structure is shown in Fig. 4, nodes 1 and 4 are senior power user nodes; nodes 2, 3, 5, and 6 are intermediate power user nodes; and nodes 724 are ordinary power user nodes.
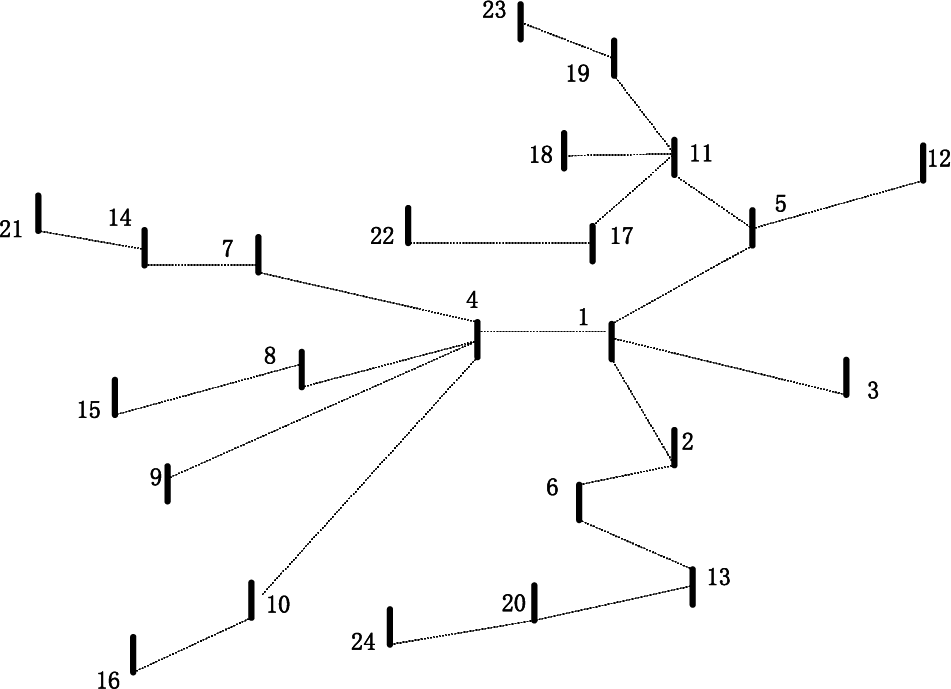
Figure 4: 24-node 10 kV medium voltage distribution network in an industrial park
To ensure that the simulation can be carried out smoothly, the installed capacity of distributed generation is selected as an integer multiple of 100 kVA. For each node where the distributed generation is installed, its capacity is no greater than the actual load of the node. The total capacity of distributed generation access in an industrial park does not exceed 20% of the maximum load. In this study, distributed generations were treated as PQ nodes with a constant power factor of 0.9 [26].
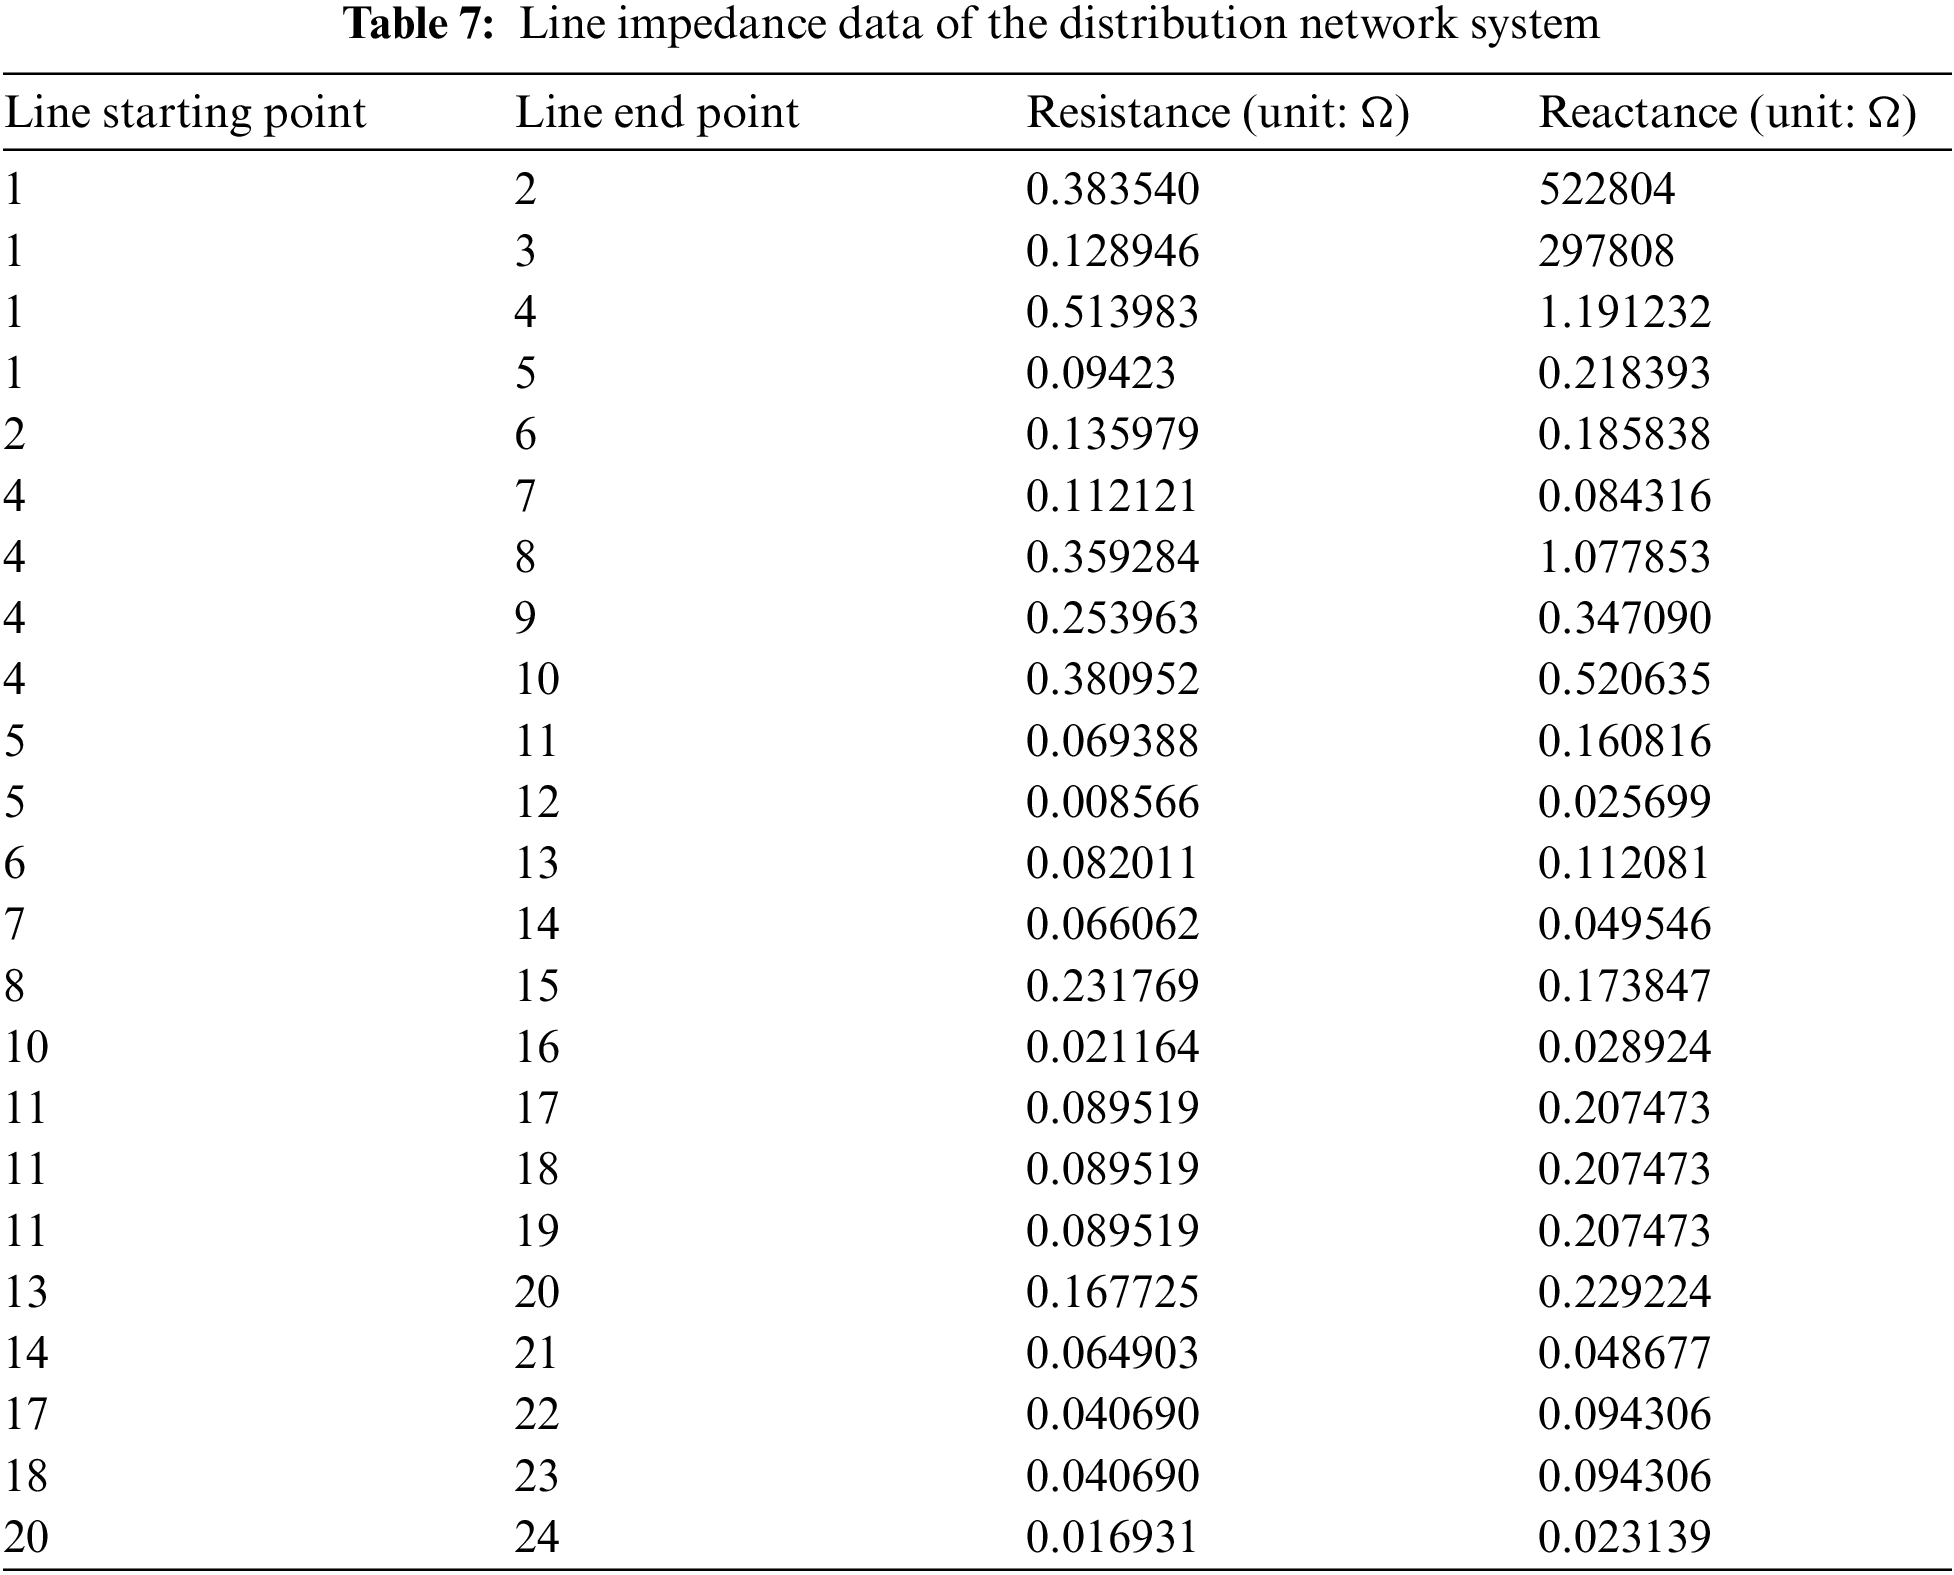
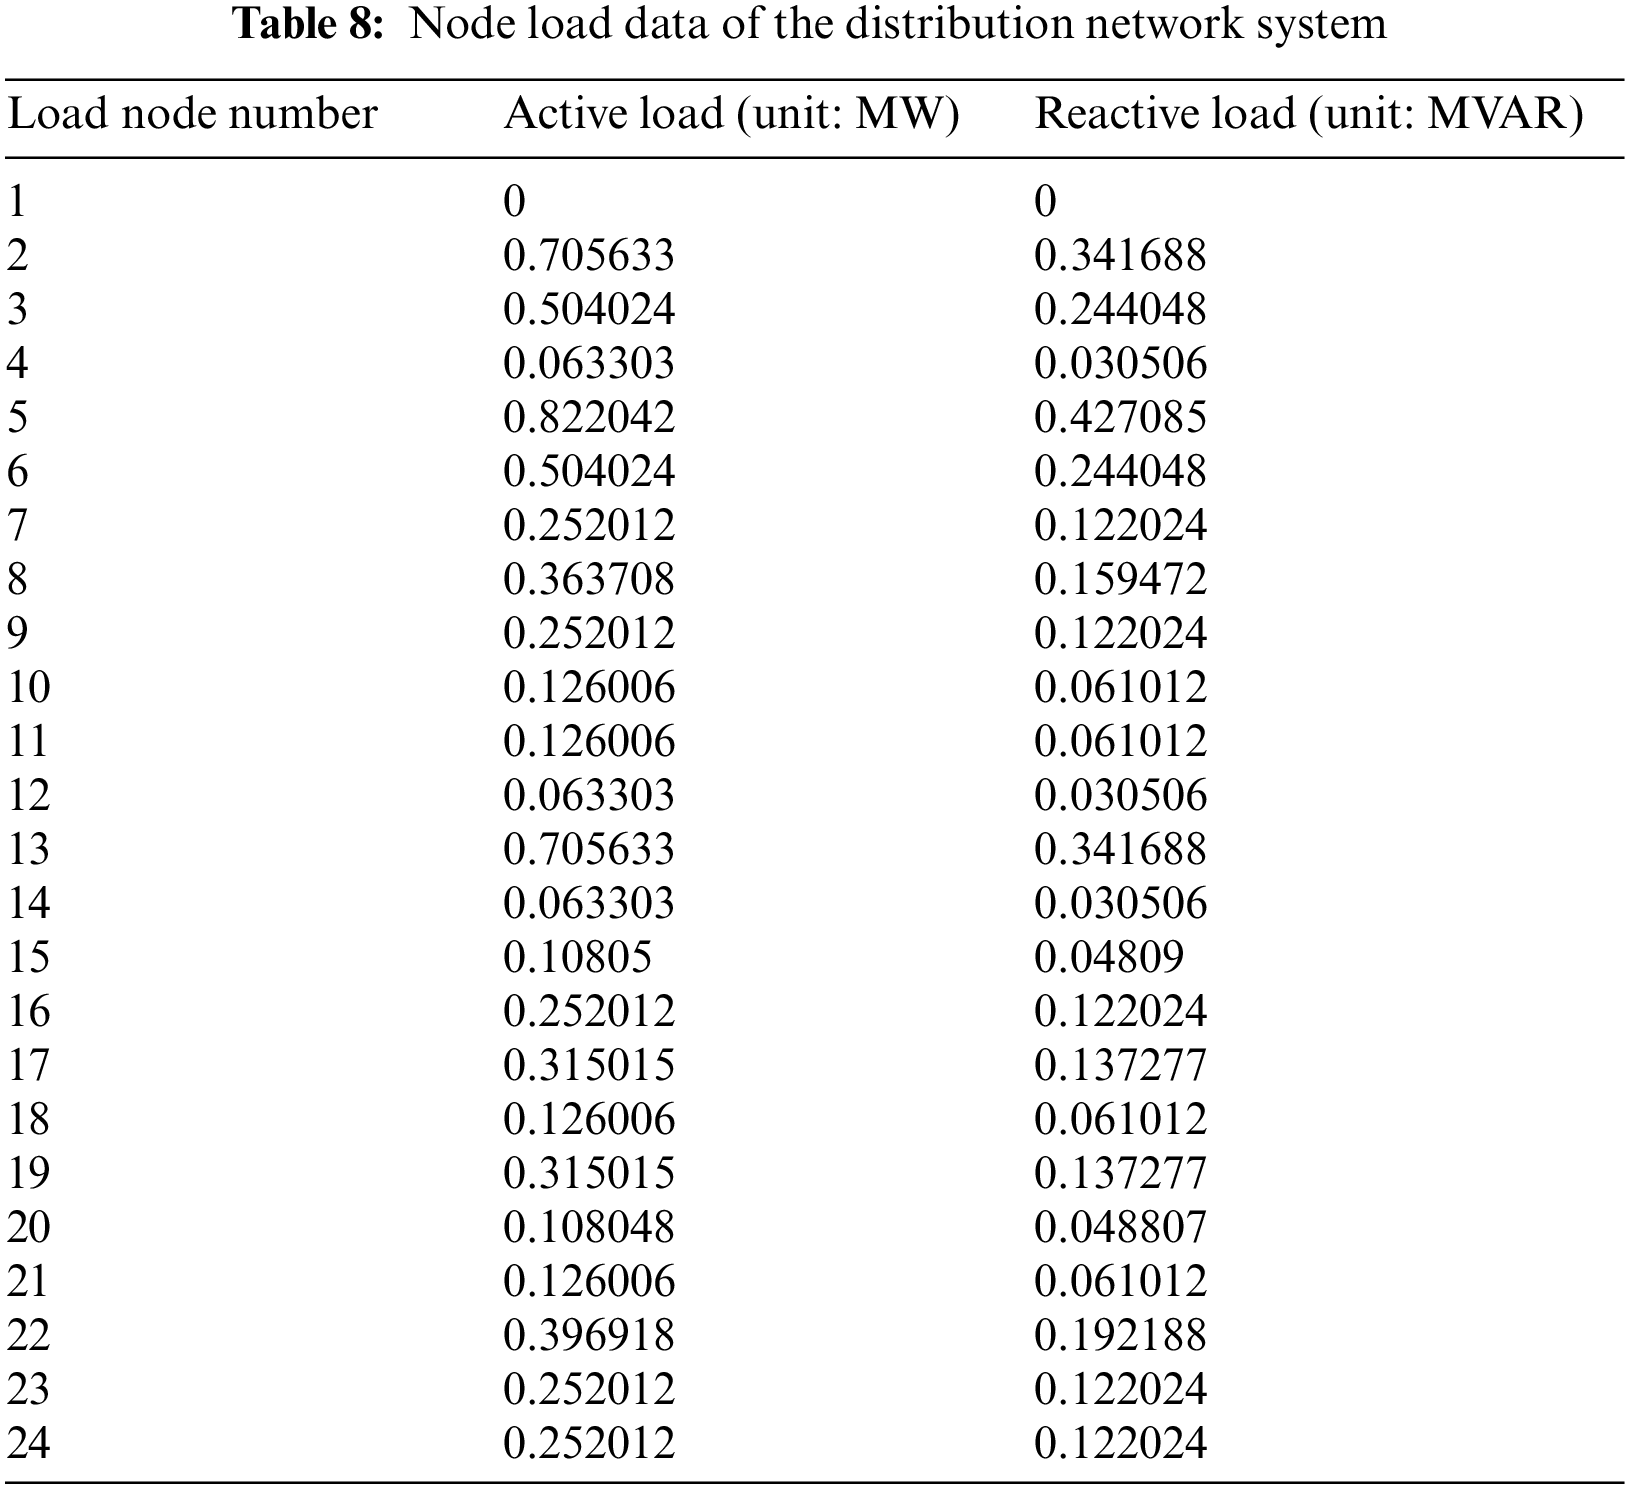
As shown in Fig. 4, Tables 7 and 8, part of the distribution network system was selected in this study as the topology of the distribution network. In addition, its branch impedance and node load were set up completely, and the following variables were set as follows:
Annual maximum load utilization hours:
In this study, the parameters of the MPGA were set as follows: the population number was set to 60. Maximum iteration time:
In a situation where the number, installation location, and installation capacity of distributed generation in this industrial park constitute a random population, the multi-population optimization of distributed generation in a distribution network system of 24 nodes was considered. The simulation and optimization results are presented in Tables 9 and 10, respectively.
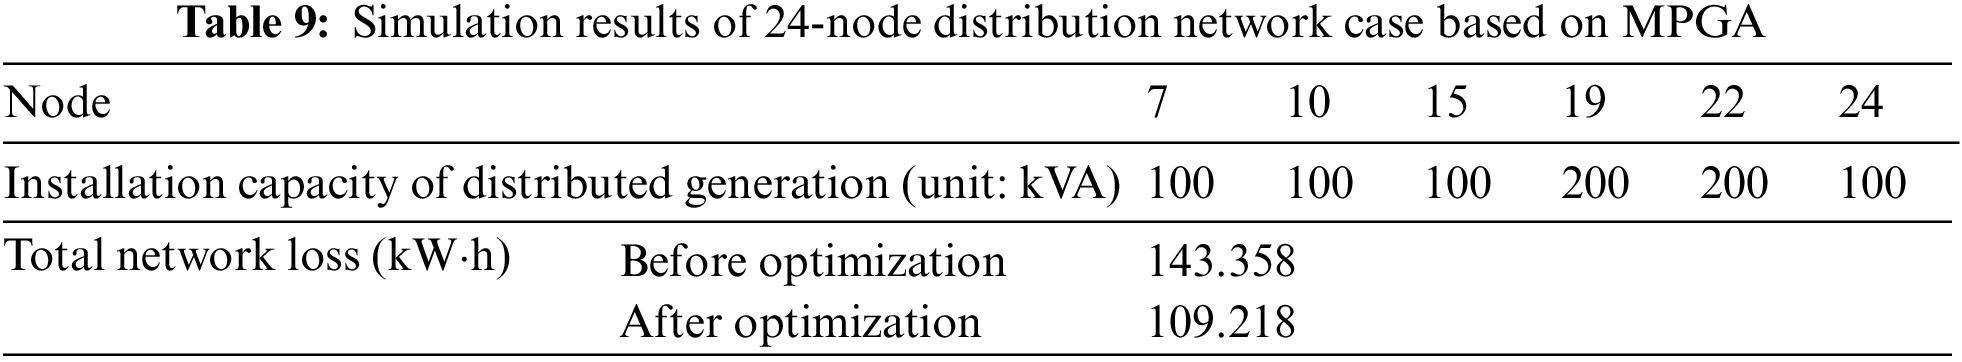
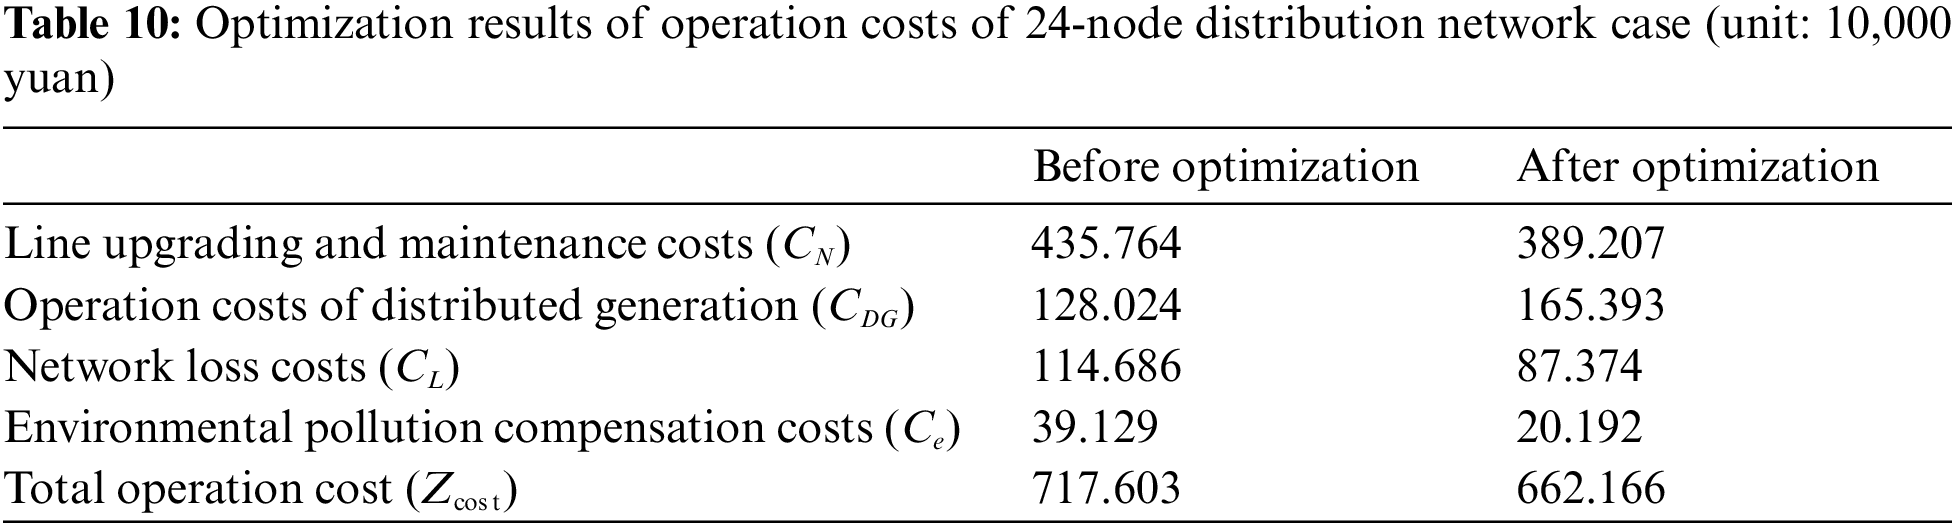
As seen in the two tables above, the introduction of DERs with multi-population optimization of their capacity and installation locations has considerable economic value for the distribution network of this industrial park. The results of the simulation and calculation show that the operational cost of distributed generation in the industrial park increases compared with the case without optimization. However, the network loss in the optimized distribution network system decreased significantly by approximately 23.8%, and the operational cost decreased by 7.73%. In other words, it saved 554,370 yuan in total. Therefore, access to the distributed generation of reasonable capacity at the right location in the distribution network can effectively delay the relevant line upgrades and reduce the active network loss of the system. Simultaneously, the distribution network optimization can significantly reduce the total operational costs, resulting in relatively high economic benefit. The MPGA used in this study can be inferred to have high stability and practicality in the process of solving the distribution network dispatching problem with DER access in this industrial park.
Considering an industrial park as an example, through load forecasting, user segmentation, model construction, and other links, this study successfully optimized the operation of a distribution network with DERs. Under the background of carbon peak and neutrality targets, research on the optimal operation of distribution networks is of practical significance, particularly in industrial parks with DERs. The conclusions drawn are as follows:
(1) The improved B-P algorithm can significantly increase the accuracy of load forecasting in industrial parks compared to the traditional B-P algorithm. In this study, an improved B-P algorithm was used to forecast the annual load of an industrial park and construct a corresponding model. The results show that the maximum relative error of the traditional B-P algorithm was 7.63%, and the corresponding average absolute relative error 2.20%. The maximum relative error of the improved B-P algorithm was 3.71%, and the corresponding average absolute relative error 1.47%. Therefore, the improved B-P algorithm can be inferred to have more advantages than the traditional one without improvement.
(2) Power consumption indices of industrial parks provide a basis for user segmentation. To evaluate users’ electricity usage, production characteristics and local factors such as power supply conditions, all power users of the industrial park are categorized under A+, A, and A− based on power supply priority. This is the same regardless of senior, intermediate, or ordinary power users, which lays the foundation for the construction of the distribution network optimization model.
(3) A MPGA is applied to distribution network optimization, which effectively reduces the energy loss and maintenance cost of the distribution network. According to user segmentation, three constraints include node voltage, wire current and capacity of distributed power supply were introduced, and the minimum total operation and maintenance cost of distribution network was taken as the objective function to construct an optimization model of distribution network in industrial park with DERs. Based on the MPGA, the capacity and installation location of distributed generations are multi-population optimized. Compared with the situation without optimization, although the annual operation and maintenance cost of distributed generation increased slightly, the network loss significantly decreased by approximately 23.8%. Consequently, the total operational cost of the distribution network decreased by 7.73%. Hence, compared with the total cost without optimization, it saved 554,370 yuan.
Above all, based on feasibility and economy, this study may provide reference for the stable operation of distribution networks in industrial parks. However, the study has certain limitations such as the random volatility of the distributed generation and their fault attributes, which are not comprehensively considered. Fault detection and treatment of distribution networks should be the focus of future research. The discipline related to the optimal operation of distribution networks should be continuously studied in-depth in future.
Acknowledgement: Thanks are due to Dr. Yu for assistance with the experiment and valuable discussion. We thank Shanghai Municipal Social Science Foundation for funding support.
Funding Statement: The paper is supported by the Shanghai Municipal Social Science Foundation (No. 2020BGL032).
Author Contributions: XY design the experiment, collect data, prepared the manuscript, and made data analysis. XY corrected the whole language of the manuscript and made final approval. KY gave technique supports and valuable suggestions in experiment designing. All authors contributed to the article and approved the submitted version.
Availability of Data and Materials: The initial data of the dissertation mainly comes from the Project Research (No. 2020BGL032). Some data have confidentiality agreements. Except for the data mentioned in the dissertation can be disclosed, other data cannot be disclosed due to confidentiality issues.
Conflicts of Interest: The authors declare that they have no conflict of interest to report regarding the present study.
References
1. Wang, J., Feng, L., Palmer, P. I., Liu, Y., Fang, S. B. et al. (2020). Large Chinese land carbon sink estimated from atmospheric carbon dioxide data. Nature, 586(7831), 720–723. [Google Scholar] [PubMed]
2. Li, X., Yang, X., Wang, Y. (2016). Does international trade improve the carbon productivity in China’s manufacturing? Journal of Environmental Economics, 1(2), 8–24. [Google Scholar]
3. Mojtaba, K., Alireza, A., Mehdi, N. (2021). How does carbon tax affect social welfare and emission reduction in Finland? Energy Reports, 6, 736–744. [Google Scholar]
4. Zhou, S., Wang, J., Liang, Y. (2021). Development of China’s natural gas industry during the 14th Five-Year Plan in the background of carbon neutrality. Natural Gas Industry, 41(2), 171–182. [Google Scholar]
5. Wu, H., Wang, D., Liu, X. (2015). Strategies evaluation and optimal allocation of combined cooling heating and power system with solar. Automation of Electric Power Systems, 39(21), 46–51. [Google Scholar]
6. Hao, F., Zhang, C., Sun, B., Wei, D. (2015). Three-stage collaborative global optimization design method of combined cooling heating and power. Proceedings of the CSEE, 35(15), 3785–3793. [Google Scholar]
7. Ming, D., He, F., Wei, H. (2012). Energy supply network design optimization for distributed energy systems. Computers & Industrial Engineering, 63(3), 546–552. [Google Scholar]
8. Zhang, J., Cheng, H., Yao, L., Wang, C. (2009). Study on siting and sizing of distributed wind generation. Proceedings of the CSEE, 29(16), 1–7. [Google Scholar]
9. Liu, Y., Wu, W., Zhang, B., Li, Z. (2014). A mixed integer second-order cone programming based active and reactive power coordinated multi-period optimization for active distribution network. Proceedings of the CSEE, 34(16), 2575–2583. [Google Scholar]
10. Chen, P. Y., Pierluigi, S., Birgitte, B., Zhe, C. (2010). Stochastic optimization of wind turbine power factor using stochastic model of wind power. IEEE Transactions on Sustainable Energy, 1(1), 19–29. [Google Scholar]
11. Wang, S., Li, X., Xiao, Z., Wang, C. (2007). Rule based verification and correction methods for exported data from distribution GIS. Automation of Electric Power Systems, 31(10), 61–65+81. [Google Scholar]
12. Chen, Z., Jin, T., Zheng, X., Zhuang, Z. (2022). Short-term power load forecasting based on a new date mapping method and an ISGU hybrid model. Power System Protection and Control, 50(15), 72–80. [Google Scholar]
13. Xu, Y., Zhou, S., Lu, X. (2022). Short-term load forecasting based on feature selection and combination model. Electric Power, 55(7), 121–127. [Google Scholar]
14. Ling, W., Zhang, P., Li, Q., Mo, D., Luo, C. et al. (2021). Adaboost-based power system load forecasting. Journal of Physics: Conference Series, 2005, 23–25, 012190. [Google Scholar]
15. Mayur, B., Nalin, B. (2020). A similarity based hybrid GWO-SVM method of power system load forecasting for regional special event days in anomalous load situations in Assam, India. Sustainable Cities and Society, 61, 1–18. [Google Scholar]
16. Su, Y., Zhang, Z., Lin, Q., Hou, J., Wu, Y. (2020). Research on short-term power load forecasting based on BP neural network algorithm. Electronic Design Engineering, 30(12), 167–170+175. [Google Scholar]
17. Yang, Y., Liu, D., Li, Q., Zheng, G. (2002). Short term load forecasting using a multilayer neural network with BP-GA mixed algorithms. Information and Control, 31(3), 284–288. [Google Scholar]
18. Xu, Y., Zhang, Z. (2021). Medium and long-term power load forecasting based on BP neural network improved by genetic simulated annealing algorithm. Electrical Engineering, 22(9), 70–76. [Google Scholar]
19. Zhang, H., Li, S., Shi, J., Liu, X., Wang, K. et al. (2021). Short-term load forecasting method based on serial GA-BP. Proceedings of the CSU-EPSA, 33(4), 97–101+107. [Google Scholar]
20. Qin, K. (2020). Strategy and method of power grid planning in industrial parks based on incremental power distribution market target. Power & Energy, 41(1), 65–68+79. [Google Scholar]
21. Luan, L., Ma, Z., Mo, W., Xu, Z., Zhou, K. et al. (2021). A premium user classification method considering the demand of both power company and electricity user. Journal of Electric Power Science and Technology, 36(6), 171–181. [Google Scholar]
22. Yao, L., Yuan, L., Xie, M., Xie, W., Ye, J. et al. (2021). Collaborative optimal dispatch of distribution system with multi-stakeholders. Power Demand Side Management, 23(5), 63–69. [Google Scholar]
23. Liang, H., Lin, J., Li, P. (2016). Research on voltage control of a ultracapacitor in a DC micro-grid system with two-terminal supply. Electric Power, 49(3), 123–127+159. [Google Scholar]
24. Liu, X., Xiao, J., Zhou, H., Xu, F. (2021). Multi time scale optimal control of distribution network considering distributed energy. Electrical Automation, 43(2), 87–90. [Google Scholar]
25. Cai, C., Xie, Z., Chen, H., Han, J., Fan, A. et al. (2021). Study on reliability assessment of distribution networks containing distributed power supplies. Journal of Physics: Conference Series, 2030(1), 1–20. [Google Scholar]
26. Gao, Y., Yan, H., Zeng, F. (2022). Research on optimal dispatching method of distribution network considering distributed generation access. Electrotechnical Application, 41(1), 91–98. [Google Scholar]
Cite This Article
 Copyright © 2023 The Author(s). Published by Tech Science Press.
This work is licensed under a Creative Commons Attribution 4.0 International License , which permits unrestricted use, distribution, and reproduction in any medium, provided the original work is properly cited.
 Downloads
 Citation Tools