
 Submit a Paper
 Propose a Special lssue
 Open Access
ARTICLE

Emergency Energy Management of Microgrid in Industrial Park Based on Robust Optimization
Department of Electrical Engineering, Hebei Vocational University of Technology and Engineering, Xingtai, 054000, China
* Corresponding Author: Haoliang Yang. Email:
Energy Engineering 2023, 120(12), 2917-2931. https://doi.org/10.32604/ee.2023.029167
Received 05 February 2023; Accepted 25 May 2023; Issue published 29 November 2023
 View Full Text
 Download PDF
Abstract
Reducing the impact of power outages and maintaining the power supply duration must be considered in implementing emergency energy dispatching in micro-networks. This paper studies a new emergency energy treatment method based on the robust optimal method and the industrial park micro-network with the optical energy storage system. After controlling the load input, a control strategy of adjusting and removing is proposed. Rolling optimal theory is applied to emergency energy scheduling based on a robust optimal mathematical model. A weighting factor is introduced into the optimal model to balance the importance of reducing and retaining the power supply. Uncertainty is designed to adjust the effect of uncertainty on the problem. The example shows that this method can flexibly set the weight coefficient and uncertainty value according to the actual situation so that the input of the control load can be optimized.Keywords
New energy vehicles have developed rapidly due to their safety, convenience, high efficiency, and environmental protection. Although there are essential differences between modern and traditional vehicles in power, the fundamental nature of new vehicles is still derived from the upgrading and transformation of conventional cars. The high-speed rotation of the motor and air-conditioning condensers are still the two significant cooling needs of new energy vehicles. In addition, the cooling part of the battery is also increased, so the new energy vehicle contains four discrete, independent cooling systems: power supply, motor, electric control, and air conditioning. The four parts are separate and do not interfere with each other. This content brings many consumables, occupies space, causes energy consumption, and causes other problems. Limited by the current technology, the battery life, driving capacity, and vehicle performance of new energy vehicles must be improved by various means. Theoretically, the four cooling systems also have the optimization potential of saving material, energy, and space. Vehicle coordination, system integration, and humanized experience will be the future development direction of new energy vehicles.
Distributed generation (DG) is a way to maximize the use of renewable energy sources. DG is a primary significant measure to save energy and reduce energy consumption in the country, as well as an efficient combined energy system. Due to external conditions, photovoltaic (PV), wind power and so on have specific intermittent and random characteristics. DG varies greatly, and its oscillation is irregular. DG brings difficulties to energy management and optimal dispatching of the micro energy grid. Considering the influence of uncertainty, it can be divided into two types: one is to use backup resource regulation to smooth the power output to meet the load demand, but its economic benefits are not ideal. The second is the analysis using stochastic optimization techniques and probabilistic statistics. Robust optimization theory is a relatively perfect theory for solving fuzzy optimization problems developed in random optimization and fuzzy optimization in the past 40 years. Robust optimality is the constraint condition that can be satisfied by constructing an uncertain set of definite intervals when all possible uncertain variables are given in a given set.
Reference [1] firstly established a naturally determined and systematic control of multiple decision variables as a robust optimal game for game players. Reference [2] introduced a robust optimal planning algorithm considering wind speed uncertainty. It uses the vital duality principle of linear optimization to transform the optimal robustness problem into hybrid linear programming. Reference [3] proposed a robust voltage control method for power systems, considering the power systems’ uncertainty of capacity and loads. This method can keep PV and load stability in the case of varying concentrations. Reference [4] introduced a robust energy control method. The scenario is generated by interval fuzzy modeling, which changes the initial robust optimal problem into quadratic conic programming. Reference [5] used a two-stage robust optimal strategy to solve the uncertainty problem for grid-connected microgrids containing generators, renewable energy and energy storage systems (ESS). ESS will reduce the average operating cost. Some unit combination and economic scheduling results have been obtained with robust optimal methods. However, the current research results rarely apply the robust algorithm to the emergency energy treatment of micro-networks. Under conventional conditions, a commercial building microgrid (CBMG) is a new and sustainable power system in the industrial park. ESS island is used for emergency treatment in case of a power grid accident. However, there are still some uncertain factors in PV power generation capacity after CBMG transitions to the island. Reasonable control of unstable energy is of great significance to ensure the safe and stable operation of the power grid.
This paper presents a robust optimal strategy for emergency energy dispatching (RO-EEM) after a power outage. This method can reduce the disturbance of power interruption to users and extend the power supply duration. A weight factor is introduced in RO-EEM to balance the importance of the two subitems. In this paper, uncertainty is introduced to improve the effect of uncertainty on the problem [6]. The control strategy of “adjusting first and then cutting off” is proposed to control the input of each period of the control load. Electric vehicles (EVs) use a two-stage adjustment during the adjustment period. Air conditioning uses cycle adjustment.
CBMG consists of PV, ESS, EV, Alternating Current (AC)/DC, load, microgrid central controller (MGCC), etc. The lower machine controller consists of a micro-source controller, a load controller (LC) and an EV controller (Fig. 1).
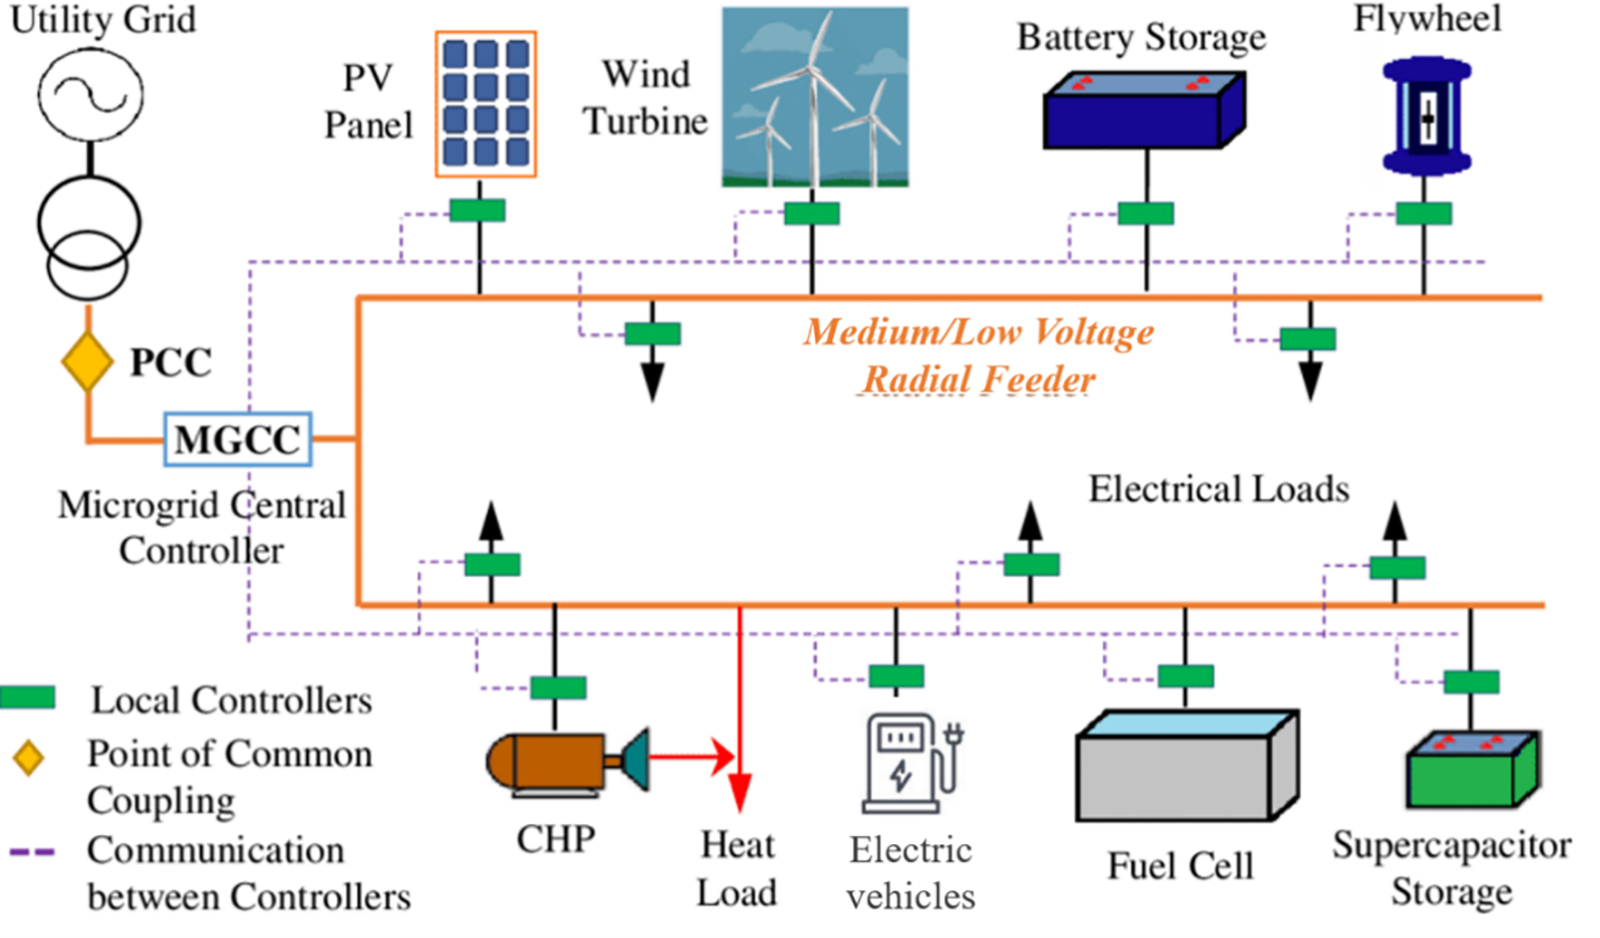
Figure 1: Schematic diagram of a micro-network system in optical energy storage Industrial Park
MGCC mainly monitors and coordinates the running status of each system. It can integrate everything. The lower-level controller periodically sends data such as power consumption and generation to the MGCC. MGCC will filter and process this to control CBMG effectively. AC/DC, a bidirectional conversion circuit, can complete the DC and AC two kinds of power conversion [7]. Loads are divided into control and focus categories according to their importance and ability to be adjusted. Control loads include air conditioning, EV, auxiliary lighting, etc. It has low importance and good adjustability. The micro-energy grid must obey the unified control of MGCC during operation, but the size of its adjustment significantly impacts the system use effect. The main load has the necessary lighting equipment, computer control module, etc. Its importance is higher, and its adjustability is lower. In operating a micro energy grid, the stable power supply should be kept as far as possible. If MGCC still cannot meet the requirements of the main load after adjustment, it will significantly affect the safe and stable operation of the whole power grid [8].
The CBMG will go to an island state after a power outage in the distribution network. Given the V/F control situation, no matter how the input and output power of the battery energy storage system changes, the voltage and frequency output by the inverter are given values. The difference between the measured frequency f and the reference frequency determines frequency control. Then the phase angle of the inverter is controlled by the proportional-integral regulator output. The output voltage and frequency are controlled at a given value according to the amplitude and frequency of the measured grid voltage. This keeps the grid voltage and frequency stable. Therefore, the CBMG is the primary control device in the V/F mode in the island state.
CBMG needs to consider customer satisfaction and time of use in emergencies. And the two are in conflict. The weighting factor is incorporated into the optimal index to measure its importance. Its purpose function is as follows:
3.1.1 Constraints on Power Balance
The discharge power of ESS must meet Eq. (5). The purpose is to maintain the power balance of the System after CBMG switches to island operation.
3.1.2 Constraints on Controllable Load
The controllable load should be adjusted within a specific range. It can be expressed as
The SOC of ESS should be strictly controlled within a specific range. The goal is to prevent damage to ESS from overcharging and over-discharging. It can be expressed as
PV predictions are often based on data collected over a short period. It has certain randomness and volatility [10]. The above optimization model is written in matrix form. Matrix C, matrix
s.t.
Eqs. (12) and (13) in the constraint condition can be combined
The constant term in the objective function does not affect the optimal solution. Therefore, the above optimization model can be simplified as follows:
When the distribution network is out, CBMG switches to island operation. If the initial SOC of ESS is small and the load is large, the PV output is higher [11]. This is more conducive to the access of controllable load and the maintenance of ESS reserve power. The worst case is the lowest PV output. PV output at a time
s.t.
RO-EEM is a rolling optimization method based on RO-EEM. Rolling optimization is an effective method in real-time problems. The forecast of PV is constantly revised to make it more consistent with the current trend. Fig. 2 shows the schematic diagram of the RO-EEM strategy [12]. The process goes like this:
Figure 2: Schematic diagram of the RO-EEM policy
(1) Obtain SOC at the initial time
(2) Weight factor
(3) The optimization result of the RO-EEM model is based on the PV predicted value. The decision must adjust according to the actual PV output [13]. If the difference between the actual PV output and the predicted PV value is within the allowable adjustment range of ESS, it is balanced by ESS. Otherwise, it is balanced by a controllable load. If the controllable load is not balanced when wholly removed, cutting off part of the critical load is necessary.
(4) Update the real-time data and predicted value of PV and carry out the following rolling optimization.
5 Specific Adjustment of Controllable Load
The relationship between SOC and charging current in the EV charging process can be expressed as Eq. (25).
The EV types and adjustment processes during MGCC are shown in Fig. 3. When CBMG Island operation requires EV adjustment. The flexible adjustment should be made first. Reduce its charging magnification to a minimum one by one. When the elastic adjustment period is complete, stiffness adjustment will occur if the system cannot meet the requirements. If the entire EV is cut off, the forced reduction should be used instead of truncation [15]. When EV’s SOC and charge-discharge ratio are known, the flexibility-adjusted phase and stiffness-adjusted phase amplitude can be calculated by Eqs. (28) and (29).
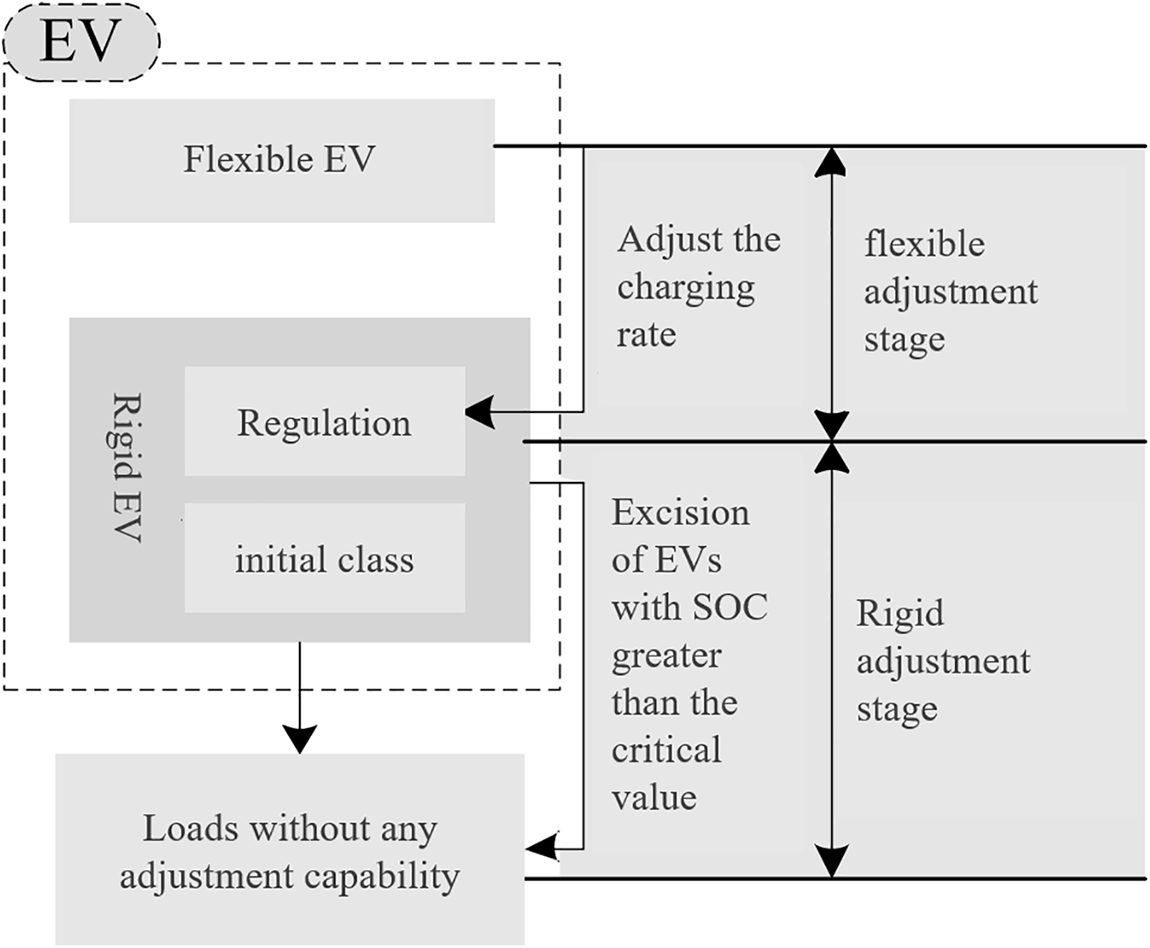
Figure 3: Types and adjustment process of electric vehicles
5.2 Air Conditioner Adjustment Scheme
The key to simulating the energy consumption of air conditioning is accurately simulating the heat exchange process. The equivalent thermal parameter model of air conditioning is shown in Fig. 4.
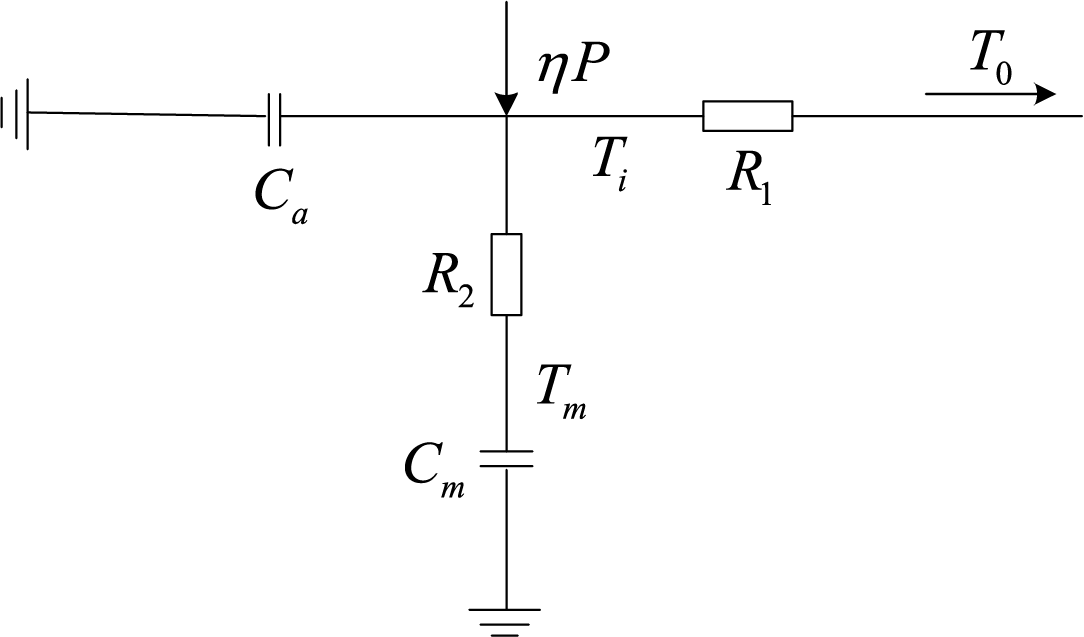
Figure 4: Equivalent thermal parameter model of air conditioning
The equivalent thermal parameter model is in Fig. 4. P is the cooling/heating power of the air-conditioning unit. η is the energy efficiency ratio. ηP is the cooling/heat production of air conditioning. Ca is the specific heat capacity of a gas. Cm is the specific heat capacity of a solid. To is the outside temperature. Ti is the indoor temperature. Tm is the stable indoor temperature. By simplifying the above model, we can get the calculation formula of indoor temperature Ti in steady and off states. They are shown in Eqs. (30) and (31), respectively:
The load response constraints under the kth anticipated accident are
In the formula, the superscript k is the expected accident number. The power balance constraint under the kth anticipated accident is
The line power equation constraint under the kth anticipated accident is
Under the kth expected accident, the upper and lower limits of line power are constrained as
Under the kth predicted accident, the upper and lower limits of power generation are constrained as
5.3 Controllable Load Adjustment Scheme
Through the implementation of RO-EEM, the reduction of the controllable load after each outage can be calculated compared to the initial time. The MGCC will issue tailoring orders. The basic idea of load control is to adjust before cutting [16]. As a load with a specific adjustment allowance, the CBMG air conditioning system has a better adjustment ability in the air conditioning system. Together, they will undertake the reduction of MGCCS. When the load reduction exceeds the total adjustment range of the EV and air conditioner, the load that does not have the adjustment capacity must be cut off. Non-adjustable capacity loads include secondary lighting, ultra-low SOC, and EVs with the lowest charge ratio.
6.1 PV Prediction and Amplitude Measurement
Suppose the power goes off at 16:00. Expect a 30-min power outage. Set the interval between two adjacent scrolling optimums to 2 min. The grey algorithm makes the prediction. Many probability distributions can be approximated by using the normal distribution. Under normal conditions, the data obtained by a simple random sampling conform to the normal distribution. This property can be obtained by deducing the central limit theorem [17]. The deviation distribution of the short-term solar power forecast is close to the normal distribution because the random sampling method is adopted to sample the error of the short-term solar power forecast.
On the time axis, the mean deviation
Set the total installed capacity of PV to 100 kW. ESS is rated at 50 kWh. The maximum output of the maximum charge and discharge is 30 kW. The SOC value of ESS is 0.44 when the power is off. The highest SOC value is 0.75. The minimum is 0.11. The shortest two shortest optimal intervals A are 1 min. The main load is between 20 and 40 kilowatts, generated randomly. The maximum power of the control load is 200–500 kW. The initial setting of the control load is 200 kW.
Comparative analysis is used in this paper. The objective is to verify the effectiveness of the RO-EEM strategy better.
6.3.1 Traditional Control Policies
CBMG systems that convert to islands after a power failure in the distribution system are complicated by their voltage/frequency changes [18]. Its charging and output can be adjusted according to load and PV changes. The control load is then progressively loaded up to the maximum output of the ESS. The input rate of the control load varies with the main load and the PV output power. At this time the result of the example is shown in Fig. 5.
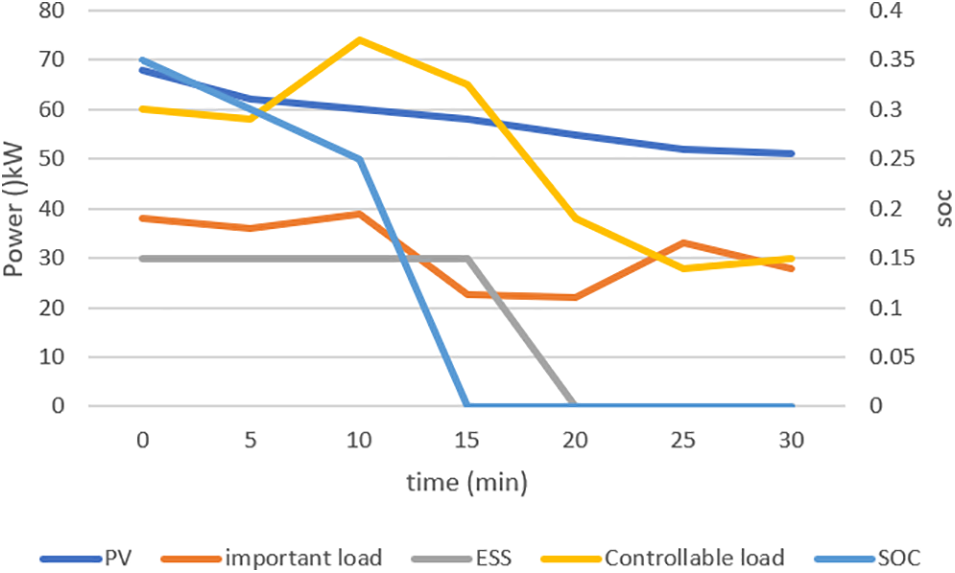
Figure 5: Schematic diagram of traditional strategy example results
As shown in Fig. 5, the ESS will not be recharged after 15 min of power failure. Photovoltaic power generation is the only power system. This will increase the risk of later stabilization operations [19]. If there is a power outage at night, the PV output will significantly reduce. It is effortless and straightforward for the ESS to stop discharging when the control load is 0 and still cannot guarantee the need for the critical load. This will significantly adversely impact the safe and smooth operation of CBMG.
Set the weighting factor a to 0.9. b is 0.1. The population uncertainty
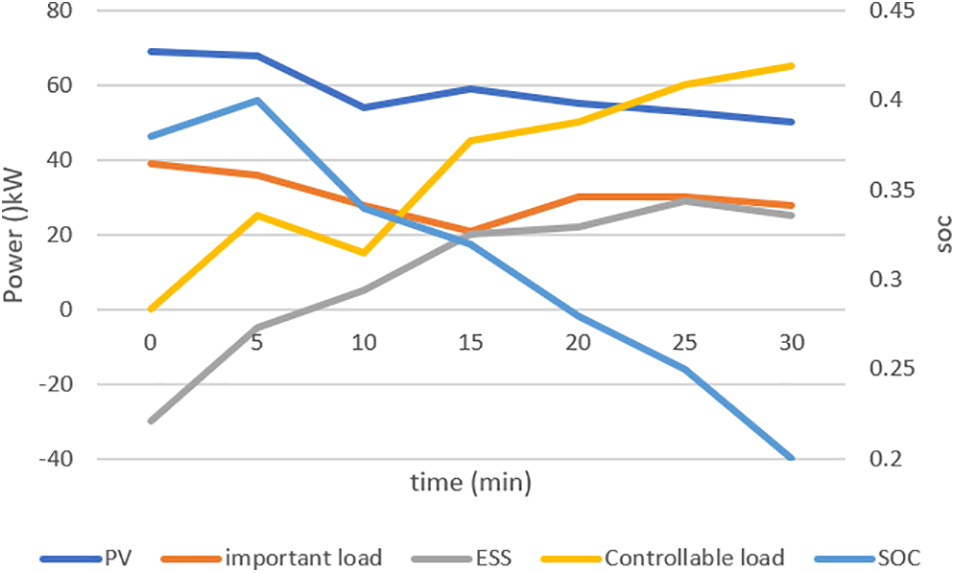
Figure 6: Schematic diagram of RO-EEM policy example results
Comparative analysis of numerical examples shows that the RO-EEM strategy can effectively adjust the input of controllable load to achieve the expected goal.
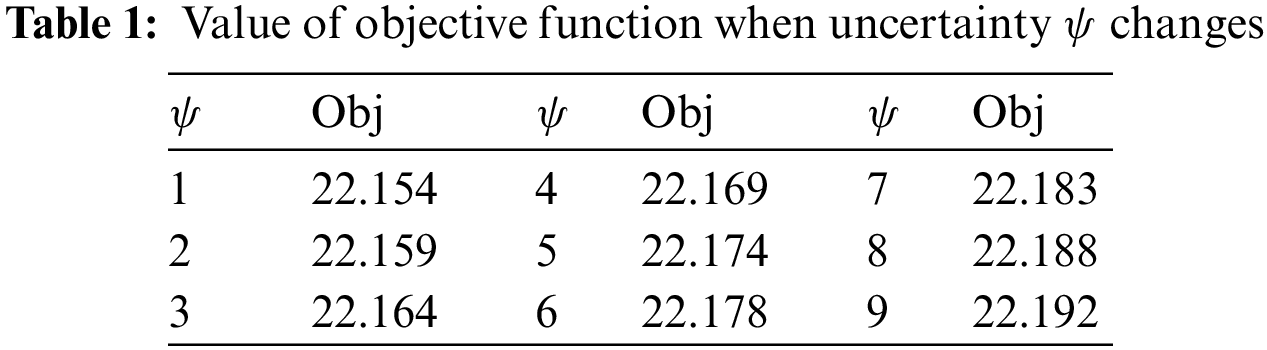
6.4 Analysis of Uncertainty Factors
In the RO-EEM model,
6.5 Controllable Load Adjustment Results and Analysis
Set the number of electric vehicles in CBMG at 20. The default target SOC is 0.95. The SOC threshold is 0.3. Power battery parameters are shown in Table 2. EV’s initial SOC is randomly generated between 0.1 and 0.6. The initial charge ratio randomly generates between 0.1 and 0.5 C (Fig. 7). The minimum EV charging ratio is set at 0.1 C in the adjustment stage.
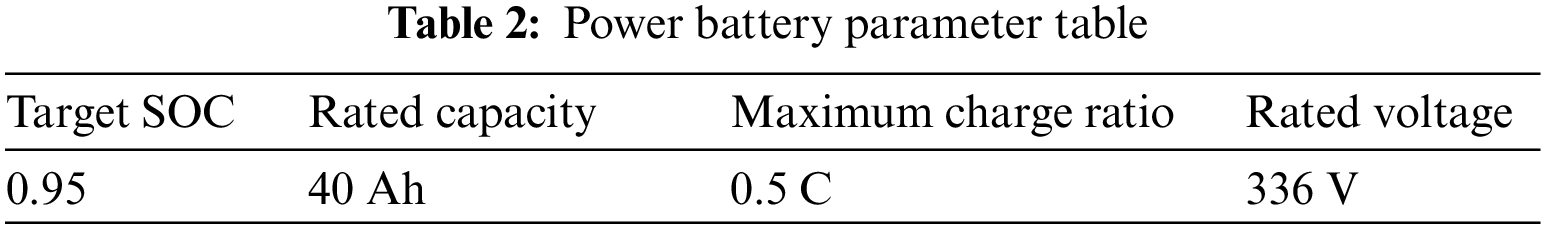
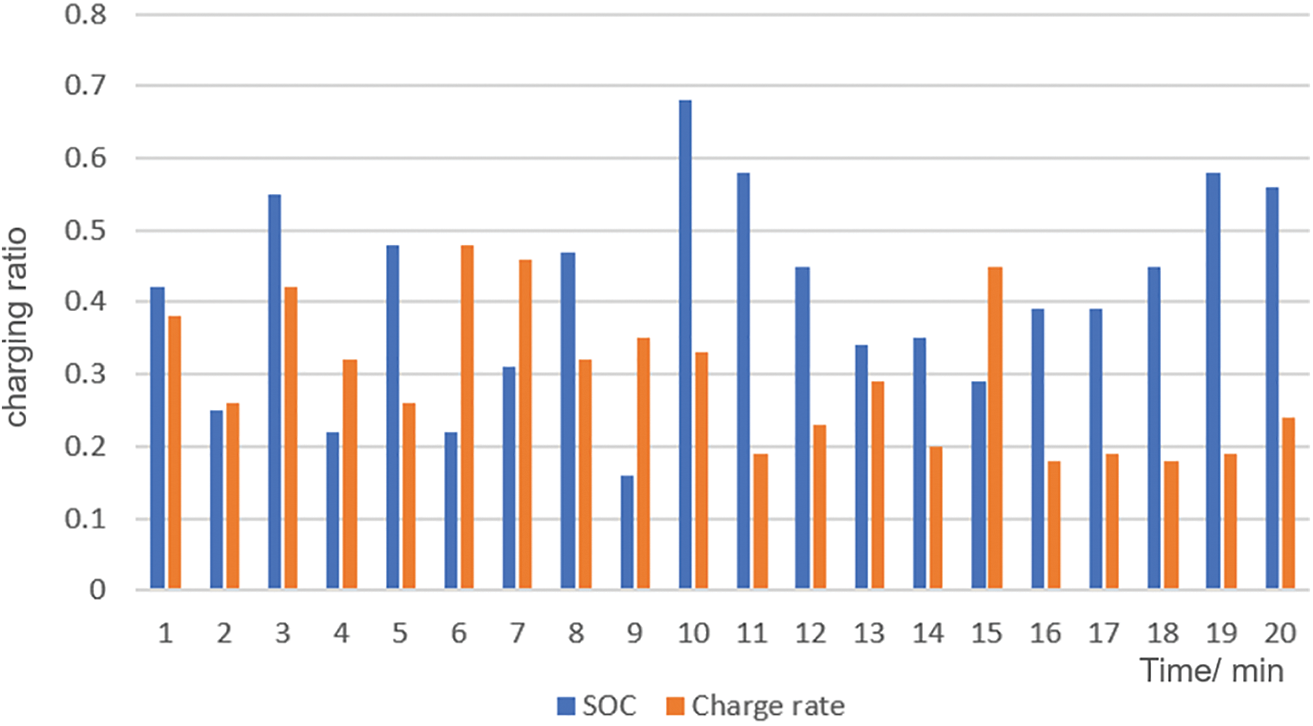
Figure 7: Initial SOC and the charging ratio of EV
Install CBMG 40 air conditioners. Its average generating capacity is 2 kilowatts. The total power at the time of the blackout was 100 kilowatts. In summer, the energy-saving effect of air conditioners reaches 3. The equivalent heat capacity is 0.18 kW/°C. When the temperature is 5.56°C/kW, the outdoor temperature does not change at 32°C. Both indoor and outdoor temperatures increase as the temperature rises [22]. The start-up setting temperature of 40 air conditioners can be arbitrarily generated at 22°C to 28°C (Fig. 8). After the power is turned off, the indoor temperature is set the same as that of the air conditioner.
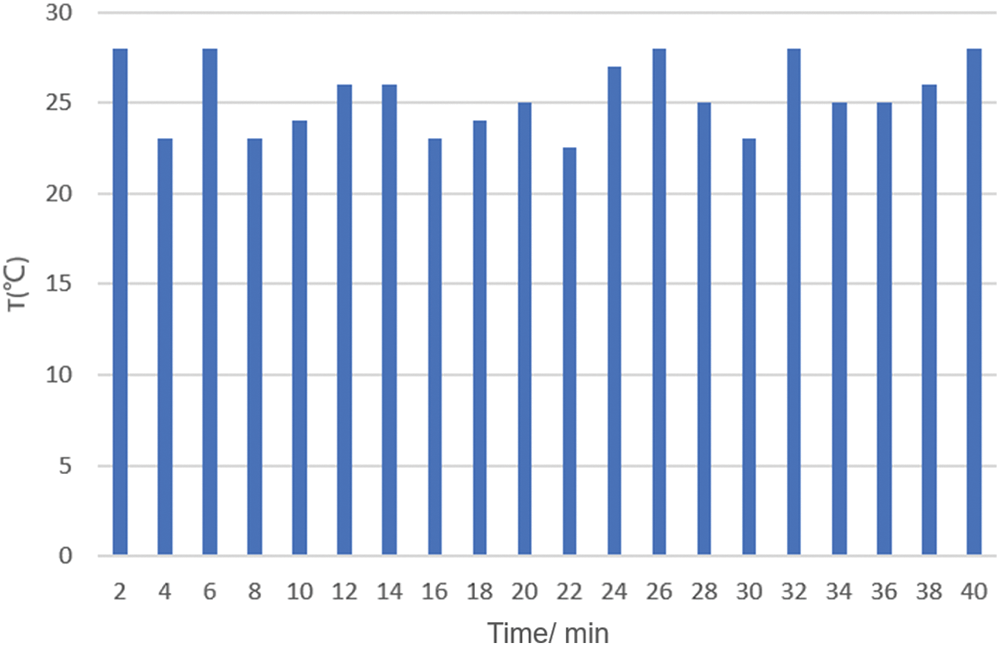
Figure 8: Randomly generated initial air conditioner temperature
When a is 0.9, b is 0.1 and
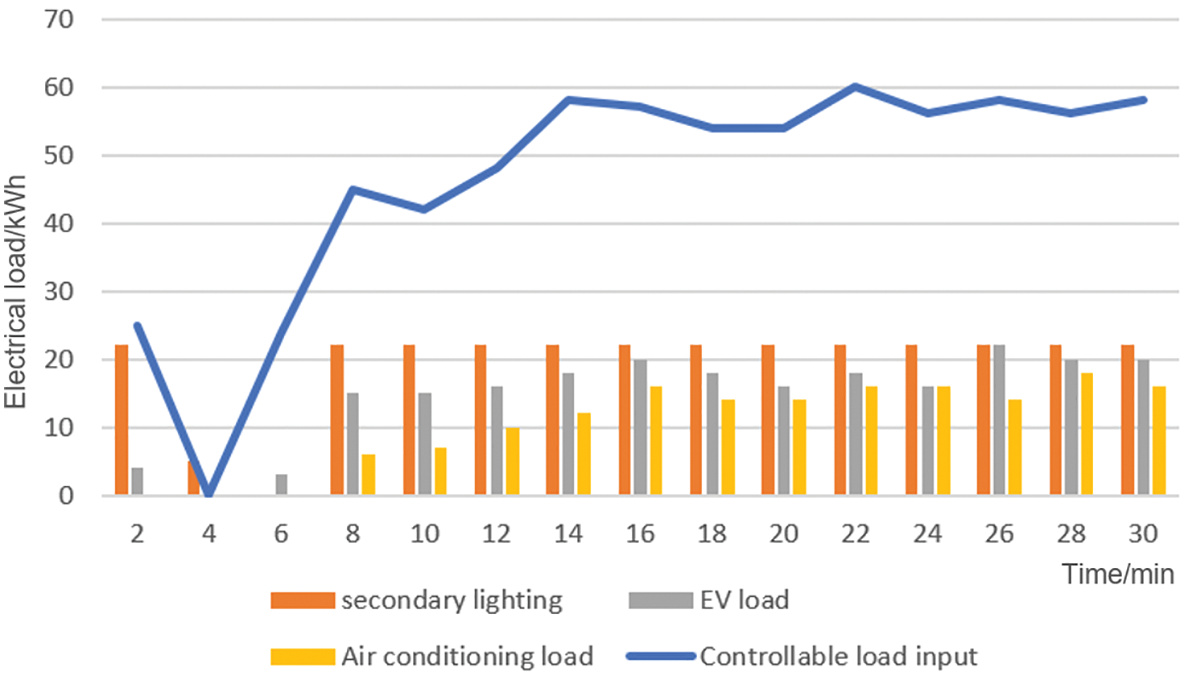
Figure 9: Input results of various controllable loads
At the initial stage of a power outage, the total input of controllable loads is small, and the air-conditioning loads and some EVs with adjustment capabilities are cut off. After that, the loadable input showed an increasing trend. The investment in air conditioners and EVs will increase accordingly. At the initial moment of power failure, the power consumption of the air conditioner is large, but because the EV contains some loads that cannot regulate. Its status is similar to that of secondary lighting facilities. It operates last when the load is reduced, so the total input amount of the EV is more than that of the air conditioner. The secondary lighting facilities have the most input due to the lack of adjustment ability and the last action. The air conditioner is adjusted by rotation. At the initial moment of a power outage, set the odd group as the adjustable group and the even group as the removable group, and rotate every 5 min. It can be seen from Fig. 9 that the input amount of the air conditioner is 0 before the 7th min. Therefore, the temperatures of the air conditioners in the odd group and the air conditioners in the even group have risen to some extent. From the 7th min, the input of the air conditioner shows an upward trend. At this time, the odd group can be removed, and the even group can be adjusted. Therefore, between the 7th and 10th min, the temperature of the odd group of air conditioners still maintains an upward trend. In contrast, the temperature of the even group of air conditioners decreases. In the 10th, 15th, 20th and 25th min, there will be a rotation of the working mode of the odd-even group.
However, EVs adopt a two-stage adjustment when performing load reduction tasks, first reducing the charging rate and then cutting off EVs whose SOC is greater than the critical value. The EV’s charging rate and SOC changes are shown in Fig. 10 during the power failure process.
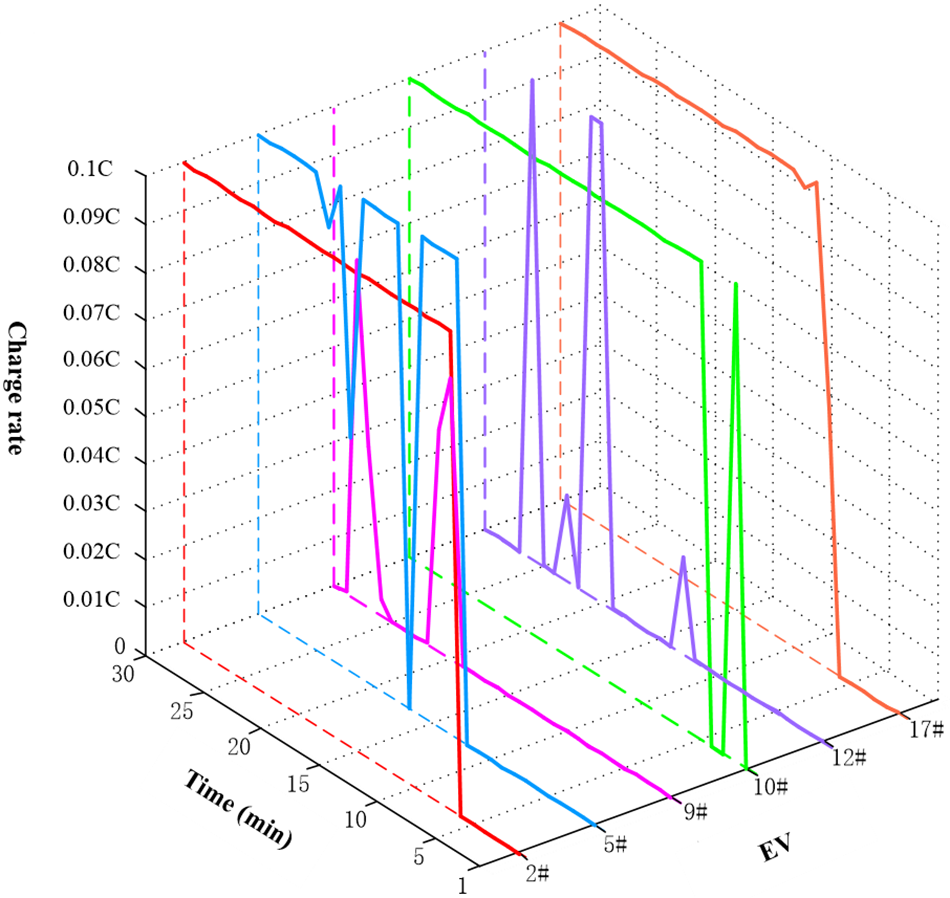
Figure 10: The EV’s charging rate and SOC changes
In this paper, a robust optimization-based emergency energy management strategy is proposed. This paper adds the uncertainty factor (PV) to the optimization model. This can make the optimization result more conducive to the safe and reliable operation of the CBMG. The RO-EEM strategy introduces the idea of rolling optimization to make the predicted value of PV more in line with the actual trend. The RO-EEM strategy can effectively adjust the controllable load input. Setting different weight factors can flexibly change the importance of user satisfaction and power supply time. Each EV’s real-time charging rate and air conditioning control strategy can be obtained from the controllable load adjustment scheme.
Acknowledgement: None.
Funding Statement: The authors received no specific funding for this study.
Author Contributions: The authors acknowledge the contributions to this article as follows: Study conception and design: Haoliang Yang; Data collection: Yonggang Dong; Results analysis and interpretation: Zhifang Yang; Manuscript preparation: Haoliang Yang. All authors reviewed the results and approved the final version of the manuscript.
Availability of Data and Materials: The data that support the findings of this study are available on request from the corresponding author. The data are not publicly available due to privacy or ethical restrictions.
Conflicts of Interest: The authors declare that they have no conflicts of interest to report regarding the present study.
References
1. Zhou, W., Li, Q., Wu, K., Zhang, L., Hassan, M. A. S. et al. (2022). Accelerated hierarchical optimization method for emergency energy management of microgrids with energy storage systems. Energy Science & Engineering, 10(3), 962–972. [Google Scholar]
2. Hashemifar, S. M. A., Joorabian, M., Javadi, M. S. (2022). Two-layer robust optimization framework for resilience enhancement of microgrids considering hydrogen and electrical energy storage systems. International Journal of Hydrogen Energy, 47(79), 33597–33618. [Google Scholar]
3. Wang, L., Jiang, C., Gong, K., Si, R., Shao, H. et al. (2020). Data-driven distributionally robust economic dispatch for distribution network with multiple microgrids. IET Generation, Transmission & Distribution, 14(24), 5712–5719. [Google Scholar]
4. Zhu, N., Hu, P., Liu, S., Jiang, D., Liang, Y. et al. (2022). Emergency reserve constrained optimal allocation of energy storage in a novel honeycomb-like microgrid cluster with volatile renewable energy resources. IET Generation, Transmission & Distribution, 16(2), 305–318. [Google Scholar]
5. Mallikarjunaswamy, S., Sharmila, N., Maheshkumar, D., Komala, M., Mahendra, H. N. (2020). Implementation of an effective hybrid model for islanded microgrid energy management. Indian Journal of Science and Technology, 13(27), 2733–2746. [Google Scholar]
6. Zhou, B., Zou, J., Chung, C. Y., Wang, H., Liu, N. et al. (2021). Multi-microgrid energy management systems: Architecture, communication, and scheduling strategies. Journal of Modern Power Systems and Clean Energy, 9(3), 463–476. [Google Scholar]
7. Stasinos, E. I. E., Trakas, D. N., Hatziargyriou, N. D. (2022). Microgrids for power system resilience enhancement. iEnergy, 1(2), 158–169. [Google Scholar]
8. Cai, S., Xie, Y., Wu, Q., Zhang, M., Jin, X. et al. (2021). Distributionally robust microgrid formation approach for service restoration under random contingency. IEEE Transactions on Smart Grid, 12(6), 4926–4937. [Google Scholar]
9. Masrur, H., Gamil, M. M., Islam, M. R., Muttaqi, K. M., Lipu, M. H. et al. (2022). An optimized and outage-resilient energy management framework for multicarrier energy microgrids integrating demand response. IEEE Transactions on Industry Applications, 58(3), 4171–4180. [Google Scholar]
10. Chen, B., Wang, J., Lu, X., Chen, C., Zhao, S. (2020). Networked microgrids for grid resilience, robustness, and efficiency: A review. IEEE Transactions on Smart Grid, 12(1), 18–32. [Google Scholar]
11. Islam, M., Yang, F., Amin, M. (2021). Control and optimisation of networked microgrids: A review. IET Renewable Power Generation, 15(6), 1133–1148. [Google Scholar]
12. Hemmati, M., Mohammadi-Ivatloo, B., Abapour, M., Anvari-Moghaddam, A. (2020). Optimal chance-constrained scheduling of reconfigurable microgrids considering islanding operation constraints. IEEE Systems Journal, 14(4), 5340–5349. [Google Scholar]
13. Cai, S., Zhang, M., Xie, Y., Wu, Q., Jin, X. et al. (2022). Hybrid stochastic-robust service restoration for wind power penetrated distribution systems considering subsequent random contingencies. IEEE Transactions on Smart Grid, 13(4), 2859–2872. [Google Scholar]
14. Vahedipour-Dahraie, M., Rashidizadeh-Kermani, H., Anvari-Moghaddam, A. (2020). Risk-based stochastic scheduling of resilient microgrids considering demand response programs. IEEE Systems Journal, 15(1), 971–980. [Google Scholar]
15. Liu, G., Jiang, T., Ollis, T. B., Li, X., Li, F. et al. (2020). Resilient distribution system leveraging distributed generation and microgrids: A review. IET Energy Systems Integration, 2(4), 289–304. [Google Scholar]
16. Daneshvar, M., Mohammadi-Ivatloo, B., Abapour, M., Asadi, S., Khanjani, R. (2020). Distributionally robust chance-constrained transactive energy framework for coupled electrical and gas microgrids. IEEE Transactions on Industrial Electronics, 68(1), 347–357. [Google Scholar]
17. Qiu, H., Gu, W., Xu, Y., Yu, W., Pan, G. et al. (2020). Tri-level mixed-integer optimization for two-stage microgrid dispatch with multi-uncertainties. IEEE Transactions on Power Systems, 35(5), 3636–3647. [Google Scholar]
18. Yang, P., Yu, L., Wang, X., Zheng, P., Lv, X. et al. (2022). Multi-objective planning and optimization of microgrid lithium iron phosphate battery energy storage system consider power supply status and CCER transactions. International Journal of Hydrogen Energy, 47(69), 29925–29944. [Google Scholar]
19. Vahedipour-Dahraie, M., Rashidizadeh-Kermani, H., Anvari-Moghaddam, A., Siano, P. (2020). Flexible stochastic scheduling of microgrids with islanding operations complemented by optimal offering strategies. CSEE Journal of Power and Energy Systems, 6(4), 867–877. [Google Scholar]
20. Rangu, S. K., Lolla, P. R., Dhenuvakonda, K. R., Singh, A. R. (2020). Recent trends in power management strategies for optimal operation of distributed energy resources in microgrids: A comprehensive review. International Journal of Energy Research, 44(13), 9889–9911. [Google Scholar]
21. Madiba, T., Bansal, R. C., Mbungu, N. T., Bettayeb, M., Naidoo, R. M. et al. (2022). Under-frequency load shedding of microgrid systems: A review. International Journal of Modelling and Simulation, 42(4), 653–679. [Google Scholar]
22. Wang, W., He, Y., Xiong, X., Chen, H. (2021). Robust survivability-oriented scheduling of separable mobile energy storage and demand response for isolated distribution systems. IEEE Transactions on Power Delivery, 37(5), 3521–3535. [Google Scholar]
23. Gazijahani, F. S., Salehi, J., Shafie-Khah, M., Catalão, J. P. (2020). Spatiotemporal splitting of distribution networks into self-healing resilient microgrids using an adjustable interval optimization. IEEE Transactions on Industrial Informatics, 17(8), 5218–5229. [Google Scholar]
Cite This Article
 Copyright © 2023 The Author(s). Published by Tech Science Press.
This work is licensed under a Creative Commons Attribution 4.0 International License , which permits unrestricted use, distribution, and reproduction in any medium, provided the original work is properly cited.
 Downloads
 Citation Tools