
 Submit a Paper
 Propose a Special lssue
 Open Access
ARTICLE

Evaluating the Derivative Value of Smart Grid Investment under Dual Carbon Target: A Hybrid Multi-Criteria Decision-Making Analysis
1 Guangdong Power Grid Co., Ltd., Guangzhou, 510410, China
2 Electric Power Development Research Institute, China Electricity Council, Beijing, 100053, China
* Corresponding Author: Dongwei Li. Email:
Energy Engineering 2023, 120(12), 2879-2901. https://doi.org/10.32604/ee.2023.029426
Received 18 February 2023; Accepted 12 June 2023; Issue published 29 November 2023
 View Full Text
 Download PDF
Abstract
With the goal of “carbon peaking and carbon neutralization”, it is an inevitable trend for investing smart grid to promote the large-scale grid connection of renewable energy. Smart grid investment has a significant driving effect (derivative value), and evaluating this value can help to more accurately grasp the external effects of smart grid investment and support the realization of industrial linkage value with power grid investment as the core. Therefore, by analyzing the characterization of the derivative value of smart grid driven by investment, this paper constructs the evaluation index system of the derivative value of smart grid investment including 11 indicators. Then, the hybrid evaluation model of the derivative value of smart grid investment is developed based on anti-entropy weight (AEW), level based weight assessment (LBWA), and measurement alternatives and ranking according to the compromise solution (MARCOS) techniques. The results of case analysis show that for SG investment, the value of sustainable development can better reflect its derivative value, and when smart grid performs poorly in promoting renewable energy consumption, improving primary energy efficiency, and improving its own fault resistance, the driving force of its investment for future sustainable development will decline significantly, making the grid investment lack derivative value. In addition, smart grid investment needs to pay attention to the economy of investment, which is an important guarantee to ensure that the power grid has sufficient and stable sources of investment funds. Finally, compared with three comparison models, the proposed hybrid multi-criteria decision-making (MCDM) model can better improve the decision-making efficiency on the premise of ensuring robustness.Keywords
The continuous increase of global greenhouse gas emissions has promoted climate warming and seriously affected the sustainable development of mankind. Many countries have fully recognized the impact of carbon dioxide on the climate, and have formulated the goal of “carbon peaking and carbon neutralization” (dual carbon) and introduced relevant policies. The energy sector is a key area of carbon emissions, and promoting energy transformation is the key to achieving the dual carbon goal. Renewable energy power generation has the characteristics of clean and low-carbon. Expanding the scale of renewable energy power generation and accelerating the construction of green and low-carbon power systems are important ways to promote carbon emission reduction in the energy field. However, renewable energy power generation is uncertain, and its large-scale access to the power grid will significantly affect the safe and stable operation of the power grid. Therefore, it is necessary to strengthen the power grid construction to meet the development of renewable energy, which is also a key support for the achievement of dual carbon goal.
As an important development direction of power grid, smart grid (SG) is based on the integrated, high-speed two-way communication network. Through the application of advanced sensing and measurement technology, equipment technology, control methods and decision support system technology, SG can achieve the goals of reliability, safety, economy, efficiency, environmental friendliness and safe use of power grid. Its main features include self-healing, encouraging and protecting users, resisting attacks, providing power quality to meet users’ needs, allowing access to various forms of power generation, supporting the power market and optimizing the efficient operation of assets. With the large-scale renewable energy access to the power grid under the dual carbon goal, the importance of SG construction is increasingly urgent.
However, unlike traditional power grids, SG investment faces new challenges. On the one hand, SG investment needs to consider a variety of external factors, such as supporting high-quality economic development, promoting energy transformation, ensuring the security of power supply, and enhancing the competitiveness of the state-owned economy; At the same time, the supervision of SG investment has been continuously strengthened and the examination of transmission and distribution pricing costs has become stricter, making the pressure on SG operation assessment and investment capacity be increased [1,2]. On the other hand, with the increase of uncertain factors of SG investment, it is necessary to dynamically balance the relationship between investment demand and investment capacity, and the relationship between long-term development and short-term demand [3,4]. Therefore, it is necessary to further analyze the value of SG investment, excavate and quantitatively evaluate the derivative value of its investment in driving social development [5,6], to promote the linkage of energy related industries, enable the construction of SG-related industries, and support the construction of new power systems and the realization of dual carbon goal.
The existing research on the evaluation of power grid investment value mainly focuses on the direct value, such as increasing power grid transmission income, improving power system reliability, etc., so the evaluation indicators mainly include economic benefits and technical benefits. Reference [7] established an effective capital input-output evaluation system for the power grid, and constructs an index system from the perspectives of assets, costs, benefits, and efficiency. Reference [8] constructed an index system for the investment value evaluation of power grid planning projects in the current environment based on three levels: technology, efficiency, and project maturity. References [9–11] analyzed and evaluated the economy of power grid investment from the perspective of financial benefits, providing support for power grid investment decisions. References [12–14] comprehensively considered the economy of investment and the reliability of system operation and constructed the evaluation index system of power grid investment value. References [15–17] introduced social indicators based on economic indicators and technical indicators, such as promoting employment and taxation, supporting economic development, etc., and more comprehensively evaluated the value of power grid investment. References [18–20] introduced environmental benefits, such as pollutant emissions, and renewable energy consumption, into the evaluation index system of power grid investment value, further highlighting the comprehensive value of power grid investment.
In the evaluation method of power grid investment value, the multi-criteria decision-making (MCDM) method has been widely concerned. When determining the index weight, the weighting methods can be divided into subjective weighting methods, objective weighting methods, and combined weighting methods. The mainstream subjective weighting methods include analytic hierarchy process (AHP) [21], Delphi method [22], best-worst method (BWM) [23], and binomial coefficient method [24]. Mainstream objective weighting methods include entropy weight method [25], anti-entropy weight (AEW) method [26], and coefficient of variation method [27]. The subjective weighting method and objective weighting method have certain limitations [28–30]: the subjective weighting method can not make full use of the objective information of indicators, and the process of indicator weighting is greatly affected by the subjectivity of experts. The objective weighting method pays too much attention to the differences between the original information of the indicators, neglects the meaning of the indicators themselves, and has significant data dependence, resulting that the stability and interpretability of the weighting results being weak. Therefore, relevant scholars have proposed the combined weighting method [31,32], which can effectively integrate the advantages of the subjective weighting method and objective weighting method, overcome the limitations of a single weighting method, and ensure the reliability of index weighting results.
Based on determining the index system and weighting methods, the existing MCDM methods for the evaluation of power grid investment value mainly include two types: single scheme evaluation method and multi scheme ranking method. The commonly used single scheme evaluation methods include fuzzy comprehensive evaluation [33,34], matter-element extension [35], etc. This kind of method has low data requirements for the evaluation object, and the evaluation process is relatively simple, but the evaluation results have some subjectivity. Commonly used multi-scheme ranking methods include Technique for Order Preference by Similarity to an Ideal Solution (TOPSIS) [36,37], VIse Kriterijumski Optimizacioni Racun (VIKOR) [38], grey correlation analysis [39], etc. This kind of method has a high demand for data information on alternative schemes. The evaluation process is more objective, and the subjectivity of the results is low, but the calculation process is more complex.
In line with the above discussion, under the background of the “dual carbon” goal, the role of SG is more prominent, which is of great significance for the evaluation of its investment value. However, there are some gaps in the existing literature: firstly, it pays less attention to the intelligence level when carrying out the investment value evaluation of the power grid, and the embodiment of the characteristics of SG is not enough. Secondly, power grid investment has a significant driving effect (derivative value), and in addition to the traditional evaluation of comprehensive benefits from the economy, technology, society, and environment, it should also carry out targeted derivative value evaluation of SG investment. By this, it can more accurately grasp the external effects of SG investment and support the realization of industrial linkage value with power grid investment as the core.
Based on this, this paper focuses on the derivative value of SG investment under the “dual carbon” goal, and analyzes the value derivative mechanism of SG to economy and society driven by investment. Then, an evaluation index system for the derivative value of SG investment including three dimensions called power grid investment performance, operation and maintenance performance, and sustainable development performance is constructed, and a derivative value evaluation model for SG investment is developed. Finally, the effectiveness of the model is verified by the case study. Overall, the contributions of this paper mainly include:
(1) Different from previous studies, this paper focuses on the derivative value of SG investment and constructs a targeted evaluation index system. This paper analyzed the characterization of SG derivative value driven by investment, and constructs an evaluation index system of the derivative value of SG investment including 11 indicators from the three dimensions of power grid investment performance, operation and maintenance performance, and sustainable development performance, which can comprehensively and objectively reflect the potential value of SG investment to the economy, society, and environment, and also lays the foundation for the scientific evaluation of the derivative value of SG investment.
(2) A hybrid MCDM model for the derivative value evaluation model of SG investment is developed. Based on the constructed index system and MCDM theory, the SG investment derivative value evaluation model based on anti-entropy weight (AEW) and level based weight assessment combination weighting and measurement alternatives and ranking according to the compromise solution (MARCOS) is proposed. On the one hand, the proposed combined weighting method can make full use of the objective information carried by the index and consider the connotation of the index itself, ensuring the interpretability of the weight results and avoiding subjectivity. On the other hand, the proposed MARCOS method considers the comprehensive utility value between the alternative scheme and the positive and negative ideal solutions at the same time, which makes the evaluation result more credible. The model validity test also shows that the proposed hybrid MCDM model can better improve decision-making efficiency on the premise of ensuring robustness.
The rest of this paper is organized as follows: Section 2 analyzes the derivative value of SG investment and constructs the evaluation index system. Section 3 introduces the proposed hybrid MCDM model for evaluating the derivative value of SG investment. Section 4 carries on the example analysis and the model validity test. Section 5 is the main conclusion of this paper.
2 Evaluation Index System of SG Investment Derivative Value
2.1 Analysis of the Derivative Value of SG Investment
The derivative value of SG investment is a derivative system related to power grid investment, and specifically refers to the current and potential value derived from the original assets, which is reflected in the security, environmental protection, economy, and technological progressiveness of the power grid. According to the evolution of energy and power system in complex environments, the value derivative chain and mechanism of power grid investment in stimulating industrial development, promoting technological progress, and renewable consumption, thus supporting dual carbon targets are significant, which is the specific derivative value brought by SG investment. Generally speaking, the SG investment derivative value criteria should be applied to government regulators, power industry associations, and relevant business departments of power grid enterprises. For each application scenario, the following SG investment derivative value criteria should be followed:
1) Support the strategic layout of power grid enterprises and power grid construction. Under the dual carbon goal orientation, SG investment derivative value evaluation can guide the productivity layout, planning and construction of relevant business departments of power grid enterprises, optimize the power grid investment structure and mode to meet the infrastructure needs for the low-carbon transformation of electricity, and carry out the value evaluation of investment projects and apply them in power grid investment, to provide support for the sustainable and stable operation and development of enterprises.
2) Guide the optimization of productivity layout and structure in the energy industry. Through SG investment derivative value evaluation, it can promote the energy industry and power grid-related enterprises to focus on key technological fields, optimize investment and orderly development of energy industry and power grid related enterprises, and provide a demonstration of technical methods for investment planning and evaluation for energy industry enterprises. By this, it can promote the transfer of resource elements in the energy industry to areas with higher derivative value (such as renewable energy technology), thereby promoting green technology progress in the energy industry and power grid enterprises, providing support for achieving low-carbon development in the energy sector, and helping to achieve the dual carbon goal.
3) Serve the implementation of national strategies and policies. The evaluation of SG investment derivative value can provide decision-making reference for the implementation of major strategies such as dual carbon strategy, national energy security strategy and regional coordinated development strategy, and can provide technical and programmatic support for participating in national energy planning and construction, energy structure optimization, industrial coordinated development, etc.
2.2 Construction of SG Investment Derivative Value Evaluation Index System
The construction of indicators is the top priority in the field of evaluation. Its suitability not only determines the scope of application of the evaluation, but also affects the feasible value of the evaluation. In fact, the influencing factors of the derivative value of SG investment are complex. “Dual carbon” goal puts forward new requirements for energy transformation. In addition, it is necessary to ensure the calculability, subjectivity and objectivity of the evaluation indicators. Therefore, considering the connotation of SG investment derivative value under the dual carbon target, this paper draws on relevant literature [8,16,18] and measures the derivative value of SG investment from three aspects: power grid investment performance, operation and maintenance performance, and sustainable development performance. The index framework is shown in Fig. 1.
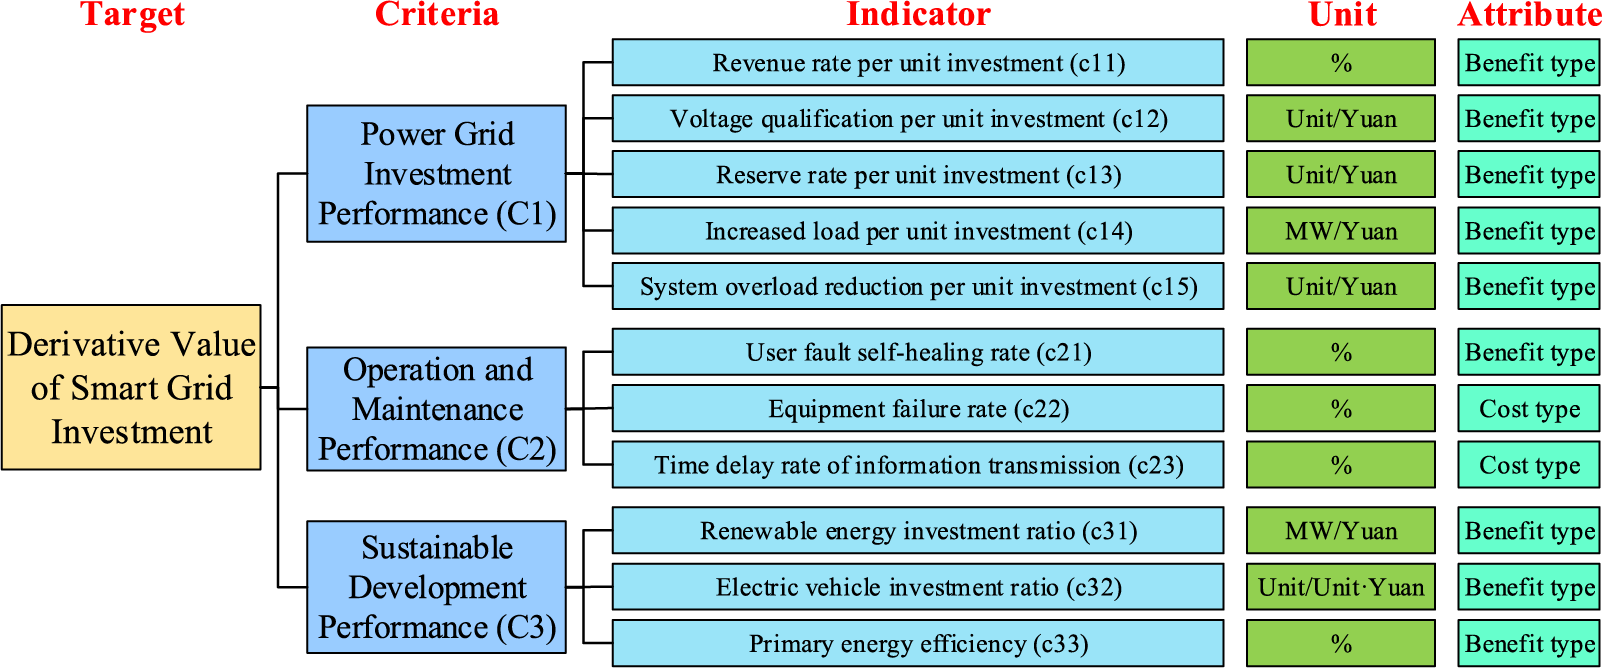
Figure 1: The index framework for evaluating the derivative value of SG investment
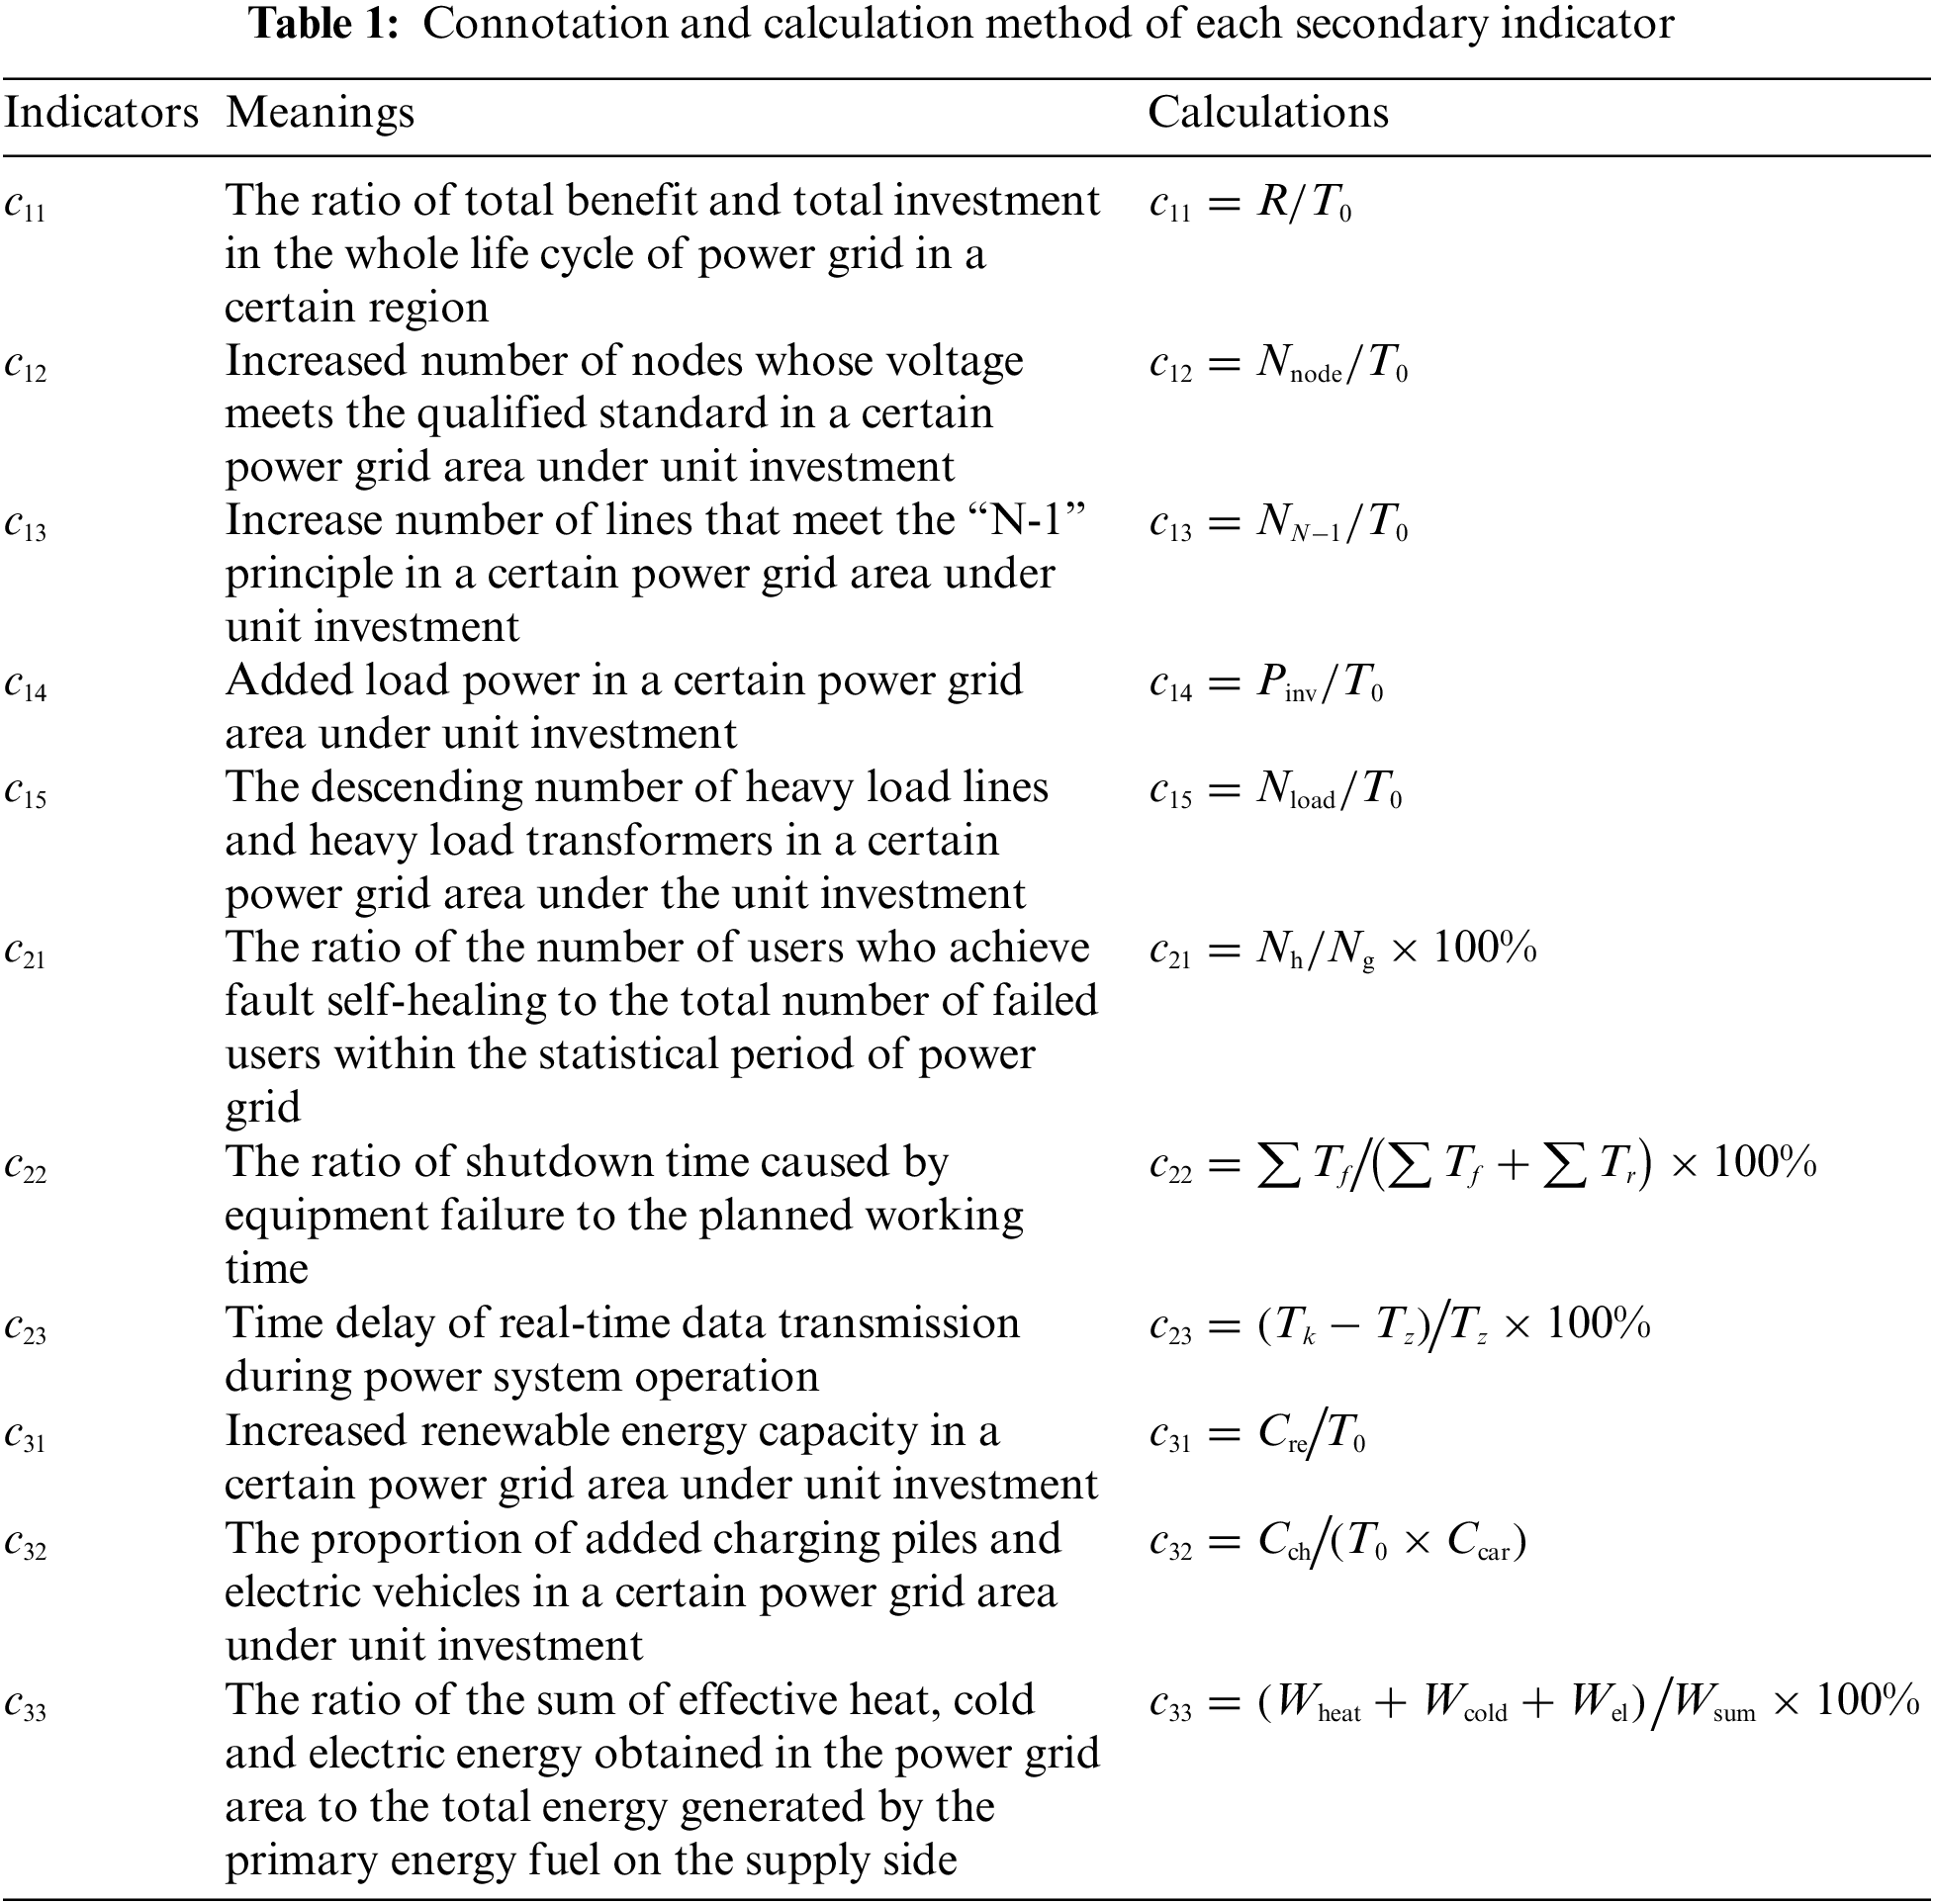
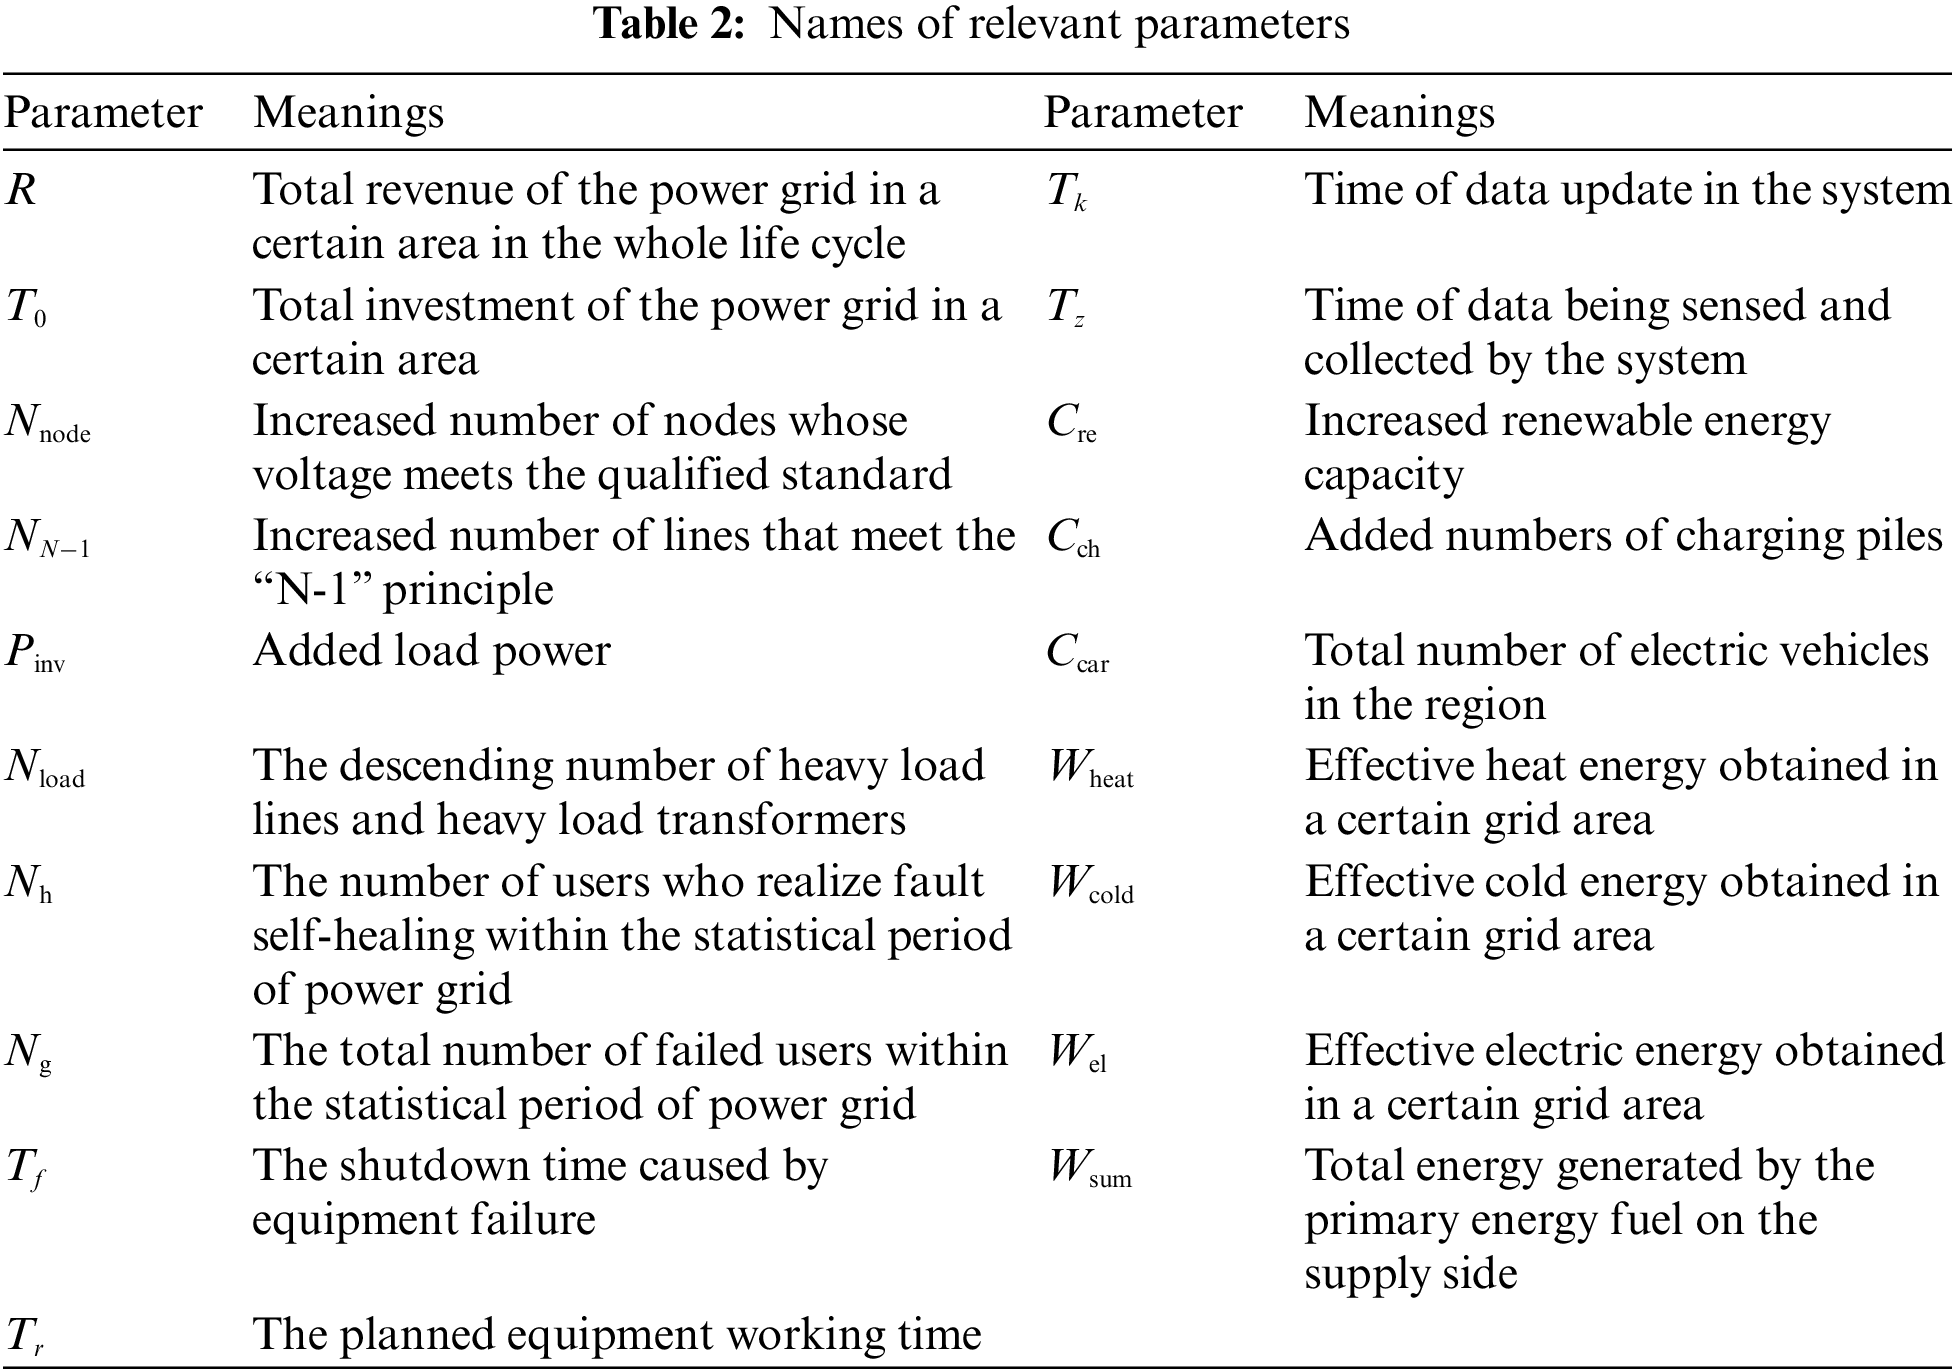
According to Fig. 1, the power grid investment performance index is the intuitive embodiment of the derivative value of SG investment, reflecting the direct economic and physical benefits of SG investment, including revenue rate per unit investment, voltage qualification rate per unit investment, reserve rate per unit investment, increased load per unit investment and system overload reduction per unit investment. The operation and maintenance performance index indicates the reliability guarantee generated by SG investment, including user failure self-healing rate, equipment failure rate, and time delay rate of information transmission. The sustainable development performance index represents the development potential of SG investment, including renewable energy investment ratio, electric vehicle investment ratio, and primary energy efficiency. The constructed SG investment derivative value evaluation index system takes into account the multiple goals of SG development under the dual carbon goal, that is, SG investment needs to enhance the strong level and power supply guarantee ability of the power grid system while obtaining appropriate economic benefits, so that the power grid can withstand the impact of large-scale renewable energy uncertainty, and thus ensure the large-scale consumption of renewable energy from the infrastructure level. The connotation and calculation method of each secondary indicator are shown in Table 1, and the names of relevant parameters are shown in Table 2.
3 Evaluation Model of SG Investment Derivative Value Based on Hybrid MCDM
3.1 Framework of the Proposed Hybrid MCDM Model
The framework of the SG investment derivative value evaluation model proposed in this paper is shown in Fig. 2. Based on the evaluation index system shown in Fig. 1, the hybrid MCDM model includes two parts:
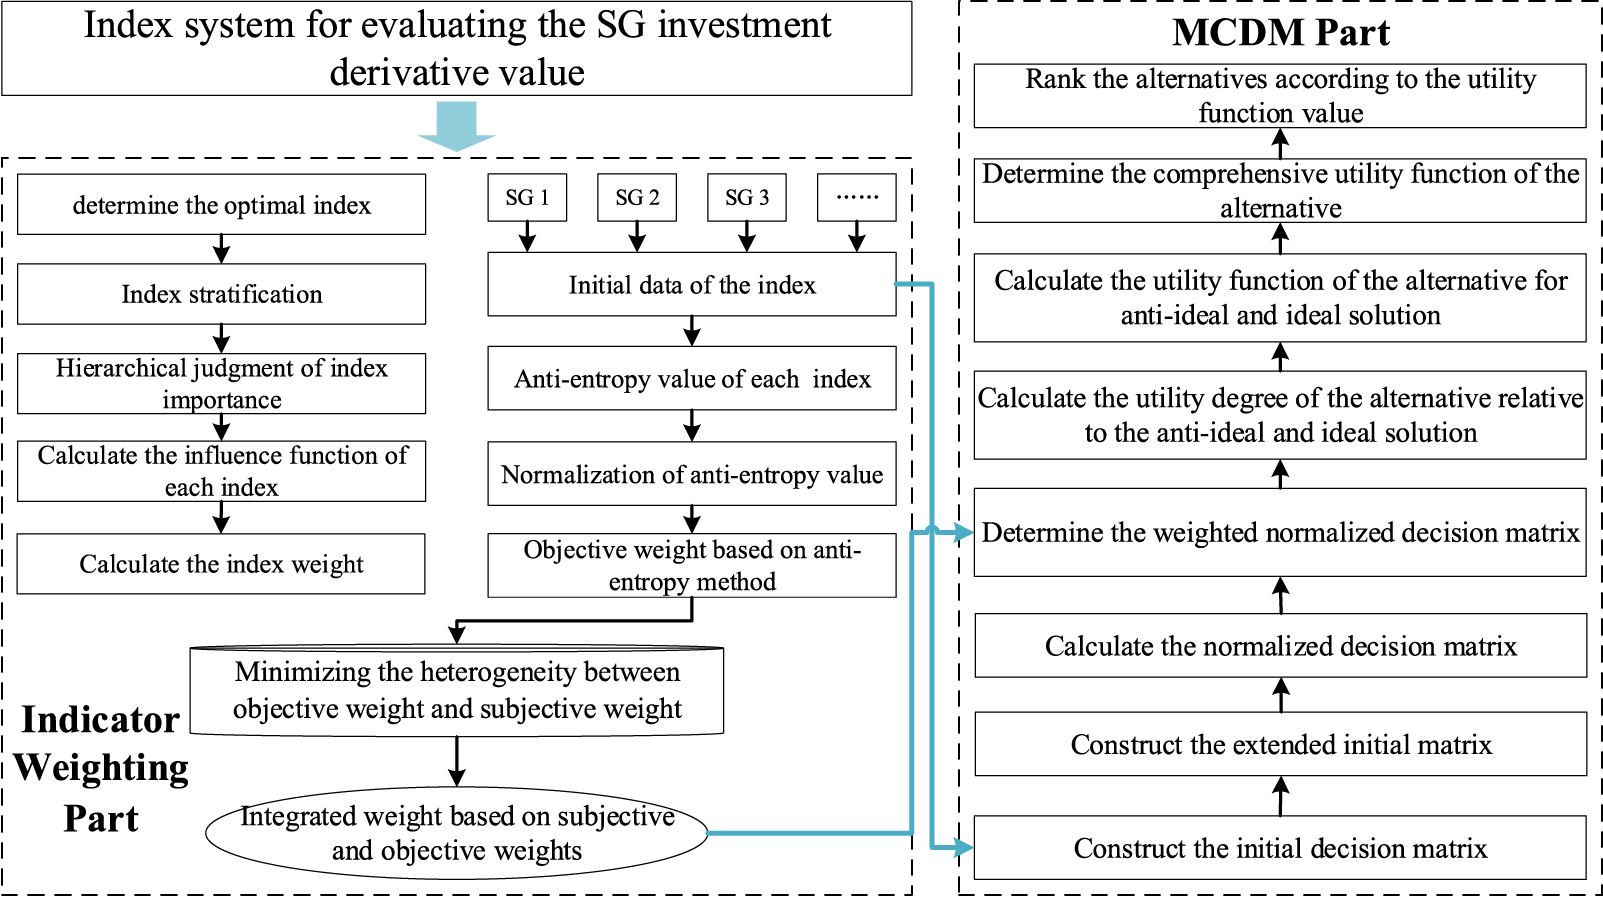
Figure 2: The framework of the proposed hybrid MCDM model
Part 1: Indicator weighting. A weighting model integrating subjective and objective weighting methods (called AEW and LBWA method) is developed in this paper based on the constructed evaluation index system. Firstly, based on all indicators’ values of multiple alternatives, the anti-entropy values of each indicator is calculated, and then the anti-entropy values are normalized to obtain the objective weights. Secondly, invite experts to judge the importance of each indicator, layer the indicators based on the judgment results and construct an LBWA judgment vector, and then calculate the influence function of each indicator. Based on this, calculate the subjective weight based on LBWA. Finally, an optimization model is constructed by minimizing the heterogeneity between objective and subjective weights, and the integrated weights can be obtained to evaluate the derivative value of SG investment.
Part 2: MCDM. The constructed indicators are quantitative and this paper aims to evaluate the derivative value of multiple SG investments, so an MCDM model based on the MARCOS technique is proposed. Firstly, based on the values of multiple alternatives on all indicators, a normalized evaluation matrix is constructed, and then combined with the weight results, a weighted decision matrix is constructed. Secondly, according to the weighted decision matrix, the utility functions of each alternative for anti-ideal and ideal solutions are calculated as the distance. Finally, calculate the comprehensive utility function of each alternative, and rank them accordingly.
3.2 Combined Weighting Method Based on AEW and LBWA
After the evaluation index is constructed, the index weighting method is the key to the quantitative analysis of the derivative value of SG investment. To meet the multiple development goals of the future power grid and implement the action plan of the “Dual Carbon” goal, the index weight needs to take into account the nature of the index itself and the difference of the original data. Therefore, this paper proposes a combined weighting method based on AEW and LBWA, which ensures the reliability of index weight results through the fusion of subjective and objective ideas.
(1) Objective weighting method based on AEW
In this paper, the AEW method is used to determine the objective weight of the index. Entropy is a concept used to measure the disorder degree of a system in a thermodynamic system. When there are
where
For AEW, assuming that there are
where
(2) Subjective weighting method based on LBWA
LBWA method is a subjective weighting method proposed by Serbian scholars Žižović et al. in 2019 [40]. Based on defining the most important indicators among the indicator system, the LBWA method uses it as a benchmark to layer other indicators according to the degree of importance, and then sort the importance of indicators within the layer and make adjacent comparisons and judgments. This method can effectively deal with the inconsistency of ranking caused by a large number of indicators through the index importance stratification, and simplify the index importance comparison process through the index importance ranking within the layer and adjacent comparison judgment. In recent years, the LBWA method has attracted the attention of relevant scholars and has been applied to many MCDM fields, such as renewable energy alternative evaluation, and offshore wind farm location decisions [41,42]. In this paper, the basic steps of using the LBWA method to determine the subjective weight of indicators are as follows:
Step 1: determine the optimal index. According to expert opinions, determine the index with the greatest importance in the index set
Step 2: index stratification. The remaining indicators except the optimal indicator are divided into different layers according to the importance of the indicators. The hierarchical basis is as follows:
Through the above indicator stratification, it can have a rough definition of the importance of indicators. Assuming that for any indicator
And for any
Step 3: hierarchical judgment of index importance. In any layer
where
Step 4: determine the LBWA elasticity coefficient
Step 5: calculate the influence function
where
Step 6: calculate the index weight. According to
Further, the weights of other indicators are:
So far, the subjective weights of all indicators under the LBWA method are obtained, which are recorded as
(3) Subjective and objective integrated weighting method
The fundamental principle of integrating weights is to minimize the heterogeneity between the objective weights and the subjective weights [44]. Thus, the subjective and objective integrated weights can be obtained by solving the following optimization problems:
where
3.3 Evaluation Method Based on MARCOS
In this paper, the evaluation object of SG investment derivative value is the power grid of multiple regions, so it can be studied through the attribute integration method with the ranking function. TOPSIS method is a common multi-alternative ranking method. The traditional TOPSIS takes the relative closeness degree as the basis for alternative ranking, while the relative closeness degree of TOPSIS only considers the relative distance between the alternative and the ideal solution, and is prone to the vertical problem [45]. Based on this, this paper adopts the evaluation method named measurement of alternatives and ranking according to compromise solution (MARCOS), which is developed in 2020 [46]. The specific steps of MARCOS are as follows:
Step 1: Construct the initial decision matrix. Set a multi-criteria model with
Step 2: Construct the extended initial matrix
According to the attribute of indicators, the values of
where
Step 3: Calculate the normalized decision matrix
Step 4: Determine the weighted normalized decision matrix
Step 5: Calculate the utility degree of the alternative
where
Step 6: Determine the utility function
where
Step 7: Rank the alternatives according to the utility function value in Eq. (19). The final realization takes the alternative with the highest utility function value as the ideal alternative.
This section takes 7 regional SGs as examples, uses the constructed MCDM model to evaluate the derivative value of regional SG investment, and verifies the effectiveness of the proposed model.
4.1 Indicator Weighting Results
(1) AEW weighting results
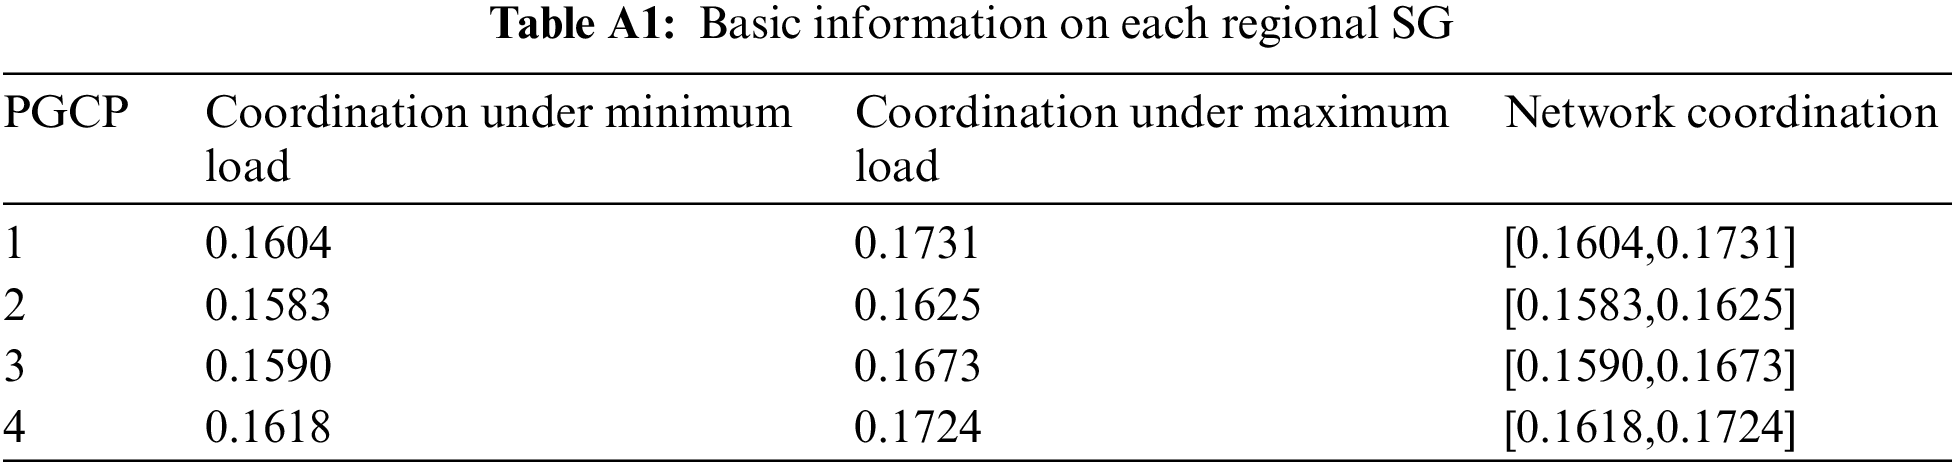
The basic information of the examined 7 regional SGs is listed in the Appendix (Table A1). Collect the original data of each regional SG on each index (the descriptive statistical results are listed in Table 3), calculate the anti-entropy value of each grid on each index, as shown in Table 4, and then calculate the anti-entropy weight of each index according to Eqs. (2) and (3), as shown in Fig. 3.
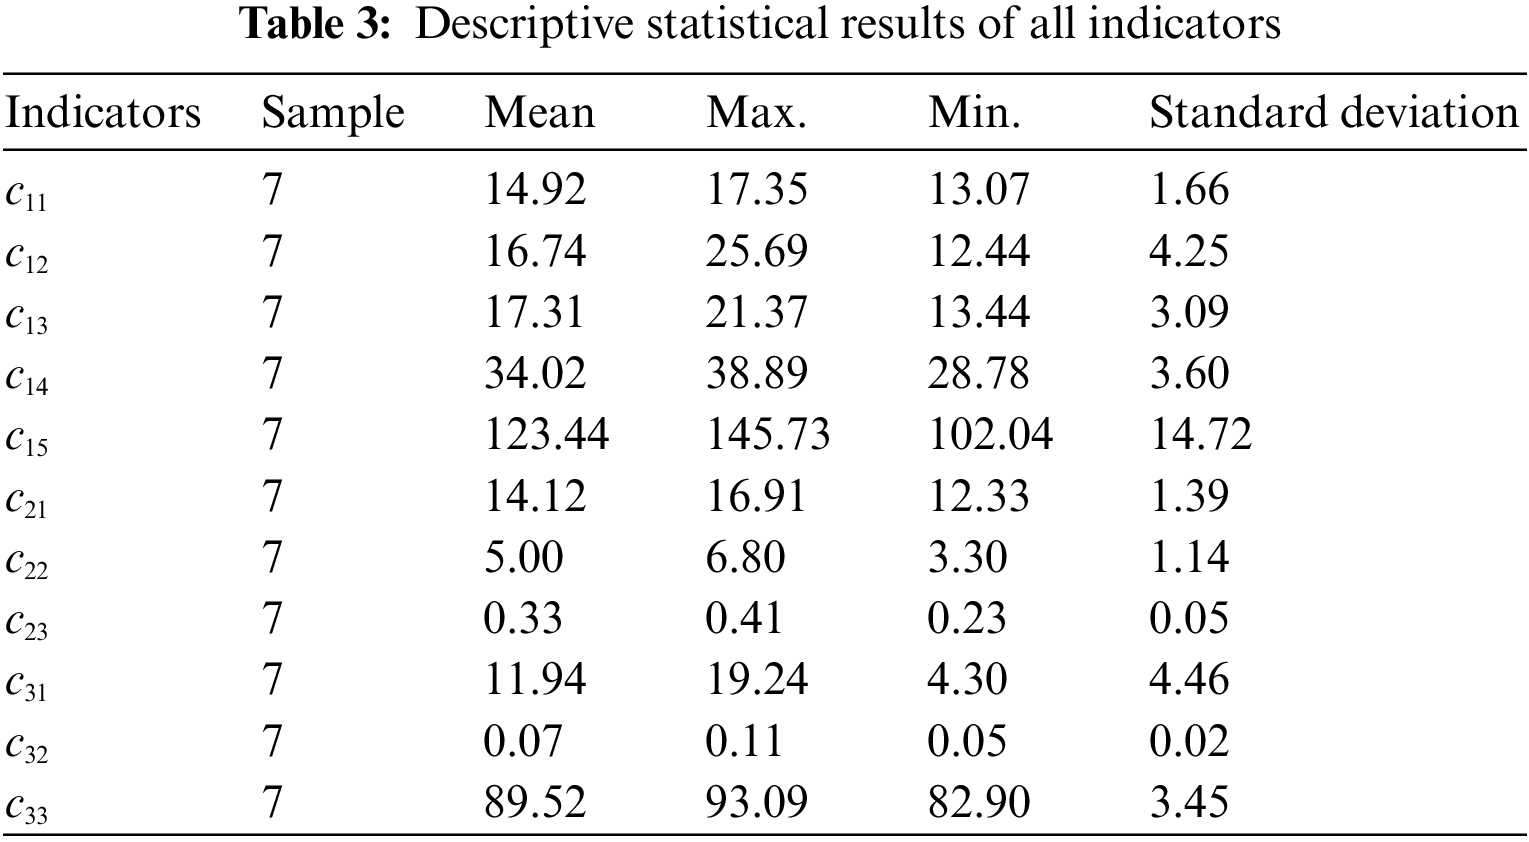
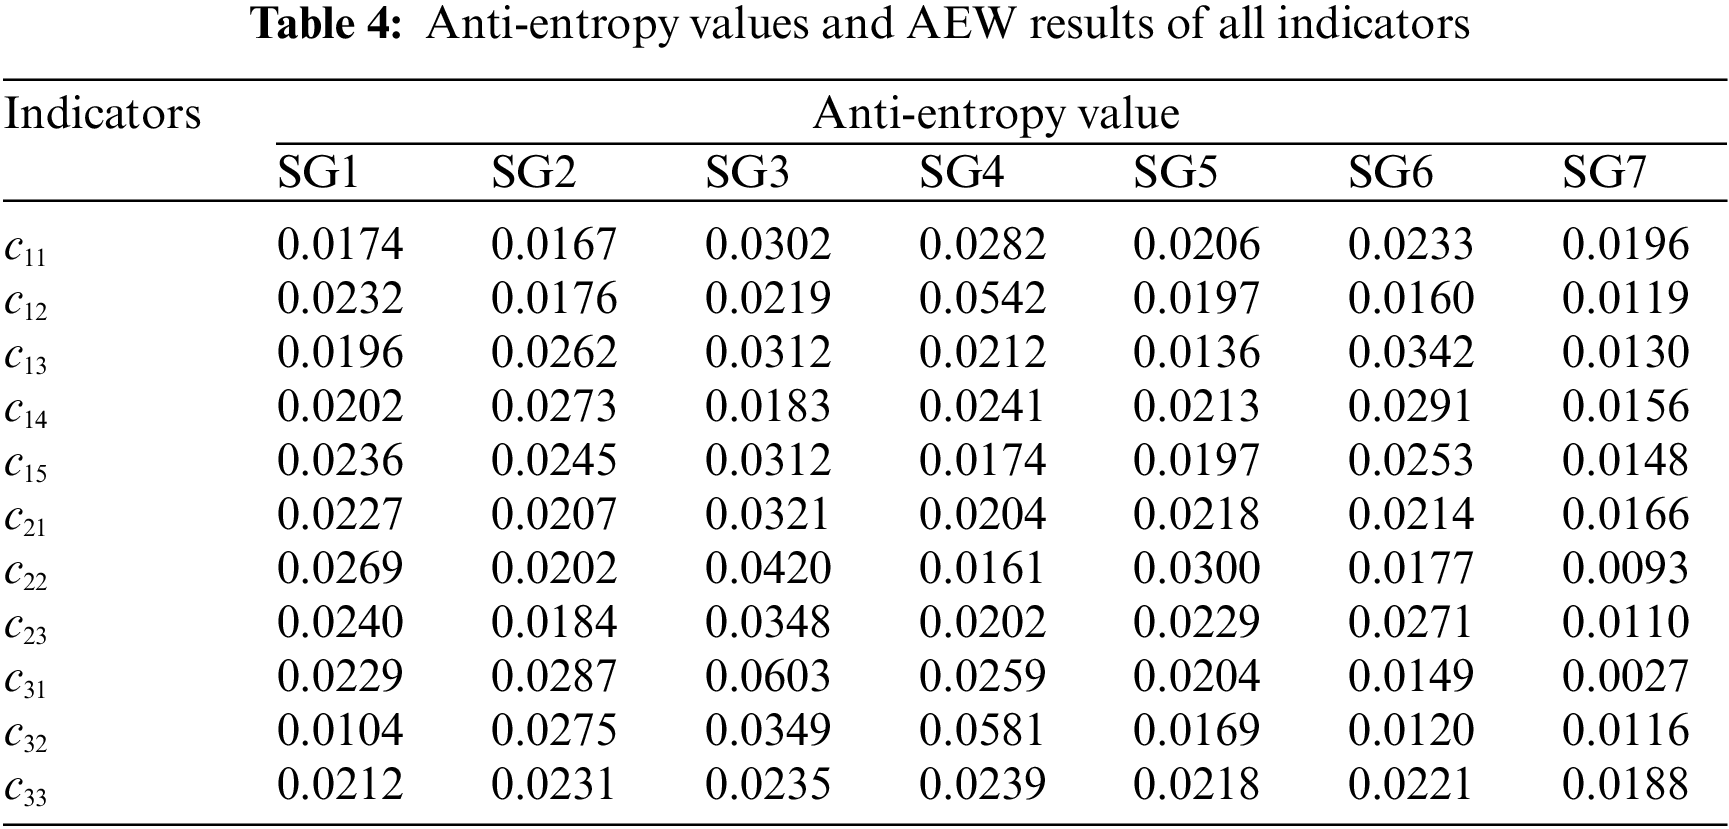
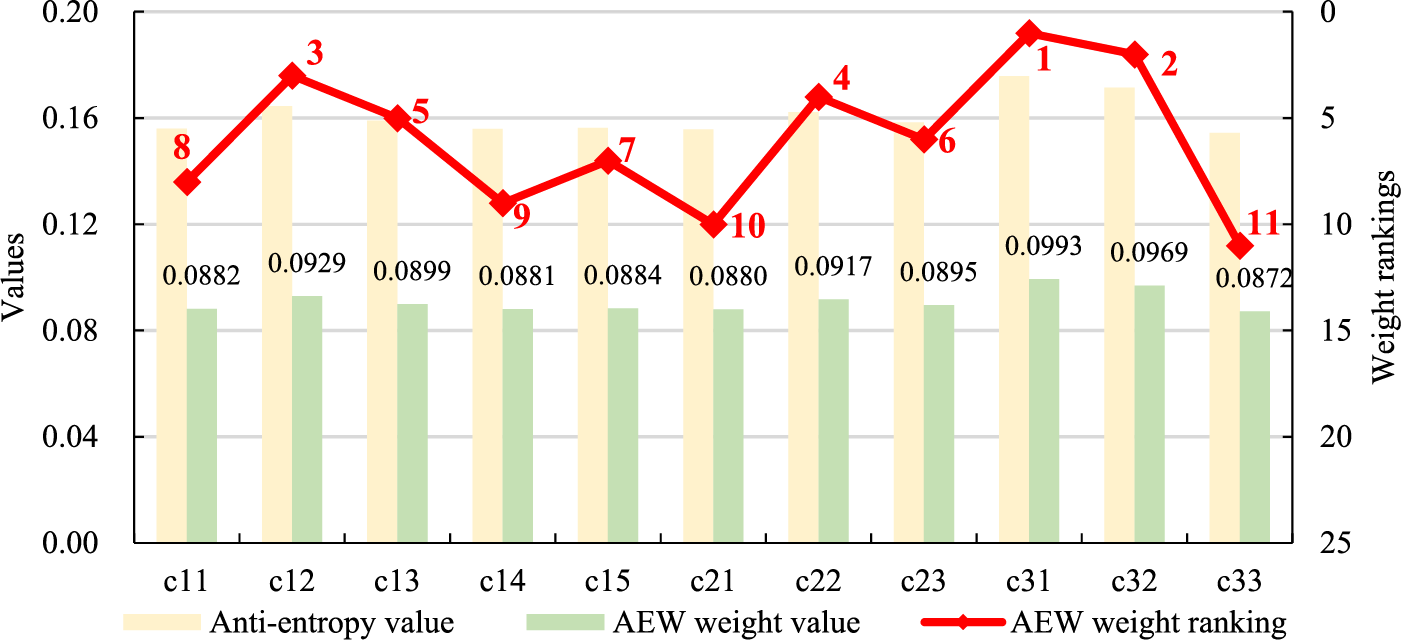
Figure 3: The AEW weighting results for each index
It can be seen in Fig. 3 that the
(2) LBWA weighting results
In order to calculate the LBWA weight of the index system, 9 experts from government agencies, power grid enterprises and research institutions are invited to determine the optimal index in the index system, and conduct index stratification and judgment. According to experts’ opinions, the renewable energy investment ratio (c31) is the optimal index. The remaining indicators can be divided into three layers according to their importance relative to the optimal indicator:
According to Eq. (5), there is:
Then, the importance judgment results of all indicators relative to the optimal indicator are obtained according to expert opinions, that is:
Based on Eq. (6), the influence function of each index is calculated as:
Furthermore, according to Eq. (7), the weight of the optimal index can be calculated as:
Finally, the weight results of other indicators can be obtained according to Eq. (8). To sum up, the LBWA weights of the SG investment derivative value evaluation index system are shown in Fig. 4. It can be seen from Fig. 4 that the indicator with the highest weight is c31, followed by c21 and c11, indicating that from the perspective of the indicator meanings under the dual carbon goal, the promotion of renewable energy investment, the improvement of self reliability, and reasonable revenues are the key points that need to be paid attention to in the derivative value of SG investment. It should be noted that there are differences in the weight results between AEW and LBWA. This is because the two weighting methods have different starting points. AEW only considers the differences in indicator data, while LBWA only considers the meaning of the indicator itself. Both weight results have certain limitations, so it is necessary to combine the two weight results to improve the reliability of the weight results.
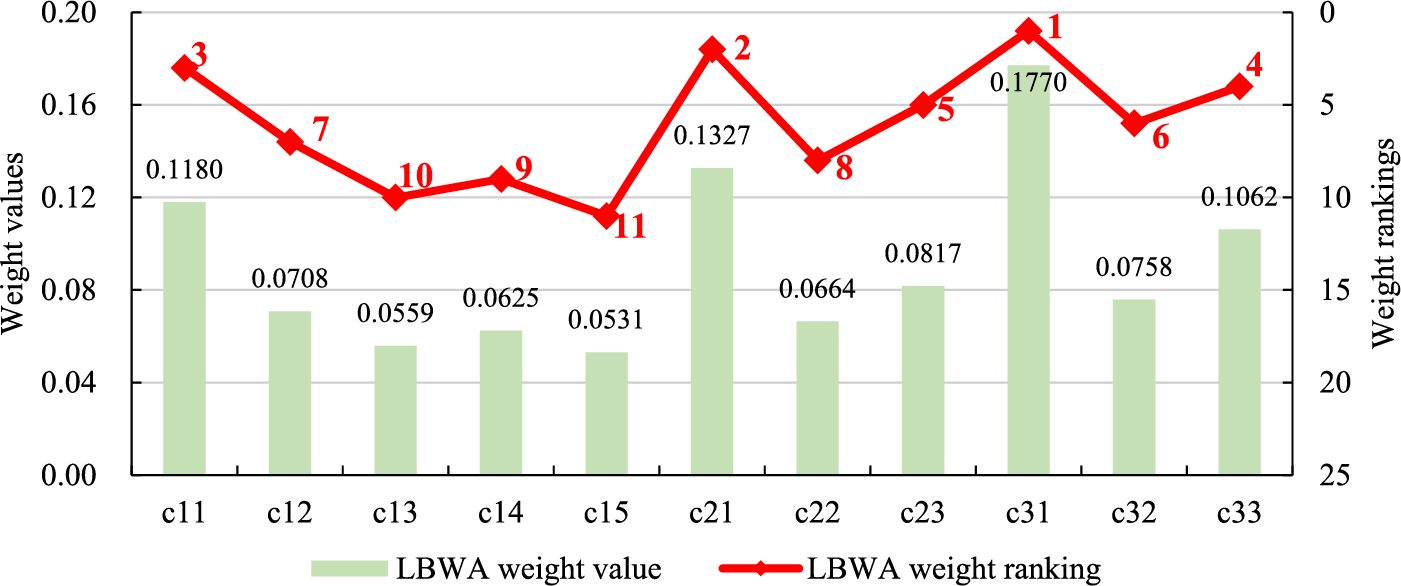
Figure 4: The LBWA weighting results for each index
(3) Combined weighting results
On the basis of determining AEW weight and LBWA weight, MATLAB programming is used to solve Eq. (9), and the subjective and objective integrated weight is obtained:
It can be seen that the four indicators with the largest weight are renewable energy investment ratio (
4.2 Derivative Value Evaluation Results
According to Eqs. (11)~(14), standardize the original data, so as to process the index data into the form of a positive correlation with the evaluation goal. Then, the standardized decision matrix can be obtained, as shown in Table 5.
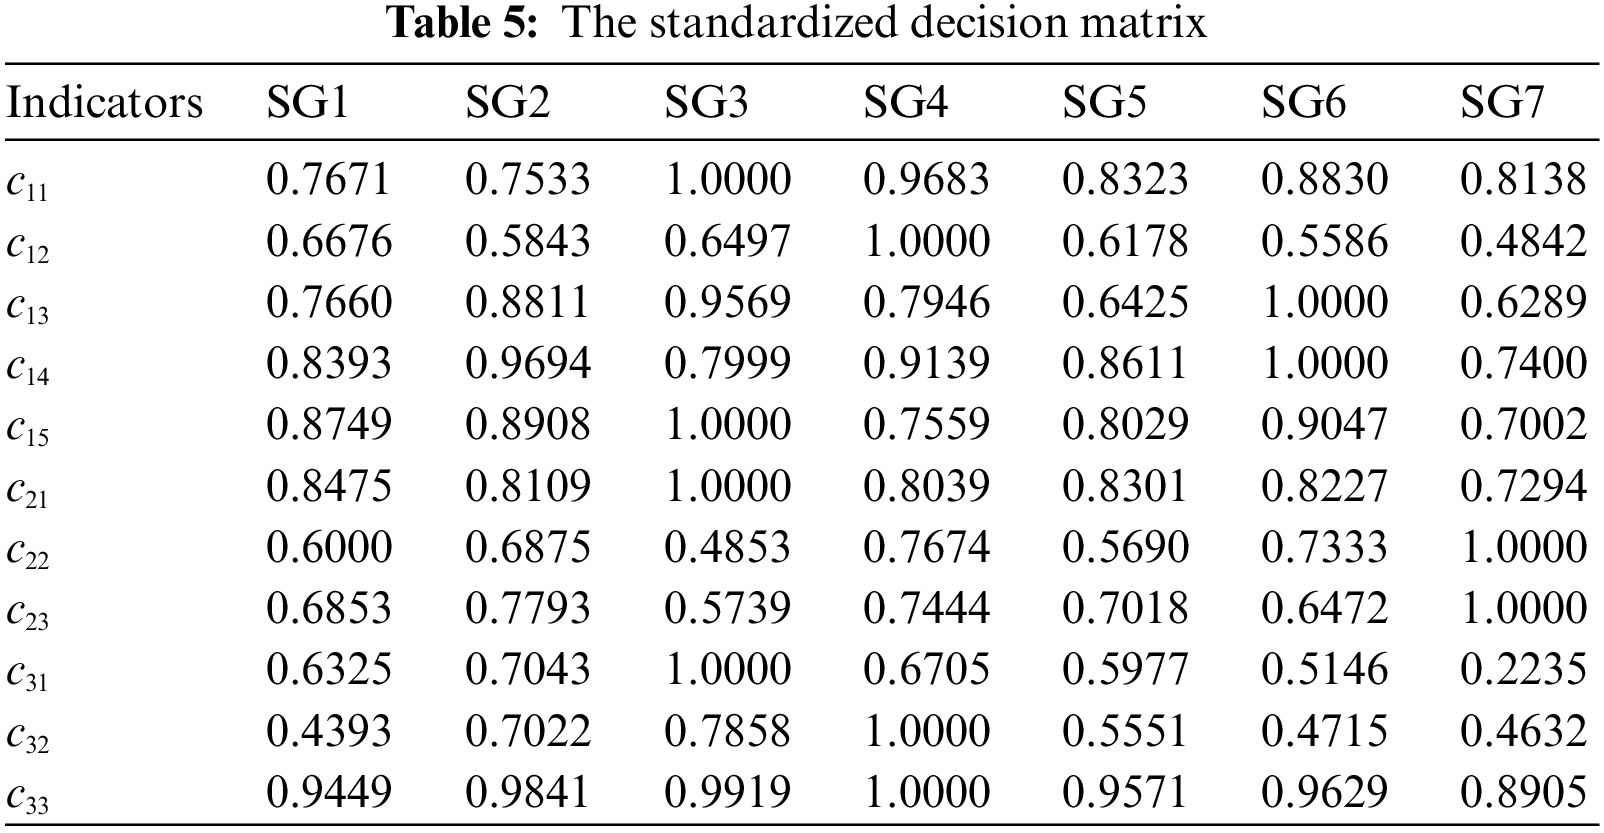
Combined with the index weighting results, the weighted normalized decision matrix is calculated, as shown in Table 6.
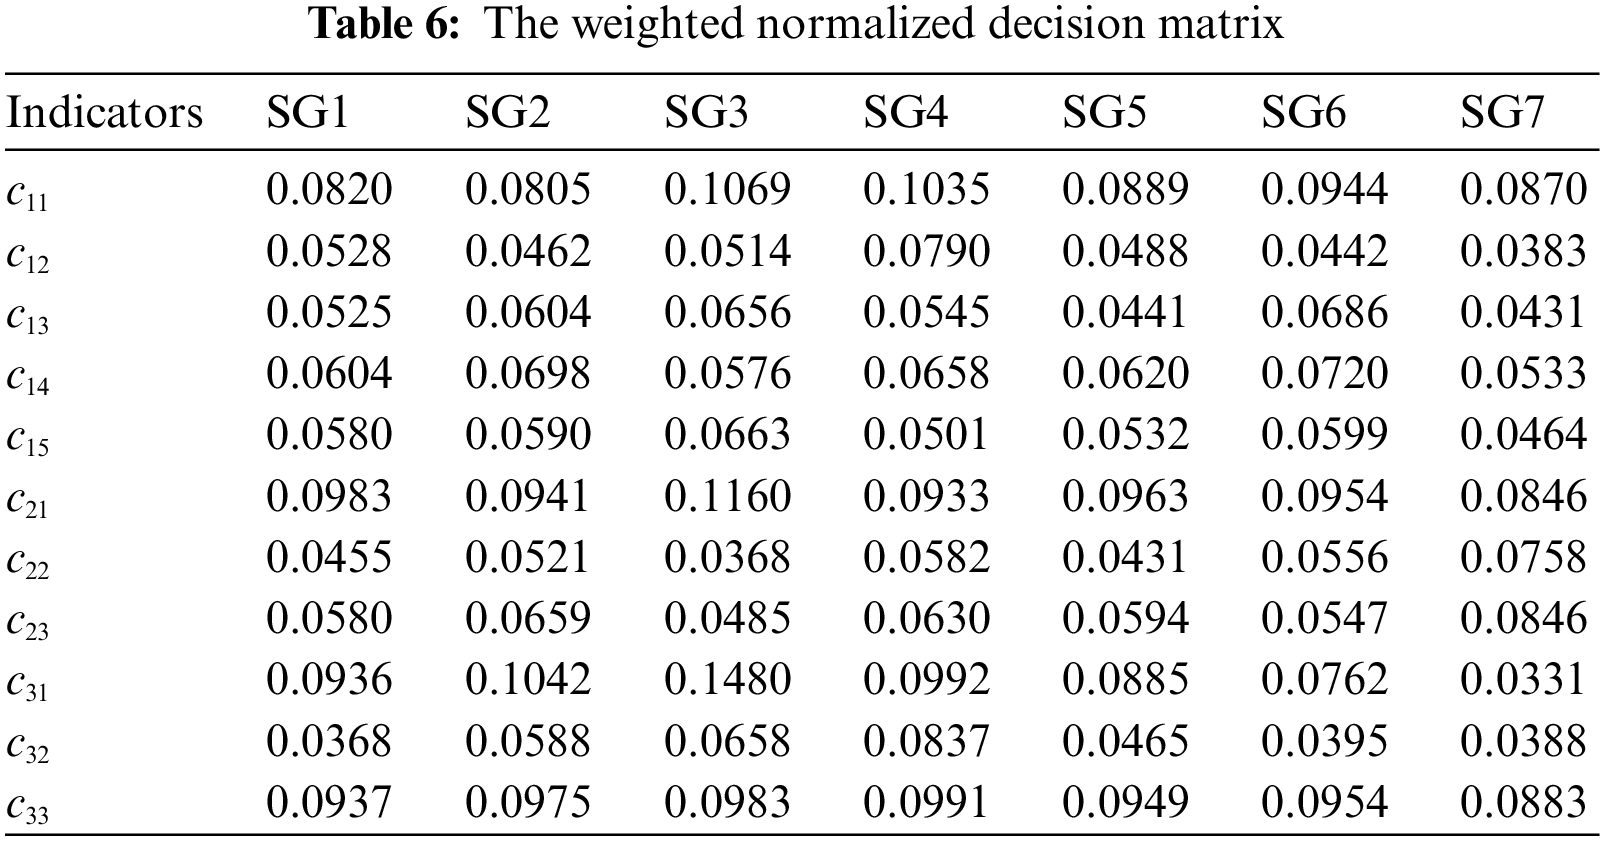
According to Table 6, the ideal and negative ideal solutions are obtained as follows:
According to the weighted normalized decision matrix, the compromise values of MARCOS for each alternative relative to the ideal and negative ideal solutions are determined, and the utility function results of each SG relative to the ideal and negative ideal solutions are calculated by using Eqs. (16)~(21), so as to judge the derivative value of SG investment. The evaluation results of the derivative value of SG investment based on MARCOS are shown in Table 7.
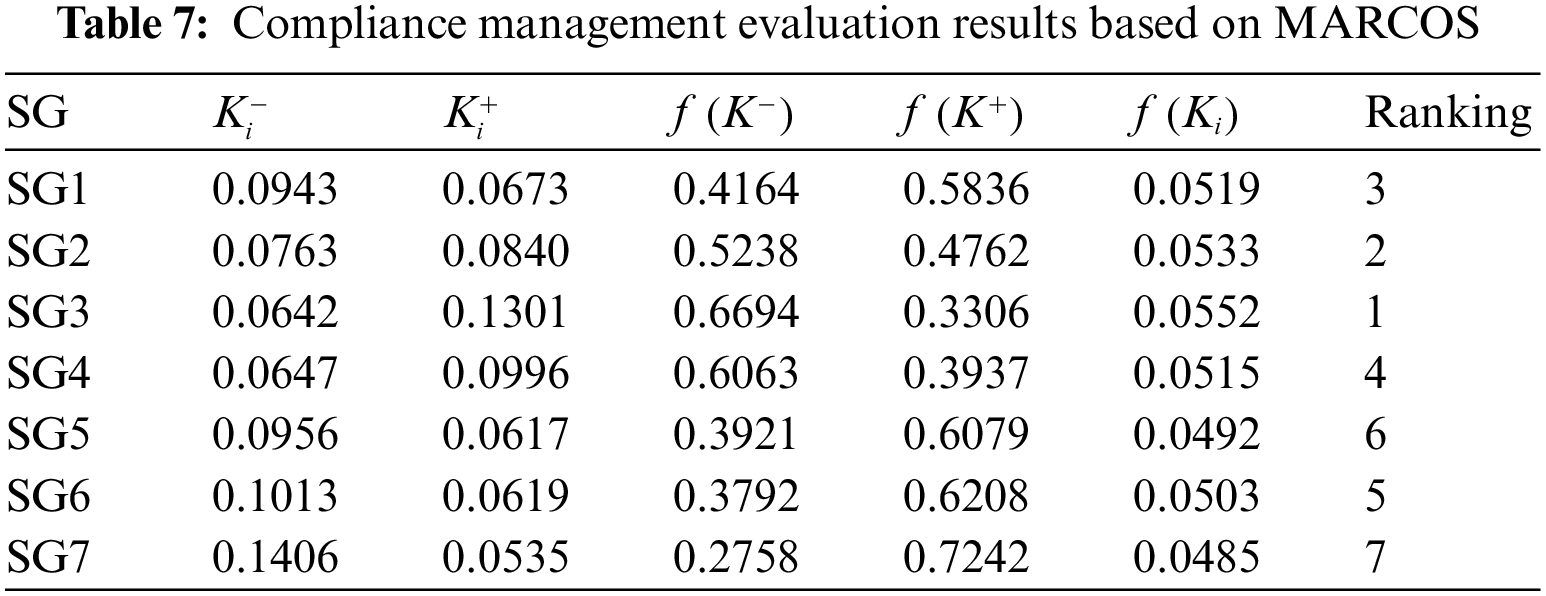
It can be seen that among the seven regional SGs, SG3 has the largest utility value, indicating that the derivative value of the grid investment is the largest; SG7 has the smallest utility value, so its investment derivative value is the smallest. In terms of the performance of secondary indicators, among the four secondary indicators with the largest weight, SG3 performs best in
Therefore, when SG investment performs poorly in promoting renewable energy consumption and improving primary energy efficiency, its investment will significantly reduce the driving force for future sustainable development, making grid investment lack derivative value. In addition, SG investment also needs to be able to improve its fault resistance, which is reflected in the fact that the power grid can achieve self-healing through intelligent ability in the event of a fault. Finally, on the basis of promoting the consumption of renewable energy and improving its own fault repair ability, SG investment also needs to pay attention to the economy of investment, which is an important guarantee to ensure that the power grid has an adequate and stable source of investment funds.
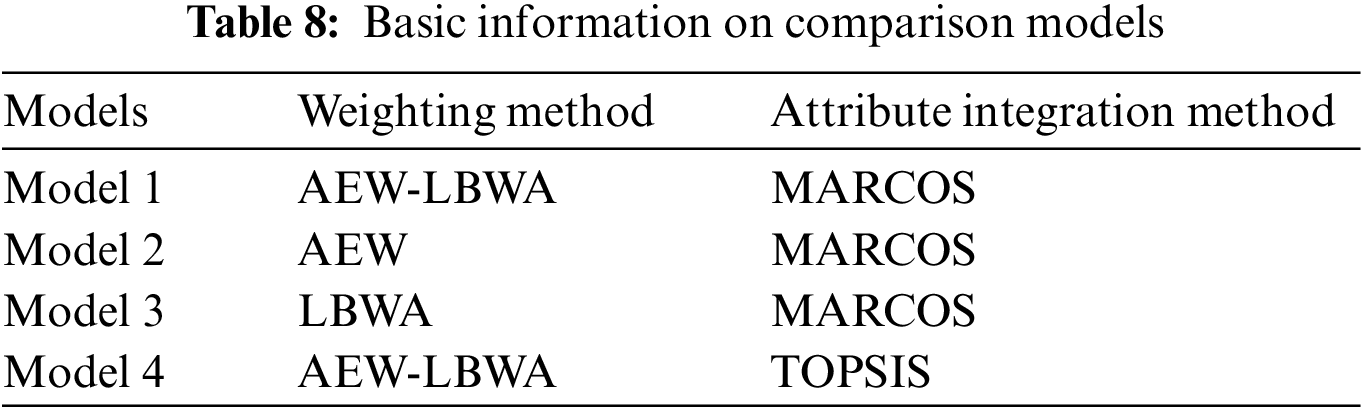
In order to verify the effectiveness of the constructed SG investment derivative value evaluation model, three comparative models are designed to carry out the ranking consistency test and sample separation test. The set comparison model is shown in Table 8, in which Model 1 is the model proposed in this paper.
(1) Ranking consistency test
Ranking consistency is an important index to reflect the robustness of MCDM methods. According to references [47,48], this paper constructs the following ranking consistency index:
where
Based on the basic data of the above-mentioned 7 SGs on various indicators, the ranking results of the 7 SG investment derivative value evaluations under each comparison model are obtained, and then the ranking consistency of the three comparison models relative to Model 1 is calculated. The results are shown in Figs. 5 and 6.
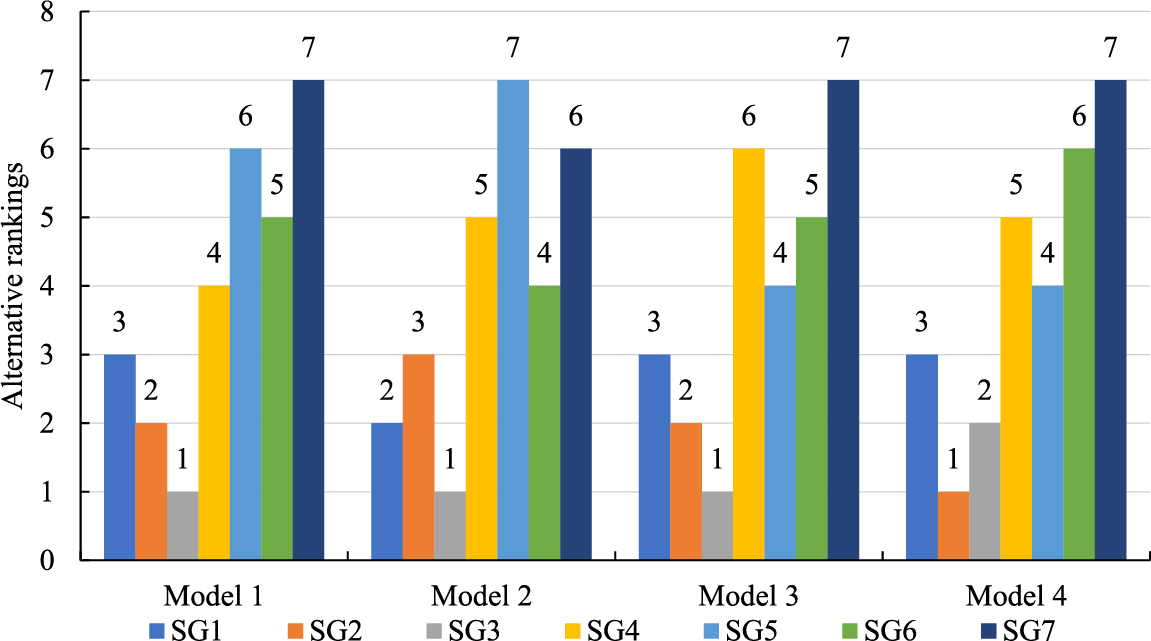
Figure 5: Alternative rankings under four models
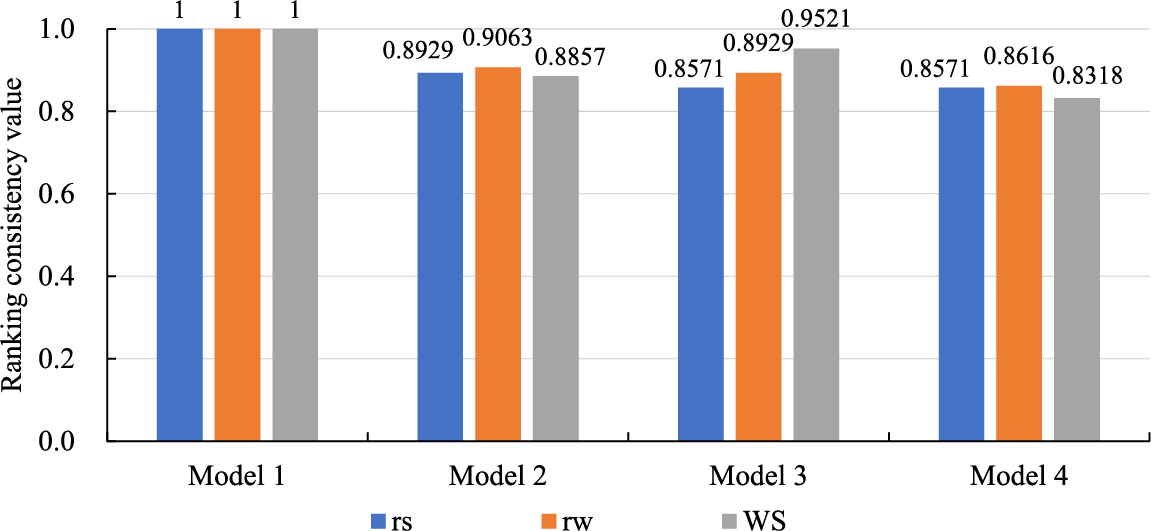
Figure 6: The ranking consistency of the three comparison models relative to Model 1
According to Fig. 6, the values of the three comparison models on the three ranking consistency indicators are greater than 0.8, and the values of the other ranking consistency indicators are greater than 0.85 except for the
(2) Sample separation test
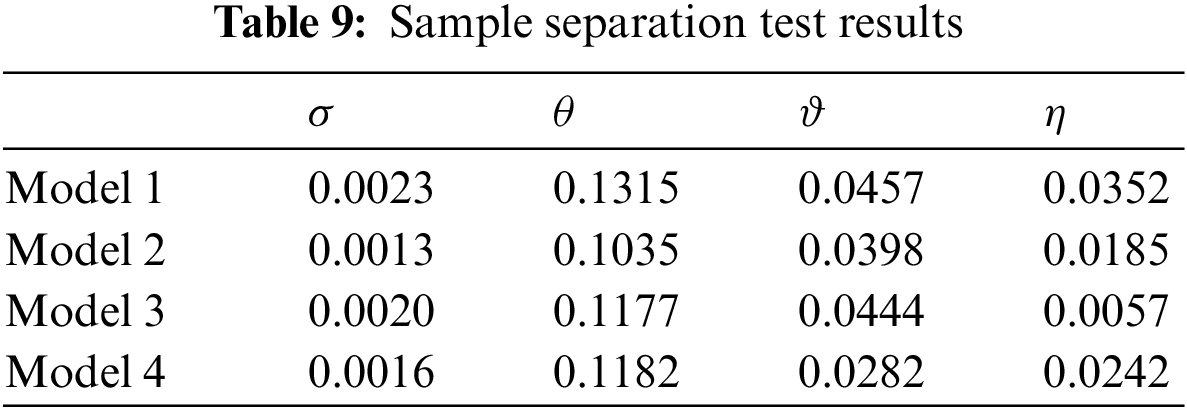
Sample separation test is an important means to judge the effectiveness of the ranking results of the MCDM model. According to references [49,50], the following four indicators for the sample separation test are set, named standard deviation (
where
Similarly, this section uses the three comparison models in Tables 7 and 8 SGs to test the sample separation, and the results are shown in Table 9. It can be seen from Table 9 that the four sample separation indexes of Model 1 are greater than those of the other three models, indicating that compared with the comparison model, the hybrid MCMD model proposed in this paper has better performance in sample differentiation and can better reflect the differences in the derivative value of different SG investments. Therefore, the SG investment derivative value evaluation model based on AEW-LBWA weighting and MARCOS proposed in this paper can better improve the decision-making efficiency on the premise of ensuring robustness.
The continuous increase of global greenhouse gas emissions has promoted climate warming, and countries have set the goal of “carbon peaking and carbon neutralization”. Expanding the scale of renewable energy power generation and accelerating the construction of green and low-carbon power systems are important ways to promote carbon emission reduction in the energy sector. SG has the characteristics of strong self-healing ability and high stability, which is an important support for large-scale grid connection of renewable energy. However, many external factors need to be considered in SG investment, and the relationship between investment demand and investment capacity, long-term development and short-term demand needs to be dynamically balanced. Therefore, mining and quantifying the derivative value of SG investment driving social development is of great significance for accurately grasping the external effects of SG investment and supporting the realization of industrial linkage value with grid investment as the core. Based on the analysis of the value derivation mechanism of the power grid to economy and society, this paper constructs the evaluation index system of SG investment derivative value and the hybrid MCDM model, and verifies the effectiveness of the model.
The indicator weighting results show that two of the four indicators with the highest weight reflect the sustainable development performance of SG, one indicator reflects the investment performance of SG, and one indicator reflects the operation and maintenance performance of SG, that is, for SG investment, the value of sustainable development can better reflect its derivative value. The development of SG should pay more attention to the promotion of renewable energy consumption, and further improve the level of intelligence and pay attention to investment benefits. By evaluating the investment derivative value of 7 regional SGs, it is found that when SG investment performs poorly in promoting renewable energy consumption, improving primary energy efficiency, and improving its own fault resistance, its investment will significantly reduce the driving force for future sustainable development, making grid investment lack derivative value. In addition, SG investment needs to pay attention to the economy of investment, which is an important guarantee to ensure that the power grid has sufficient and stable sources of investment funds.
The hybrid MCDM model constructed in this paper has good applicability for evaluating the derivative value of SG investment. On the one hand, the proposed subjective and objective integrated weighting method based on the AEW method and LBWA method can make full use of the original information of the index of the object to be evaluated, and can consider the meaning of the index itself, ensuring the interpretability of the weight results and avoiding subjectivity. On the other hand, the proposed MARCOS method takes into account the comprehensive utility value between the alternative scheme and the ideal and negative ideal solution at the same time, which makes the evaluation result more credible, can better improve the decision-making efficiency on the premise of ensuring robustness, and has good applicability for evaluating multiple objects.
The evaluation of SG investment derivative value in this paper can guide the investment decision-making of SG projects, but limited to the research topic, this paper does not delve into how to make investment decisions based on investment derivative value. In the future, the concept of derivative value proposed in this paper can be introduced into the decision analysis framework of SG project investment, so as to break through the limitation of traditional investment decisions that pay too much attention to financial benefits. In this way, the results of SG investment decisions can better meet the requirements of dual carbon goals.
Acknowledgement: Thanks are due to the editors and reviewers for their valuable opinions, which are of great help to improve the quality of this paper.
Funding Statement: The authors received no specific funding for this study.
Author Contributions: N.Y., and C.G. conceived and designed the research method used in this paper; X.W. and W.Y. collected the data, related policy documents and reference used for the analysis; D.L. performed the empirical analysis and wrote the paper.
Availability of Data and Materials: The data that support the findings of this paper are available on request from the corresponding author.
Conflicts of Interest: The authors declare that they have no conflicts of interest to report regarding the present study.
References
1. Jiang, H. Y., Du, E. S., Jin, C., Xiao, J. Y., Hou, J. M. et al. (2021). Optimal planning of multi-time scale energy storage capacity of cross-national interconnected power system with high proportion of clean energy. Proceedings of the CSEE, 41(6), 2101–2115. [Google Scholar]
2. Huang, W., Liu, Q., Yang, S. W., Xiong, W. P., Liu, Z. F. (2017). Security situation awareness based on power-supply ability model of active distribution system. Electric Power Automation Equipment, 37, 74–80. [Google Scholar]
3. Falchetta, G., Dagnachew, A. G., Hof, A. F., Milne, D. J. (2021). The role of regulatory, market and governance risk for electricity access investment in sub-Saharan Africa. Energy for Sustainable Development, 62, 136–150. [Google Scholar]
4. Masera, M., Bompard, E. F., Profumo, F., Hadjsaid, N. (2018). Smart (electricity) grids for smart cities: Assessing roles and societal impacts. Proceedings of the IEEE, 106(4), 613–625. [Google Scholar]
5. Zame, K. K., Brehm, C. A., Nitica, A. T., Christopher, L. (2018). Smart grid and energy storage: Policy recommendations. Renewable and Sustainable Energy Reviews, 82(3), 1646–1654. [Google Scholar]
6. Wang, D. P., Lv, L., Tang, J., He, X. (2019). Research on establishment and method of performance evaluation index system of smart grid distribution network. 2019 IEEE Innovative Smart Grid Technologies-Asia (ISGT Asia), pp. 3327–3332. Chengdu, China. [Google Scholar]
7. Hong, Q., Li, H. X. (2018). Research and application of benefit oriented power grid investment decision. Enterprise Management, 1, 88–89. [Google Scholar]
8. Ma, Q., Wang, X. C., Pan, X. P., Liu, X. F. (2019). Evaluation method of power grid investment decision based on utility function under new electricity reform environment. Electric Power Automation Equipment, 39(12), 198–204. [Google Scholar]
9. Luo, G. L., Yuan, X. H., Zhang, X. Y. (2011). Evaluating power grid enterprise’s investment returns. Energy Procedia, 5(8), 224–228. [Google Scholar]
10. Cucchiella, F., D’Adamo, I., Gastaldi, M. (2015). Financial analysis for investment and policy decisions in the renewable energy sector. Clean Technologies and Environmental Policy, 17(4), 887–904. [Google Scholar]
11. Ji, Y. H., Zhao, Y., Leng, X. B., Niu, F., Lu, Y. D. et al. (2020). Study on the financial evaluation model of international power grid investment based on the case of the investment in the green space project of the power grid in the Greater Mekong sub region. Communication of Finance and Accounting, 24, 89–93. [Google Scholar]
12. Zhou, H. Y., Su, Y. S., Chen, Y. P., Ma, Q., Mo, W. K. (2016). The China southern power grid: Solutions to operation risks and planning challenges. IEEE Power and Energy Magazine, 14(4), 72–78. [Google Scholar]
13. Yang, F., Duan, M. N., Gao, P., Zhang, Z., Liu, Y. Y. et al. (2018). The influence on distribution network planning and investment strategy of power grid corp under electric power system reform. 2018 China International Conference on Electricity Distribution (CICED), pp. 2426–2430. Tianjin, China. [Google Scholar]
14. You, Y. G. (2021). The studying of power grid planning based on complex adaptive system theory. 2021 6th International Conference for Convergence in Technology (I2CT), pp. 1–4. Mumbai, India. [Google Scholar]
15. Santos, A. Q., Ma, Z., Olsen, C. G., Jorgensen, N. B. (2018). Framework for microgrid design using social, economic, and technical analysis. Energies, 11(10), 2832. [Google Scholar]
16. Yang, F., Zhang, S., Sun, C. W. (2020). Energy infrastructure investment and regional inequality: Evidence from China’s power grid. Science of the Total Environment, 749(2), 142384. [Google Scholar] [PubMed]
17. Yin, S., Cao, Z. C., Chen, X., Li, H., Yang, M. et al. (2022). Evaluation method of power grid investment benefit based on matter-element extension model. 2nd International Conference on Internet of Things and Smart City (IoTSC 2022), pp. 578–581. Xiamen, China. [Google Scholar]
18. Parag, Y., Ainspan, M. (2019). Sustainable microgrids: Economic, environmental and social costs and benefits of microgrid deployment. Energy for Sustainable Development, 52(3), 72–81. [Google Scholar]
19. Duan, Y. N., Sun, Y., Zhang, Y., Fan, X. Q., Dong, Q. H. et al. (2021). Risk evaluation of electric power grid investment in China employing a hybrid novel MCDM method. Mathematics, 9(5), 473. [Google Scholar]
20. Ahl, A., Goto, M., Yarime, M., Tanaka, K., Sagawa, D. (2022). Challenges and opportunities of blockchain energy applications: Interrelatedness among technological, economic, social, environmental, and institutional dimensions. Renewable and Sustainable Energy Reviews, 166(3), 112623. [Google Scholar]
21. Su, S. W., Xiong, W., Ren, Q. L., Li, B., Sun, W. J. (2014). The application of analytic hierarchy process (AHP) in the power grid planning. Advanced Materials Research, 860, 2540–2543. [Google Scholar]
22. Celiktas, M. S., Kocar, G. (2010). From potential forecast to foresight of Turkey’s renewable energy with Delphi approach. Energy, 35(5), 1973–1980. [Google Scholar]
23. You, P., Guo, S., Zhao, H. R., Zhao, H. R. (2017). Operation performance evaluation of power grid enterprise using a hybrid BWM-TOPSIS method. Sustainability, 9(12), 2329. [Google Scholar]
24. Luo, J. M., Zhao, S. L., Yu, H., Ye, R. J. (2020). Calculation method and system of energy efficiency evaluation based on integrated power grid. International Conference on Frontier Computing, pp. 859–866. Singapore. [Google Scholar]
25. Zhao, G. P., Wang, D. (2019). Comprehensive evaluation of AC/DC hybrid microgrid planning based on analytic hierarchy process and entropy weight method. Applied Sciences, 9(18), 3843. [Google Scholar]
26. Wang, W. Y., Li, H. C., Hou, X. L., Zhang, Q., Tian, S. F. (2021). Multi-criteria evaluation of distributed energy system based on order relation-anti-entropy weight method. Energies, 14(1), 246. [Google Scholar]
27. Wu, G., Francey, L. J., Ruben, M. D., Hogenesch, J. B. (2021). Normalized coefficient of variation (nCVA method to evaluate circadian clock robustness in population scale data. Bioinformatics, 37(23), 4581–4583. [Google Scholar] [PubMed]
28. Odu, G. O. (2019). Weighting methods for multi-criteria decision making technique. Journal of Applied Sciences and Environmental Management, 23(8), 1449–1457. [Google Scholar]
29. Niño-Adan, I., Manjarres, D., Landa-Torres, I., Portillo, E. (2021). Feature weighting methods: A review. Expert Systems with Applications, 184(2), 115424. [Google Scholar]
30. Pena, J., Nápoles, G., Salgueiro, Y. (2019). Implicit and hybrid methods for attribute weighting in multi-attribute decision-making: A review study. Artificial Intelligence Review, 54(5), 3817–3847. [Google Scholar]
31. Tian, Z. P., Nie, R. X., Wang, J. Q., Li, L. (2019). Group multigranular linguistic QFD for prioritizing service designs with combined weighting method. Expert Systems, 36(4), 12419. [Google Scholar]
32. Wang, X., Zhang, L. (2022). A combined weighting model based on maximizing deviation for multiple attribute decision-making. Advances in Materials Science and Engineering, 2022, 7679851. [Google Scholar]
33. Kaya, I., Colak, M., Terzi, F. (2019). A comprehensive review of fuzzy multi criteria decision making methodologies for energy policy making. Energy Strategy Reviews, 24(1), 207–228. [Google Scholar]
34. Wang, M., Niu, D. X. (2019). Research on project post-evaluation of wind power based on improved ANP and fuzzy comprehensive evaluation model of trapezoid subordinate function improved by interval number. Renewable Energy, 132(23), 255–265. [Google Scholar]
35. Liu, H., Shen, W. J., He, X. Y., Zeng, B., Liu, Y. X. et al. (2021). Multi-scenario comprehensive benefit evaluation model of a multi-energy micro-grid based on the matter-element extension model. Energy Science & Engineering, 9(3), 402–416. [Google Scholar]
36. Niu, D. X., Li, Y., Dai, S. Y., Kang, H., Xue, Z. Y. et al. (2018). Sustainability evaluation of power grid construction projects using improved TOPSIS and least square support vector machine with modified fly optimization algorithm. Sustainability, 10(1), 231. [Google Scholar]
37. Qi, X., An, L., Wang, J. J. (2021). Evaluation of power grid technical transformation project based on TOPSIS-KMEANS method. 2021 3rd International Conference on Artificial Intelligence and Advanced Manufacture, pp. 635–639. Manchester, UK. [Google Scholar]
38. Zheng, G. Z., Wang, X. (2020). The comprehensive evaluation of renewable energy system schemes in tourist resorts based on VIKOR method. Energy, 193(1), 116676. [Google Scholar]
39. Luo, C. Y. L., Yang, K., Xu, B. C., Huang, Y. H., Wang, L. et al. (2022). Evaluation and analysis of power grid investment benefit efficiency based on DEMATEL-improved grey correlation method. 4th International Conference on Information Science, Electrical, and Automation Engineering (ISEAE 2022), pp. 788–796. Hangzhou, China. [Google Scholar]
40. Žižović, M., Pamucar, D. (2019). New model for determining criteria weights: Level based weight assessment (LBWA) model. Decision Making: Applications in Management and Engineering, 2(2), 126–137. [Google Scholar]
41. Ecer, F., Pamucar, D., Mardani, A., Alrasheedi, M. (2021). Assessment of renewable energy resources using new interval rough number extension of the level based weight assessment and combinative distance-based assessment. Renewable Energy, 170(2), 1156–1177. [Google Scholar]
42. Deveci, M., Özcan, E., John, R., Covrig, C. F., Pamucar, D. (2020). A study on offshore wind farm siting criteria using a novel interval-valued fuzzy-rough based Delphi method. Journal of Environmental Management, 270(1), 110916. [Google Scholar] [PubMed]
43. Torkayesh, A. E., Pamucar, D., Ecer, F., Chatterjee, P. (2021). An integrated BWM-LBWA-CoCoSo framework for evaluation of healthcare sectors in Eastern Europe. Socio-Economic Planning Sciences, 78(1), 101052. [Google Scholar]
44. Davoudabadi, R., Mousavi, S. M., Sharifi, E. (2020). An integrated weighting and ranking model based on entropy, DEA and PCA considering two aggregation approaches for resilient supplier selection problem. Journal of Computational Science, 40(9–12), 101074. [Google Scholar]
45. Zhao, H. R., Li, B. K., Lu, H., Wang, X. J., Li, H. Z. et al. (2022). Economy-environment-energy performance evaluation of CCHP microgrid system: A hybrid multi-criteria decision-making method. Energy, 240(4), 122830. [Google Scholar]
46. Stević, Ž., Pamučar, D., Puška, A., Chatterjee, P. (2020). Sustainable supplier selection in healthcare industries using a new MCDM method: Measurement of alternatives and ranking according to compromise solution (MARCOS). Computers & Industrial Engineering, 140(1–4), 106231. [Google Scholar]
47. Sałabun, W., Wątróbski, J., Shekhovtsov, A. (2020). Are MCDA methods benchmarkable? A comparative study of TOPSIS, VIKOR, COPRAS, and PROMETHEE II methods. Symmetry, 12(9), 1549. [Google Scholar]
48. Kizielewicz, B., Wątróbski, J., Sałabun, W. (2020). Identification of relevant criteria set in the MCDA process—Wind farm location case study. Energies, 13(24), 6548. [Google Scholar]
49. Liang, H. P., Tian, S. S., Li, Q. Y., Zhang, W. C. (2019). Main grid structure evaluation based on improved TOPSIS gray correlation projection method. Electric Power Automation Equipment, 39(4), 63–69. [Google Scholar]
50. Aytekin, A. (2021). Comparative analysis of the normalization techniques in the context of MCDM problems. Decision Making: Applications in Management and Engineering, 4(2), 1–25. [Google Scholar]
Appendix
Cite This Article
 Copyright © 2023 The Author(s). Published by Tech Science Press.
This work is licensed under a Creative Commons Attribution 4.0 International License , which permits unrestricted use, distribution, and reproduction in any medium, provided the original work is properly cited.
 Downloads
 Citation Tools