
 Submit a Paper
 Propose a Special lssue
 Open Access
ARTICLE

Modeling Energy Consumption in the Production Processes of Industrial Units Based on Load Response Programs in the Energy Market
School of Statistics and Big Data, Henan University of Economics and Law, Zhengzhou, 450046, China
* Corresponding Author: Baodong Li. Email:
(This article belongs to the Special Issue: Application of Artificial Intelligence for Energy and City Environmental Sustainability)
Energy Engineering 2023, 120(2), 461-481. https://doi.org/10.32604/ee.2022.021877
Received 10 February 2022; Accepted 02 June 2022; Issue published 28 November 2022
 View Full Text
 Download PDF
Abstract
The optimal operation of microgrids is of great significance for the sake of efficient and economical management of its energy resources. The microgrid energy management system should plan to operate the microgrid while simultaneously considering the electric and thermal load. The present study proposes energy management to minimize the costs of operating an industrial microgrid. In fact, planning for energy supply is among the critical issues that distribution companies deal with daily in the competitive environment. A distribution company usually meets customer (end customer) demands by purchasing energy from a wholesale market. Given the load curtailment, distribution companies have more choices and interactions in the market. Distribution companies face the two uncertainties of load changes and price fluctuations in their daily energy supply planning which could lead to the risk of loss resulting from the distribution company’s decision-making for daily energy supply planning. Thus, these companies face the challenge of maximizing profit in a risk-based environment. Therefore, the present study presents an optimal model of energy consumption in the production processes of aluminum and cement industrial units. The presented model was then used in planning the day-ahead energy of a microgrid containing these industrial units. Since the studied subject has many limitations, it would be difficult to solve it using mathematical methods. To resolve this issue then, the present study introduces a newly developed algorithm inspired by bee colonies. The proposed method seeks to significantly improve in the local and global search capabilities. In addition to confirming the validity of the proposed model, results indicate that the implementation of load-response programs and the cooperation of industrial units in the ancillary services and energy market can increase the profits of units and microgrids as well as correct the demand curve. According to the obtained results from the first and second test cases, the total profit of the aluminum unit was $188,103 and $237,805, respectively. Similarly, this profit for the cement industrial unit is $104,350 and $233,195.3, respectively. From the results, it can be observed that the final profit of the second unit has increased by 61%.Keywords
Various factors have led to the increase in installing distributed energy sources in power systems over the recent years. Among these factors, one can mention increased energy consumption, increased fossil fuel price, an acute rise in the costs of constricting new concentrated power plants, and environmental concerns and factors. The use of distributed energy sources can potentially reduce the need to develop of traditional systems [1]. Although controlling a large number of these sources would create a real challenge in safe and efficient grid operation, this challenge can be largely managed by the concept of microgrids. A microgrid is an integrated energy system made up of distributed production sources and numerous electric and thermal loads that can act in connection to the global network or as individual islands [2]. Demand response is another important concept in intelligent grids that can be used to ensure the balance between demand and supply. Moreover, demand response has a high potential to reduce the load peak, which can postpone the need for increasing production capacity and reduce the operation costs of the system and greenhouse gas emissions. Establishing microgrids can facilitate the implementation of efficient demand response [3]. The concept of microgrids cannot be implemented to a broad extent without establishing an energy management system to achieve a reliable and optimal control process. According to the latest studies, energy management in microgrids seeks to minimize operational costs such as fuel, maintenance, and purchasing energy from the main grid while improving the reliability and environmental features. Many studies are currently focused on issues such as microgrid operation, control, and design [4]. Meanwhile, microgrid energy management has also been investigated from various aspects in different studies. Some studies have sought to optimize microgrid operation by only focusing on production planning and with no regard for demand response. On the other hand, some other studies have examined microgrid operation not simply through production planning but also by using one type of response to manage microgrid operation. Some studies have formulated microgrid management and optimized operation in the form of an optimal load distribution [5]. Meanwhile, microgrid operation policies also vary in connection to the upstream grid. Some studies have examined microgrids connected to the main grid, and some have studied them in the island mode; others have investigated microgrid energy management in both modes. The application of the studied microgrid also varies among different studies, among which one can mention educational, domestic, and commercial microgrids. Still, few studies have investigated industrial microgrids and their energy management [6].
Industrial consumers often manage their electric demand by storing energy, transferring the load and cutting unnecessary loads such as lighting, air conditioning or temporary curtailment of one or several controllable procedures; however, some large-scale energy storage devices required in the industry are not economically convenient [7,8]. Thus, adopting demand response (DR) plans can be the best alternative for the higher productivity of industries. According to the United States Department of Energy, demand response is defined as the change in the common electric consumption by the end-users in response to the change in the electricity process or incentive payments [9].
In [10], the issue of coordinated production planning in distribution microgrids was addressed. In [11], a demand response model alongside production planning was employed. In the demand response model used in the study, some factories were willing to cut some of their load during specific hours of the day for a certain price. In [12], the energy consumption of an aluminum factory was modeled and optimized, and its profitability was tried to increase by participating in demand response and ancillary service plans. This study used the LPWA method to model the high-consumption procedures of an aluminum factory and considered the respective limitations. Moreover, the provision of automatic gain control (AGN) adjustment services in aluminum industries was investigated using this method [13]. Results of this study indicated increased provision of adjustment services, but the study did not investigate how the factory participated in other ancillary service programs. In [14], the production process of a cement factory was investigated under the TOU tariffs of the demand response programs. Results indicated how the demand of this factory was moved to improve the total demand peak of the grid, although a comprehensive model of this industry’s processes was not presented. In [15], an optimal energy management strategy was presented for the economic operation of industrial microgrids using renewable energy with high impact under both grid operation and grid-connected-to-grid operation modes. This approach was based on group particle swarm optimization, which was considered on a daily planning horizon with a one-time step the renewable energies generation and electric load demand. In [16], optimal microgrid energy management was introduced as an agenda for the field of energy, particularly industrial grids with, which must be managed through a comprehensive optimization strategy. In [17], a multi-purpose problem was presented in microgrid energy management. The strategies were specified to focus on industrial microgrids based on the electricity market framework and a local production approach for the environment and facilities. In [18], microgrids were mentioned as a promising technology that could increase reliability and improve consumer energy supply. Various microgrids, from prototypes and experimental projects to their comprehensive commercial and industrial expansion, were used in the model presented in this reference. In [19], the energy management program of an industrial microgrid was investigated under the day-ahead pricing (DAP) tariff. The plan was studied in both modes of the microgrid connected to and disconnected from the main grid. However, the type of the industries in the microgrid, the modeling of industrial processes, and the respective limitations were not considered.
A new approach for energy consumption has been presented in [20], based on the linear piece-wise approximation (LPWA) method which is considered in the day-ahead energy management schedule. In this paper, the microgrid, energy, ancillary services markets, and demand response (DR) are considered as well. A new model based on DR improvement for small users is presented in [21] to alleviate the voltage and congestion issues in the low voltage distribution grid. A new, improved approach for synthetic building energy is presented in [22], to maximize the economic profits in electricity markets. A new method for analyzing the meter profits and resiliency capability is presented in [23] through the effects of the facility’s electricity and thermal load trend, generators pricing model, DER configuration, storage capacity, and facility criticality. A multiscale simulation model is presented in [24] to operate and control the integrated energy systems (IESs) in the market by integrating the process- and grid-centric modeling paradigms. A new business approach for low carbon energy transition is presented in [25], by considering the private customers and capturing the market. A novel model for industrial metabolism from the generation concept is presented in [26] with the combination of the Multi-Criteria Decision Making (MCDM) approach for assisting companies in optimizing their creativecreation approach towards decreasing energy/material flows.
It can be observed that a few studies have investigated the economic benefits and contributions of building energy flexibilities with fast and slow response speeds to different flexibility services. Also, none of the valuable works mentioned above have presented a complete model for optimizing cement industry energy management to participate in demand response programs. Besides, the energy management optimization of each industrial unit has been considered completely separate from the other. In contrast, are situated in each other’s proximity, eventually forming an industrial microgrid. As a result, how these industries consume energy can influence the grid operation conditions in economic and security aspects. The present study first presented a complete model of aluminum and cement factories to draw itself closer to the real situations that are often experienced and to provide the highest productivity of response programs. Then, the presented model was used in a day-ahead microgrid energy management program encompassing these factories. This program sought to increase the operation of the studied industrial units in the demand management programs through participation in the energy and ancillary service markets. Therefore, the goals and innovations presented in this article are as follows:
- Modeling different industries by considering the constraints and restrictions related to them in the form of an industrial microgrid and participation in the energy market and ancillary services with load response programs.
- Assessing the effect of profit from the sale of a product of an industry and electricity market prices on the final profit of the industry using sensitivity analysis.
- Provide an improved optimization algorithm based on bee colony and local search operator.
The increasing growth in distributed production resources has given birth to the new concept of the microgrid. Numerous advantages of establishing microgrids are predicted to result in the expansion of these types of structures in various regions and districts, such as in industrial regions. Various research fields have been developed concerning microgrids; still, industrial microgrids have not received great enough attention. Given the importance of establishing microgrids in industrial regions from economic management and reliability perspectives, the present dissertation seeks to bring the distributed productions in an industrial microgrid together to minimize electric and thermal energy supply costs. In this regard, significant facts such as the presence of influential loads such as electric cars, the availability of renewable products such as solar cells that are spreading across industrial microgrids and uncertainties of demand and production have been accounted for in formulating how the products are brought into an orbit. The industrial units in the microgrid include the aluminum and cement industries. To investigate the participation of the industrial units in this microgrid in ancillary services and demand response programs, the processes and facilities of these industrial units are categorized into three groups. The energy demand of the processes in this group depends on adjustable operation conditions. These changes can be made in discrete or continuous intervals. The proposed modeling and implementation of the demand response in each industrial unit are presented below.
2.1.1 Modeling the Processes of the Aluminum Industrial Unit
If the aluminum production process is compared to the human body, the aluminum mold would definitely be its heart. The aluminum mold, alongside the press function (heat and pressure), constitute constitutes the raw materials (billet) for the production process. Should the aluminum mold lack the required and accurate design, the whole process will be rejected, and the output will fail to be acknowledged as an approved product. Mold production-both in terms of design and dimension accuracy- plays a determining part in the quality of the aluminum profile and reducing the final profile costs. The mold must be compatible with the hydraulic press’s aluminum parts production power. On the other hand, the models must be carefully designed and built-in terms of the design of raw materials and steel alloys. Since the steep increase in the prices of the steel used to manufacture molds and the high prices of molding equipment, mold manufacturing is done at an extremely high cost. Thus, the design of the aluminum mold must be completely compatible with the technical features of the parts. The current aluminum production units often incorporate a separate division for mold manufacturing. The aluminum smelting process (i.e., the electrolyte process) uses alumina, which can be turned into aluminum, and is used as the raw material for various industries ranging from machine manufacturing to canning. This process is performed in cell containers using a DC voltage. Besides, some substances other than the main alumina are added to the container to increase the chemical reaction speed. The cells are connected in a series to form a melting line; each can be made up of hundreds of cells. The total power consumption of each melting line can be around hundreds of megawatts. There are usually several melting lines in an aluminum factory. Similar to [27], the present study considered a rectifier for melting control, so the process was among the controllable. The equations and relationships derived from [20] to model the aluminum industrial unit are mentioned below. Eq. (1) demonstrates thealuminum factory’s power consumption of each melting. Index l demonstrates the number of melting lines in the factory,
For the sake of simplification,
The presentable rotating storage depends on the ability of the melting line to reduce its energy consumption. Thus, the amount of marketable rotating storage is modeled per Eq. (5). Still, the economic issues regarding these services’ connection to the grid have not been considered following the insignificant probability of rotating storage connected to the grid. The aforementioned requires investigation over longer periods.
Eq. (6) demonstrates how the profit from participation in energy markets is calculated.
Eq. (9) models the profit from the sales of aluminum products using the LPWA method.
The profit from the sales of products in each energy division is assumed to be a constant amount represented by
Besides, it is assumed that the factory is capable of storage, so it has the required flexibility during operation which is proportionate to the amount of production per day and is specified by Eq. (11).
2.1.2 Modeling the Processes of the Cement Industrial Unit
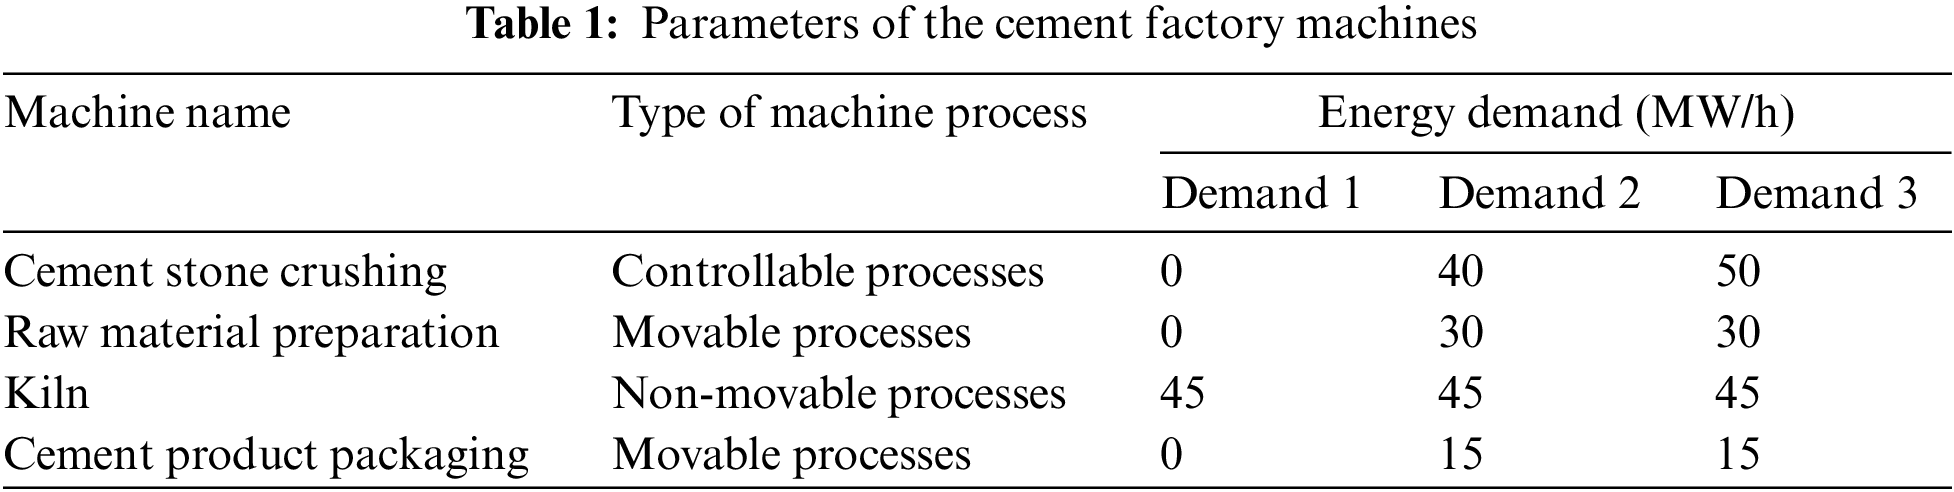
Cement is a mineral hydraulic adhesive that hardens in contact with water. Over 990 years have passed since the beginning of mass cement consumption, which is now considered one of the most important construction materials to much of humanity and civilization. The most important step in the process of cement production is the step of baking the materials, which is a rotating horizontal kiln. The cement kiln is among the largest chemical reactors, in which the raw materials for cement are turned into clinker through chemical reactions. Production of high-quality clinker depends on the input feed parameters and the kiln’s operational conditions such as rotation velocity, kiln fan speed, and fuel consumption. The concern of the quality control experts and operators in many cement factories is to achieve ISO standards by changing the input parameters. The process of cement production has been divided into four essential steps with high energy consumption, including 1. crushing cement stone, 2. preparing raw materials, 3. Kiln, and 4. packaging cement products the present study. The other parts of this industry that are low in energy consumption are thus overlooked in the modeling and the sufficient capacity to store the products is assumed to be available. Eqs. (12) and (13) indicate the power consumption of the factory per hour. The I index stands for the number of processes in the program, while j stands for the number of operation modes in each factory process. As demonstrated in Table 1, j equals 1 in non-movable programs, 2 in movable programs and 3 in controllable programs.
As Eq. (14) shows, the binary variable of
Eq. (15) indicates the maximum and minimum limits of production per day by the cement industrial unit [26].
Eq. (20) indicates the profit from the cement production unit.
3 Mathematical Formulation of the Proposed Model
In this section, the proposed optimization model is introduced using the microgrid component models, presented in the previous section, and the current power between different generators and energy storage and loads. For this introduction, their objective functions must first be defined.
The objective function of the two-stage random problem is modeled as linear programming mixed with an integer to reduce the expected cost of operating the microgrid in the 24 h of the next day. In this issue, the decisions of the first stage are related to the amount of power purchased from the leading day electricity market. They include the participation of energy production units in the planning hours. In the second stage, the costs of the system under consideration that occur in the real situation in each scenario, including the amount of power resource distribution and responsive loads and the definite amount of involuntary load, are considered.
The target function of optimal planning is maximizing the profit from the factories in this microgrid, which is made up of the profit gained from participation in electricity markets through demand response programs (R) and the profit from selling the products (Pr) according to Eq. (21) [9].
Values of
3.2 Microgrid Operation Restrictions
To increase reliability and grid participation in demand response programs, the microgrid is connected to the upstream grid to exchange power if necessary. Eqs. (24) and (25) indicate the restrictions on microgrid active and reactive balance. In these equations,
Eqs. (26) and (27) models the restrictions of the voltage and power of each microgrid bus.
The equations required for demand distribution calculations are imperative for calculating the number of current losses in the industrial microgrid line and the marketable power from each point of connection to the grid.
4 The Developed Bee Colony Algorithm
The behavior of bees in nature generally inspires non-pheromone-based algorithms. In this method, each of the bees tries to get the best result based on the rules of probability through direct cooperation and sharing the information. Each natural colony consists of the three parts of food resourcess: worker bees, and non-worker bees. Worker bees carry out most of the tasks, including bringing up the babies, taking care of the queen and male bees, cleaning the beehive, regulating temperature, collecting nectar, pollination, etc. Non-worker bees are divided into two groups of scout and spectator bees. Scout bees search the environment for new food resources, and spectator bees wait in the beehive for the worker bees to give them information. Honey bees use a complex system for finding information regarding the place and quality of food resources outside the hive. The communication between the bees is made through a ritual referred to as dancing. This communication language is based on a series of movements made by the bee. This dance a waggle dance- contains information on the location and quality of food resources. The number of waggles in this dance indicates the distance and the duration of the waggling indicates the quality of the food source. The spectating bees thus choose the high-quality resources based on the waggles. The artificial bee colony (ABC) algorithm is based on bee waggling and the movement of the spectating bee towards high-quality resources [28,29]. At first, a set of random food sources (initial answers) is selected. Then, the worker bees refer to the resources, study their nectar and quality, and provide the spectating bees with their information. Each bee then moves towards the location and acquires a resource in its proximity, which means the bee decides whether to stay in the new place or go back to the previous one based on the type of the flower and its amount of nectar. When the resource is used up, the bees move towards the new source found by the scout bees, and the process repeats until the needs are met (13). The following steps demonstrate how the algorithm is coded:
1. Initial value assignment to the initial answers of Xij
2. Calculation of the initial answers in the target function
3. Initial iteration, cycle = 1
4. Provision of the new answers based on finding the new Vij resource in the proximity of Xij to produce new answers using the following equation [29]:
In this formula, the k answers obtained are in the proximity of i and ɸ is a random number between −1 and 1.
5. Selecting the best resource or the best answer between Vij and Xij
6. Calculating the probability for Xij answers based on the following formula [28]:
In fact, the following formula is used to determine the validity of the answers [29]:
Answers for
7. Producing new Vi answers (new resources) based on spectating bees out of Xi answers and determining their probability of
8. Selecting the best answer (the bee having eaten the most) between the answers of Vij and Xij
9. Determining the spoiled sources and replacing them with the random resources created by Xi scout bees using the following formula:
10. Recording the best answer (the high-quality food source) obtained so far
11. Cycle = cycle + 1
Repeating all the previous steps to satisfy the condition to end the program.
Powell first introduced the Powell method in 1964 as an indirect search method (30). This method uses the initial random position to search for the intense value in both positive and negative dimensions. This method is among the most effective strategies for finding the minimum value of the function in direct search algorithms since it uses only performance information without derivative calculation. Fig. 1 demonstrates the steps of the Powell search.

Figure 1: Powell model to reinforce the algorithm search structure
Compared to other methods, the proposed method has the following key advantages:
- Its simplicity and proper structure with minimal control parameters make it easy to program any optimization problem.
- Ability to upgrade local search with other mathematical methods improves its performance to escape from local points.
- Existence of probabilistic function and elitism and promotion of new generations will find the best answer in the path of optimization.
- Do not use derivation to avoid complex mathematics such as gradients.
5 Simulation and Numerical Results
The present study integrated the performance of the demand response server and the microgrid operator and presented them in the form of a microgrid energy management system. Aside from demand response aggregation, the microgrid energy management system undertook its implementation and distribution. Thus, it tried to minimize the microgrid operation costs by using its full potential, including demand and production units. Considering that the studied microgrid is industrial and almost, all its consumers are manufacturing companies, a microgrid with the structure demonstrated in Fig. 2 is chosen to evaluate the model and demand response programs proposed in the study. This microgrid is inspired by the IEEE standard 9-bus test network at the 132 kv voltage level and is connected to the upstream network through three GPS busbars.
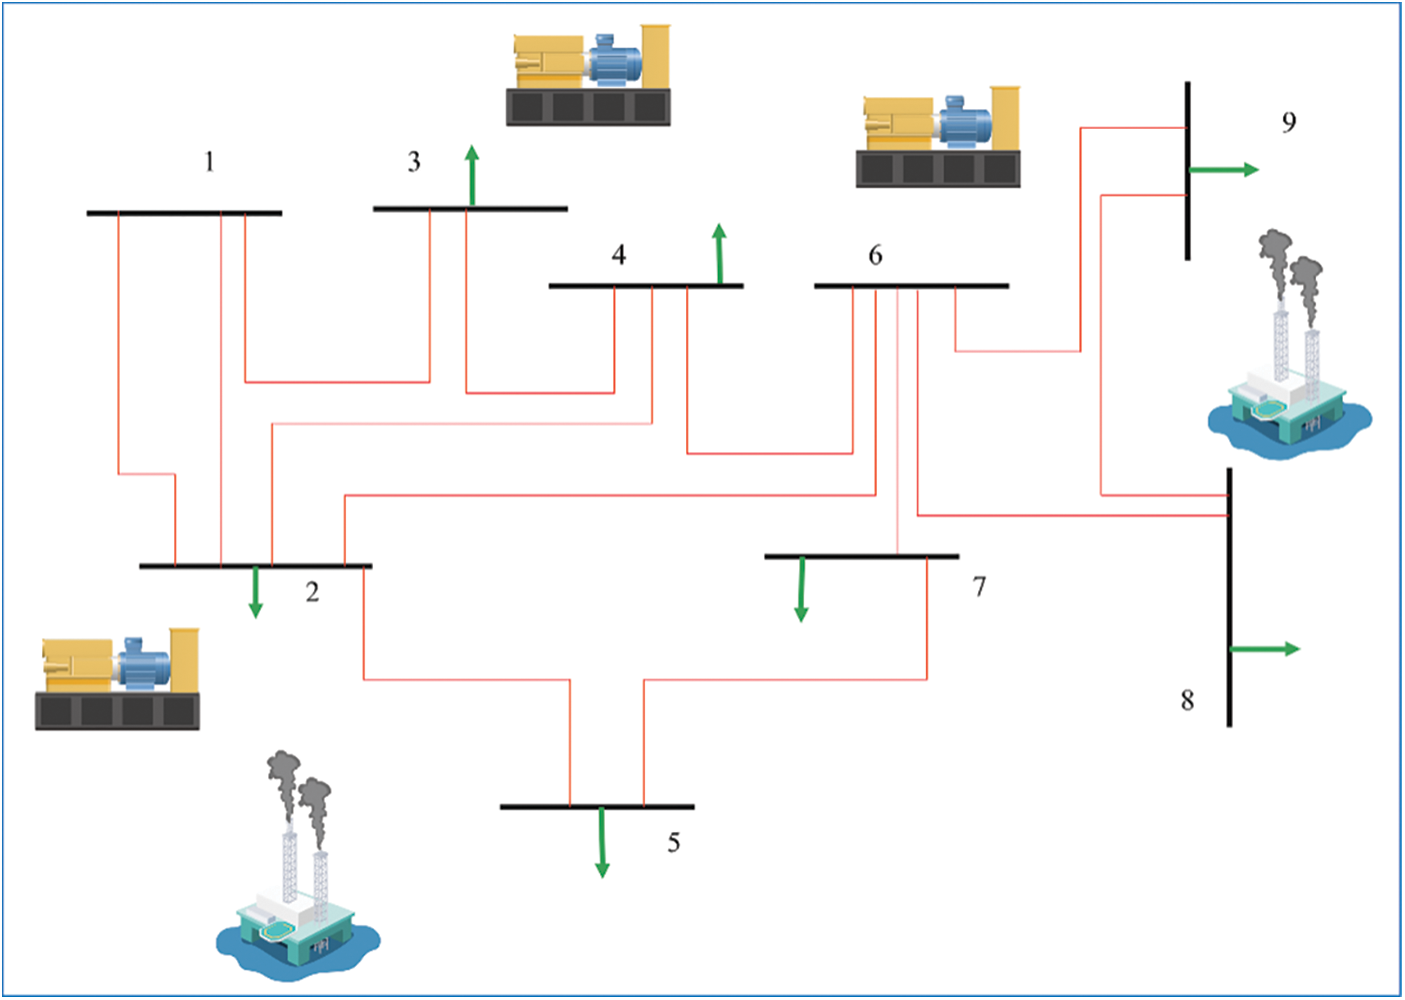
Figure 2: Scheme of the studied microgrid
The present study has considered the energy purchase price of the market regardless of the microgrid’s costs of purchasing energy from the market. Besides, the microgrid’s costs of purchasing energy from the market are applied to the net profit from each industrial unit’s sales, so that the net profit of the industrial units indicated in Tables 2 and 3 is equal to the difference between the profit from these industrial units’ sales and the costs of purchasing electric power from the grid. The real data on purchasing market electric power from the microgrid is considered, as shown in Fig. 3 in the present study.
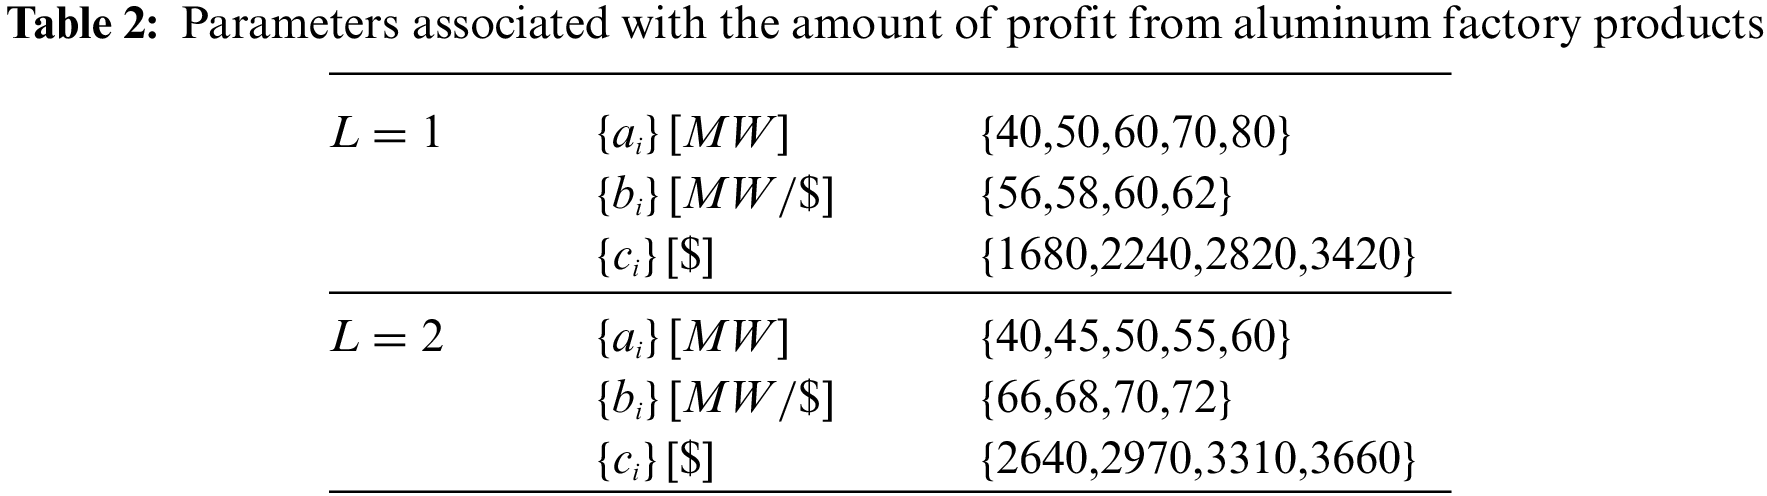
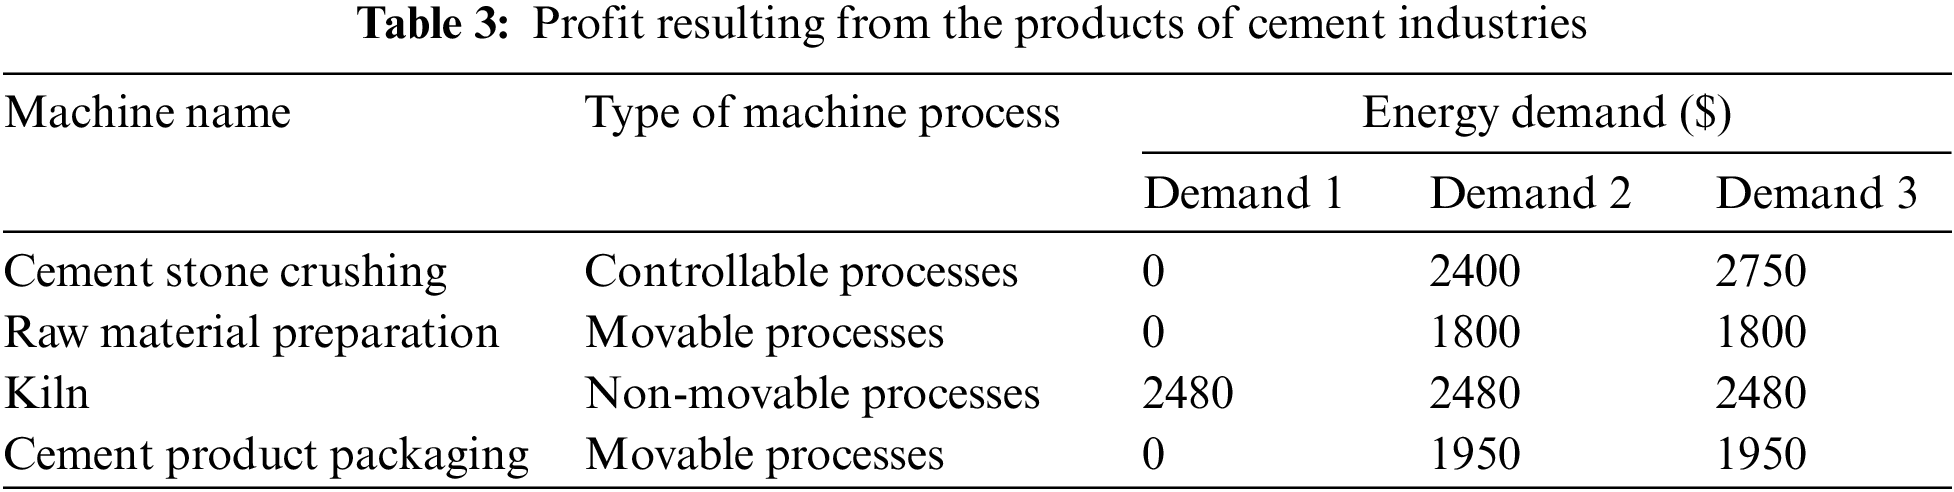
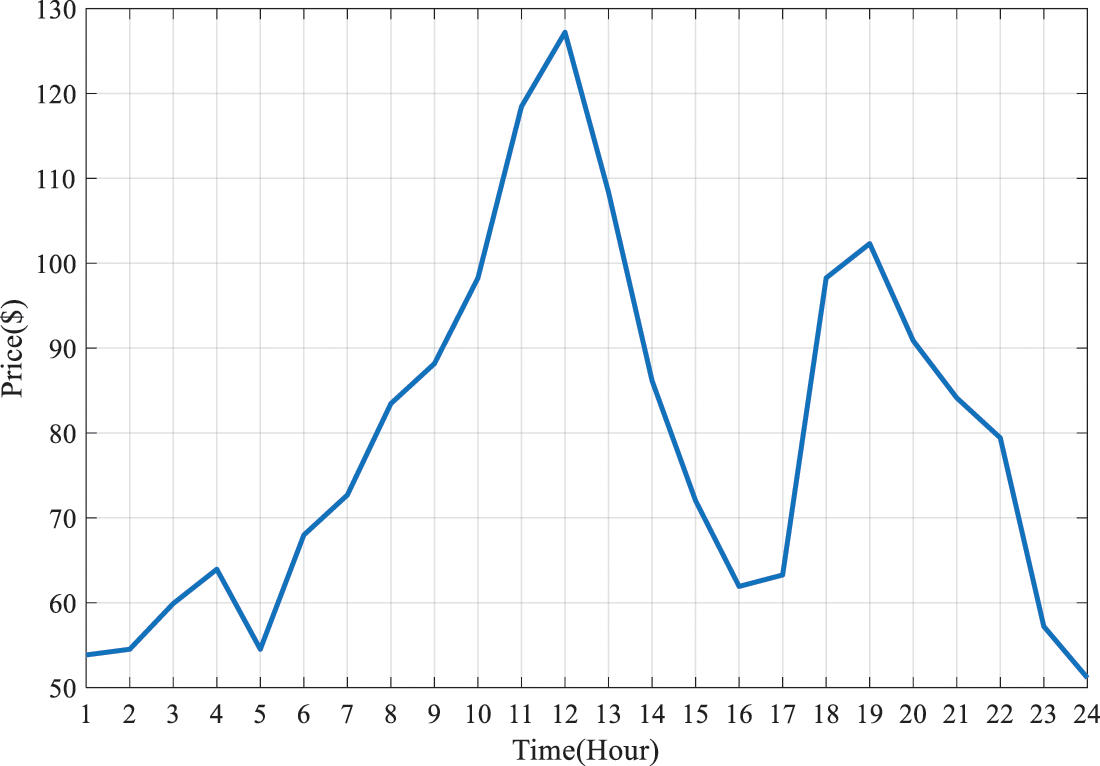
Figure 3: Grid’s price of purchasing energy from the industrial units
It must be mentioned that the presented prices are not inconsistent with the electricity market prices in other countries. The optimization program is used under the day-ahead pricing tariff and in 60-min intervals. The costs of rotating reservations are considered 0.3 of the price of purchasing energy from the industrial units, while the costs of incentive and punishment plans are considered to be 0.1 of the price of buying energy from the industrial units per hour.
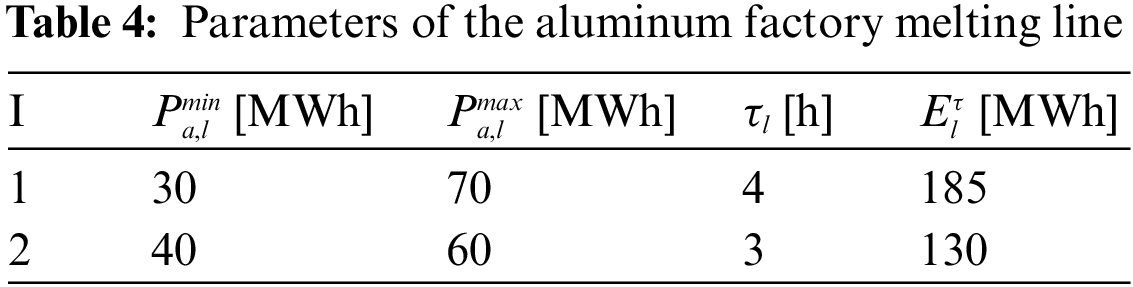
Fig. 4 demonstrates the amount of the other industrial consumers’ consumption in the microgrid. Besides, the input data of the aluminum and cement factories are estimated in Tables 1 through 4, given each factory’s processes and consumption levels. The aluminum industrial unit examined in the present study had two separate melting lines, the technical and economic data, which were derived from (31) and mentioned in Tables 4 and 2. Besides, several small non-controllable loads were considered in the microgrid to bring the model closer to the real conditions.
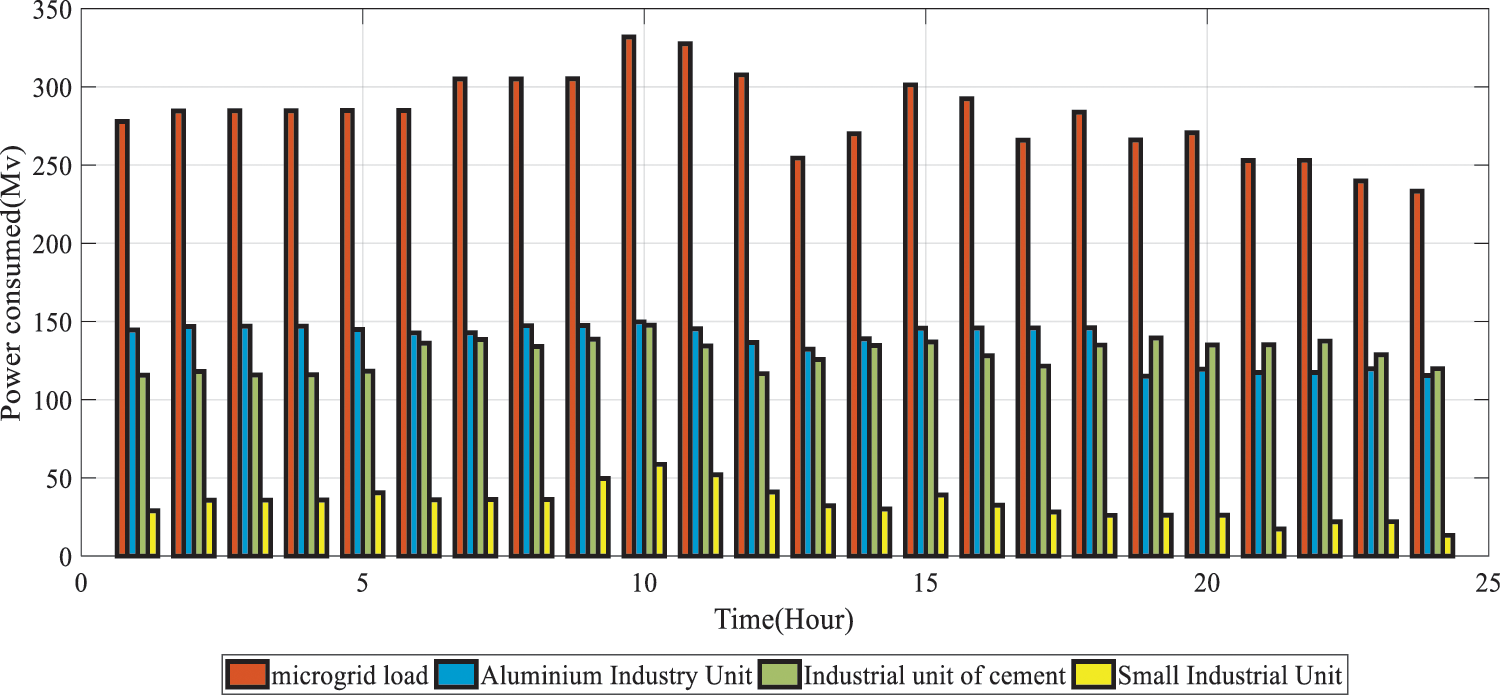
Figure 4: Load profile of the microgrid and the industrial units in it in case study 1
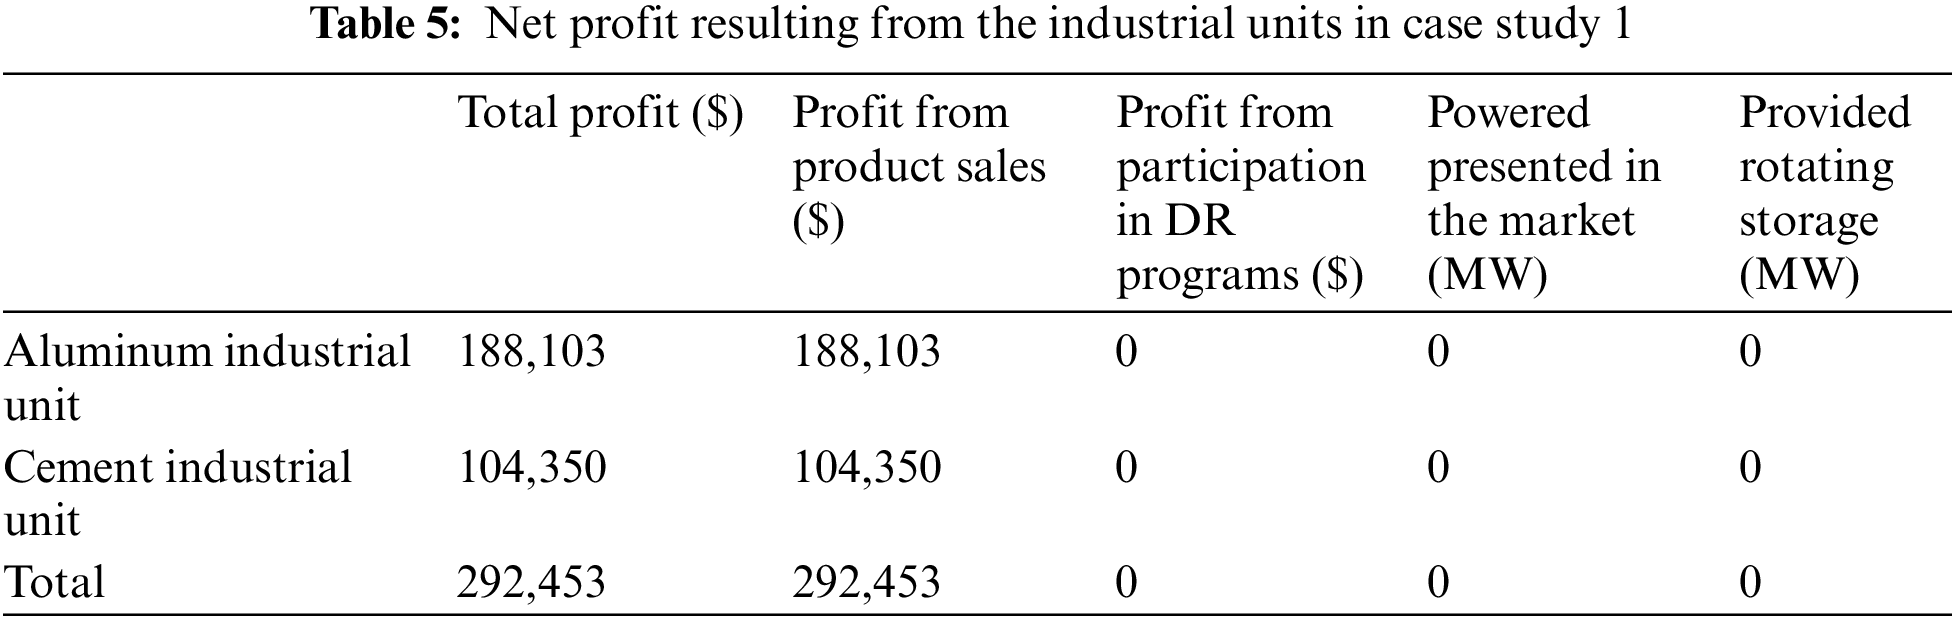
In case study 1, the energy consumption of the microgrid and its industrial units are studied. The demand response programs are not considered in this case study. Fig. 4 demonstrates the energy consumption of aluminum and cement industrial units, small industrial loads, and total microgrid load. As shown, industrial units set their goal on maximum production for greater financial profits given the lack of demand response programs and power consumption restrictions, which puts their power consumption level at its maximum. As Table 5 indicates, the net profit of the aluminum and cement industrial units is estimated at $188,103 and $104,350, respectively. Table 3 indicates that the resulting profit is merely from the sales of the products manufactured by the industrial units. The profit from demand response programs plays no part in it.
In the second study, the microgrid’s participation in demand response programs was investigated aiming to reduce the peak consumption of the microgrid and increase the profitability of its industrial units. Fig. 5 demonstrates the energy consumption of the microgrid and the industrial units. It can be observed that the total load consumption of the microgrid and industrial units declined.
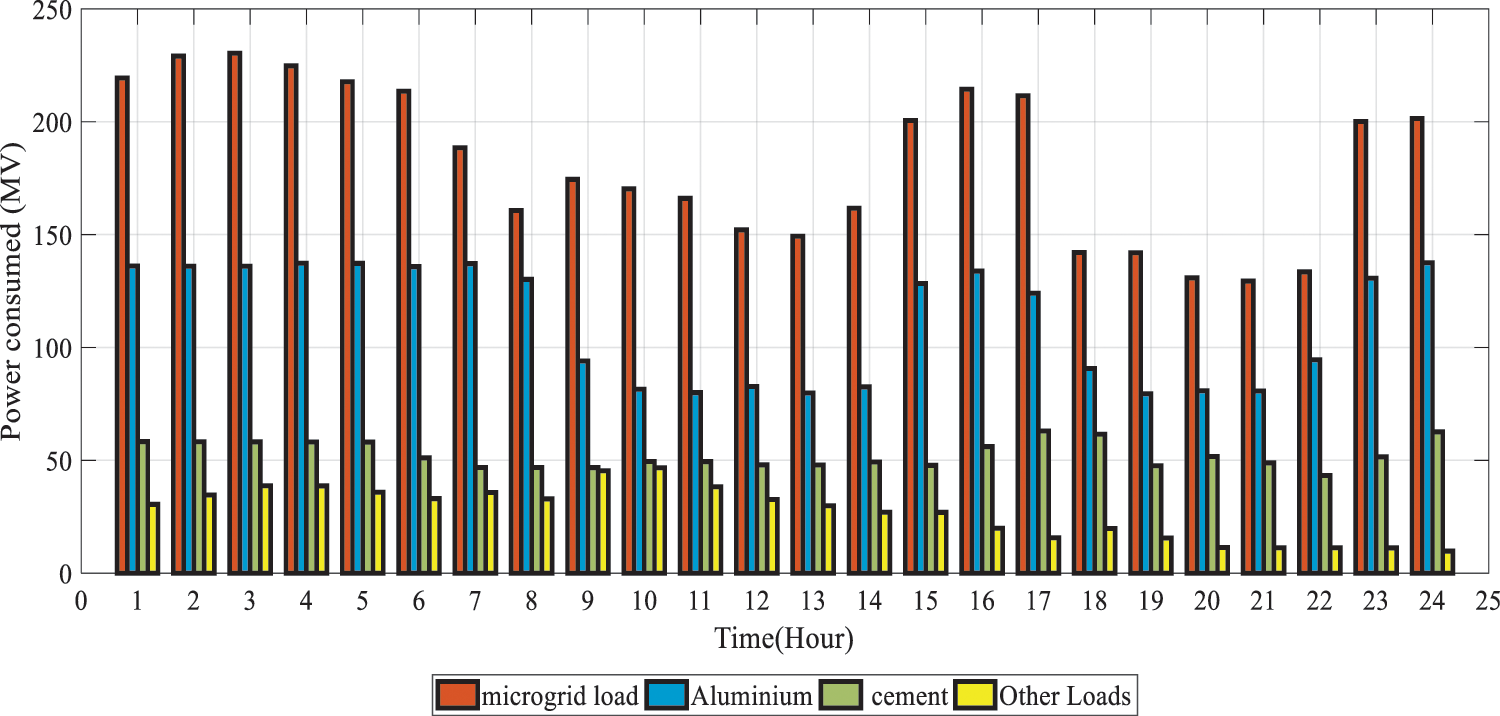
Figure 5: Load profile of the microgrid and the industrial units in it in case study 2
Besides, Table 6 indicates that the net profit resulting from the industrial units increased compared to the first case study, the amount of which is estimated at $237,805 and $233,195.3 for aluminum and cement factories, respectively. As indicated in Table 6, the profit is obtained from the two sectors of participation in demand response programs and product sales, unlike in case study 1. As can be seen, both industrial units reduced their production to increase their profit through participation in demand response programs. However, the cement industrial unit gained the majority of its profit increase through participation in demand response programs. In contrast, the aluminum industrial unit reduced its production by a smaller amount and tried to increase its interest by providing rotating storage. Therefore, the industrial units increased their profits although their energy consumption and the grid’s energy consumption were declined. Besides, Table 6 demonstrates that 1MW declined the consumption peak of the microgrid. Fig. 5 specifies the optimal power consumption of the industrial units in the microgrid in the second case study. Also, the compared consumed load in case studies 1 and 2 are presented in Fig. 6.
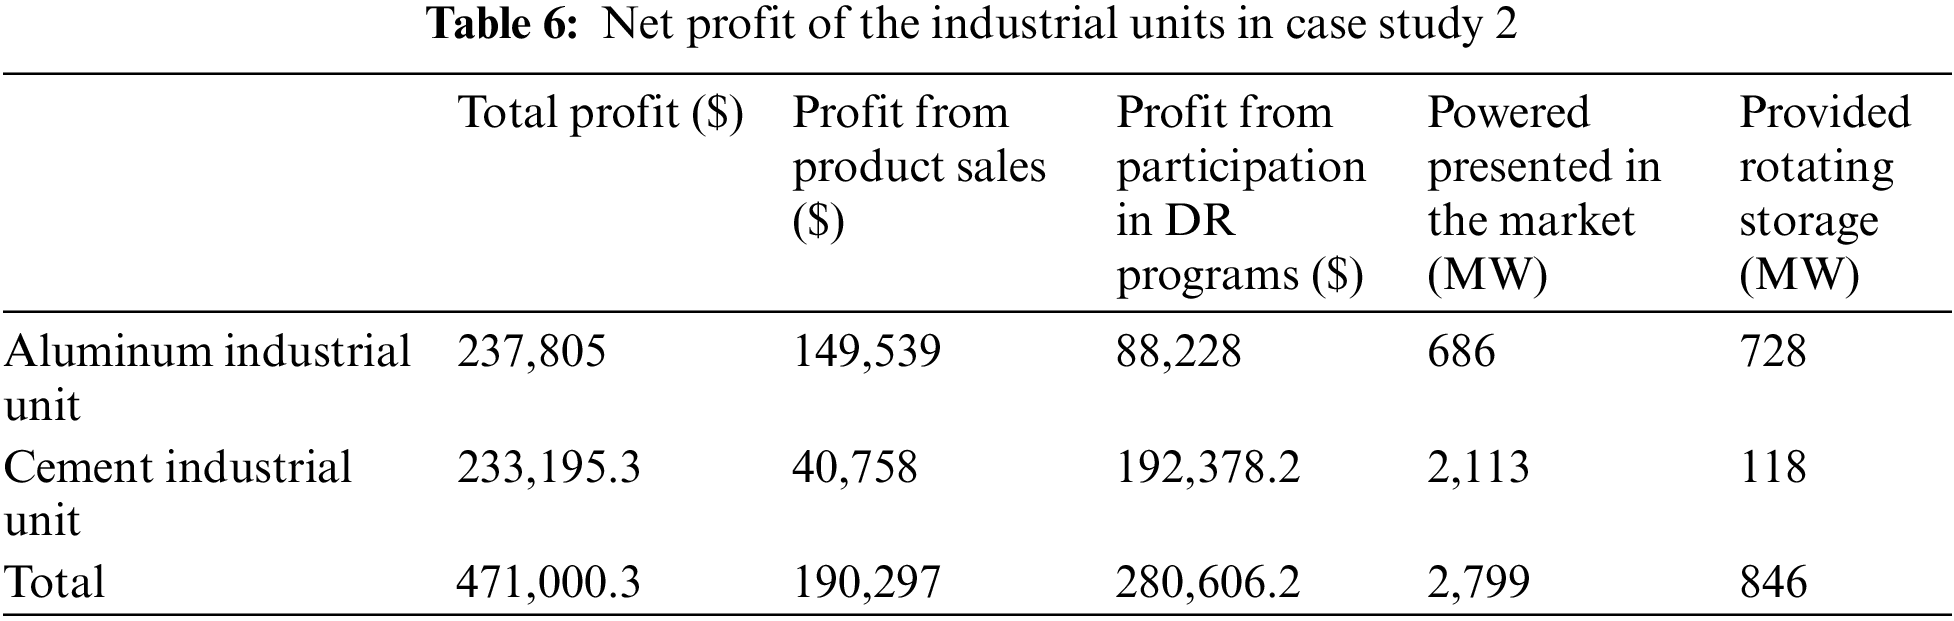
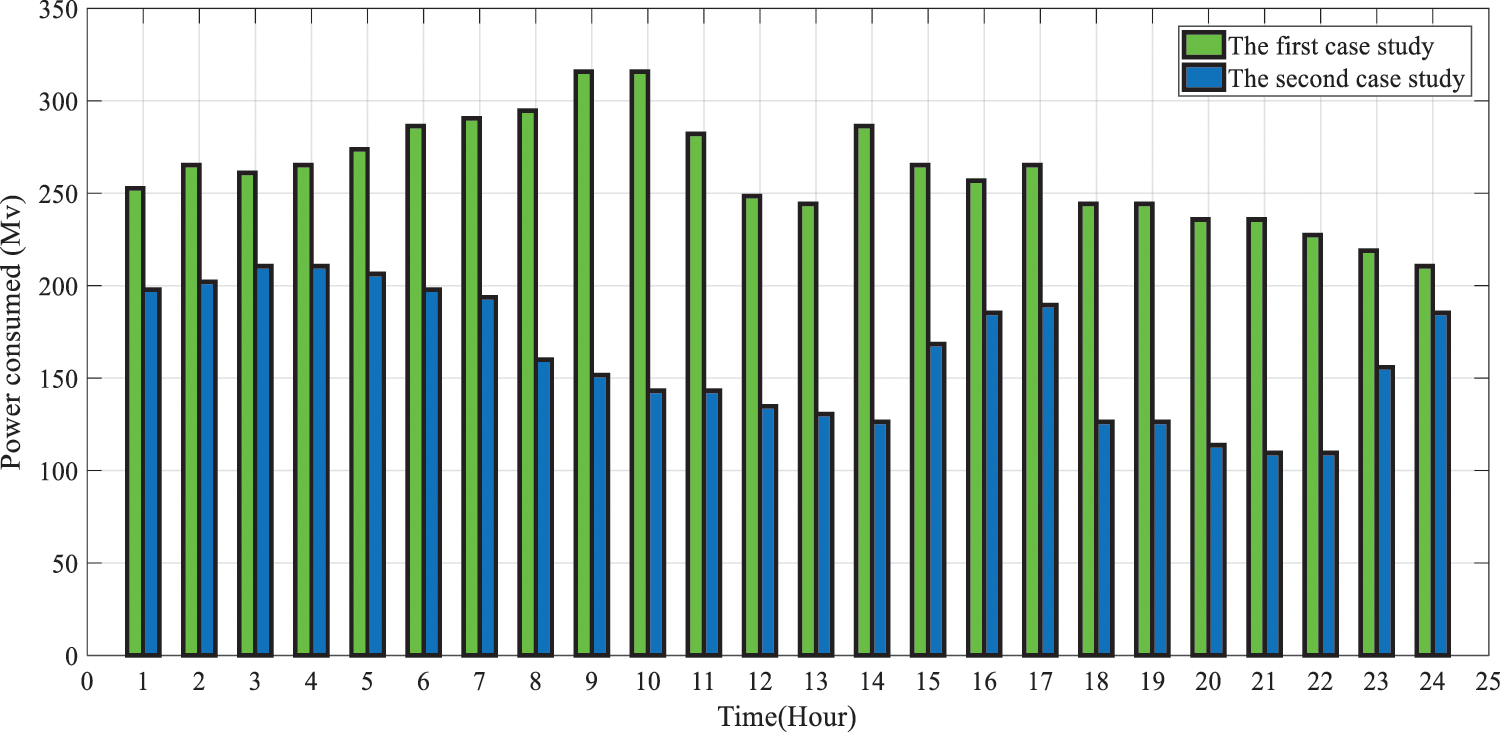
Figure 6: Comparing the consumed load in case studies 1 and 2
Figs. 7 and 8 investigate the technical and economic indices of the industrial units in the microgrids under the two mentioned case studies, respectively. As observed, total microgrid load, microgrid consumption, and peak consumption of its industrial units were declined. Moreover, the profit of the industrial units and total profit of the units increased in the second case study, while the changes were more significant in the cement industrial unit, indicating that this factory was more flexible.
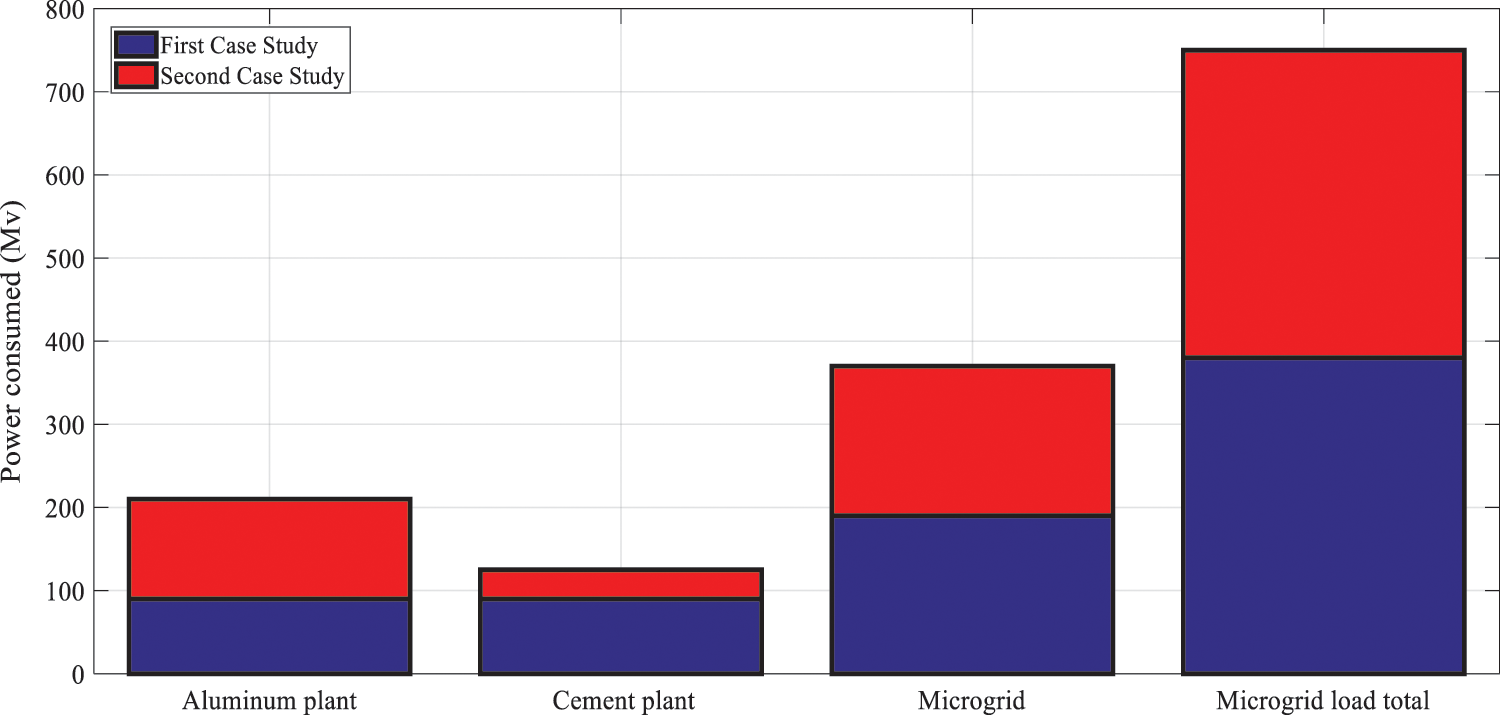
Figure 7: Studying the technical indices in case studies 1 and 2
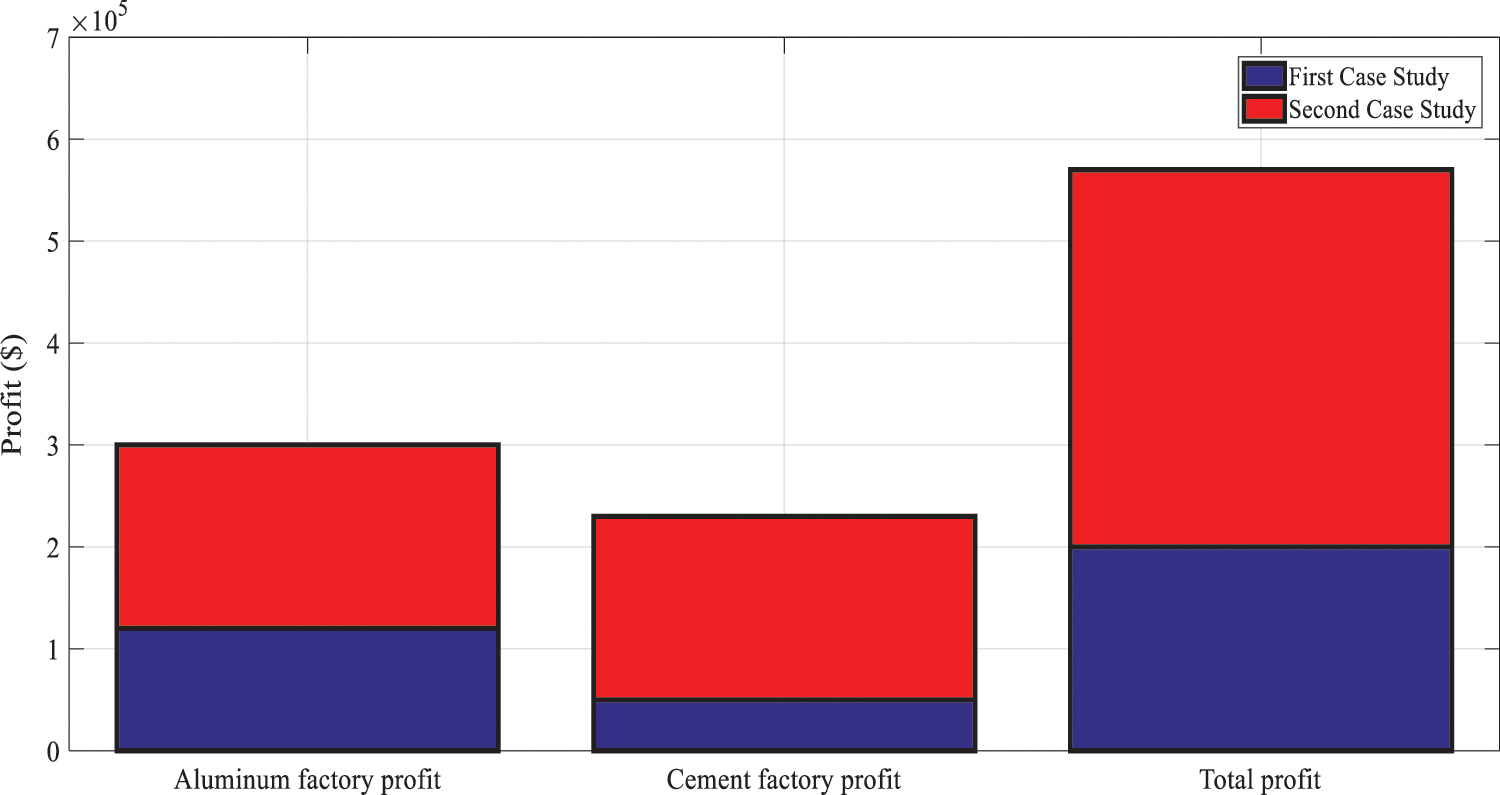
Figure 8: Studying the economic indices in case studies 1 and 2
This section presents a sensitivity analysis of the study outputs to the market prices given the price fluctuations in various countries. The sensitivity of the net profit of the industrial units in the microgrid compared to the parameters of grid energy purchase price from the industrial units and the profit resulting from the product sales were examined in both case studies. Fig. 9 demonstrates the microgrid profit sensitivity to the changes in grid energy purchase price from the industrial units ranging from −40% to 40%. It can be observed from Fig. 9 that the lack of the industrial unit’s participation in demand response programs led the microgrid profit sensitivity to be insensitive to the changes in grid energy purchase price from the industrial units. However, the microgrid profit maintained its ascending or descending trend in proportion to the increase or decrease in the grid energy purchase price from the industrial units in the second case study.
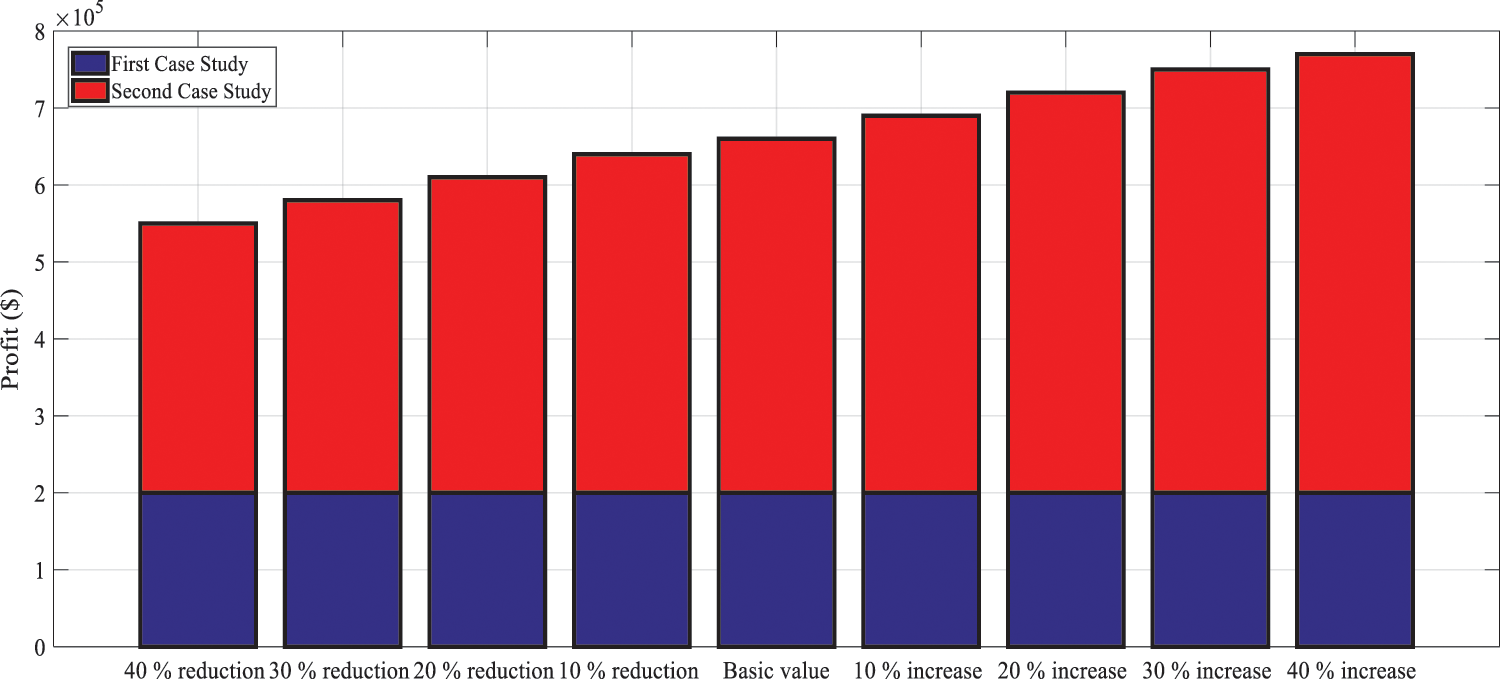
Figure 9: Sensitivity analysis of the microgrid profit to the changes in grid energy purchase price from the industrial units
Fig. 10 examines the microgrid profit sensitivity to the changes in grid energy purchase price from the industrial units ranging from −40% to 40%. It can be observed that case study 1 was more sensitive to the changes in profits resulting from product sales; the, reason for each could be the direct dependence of the first case study on product sales. Meanwhile, the microgrid profits in case study 2 depended on both the profit from product sales and the grid energy purchase price from the industrial units.
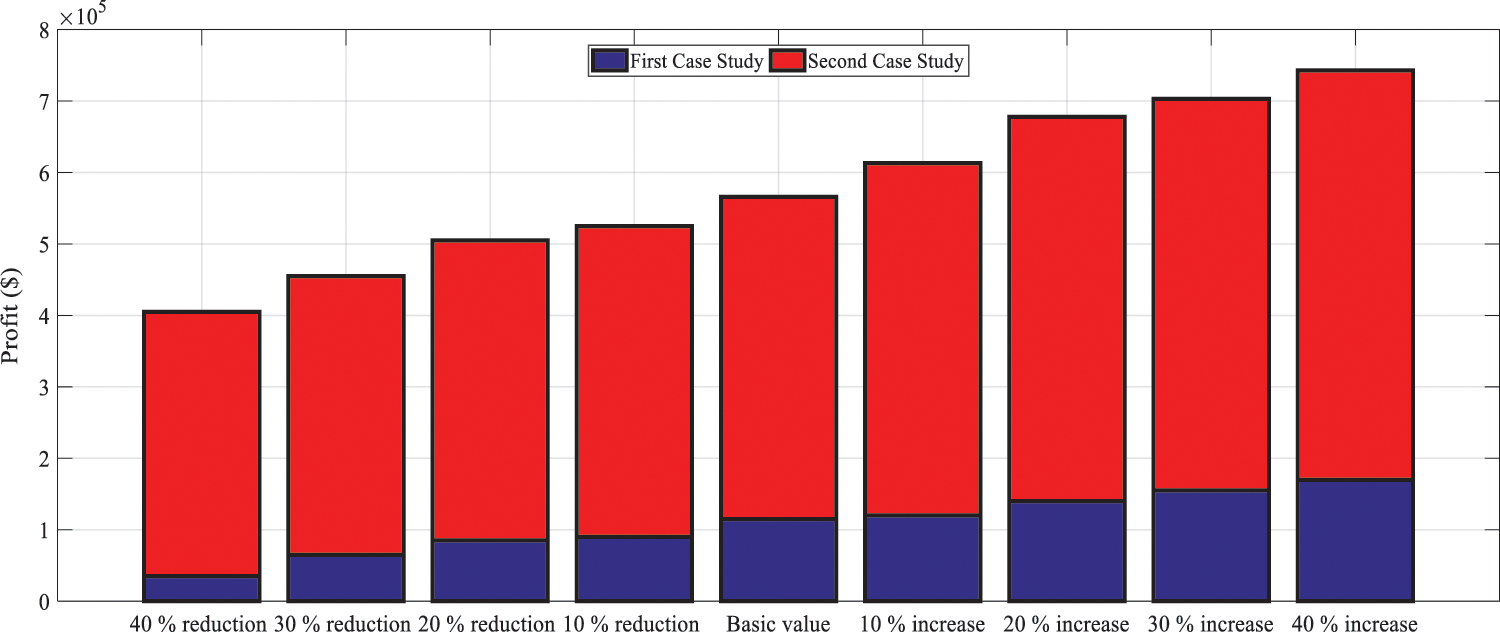
Figure 10: Sensitivity analysis of the microgrid profit to the changes in industrial units’ product sales
Fig. 11 investigates the sensitivity of the microgrid profit to the changes in industrial units’ product sales. It can be observed that the aluminum industrial unit was more sensitive to the changes in both case studies. As mentioned earlier, maintaining industrial unit showed less flexibility in manufacturing its products and tried to maintain its interests by providing rotating storage. Thus, it indicated higher sensitivity than the cement industrial unit since it had a higher production level. The profit of the industrial units in both case studies was proportionate to the changes in the profit resulting from grid energy purchase price from the industrial units. The net profit from the aluminum industrial unit was always higher than the cement industrial unit in case study 1, although the same trend was not observed in case study 2. It was observed that the profit from the cement industrial unit was higher than the aluminum unit. Still, the profitability of the aluminum unit increased with a greater gradient with the increase in the product sales profits. It exceeded the cement unit’s profit at high product sales prices.
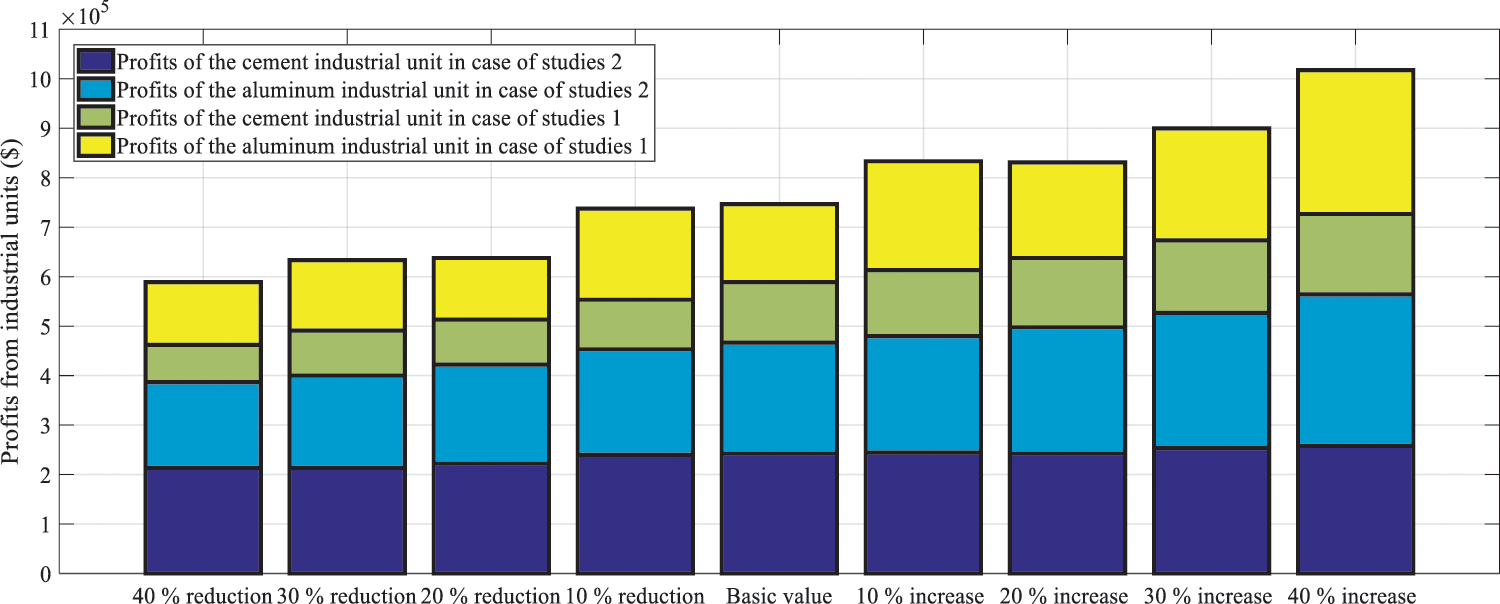
Figure 11: Sensitivity analysis of the industrial units’ profit to the change in the profit resulting from product sales
5.4 Analysis of the Proposed Algorithm
In this section, the proposed optimization algorithm is compared with other models. For this purpose, Rastrigin benchmark functions have been considered to testing the optimization methods. As presented in Table 7, the obtained numerical analysis proves the validity of the proposed method with ten variables compared with honey bee mating optimization, artificial bee colony, and particle swarm optimization. According to this table, it should be claimed that the proposed algorithm could provide better results than other algorithms. The mathematical relationship of this benchmark is presented in (32) as:
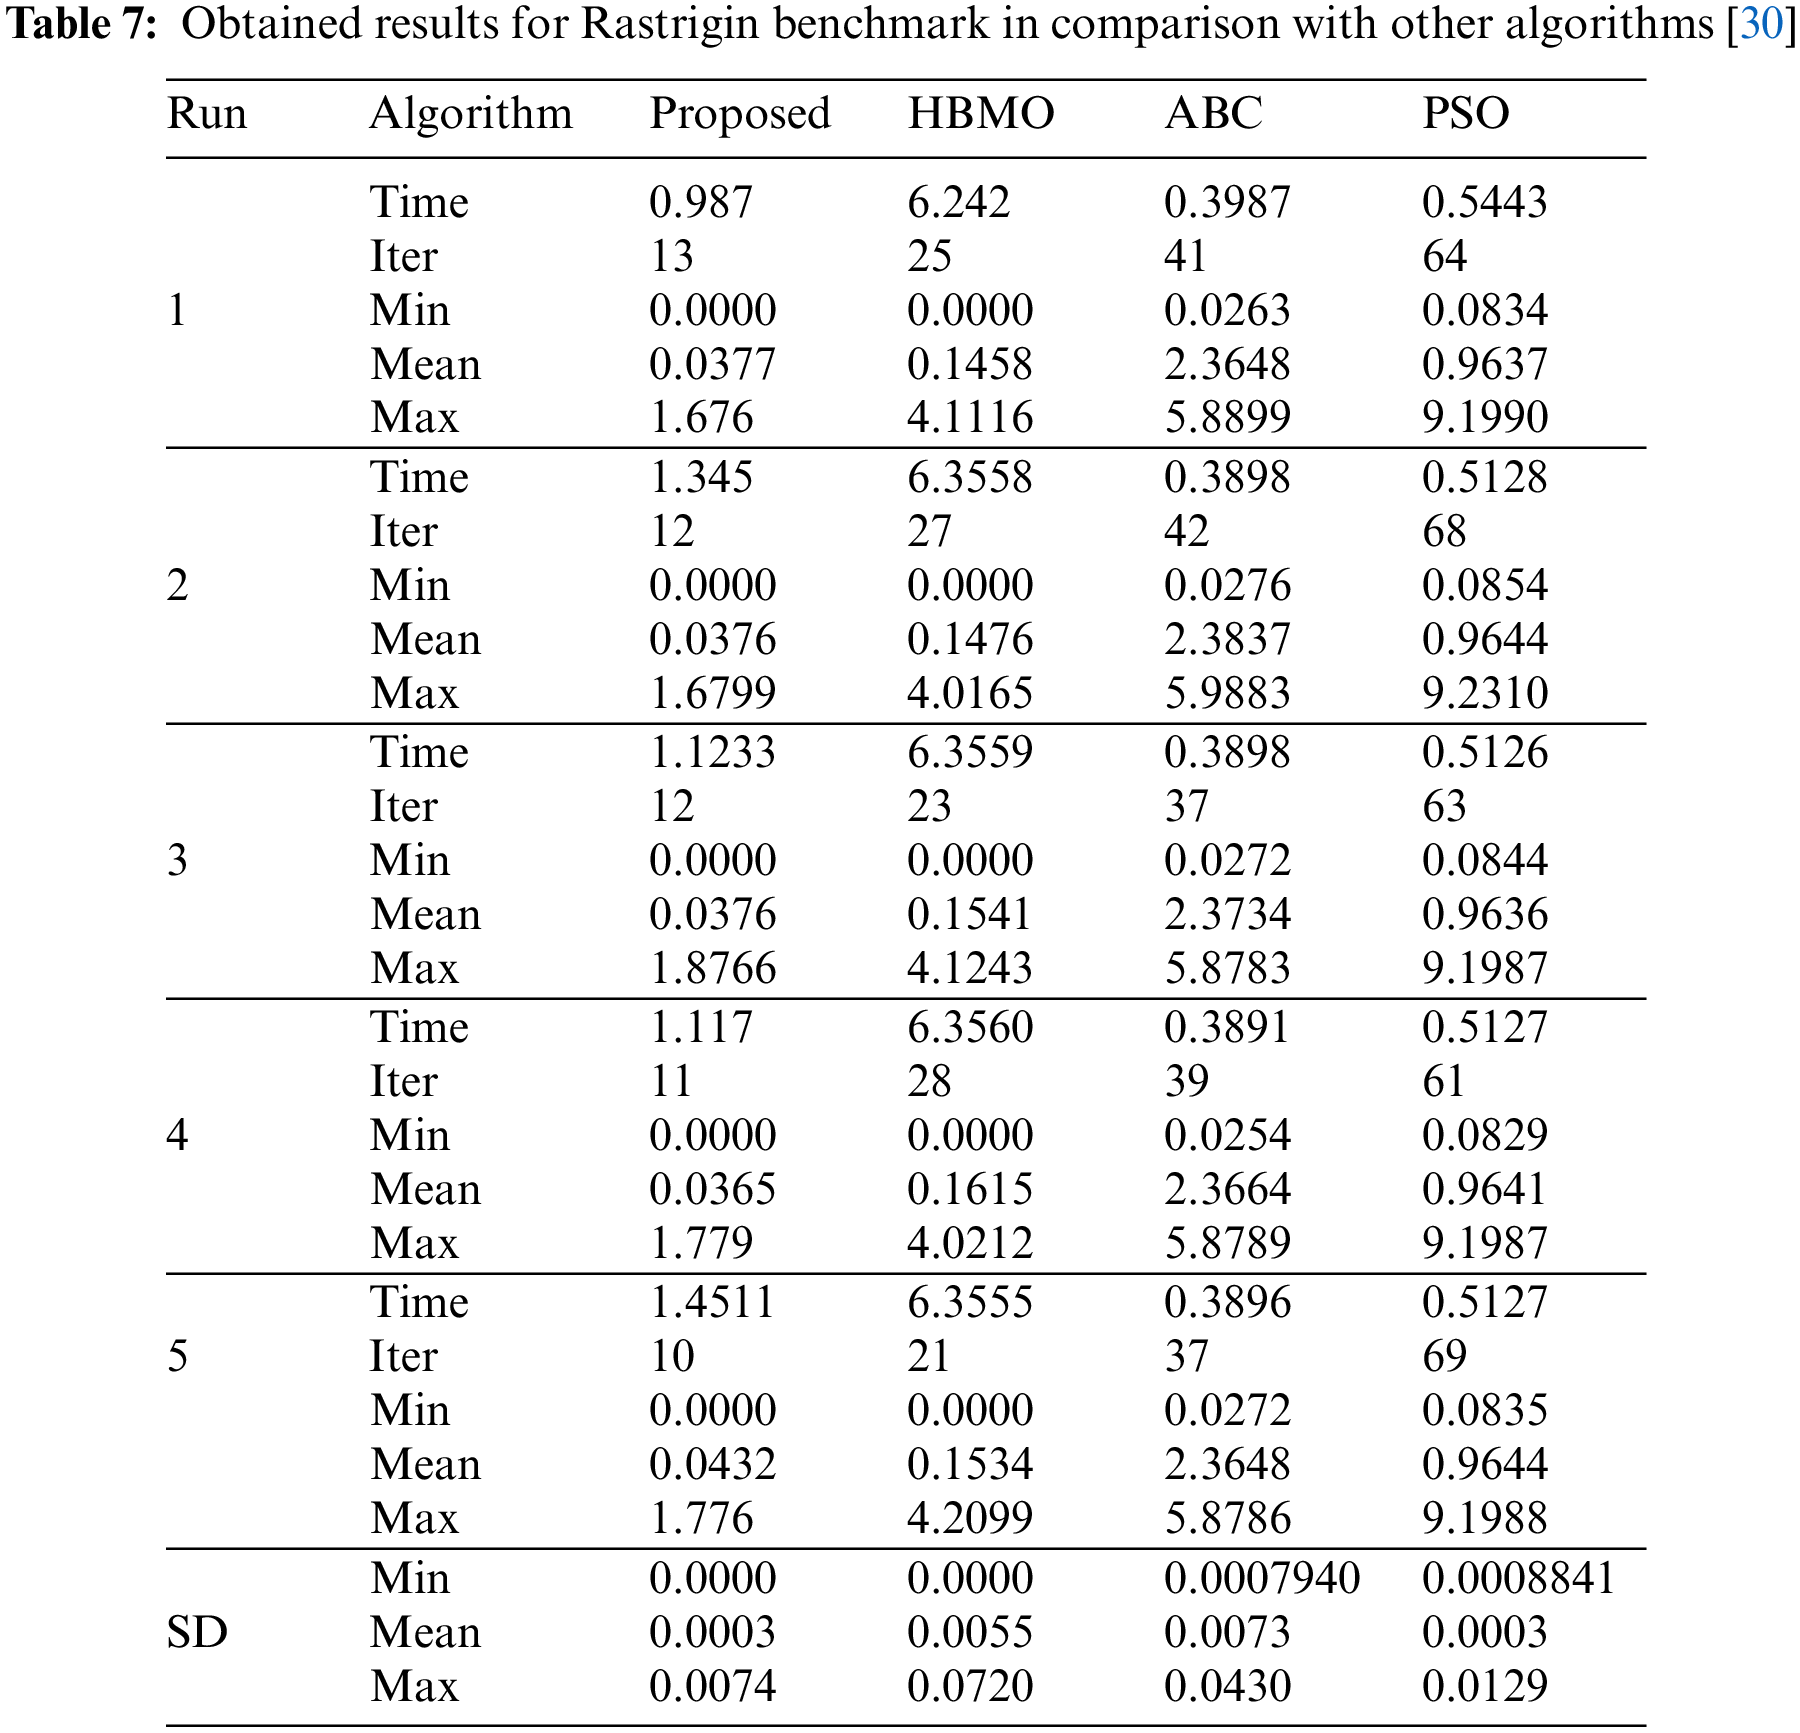
All the mentioned factors in Table 7, i.e., Run Time (RT), Standard Deviation (SD), iteration, minimum, mean, and maximum values, are presented for all compared methods. At the same time, the suggested algorithm could outperform all methods in all factors.
Demand response is among the concepts in intelligent grids that can be used to ensure the balance between demand and supply. Moreover, demand response has a high potential to reduce the load peak, which can postpone the need for increasing production capacity and reduce the operation costs of the system and greenhouse gas emissions. Establishing microgrids can facilitate the implementation of efficient demand response. The concept of microgrids cannot be implemented to a broad extent without establishing an energy management system to achieve a reliable and optimal control process. According to the latest studies, energy management in microgrids seeks to minimize operational costs such as fuel, maintenance, and purchasing energy from the main grid while improving the reliability and environmental features. The present study proposed a new method for industrial microgrid energy management. This management model was formulated to simultaneously produce distribution resources and demand response. The model sought to improve the productivity of the studied industrial units in demand management programs through participation in ancillary services and energy markets. The proposed model was eventually solved using a newly developed algorithm. Results indicated that the possibility to selling and buying power from the main grid reduced the final microgrid operation costs. It was also observed that demand-side management and production management contributed significantly to reducing grid operation costs. Microgrid energy management systems optimize microgrid operation by reducing the network demand at peak consumption hours and transferring it to off-peak times. Actually, renewable sources, fuel cells, and storage devices are rapidly penetrating the power system and supplying part of the required resources. For future work, it will try to examine the presence of these resources with the objective function based on cost and pollution. Also, these resources’ presence makes the demand-side management program’s ability to move flexible loads program more important than before.
Funding Statement: The author received no specific funding for this study.
Conflicts of Interest: The author declares that they have no conflicts of interest to report regarding the present study.
References
1. Cao, W., Pan, X., Sobhani, B. (2021). Integrated demand response based on household and photovoltaic load and oscillations effects. International Journal of Hydrogen Energy, 46(79), 39523–39535. DOI 10.1016/j.ijhydene.2021.08.212. [Google Scholar] [CrossRef]
2. Abedinia, O., Lotfi, M., Bagheri, M., Sobhani, B., Shafie-Khah, M. et al. (2020). Improved EMD-based complex prediction model for wind power forecasting. IEEE Transactions on Sustainable Energy, 11(4), 2790–2802. DOI 10.1109/TSTE.2020.2976038. [Google Scholar] [CrossRef]
3. Huang, S., Abedinia, O. (2021). Investigation in economic analysis of microgrids based on renewable energy uncertainty and demand response in the electricity market. Energy, 225(S2), 120247. DOI 10.1016/j.energy.2021.120247. [Google Scholar] [CrossRef]
4. Wang, C., Zhang, Z., Abedinia, O., Farkoush, S. G. (2021). Modeling and analysis of a microgrid considering the uncertainty in renewable energy resources, energy storage systems and demand management in electrical retail market. Journal of Energy Storage, 33(S2), 102111. DOI 10.1016/j.est.2020.102111. [Google Scholar] [CrossRef]
5. Nurmanova, V., Bagheri, M., Abedinia, O., Sobhani, B., Ghadimi, N. et al. (2018). A synthetic forecast engine for wind power prediction. 2018 7th International Conference on Renewable Energy Research and Applications (ICRERA), pp. 732–737. Paris, France, IEEE. [Google Scholar]
6. Abedinia, O., Bagheri, M. (2021). Power distribution optimization based on demand respond with improved multi-objective algorithm in power system planning. Energies, 14(10), 2961. DOI 10.3390/en14102961. [Google Scholar] [CrossRef]
7. Derakhshandeh, S. Y., Masoum, A. S., Deilami, S., Masoum, M. A., Golshan, M. H. (2013). Coordination of generation scheduling with PEVs charging in industrial microgrids. IEEE Transactions on Power Systems, 28(3), 3451–3461. DOI 10.1109/TPWRS.2013.2257184. [Google Scholar] [CrossRef]
8. Katiraei, F., Iravani, R., Hatziargyriou, N., Dimeas, A. (2008). Microgrids management. IEEE Power and Energy Magazine, 6(3), 54–65. DOI 10.1109/MPE.2008.918702. [Google Scholar] [CrossRef]
9. Gerami, N., Ghasemi, A. (2019). Energy consumption modeling of manufacturing processes in industrial units based on linear piece-wise approximation method with the aim of implementing demand response programs and participating in energy and ancillary service market. Journal of Modeling in Engineering, 17(59), 179–193. [Google Scholar]
10. Derakhshandeh, S. Y., Masoum, A. S., Deilami, S., Masoum, M. A., Golshan, M. H. (2013). Coordination of generation scheduling with PEVs charging in industrial microgrids. IEEE Transactions on Power Systems, 28(3), 3451–3461. DOI 10.1109/TPWRS.2013.2257184. [Google Scholar] [CrossRef]
11. Derakhshandeh, S. Y., Golshan, M. E. H., Masoum, M. A. (2013). Profit-based unit commitment with security constraints and fair allocation of cost saving in industrial microgrids. IET Science, Measurement & Technology, 7(6), 315–325. DOI 10.1049/iet-smt.2013.0044. [Google Scholar] [CrossRef]
12. Zhang, X., Hug, G. (2015). Bidding strategy in energy and spinning reserve markets for aluminum smelters’ demand response. 2015 IEEE Power & Energy Society Innovative Smart Grid Technologies Conference (ISGT), pp. 1–5. Washington DC, USA: IEEE. [Google Scholar]
13. Zhao, X., He, B., Xu, F. Y., Lai, L. L., Yang, C. et al. (2014). A model of demand response scheduling for cement plant. 2014 IEEE International Conference on Systems, Man, and Cybernetics (SMC), pp. 3042–3047. San Diego, CA, USA, IEEE. [Google Scholar]
14. Li, H., Eseye, A. T., Zhang, J., Zheng, D. (2017). Optimal energy management for industrial microgrids with high-penetration renewables. Protection and Control of Modern Power Systems, 2(1), 1–14. DOI 10.1186/s41601-017-0040-6. [Google Scholar] [CrossRef]
15. Bektas, Z., Kayakutlu, G. (2021). Review and clustering of optimal energy management problem studies for industrial microgrids. International Journal of Energy Research, 45(1), 103–117. DOI 10.1002/er.5652. [Google Scholar] [CrossRef]
16. Hernández-Joya, D., Martínez-Carballido, J. (2013). Strategies for energy management in industrial microgrids with a local cogeneration approach. CONIELECOMP 2013, 23rd International Conference on Electronics, Communications and Computing, pp. 17–20. Cholula, Puebla, Mexico, IEEE. [Google Scholar]
17. Su, W., Wang, J. (2012). Energy management systems in microgrid operations. The Electricity Journal, 25(8), 45–60. DOI 10.1016/j.tej.2012.09.010. [Google Scholar] [CrossRef]
18. Li, H., Eseye, A. T., Zhang, J., Zheng, D. (2017). Optimal energy management for industrial microgrids with high-penetration renewables. Protection and Control of Modern Power Systems, 2(1), 1–14. DOI 10.1186/s41601-017-0040-6. [Google Scholar] [CrossRef]
19. Gerami, N., Ghasemi, A., Lotfi, A., Kaigutha, L. G., Marzband, M. (2021). Energy consumption modeling of production process for industrial factories in a day ahead scheduling with demand response. Sustainable Energy, Grids and Networks, 25(1), 100420. DOI 10.1016/j.segan.2020.100420. [Google Scholar] [CrossRef]
20. Canizes, B., Silveira, V., Vale, Z. (2022). Demand response and dispatchable generation as ancillary services to support the low voltage distribution network operation. Energy Reports, 8, 7–15. DOI 10.1016/j.egyr.2022.01.040. [Google Scholar] [CrossRef]
21. Tang, H., Wang, S. (2022). A model-based predictive dispatch strategy for unlocking and optimizing the building energy flexibilities of multiple resources in electricity markets of multiple services. Applied Energy, 305(1), 117889. DOI 10.1016/j.apenergy.2021.117889. [Google Scholar] [CrossRef]
22. Mahani, K., Nazemi, S. D., Jamali, M. A., Jafari, M. A. (2020). Evaluation of the behind-the-meter benefits of energy storage systems with consideration of ancillary market opportunities. The Electricity Journal, 33(2), 106707. DOI 10.1016/j.tej.2019.106707. [Google Scholar] [CrossRef]
23. Gao, X., Knueven, B., Siirola, J. D., Miller, D. C., Dowling, A. W. (2022). Multiscale simulation of integrated energy system and electricity market interactions. Applied Energy, 316(1), 119017. DOI 10.1016/j.apenergy.2022.119017. [Google Scholar] [CrossRef]
24. Karami, M., Madlener, R. (2021). Business model innovation for the energy market: Joint value creation for electricity retailers and their customers. Energy Research & Social Science, 73(2), 101878. DOI 10.1016/j.erss.2020.101878. [Google Scholar] [CrossRef]
25. Favi, C., Marconi, M., Mandolini, M., Germani, M. (2022). Sustainable life cycle and energy management of discrete manufacturing plants in the industry 4.0 framework. Applied Energy, 312(10), 118671. DOI 10.1016/j.apenergy.2022.118671. [Google Scholar] [CrossRef]
26. Zhang, X., Hug, G. (2015). Bidding strategy in energy and spinning reserve markets for aluminum smelters’ demand response. 2015 IEEE Power & Energy Society Innovative Smart Grid Technologies Conference (ISGT), pp. 1–5. Washington DC, USA, IEEE. [Google Scholar]
27. Parsajoo, M., Armaghani, D. J., Asteris, P. G. (2021). A precise neuro-fuzzy model enhanced by artificial bee colony techniques for assessment of rock brittleness index. Neural Computing and Applications, 34(4), 1–19. [Google Scholar]
28. Wang, H., Wang, W., Zhou, X., Zhao, J., Wang, Y. et al. (2021). Artificial bee colony algorithm based on knowledge fusion. Complex & Intelligent Systems, 7(3), 1139–1152. [Google Scholar]
29. Cai, J., Ma, X., Li, Q., Li, L., Peng, H. (2009). A multi-objective chaotic particle swarm optimization for environmental/economic dispatch. Energy Conversion and Management, 50(5), 1318–1325. [Google Scholar]
30. Abedinia, O., Amjady, N., Ghasemi, A. (2016). A new metaheuristic algorithm based on shark smell optimization. Complexity, 21(5), 97–116. [Google Scholar]
Cite This Article
 Copyright © 2023 The Author(s). Published by Tech Science Press.
This work is licensed under a Creative Commons Attribution 4.0 International License , which permits unrestricted use, distribution, and reproduction in any medium, provided the original work is properly cited.
 Downloads
 Citation Tools