
 Submit a Paper
 Propose a Special lssue
 Open Access
REVIEW

Overview of the Global Electricity System in Oman Considering Energy Demand Model Forecast
1 Department of Electrical and Communication Engineering, National University of Science and Technology, PC 111, Muscat, Sultanate of Oman
2 Department of Electrical and Electronic Engineering, Nisantasi University, Istanbul, Turkey
* Corresponding Author: Kenneth E. Okedu. Email:
Energy Engineering 2023, 120(2), 409-423. https://doi.org/10.32604/ee.2023.020375
Received 19 November 2021; Accepted 22 June 2022; Issue published 29 November 2022
 View Full Text
 Download PDF
Abstract
Lately, in modern smart power grids, energy demand for accurate forecast of electricity is gaining attention, with increased interest of research. This is due to the fact that a good energy demand forecast would lead to proper responses for electricity demand. In addition, proper energy demand forecast would ensure efficient planning of the electricity industry and is critical in the scheduling of the power grid capacity and management of the entire power network. As most power systems are been deregulated and with the rapid introduction and development of smart-metering technologies in Oman, new opportunities may arise considering the efficiency and reliability of the power system; like price-based demand response programs. These programs could either be a large scale for household, commercial or industrial users. However, excellent demand forecasting models are crucial for the deployment of these smart metering in the power grid based on good knowledge of the electricity market structure. Consequently, in this paper, an overview of the Oman regulatory regime, financial mechanism, price control, and distribution system security standard were presented. More so, the energy demand forecast in Oman was analysed, using the econometric model to forecasts its energy peak demand. The energy econometric analysis in this study describes the relationship between the growth of historical electricity consumption and macro-economic parameters (by region, and by tariff), considering a case study of Mazoon Electricity Distribution Company (MZEC), which is one of the major power distribution companies in Oman, for effective energy demand in the power grid.Graphic Abstract
Keywords
The liberalization process of Oman electricity sector was initiated by a law to regulate and privatize electricity and water in 2004. This move was aimed at creating a more competitive electricity market and industry. Recently, the electricity sector of Oman has grown to such an extent that significant investments in new generation capacity is needed in order to boast the growing economy and also meet demand. Therefore, the electricity sector liberalization would place significant emphasis onthe participation of private sector in the electricity market. Though, after the implementation of the initial reform strategies, there are new plans to procure electricity in the future in Oman via the spot market strategy [1]. Consequently, the electricity consumers may have options to choose their electricity supplier, in the new market arrangements. Thus, pressure on the present electricity suppliers is expected, and this would lead to wholesale electricity market improvements.
However, despite the much progress in unbundling and reforming the electricity sector in Oman, there are still huge subsidies in the retail tariffs. In 2017, 57% of the overall economic cost of supply was recovered from customers through retail tariffs in the main interconnected system, while the remaining 43% of the revenue requirement was directly from the government as subsidy [1]. Therefore, the implementation of cost-reflective tariffs for consumers and mitigating the cost of power via more competition in the electricity market are two major measures to help reduce the stress on the government of Oman subsidy revenue.
Recently, the power demand in Oman is on the rise due to increase in population and industrial activities [2,3]. The electricity consumption data in Oman was reported as 33,796.000 GWh in 2019, giving a considerable increase from 33,547.000 GWh for 2018 [4,5], with all-time high in 2019 and low as 3604.000 GWh in 1991. During summer periods, there is an increase in load demand in Oman due to significant high temperatures in the region [6], resulting in high demand for electricity per capita [7,8]. This high demand during summer periods, makes the Omani power system very sensitive, with high chances of power failure, resulting in deficit production of power, and price increase in electricity tariffs. Reference [9] proposed a model analysis, that concluded that an increase in the demand flexibility of a power system is the easiest way to influence pricing scenarios with production capacity approaching high levels during periods when peak load reserve are needed, leading to electricity high price spikes.
In view of the above, the need for proper energy demand forecast cannot be over emphasized because it is a vital process in planning for electricity industries [10,11] and plays an important role in any electric power network [12]. There exist a close relationship between the electric power load forecast and the development of the economy. This is also related to the national security and the daily operation of any country [13]. Consequently, accurate load demand forecast would influence energy generating capacity scheduling and power grid management [14]. This is because a good forecast would not only lead to huge savings in operating and maintenance costs, but also correct decisions for future expansion [10,15]. It is important to know that accurate electric load forecast enhances the initial steps in developing facilities for future generation, transmission, and distribution [16]. Tough accurate electric load forecast may not fulfil the wanted outcomes because forecasting schemes vary from one situation to another, with models subjected to variations, based on the available data used as inputs, the timeframe desired, and resolution time from minutes to annual. In lieu of this, in the literature, there exist no precise standard for categorizing load forecasts range [6]. However, a general classification of load demand forecast in the literature is based on duration of prediction and this is classed into three groups of short-term forecasts, medium-term forecasts, and long-term forecasts [17–19]. More so, some works in the literature grouped power load forecast into four groups of; long-term forecasts, mid-term forecasts, short-term forecasts, and very short-term forecasts [20–22].
In short-term forecasting, the duration is normally in hours or weeks [23], and this is paramount in power grid operation with functions like energy transactions, unit commitment, security analysis, economic dispatch, and fuel scheduling and unit maintenance [24]. There is a trend method as an integral part of a short term forecasting that does not explain the behavior of the trend line used, but rather based projections on the historical data. The key advantage of this method is the simplicity of the model requiring only historical consumption data. Again in short-term forecasting, the accuracy level is high [25], thus, the software tools used for commercial purposes in industries and energy traders always employ this topology. In references [26–28], It reported some of the techniques used for this type of forecasting as multiple regression, exponential smoothing, iterative weighted least squares and stochastic time series, while in reference [29], their comparisons were performed. The major shortcoming of the trend forecasting scheme is the non-inclusion of any type of demographic, socio-economic or end-use data, because it cannot predict the changes in the consumption behavior, adoption of new technologies like smart metering, changes in policies for electricity use, required for the planning of infrastructures, change in policies and adoption of new technologies.
To design demand response programs that are appropriate for the power grid, it is necessary to develop and simulate accurate energy demand-consumption models considering various scenarios for industrial, commercial and household users. The conventional forecast used for demand consumption considering previous load demand consumption data is a top-down approach. A bottom-up approach should be given attention to overcome the challenges of the short-term trend forecasting technique, like not been able to predict consumption patterns, flexible demand consumption changes, distributed generation including renewable energy technologies and adoption of new technologies like smart metering.
In the literature, predictive modeling for energy management and power systems engineering was reported in [30], where energy demand estimation and power management systems were analyzed using big data and large computational infrastructures. The authors employed advanced optimization and algorithm techniques for power systems designs, consumer power management, machine and artificial intelligence learning techniques. An innovative energy management model scheme was used in reference [31], for energy management system benchmarking in industrial companies. The authors proposed a model software designed to illustrate the energy management situation, and estimate the target state to identify the required energy efficiency potentials. Pereira et al. [32] developed a numerical model for electrical consumption using machine learning schemes that were trained in parallel based on historical data. The authors reported that the proposed ensemble model could predict the power consumption of the building used as a case study. The authors in [33] carried out a comparative study on the different models for effective energy management design considering parallel hybrid electric vehicles, where the dynamical modelling of the rotating masses was used as a benchmark.
A good comprehension of energy demand model of different sectors is imperative for energy planning and policy in any country. This is because energy demand depends on socioeconomic factors like population, urbanization, industrialization, net capital income and technologies. More so, the modelling of energy demand has increased in importance lately, due to climate change mitigation, since the energy supply sector is the largest contributor to global greenhouse gas emissions. Thus, the improvements in technology could open up new opportunities for energy applications. Therefore, in this paper, a global overview of the electricity system in Oman is presented. The econometric model that is a combination of economic and statistical theoretical analysis is employed for the electricity demand forecast in Oman power grid, by establishing the relationships between the load energy consumed and the key factors that influences them. The econometric model in this paper forecasts the energy and peak demand by econometric analysis. The energy econometric analysis describes the relationship between the growth of historical electricity consumption and macro-economic parameters (by region, and by tariff), instead of the most common econometric approach used in the literature based on end-use estimations usually know as conditional demand analysis (CDA).
2 Oman Electricity Regulatory Regime
A brief history of the regulatory regime of Oman regarding the electricity sector is given as follows [34,35]:
1970–30 April 2005: Ministry undertook all electricity sector activities.
2004: Royal Decree 78/2004 for electricity sector structure was initiated, with definition of the responsibility of Authority for Electricity Regulation (AER) in Oman.
2005: The implementation of new electricity sector structure started.
2007: Royal Decree 92/2007 for establishment of Public Authority for Electricity and Water (PAEW).
2009: Royal Decree 58/2009 for defining the responsibilities of PAEW.
2018: Royal Decree 42/2018 for replacing PAEW and transfering the electricity sector responsibilities to Ministry of Oil and Gas (MOG).
3 Current Structure of Electricity Utility Sectors in Oman
The current structure of the utility sector in Oman is shown in Fig. 1, with the government owned and private sector participations. The government owned bodies are the ministry of housing, electricity and water, ministry of finance. The Nama Shared Services (NSS) in Oman consists of various social protection schemes offered by competent authorities, in conjunction with Numo Institute for Competency Development (NICD). In Fig. 1, Stage 1 involves the government ownership of the utility sector of Oman, basically run by the ministry of housing, electricity and water. Stage 1 is also made up of private ownership of independent power producers run by private investors and public shareholders. The ministry of finance is in charge of Stage 2 of the utility sector of Oman, where NAMA holding is subdivided into NSS and NICD. The generation, transmission and distribution units are underStage 2.
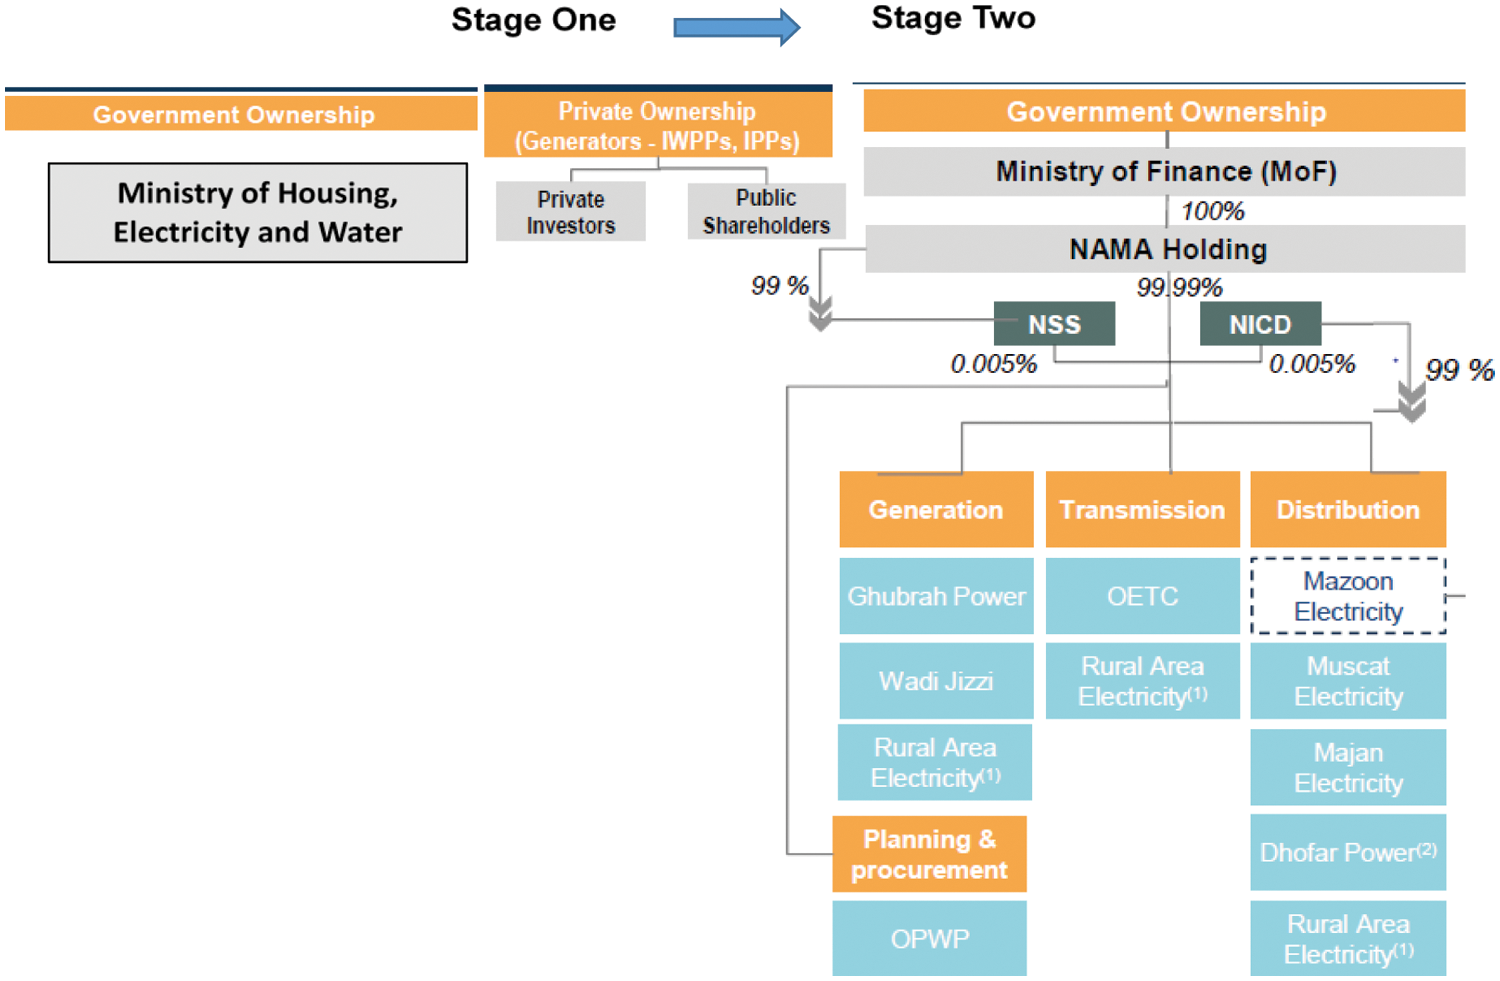
Figure 1: Current structure of electricity utility sector in Oman
The market structure and regulatory framework in the Main Interconnected System (MIS) and Dhofar system in Oman are given in Fig. 2, while subsidy is currently applied by the government in the Muscat Electricity Distribution Company (MEDC), Majan Electricity Distribution Company (MJEC), Mazoon Electricity Distribution Company and Dhofar Power Company (DPC). The Oman Electricity Transmission Company (OETC) is responsible for the transmission of power to the various distribution companies.
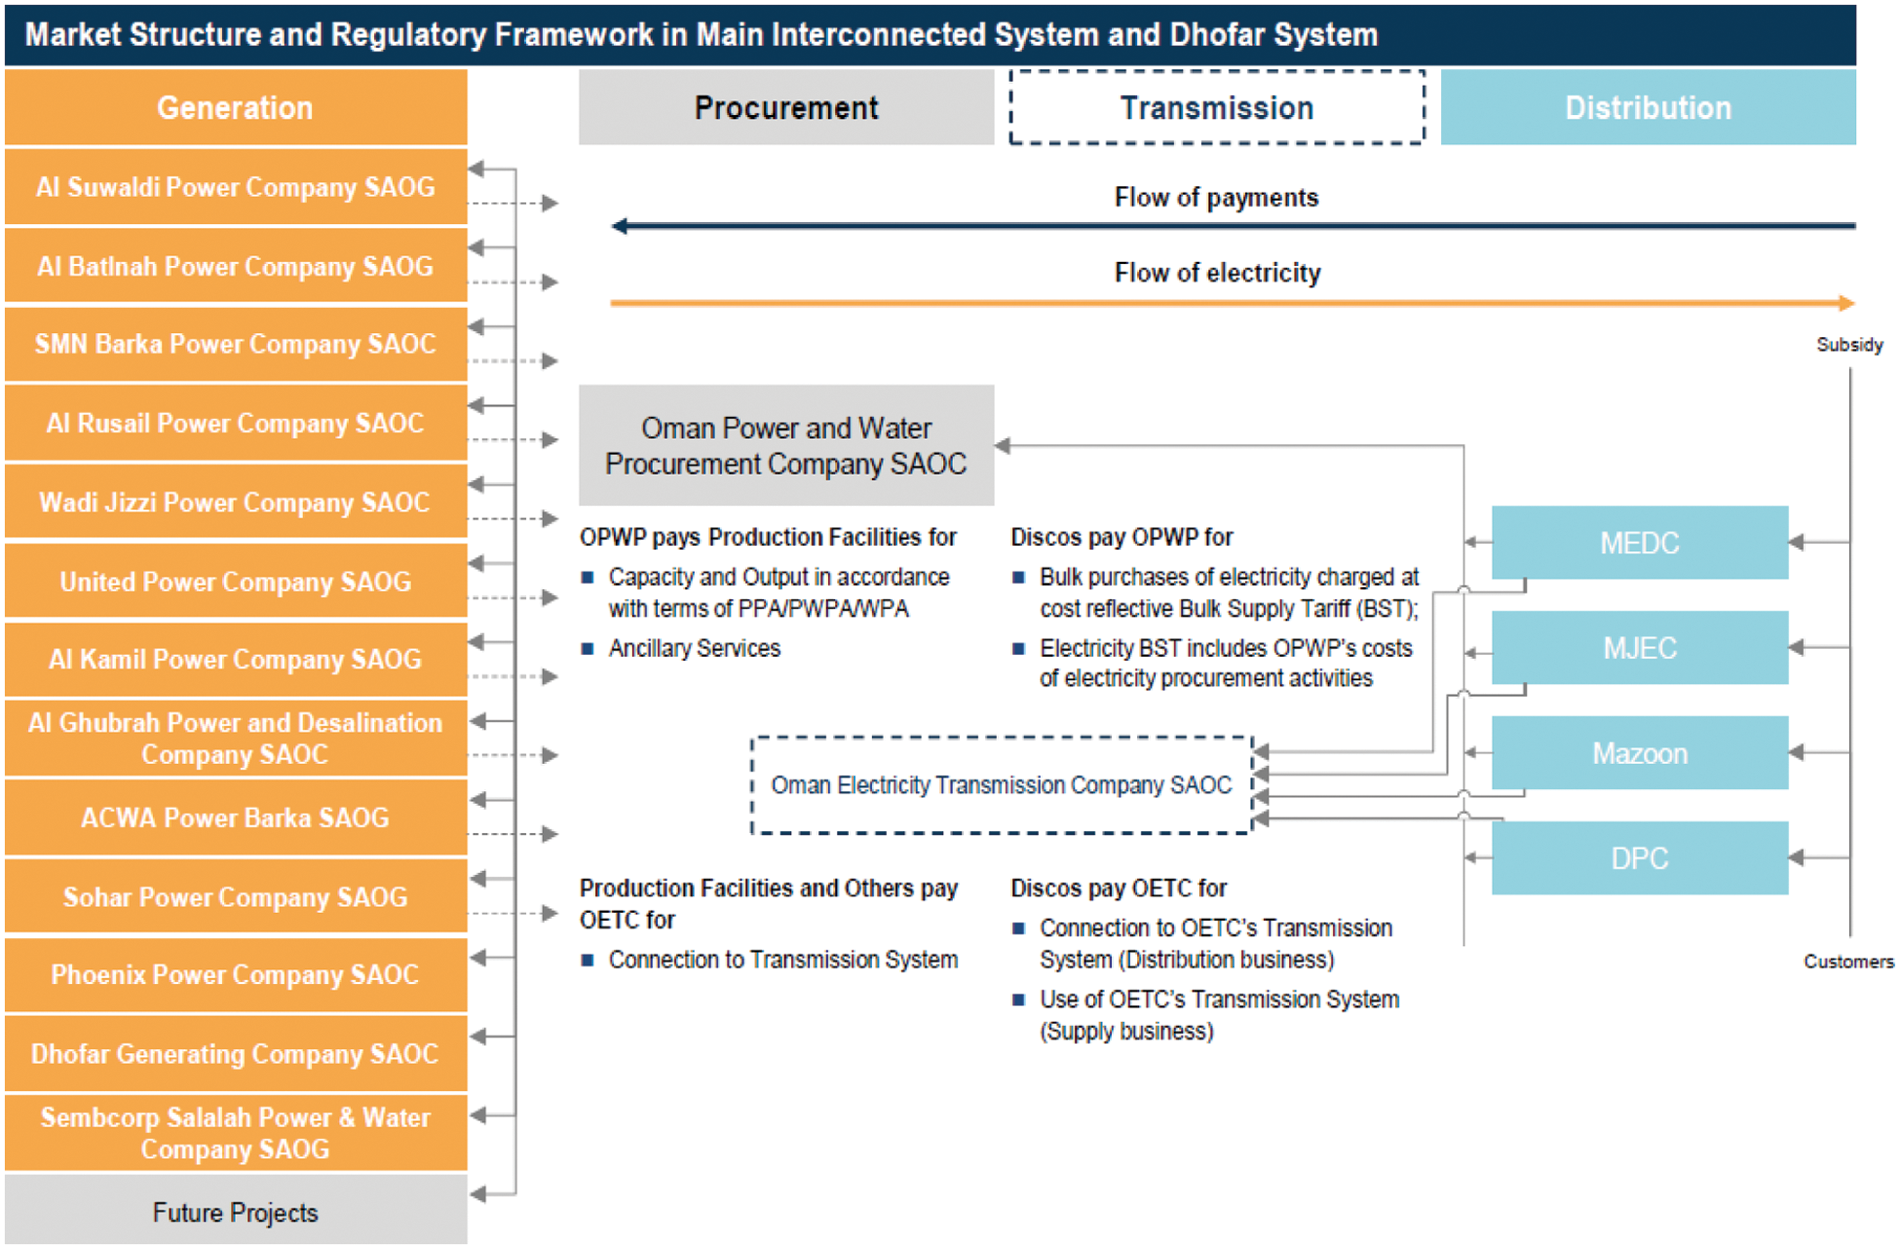
Figure 2: Market structure and regulatory framework in the MIS and Dhofar system in Oman
4 Price Control Overview and System Security of the Electricity Sector of Oman
The price control is a mechanism to control the prices besides ensuring the quality and efficiency of the electricity sector. The price control does the following:
□ Set allowances
□ Set incentives and
□ Determine revenues
Fig. 3 and Table 1 show the price control mechanism overview and the Distribution System Security Standard (DSSS). Distribution companies shall:
□ Plan & develop its distribution system in accordance to approved DSSS, distribution code, grid code and with any other standards of planning related to transmission or other distribution system.
□ Operate & maintain a safe, efficient and economic distribution system in accordance with the security standards, grid code and such other standards of operation and maintenance. The K factor is the metric of evaluating the system, while the incentive and penalty are the benefits and consequences that may be incurred in the system. The detailed diagram with the various voltage levels, bus bars, power demand and range or threshold of operation of the power demand based on the distribution system security standard is shown in Fig. 4.

Figure 3: Price control mechanism system in Oman
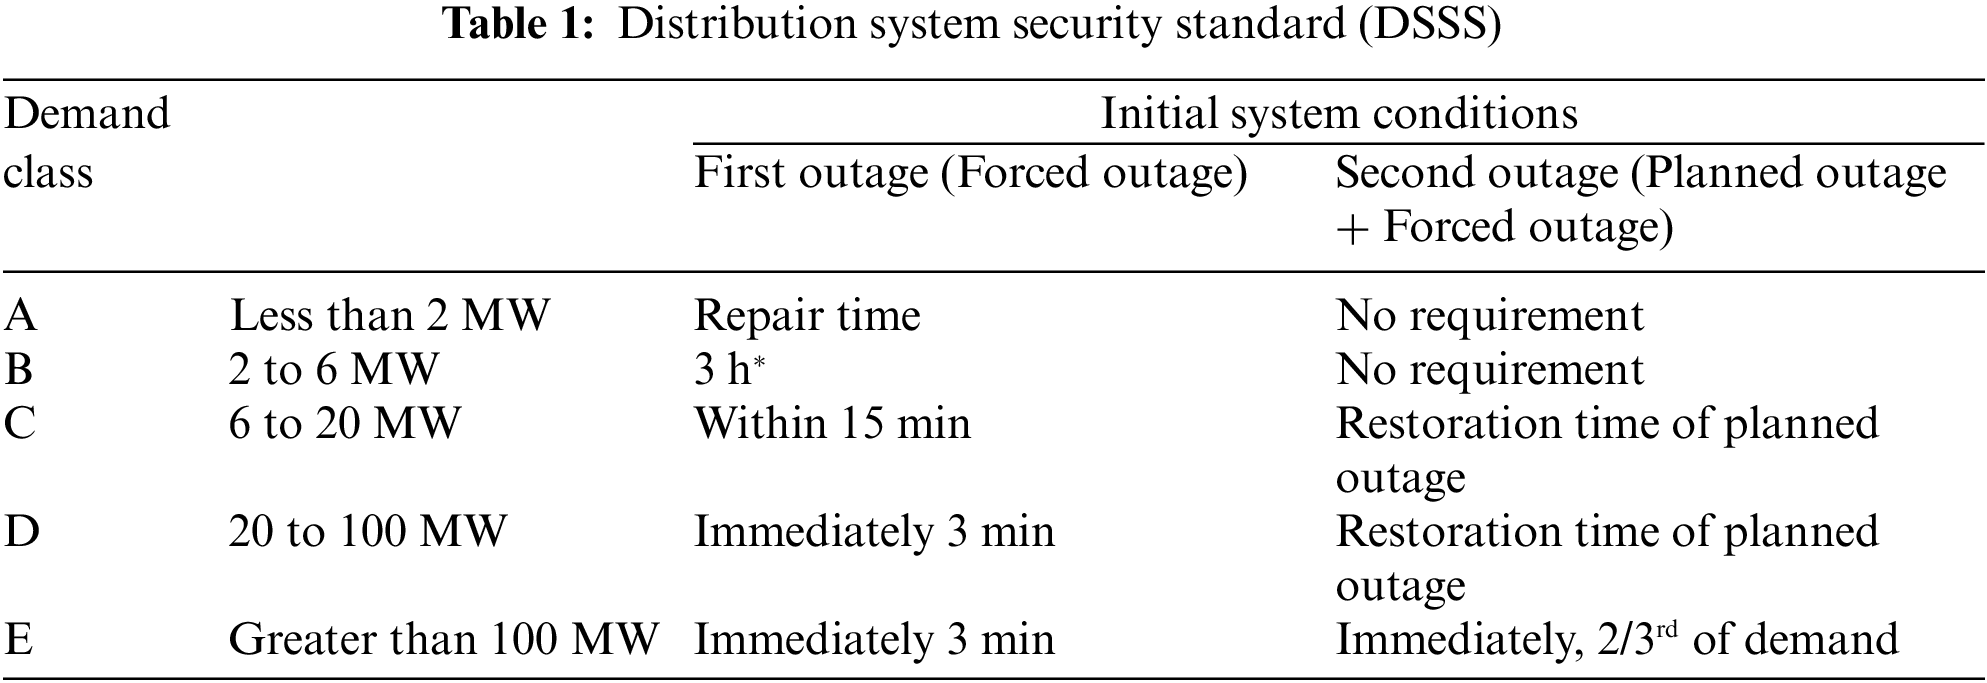
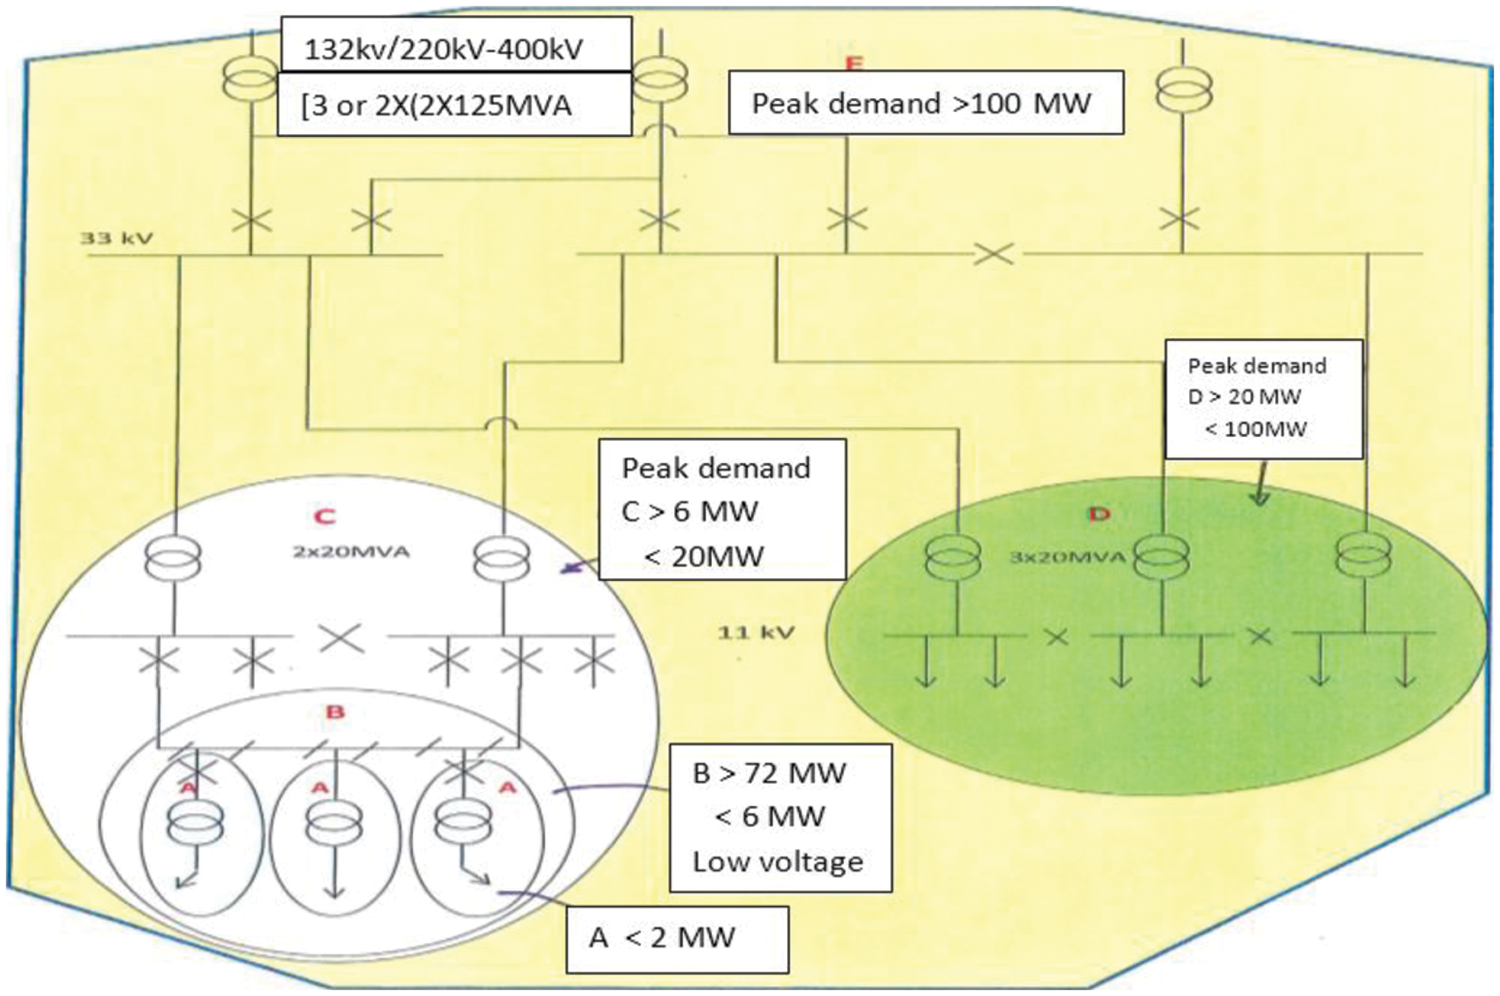
Figure 4: Voltage levels, and power threshold of operation of the power demand in the DSSS
From Table 1, * represents (for 11 kV networks in remote areas this restoration time may be extended by the time it reasonably takes for a repair crew to reach the area with the outage as long as the total restoration time will not exceed 6 h). No requirement means no initial system condition may be necessary.
5 The Case Study of the Mazoon Electricity Company (MZEC)
MZEC is a closely held Omani joint stock company registered under the commercial companies’ law of Oman. The establishment and operations of the company are governed by the provisions of the law for the regulation and privatization of electricity and related water sector (the sector law), promulgated by Royal Decree 78/2004 and subsequent amendments. The company is primarily undertaking regulated business of distribution and supply of electricity in southern Batinah, Dakhliyah, southern Sharqiya and Northern Sharqiyah governorates of Oman, under a license issued by the authority for electricity regulation, in Oman as illustrated in Fig. 5 [36]. The company commenced its commercial operations on the 1st of May 2005, following the implementation of a decision by the Ministry of National Economy (issued pursuant to Royal Decree 78/2004). The main role of the company as a distribution operator of the system and supplier of electricity as a licensed entity in the sector law are; to provide financial responsibilities, operation, maintenance, development and expansion of the 33,11 kV distribution and low tension side network, based on relevant performance security standards and safety measures; to contain all the demands for electricity supply in areas within its reach; to carryout meter readings and to generate electricity bills for consumers and ensure payments of such bills.
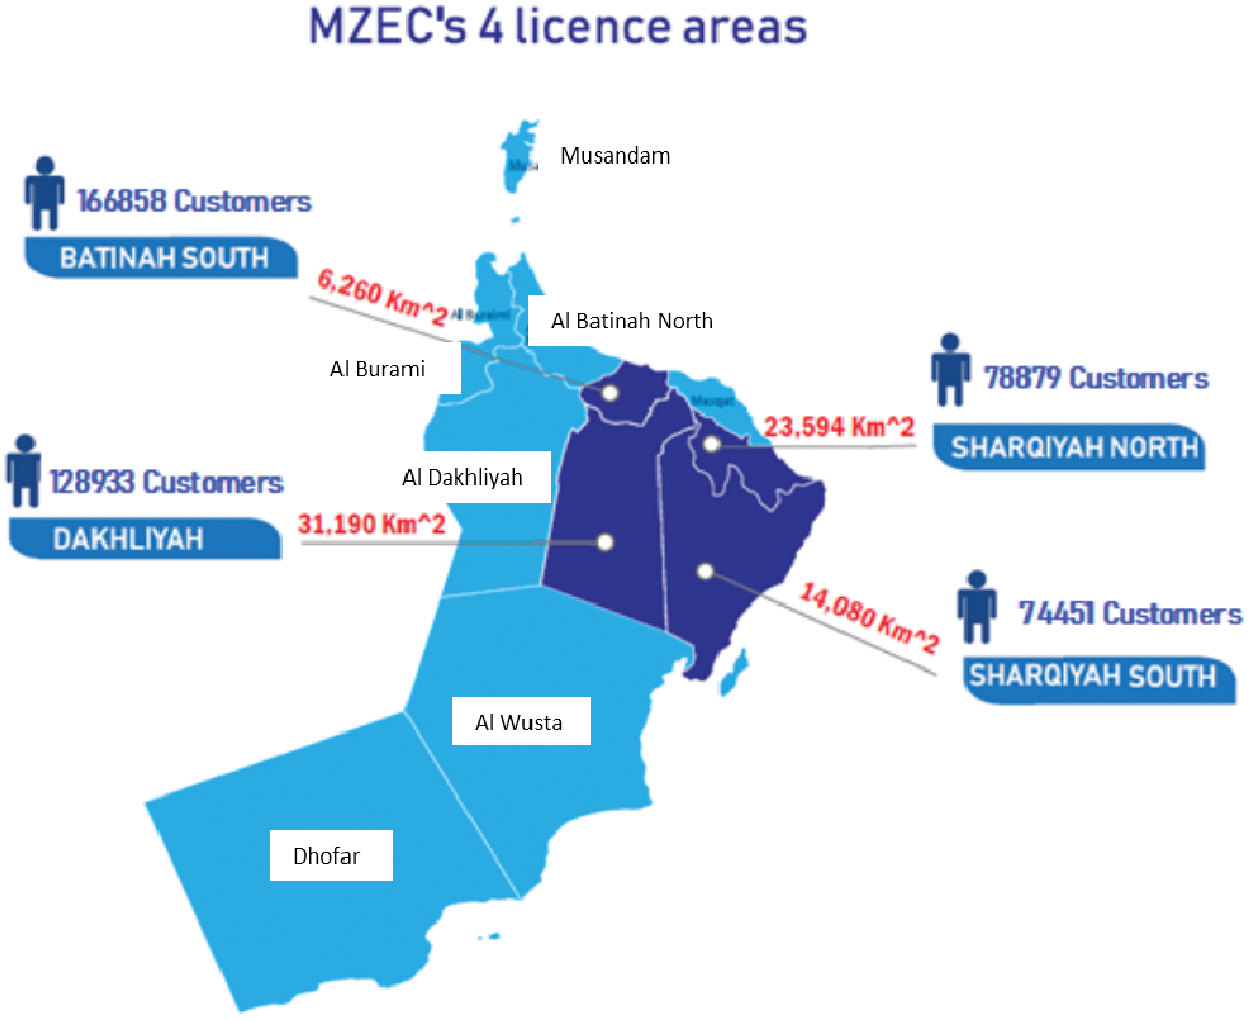
Figure 5: Regions covered by Mazoon Electricity Company in Oman
The company’s distribution network consists of various voltage levels; 33, 11 and 0.433 kV, respectively. The network consist of 33/11 kV primary substations, 11/0.433 kV distribution substations and 33/0.433 kV substations and the cables and overhead lines at these voltage levels. MZEC has experienced an average growth of 6.4% in load annually. Fig. 6 shows the trend of growth in customers from 2008 (with 990 MW) to 2019 (with 2233 MW), for the Mazoon electrical network during the period of this study.
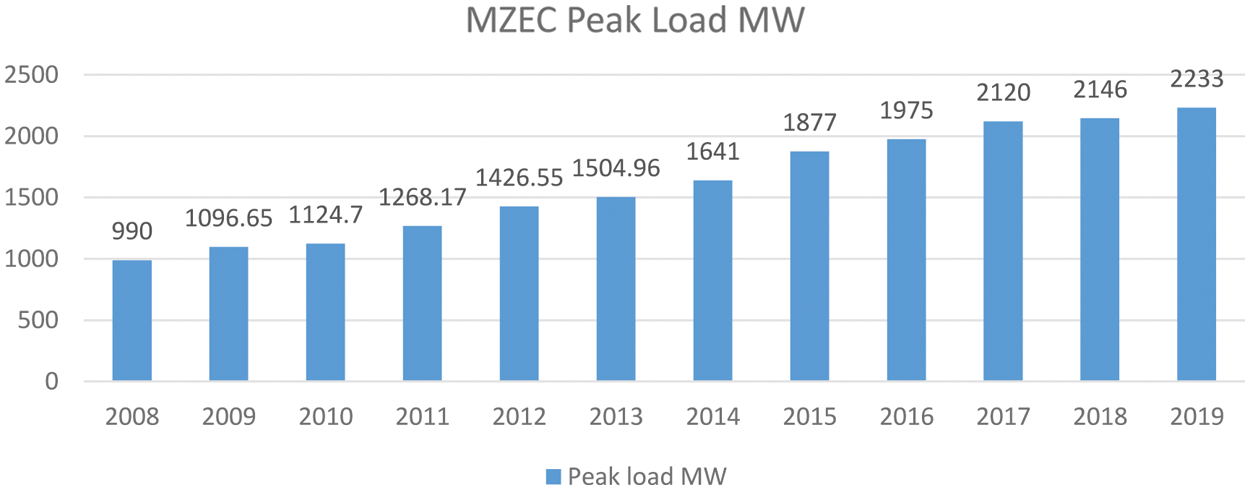
Figure 6: Growth in peak load for Mazoon Electricity Company
6 Forecast Methodology and Algorithms in Oman Power Network
Fig. 7 shows the reasons why utilities in the electricity sector in Oman needs a forecast model. The forecast methodology and algorithm employed in this paper is shown in Fig. 8. The load forecast algorithm is divided into classical and artificial intelligence models and hybrid approaches, with the details of each of the models shown in Fig. 8 for the classical and artificial intelligence models.
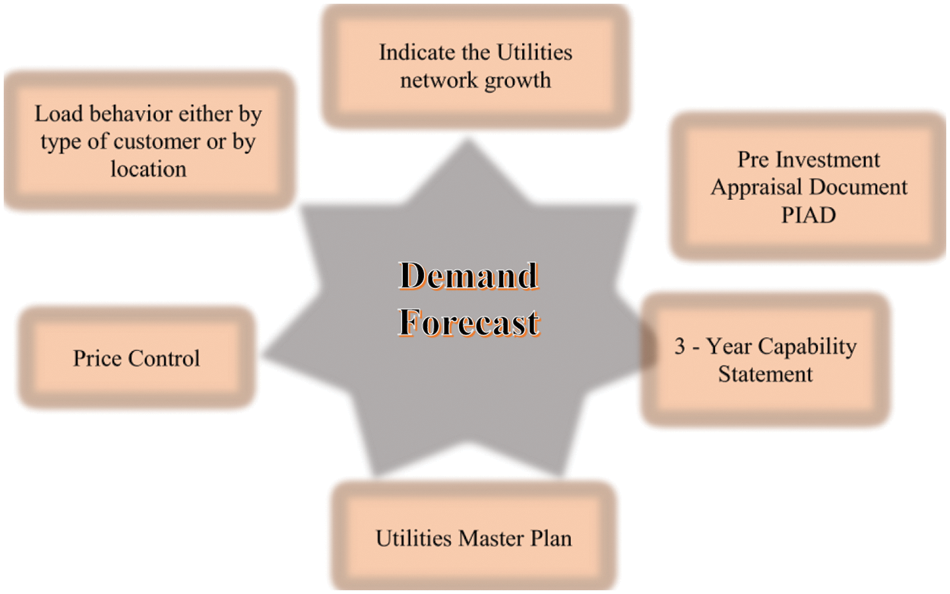
Figure 7: Benefits of forecast models in Oman electricity sector
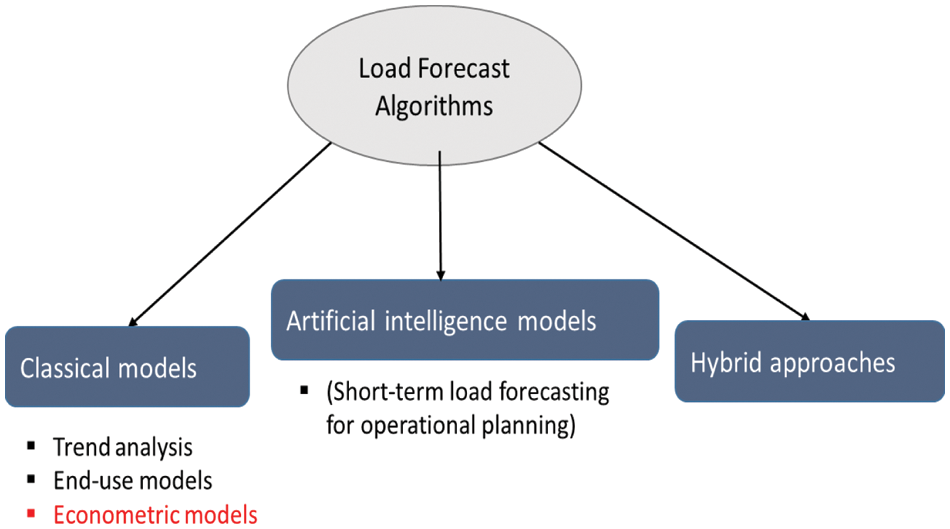
Figure 8: Forecast methodology and algorithms
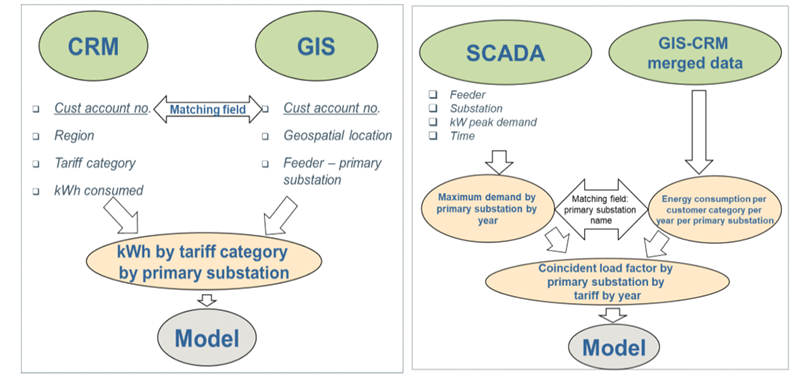
The MZEC demand forecast structure is shown in Fig. 9, with forecast input data given in Fig. 10. The account numbers in Customer Relation Management (CRM) and Geographical Information System (GIS) datasets do not fully match and some missing accounts always appear on the merge results, thus a scalar is used to solve this issue by the function below:
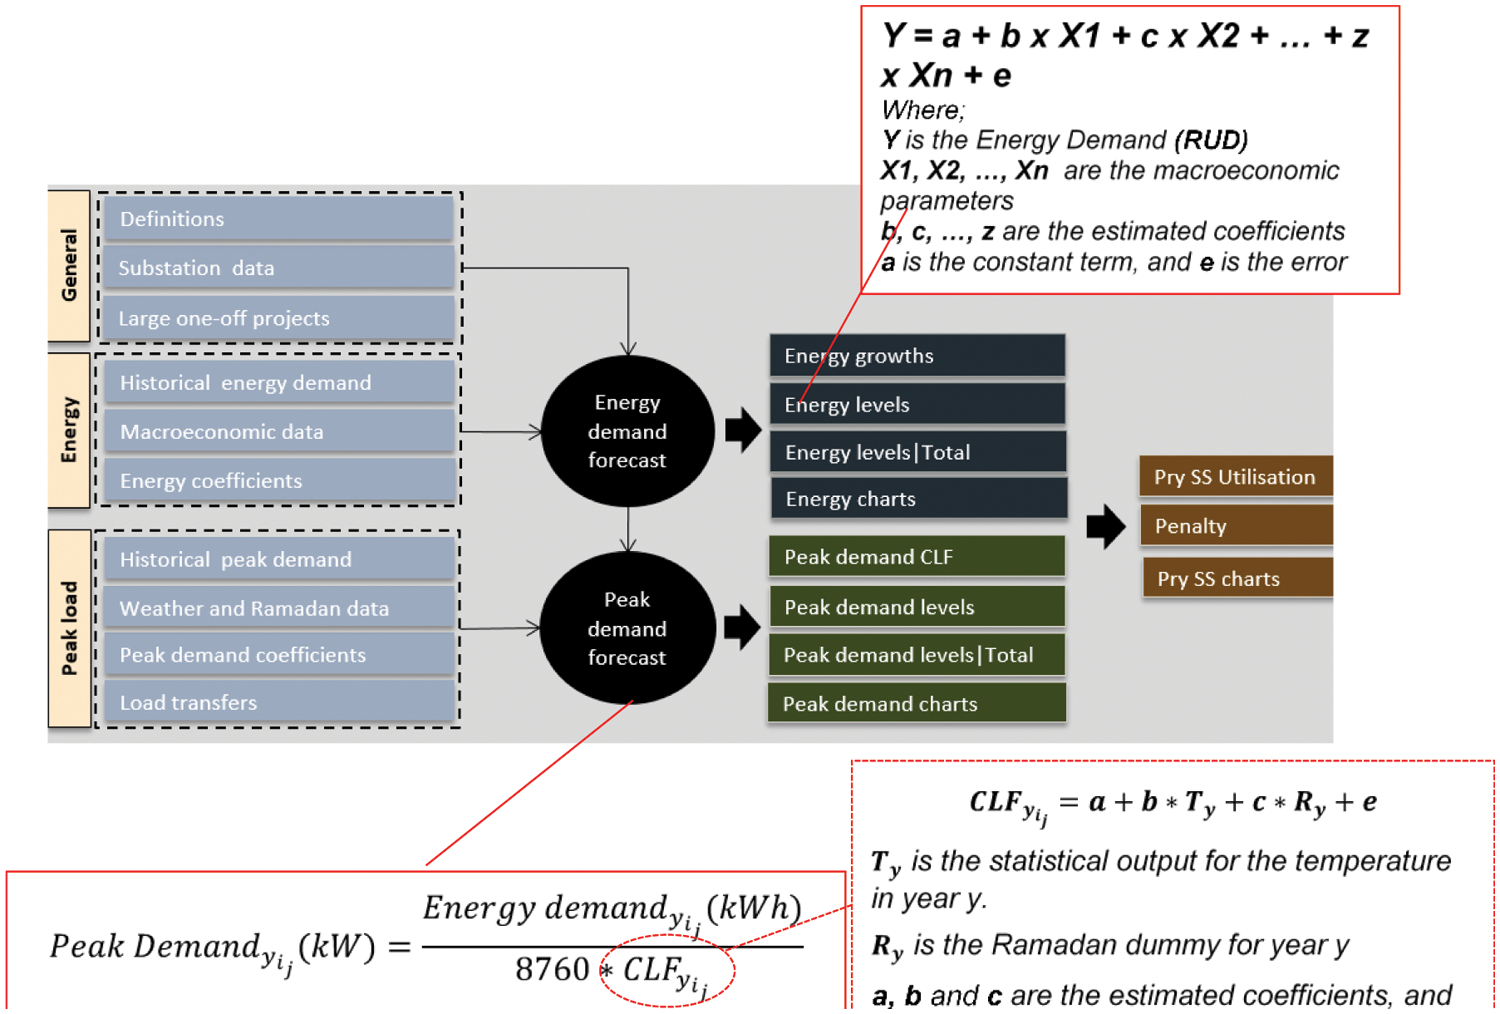
Figure 9: MZEC demand forecast structure
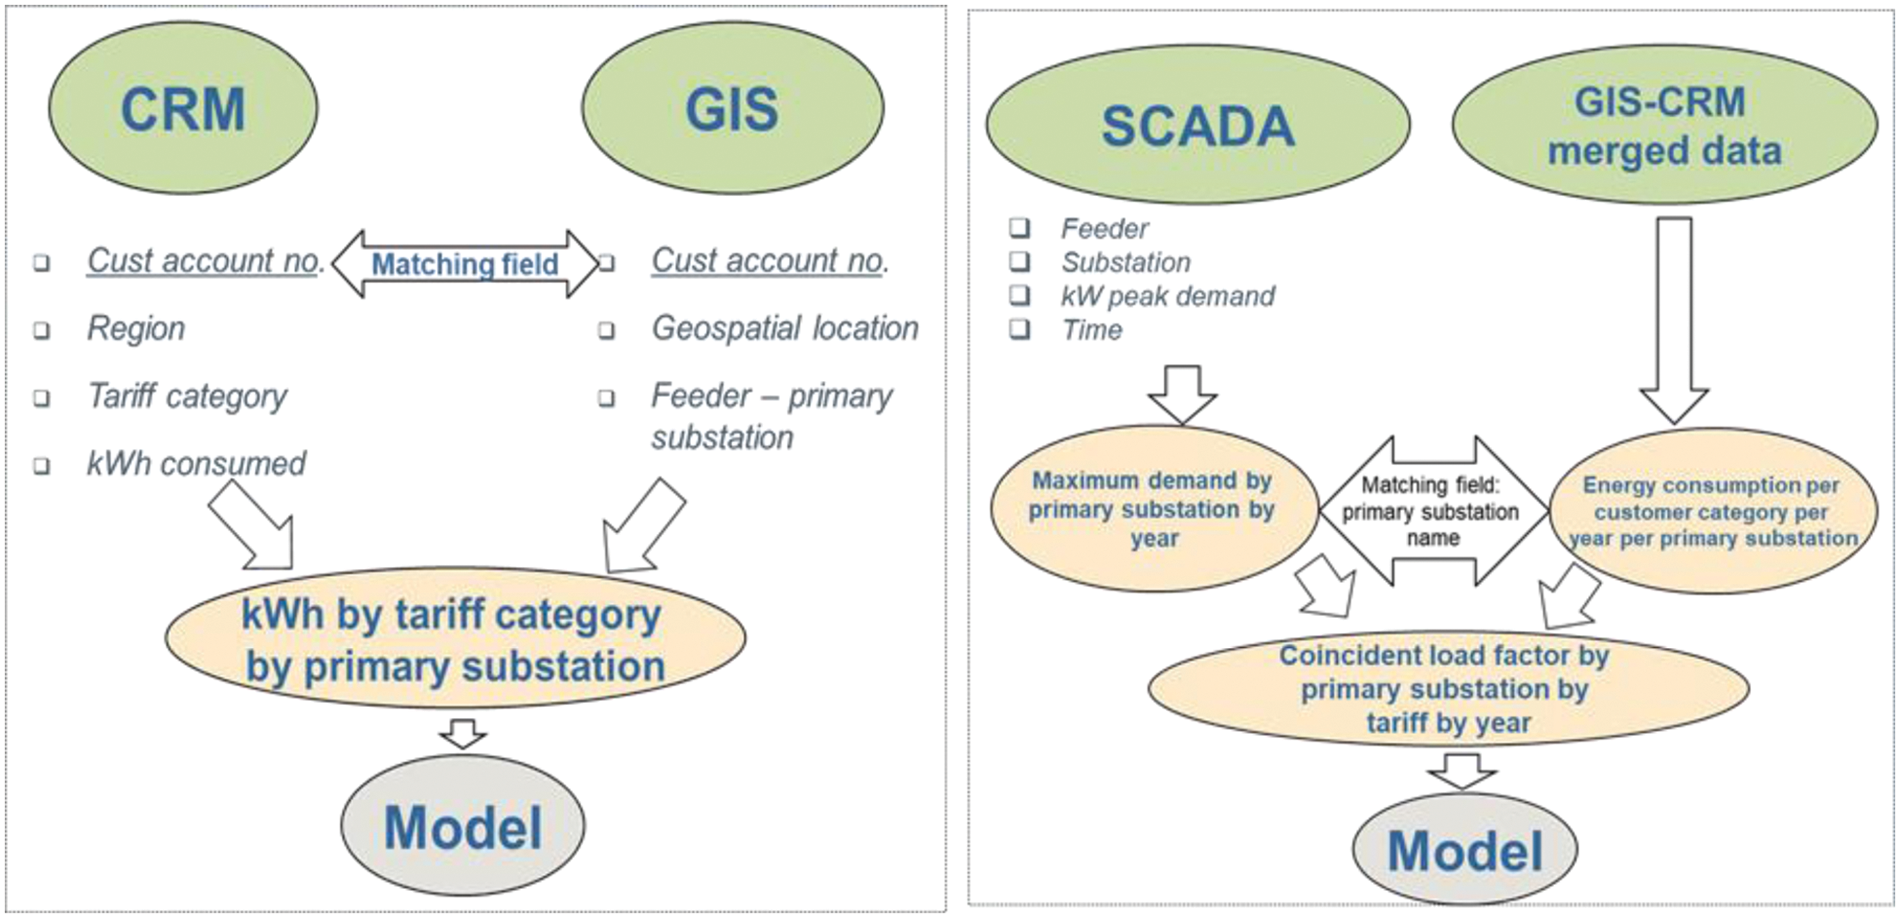
Figure 10: MZEC demand forecast input data
The model demand forecast algorithm is given as follows:
• The model forecasts the energy and peak demand by econometric analysis.
• The energy econometric analysis describes the relationship between the growth of historical electricity consumption which is the Regional Unit Distribution (RUD) and macro-economic parameters (by region, by tariff). The equations for the energy demand forecast are described as per below principal:
The energy demand growth rate is calculated as:
•
•
•
Lagged dependent variables are used to allow for dynamic effects. However, the peak demand econometric analysis describes the relationship between maximum demand and regional units distributed as per below equation:
•
•
•
The coincident load factor will be a function of weather, Ramadan dates and EID festival dates.
•
•
•
•
If the Ramadan dates coincide with the peak demand period, then R_y will have a value of 1. In all other cases it will be 0.
The MZEC demand model forecast output data has the feature to present the forecast of the energy consumption or peak demand per customer category per year per primary substation per region. The results for a section of the power grid for Adam are shown in Table 2 and Fig. 11. In Table 2, there was historical energy increase for Agricultural tariffs in the Adam primary substation case study for 2011, from 21,674 to 52,259 kWh in 2013. However, in 2014, there was a drop of the energy demand to 39,751 kWh. From 2015 to 2017, there was again increment of the agricultural energy demand from 280,869 to 300,791 kWh. The forecast using the proposed econometric model is given as 313,783 in 2018, in Table 2. There was considerable increment of the historical energy demand for commercial and industrial activities from 2011 to 2017, and the 2018 energy demand forecast shows the expected energy demand. Fig. 11 shows the total projected energy demand for the Adam grid from 2011 to 2020. This trend could be extended for the next five years to show the expected energy demand of the system.
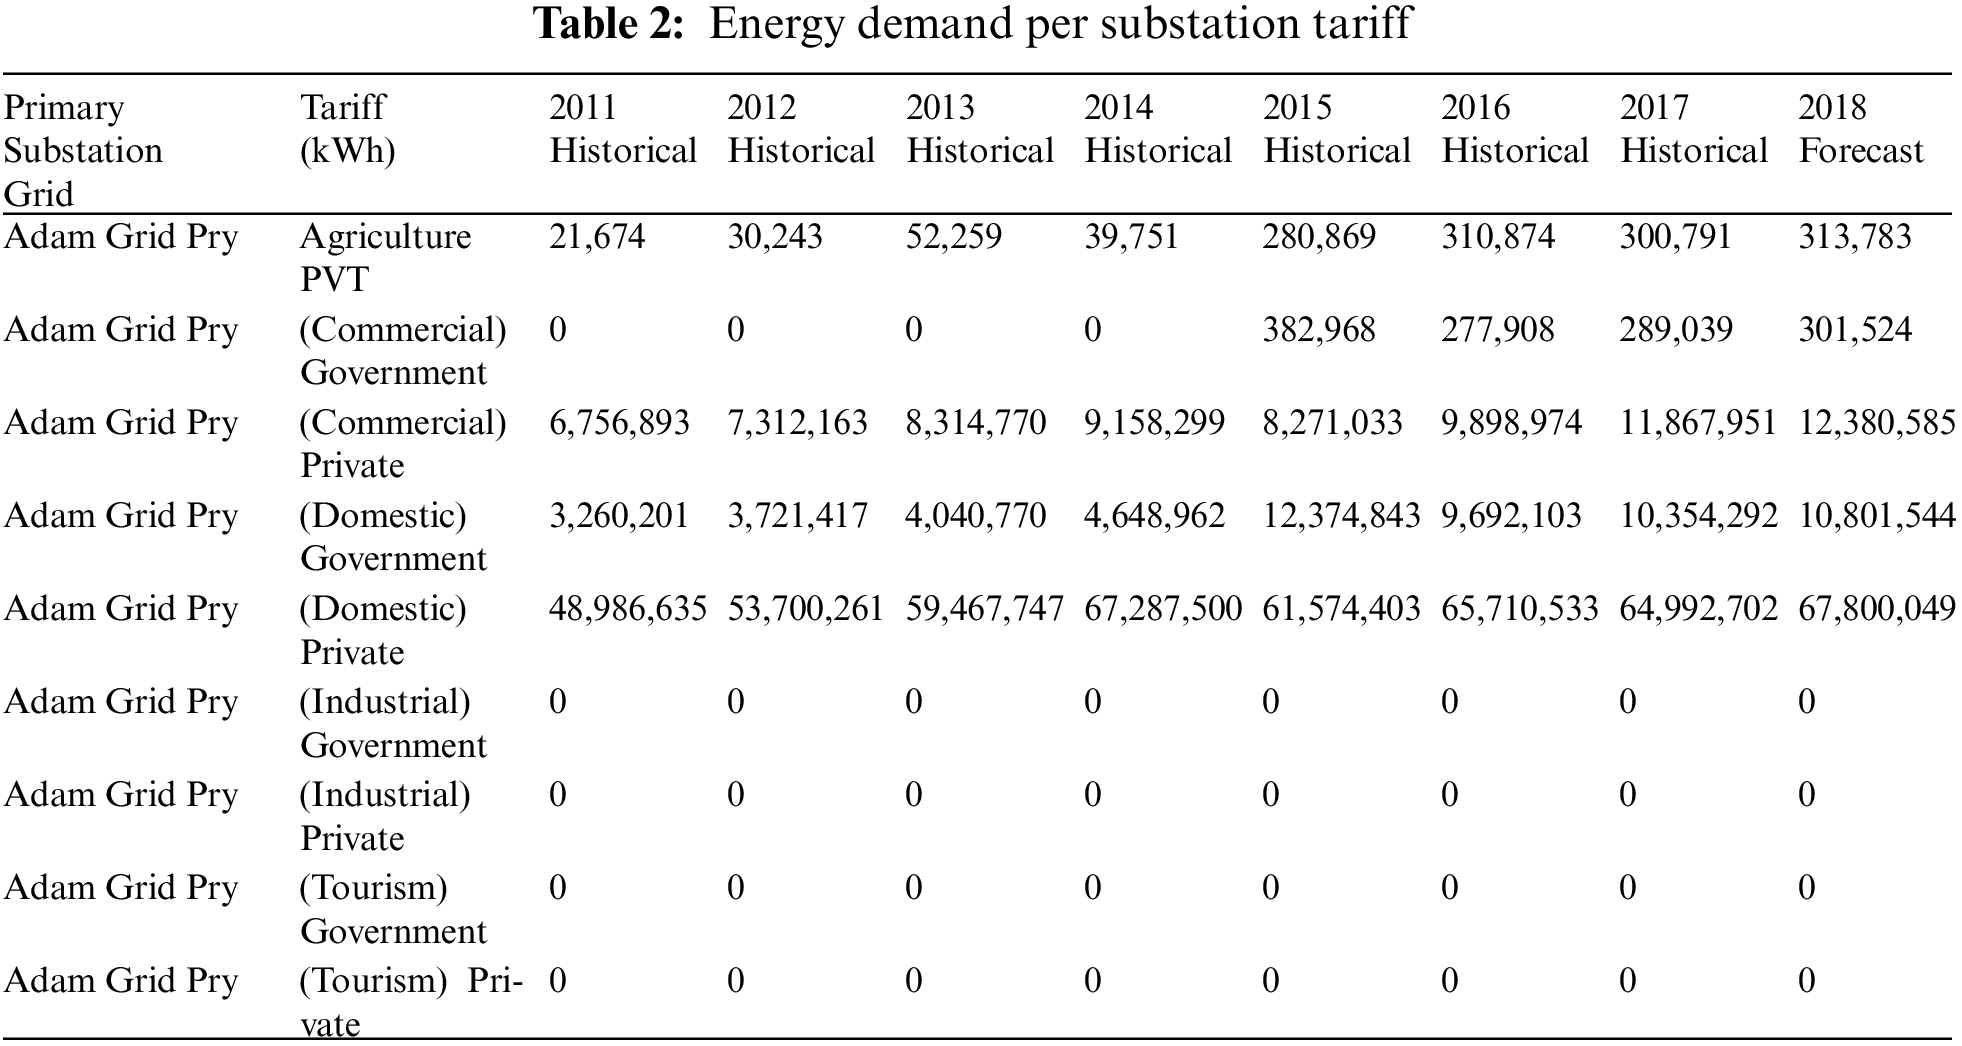
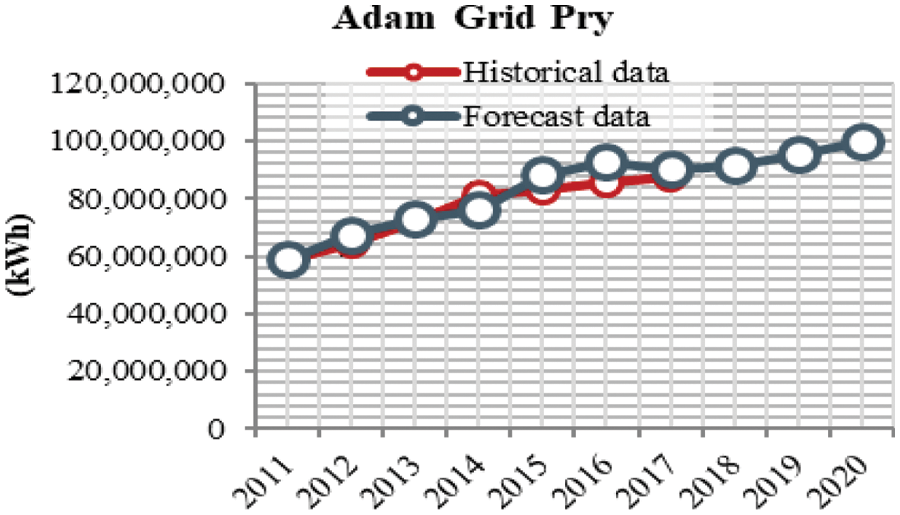
Figure 11: MZEC demand forecast input data
7 Conclusion and Recommendations
An overview of the electricity sector of Oman with regards to regulatory regime, financial mechanism, price control, distribution system security standard, and demand forecast were discussed in this paper. A load forecast algorithm for power input and output demand was developed for the power grid of Oman considering the Mazoon Electricity Distribution Company (MZEC), as case study. The energy econometric analysis, which shows the relationship between the growth of historical electricity consumption and macro-economic parameters (by region, and by tariff), was employed in this study. The results obtained could help for effective energy demand in the power grid of Oman, in order to understand the load demand behavior by the type of customers, locations, or indicate utilities network growth and master plans for future developments.
In the future, the reported econometric forecast model would be improved to be useful in several energy management system applications that is beyond prediction and extrapolation using learning techniques.
Acknowledgement: The authors would like to acknowledgement the management and staff of Mazoon Electricity Distribution Company of Oman for providing the data used in this study.
Funding Statement: The authors received no funding for this work.
Conflicts of Interest: The authors declare that they have no conflicts of interest to report regarding the present study.
References
1. Hasan, S., Al-Aqeel, T., Al-Badi, A., Bhatt, Y., Al-Badi, M. (2019). Oman electricity sector: Features, challenges and opportunities for market integration, pp. 1–32. King Abdullah Petroleum Studies and Research Center. DOI 10.30573/KS--2019-DP61. [Google Scholar] [CrossRef]
2. Okedu, K. E., Al-Hashmi, M. (2018). Assessment of the cost of various renewable energy systems to provide power for a small community: Case of Bukha, Oman. International Journal of Smart Grid, 2(3), 172–182. [Google Scholar]
3. Okedu, K. E., Al-Nadabi, H., Aziz, A. (2019). Prospects of solar energy in Oman: Case of oil and gas industries. International Journal of Smart Grid, 3(3), 138–151. [Google Scholar]
4. National Center for Statistics and Information (2021). Yearly data report. Oman electricity consumption, economic indicator (1991–2021). https://www.ceicdata.com/en/oman/electricity-consumption/electricity-consumption. [Google Scholar]
5. World Bank Group (2014). Electrical power consumption (kWh per capita). Oman, International Energy Agency Statistics. https://data.worldbank.org/indicator/EG.USE.ELEC.KH.PC?locations=OM. [Google Scholar]
6. Okedu, K. E., Al Salmani, W. Z. (2019). Smart grid technologies in gulf corporation council countries: Challenges and opportunities. International Journal of Smart Grid, 3(2), 92–102. [Google Scholar]
7. Oman Electricity and Transmission Company (OETC) (2020). Annual report. https://www.omangrid.com/en/Pages/Reports.aspx. [Google Scholar]
8. Authority for Electricity Regulation (AER) in Oman (2018). Annual report.https://www.apsr.om/en/annualreports. [Google Scholar]
9. NordREG (2011). NordREG report on the price peaks in the Nordic wholesale market during winter (2009–2010). https://books.google.com.om›books. [Google Scholar]
10. Almeshaiei, E., Soltan, H. (2011). A methodology for electric power load forecasting. Alexandria Engineering Journal, 50(2), 137–144. DOI 10.1016/j.aej.2011.01.015. [Google Scholar] [CrossRef]
11. Mahmoud, A. H., Borut, J., Bojan, R., Dejan, D. (2020). Methods and models for electric load forecasting: A comprehensive review. Logistics & Sustainable Transport, 11(1), 51–76. DOI 10.2478/jlst-2020-0004. [Google Scholar] [CrossRef]
12. Nalcaci, G., Özmen, A., Weber, G. W. (2018). Long-term load forecasting: Models based on MARS, ANN and LR methods. Central European Journal of Operations Research, 27(4), 1033–1049. DOI 10.1007/s10100-018-0531-1. [Google Scholar] [CrossRef]
13. Zhang, J. (2016). Research on power load forecasting based on the improved Elman neural network. Chemical Engineering Transactions, 51, 589–594. [Google Scholar]
14. Lin, Y., Luo, H., Wang, D., Guo, H., Zhu, K. (2017). An ensemble model based on machine learning methods and data preprocessing for short-term electric load forecasting. Energies, 10(1186), 1–16. DOI 10.3390/en10081186. [Google Scholar] [CrossRef]
15. Demirel, O., Kakilli, A., Tektas, M. (2010). Electric energy load forecasting using ANFIS and ARMA methods. Journal of the Faculty of Engineering and Architecture of Gazi University, 25(3), 601–610. [Google Scholar]
16. Wang, Q., Wang, Y., Zhang, L. (2008). Research on post-evaluation model and method of electric power demand forecasting. Proceedings at the Chinese Control and Decision Conference (CCDC), pp. 1–6. Yantai, Shandong, China. DOI 10.1109/CCDC.2008.4597490. [Google Scholar] [CrossRef]
17. Khamaira, M. Y., Krzma, A. S., Alnass, A. M. (2018). Long term peak load forecasting for the Libyan network. First Conference for Engineering Sciences and Technology (CEST), pp. 185–193. Garaboulli, Libya. [Google Scholar]
18. Filik, Ü. B., Gerek, Ö. N., Kurban, M. (2011). A novel modeling approach for hourly forecasting of long-term electric energy demand. Energy Conversion and Management, 52(1), 199–211. DOI 10.1016/j.enconman.2010.06.059. [Google Scholar] [CrossRef]
19. Gordillo-Orquera, R., Lopez-Ramos, L. M., Muñoz-Romero, S., Iglesias-Casarrubios, P., Arcos-Avilés, D. et al. (2018). Analyzing and forecasting electrical load consumption in healthcare buildings. Energies, 11(493), 1–18. DOI 10.3390/en11030493. [Google Scholar] [CrossRef]
20. Friedrich, L., Afshari, A. (2015). Short-term forecasting of the Abu Dhabi electricity load using multiple weather variables. 7th International Conference on Applied Energy (ICAE), vol. 75, pp. 3014–3026. Abu Dhabi, UAE. [Google Scholar]
21. Abu-Shikhah, N., Elkarmi, F. (2011). Medium-term electric load forecasting using singular value decomposition. Energy Conversion and Management, 36(7), 4259–4271. [Google Scholar]
22. Wanga, R., Wangb, J., Xu, Y. (2019). A novel combined model based on hybrid optimization algorithm for electrical load forecasting. Applied Soft Computing Journal, 82(3), 105548. DOI 10.1016/j.asoc.2019.105548. [Google Scholar] [CrossRef]
23. Feinberg, E. A., Genethliou, D. (2005). Load forecasting. In: Weather, pp. 269–285. Switzerland: Springer. [Google Scholar]
24. Campillo, J., Wallin, F., Torstensson, D., Vassileva, I. (2012). Energy demand model design for forecasting electricity consumption and simulating demand response scenarios in Sweden. International Conference on Applied Energy, Suzhou, China. [Google Scholar]
25. An,Y. Q., Zhou, Y. L., Li, R. R. (2019). Forecasting India’s electricity demand using a range of probabilistic methods. Energies, 12, 1–24. DOI 10.3390/en12132574. [Google Scholar] [CrossRef]
26. Richard, V. (2010). Demand shaping: Achieving and maintaining optimal supply-and-demand alignment. Practice, 509, 1–14. [Google Scholar]
27. Neeley, D., Farrell, A., Hornby, J. (2011). Analytic strategies for the customer-centric utility. Intelligence, 10, 1–7. [Google Scholar]
28. SAS Institute Inc. (2011). SAS forecast server—fact sheet. Science Special Issue on ManufacturingTechnology, 10(1), 19. [Google Scholar]
29. Alfares, H., Nazeeruddin, M. (2002). Electric load forecasting: Literature survey and classification of methods. International Journal of Systems Science, 33(1), 23–34. DOI 10.1080/00207720110067421. [Google Scholar] [CrossRef]
30. Ravinesh, D., Samui, P., Sanjiban, S. R. (2020). Predictive modelling for energy management and power systems engineering. Amsterdam, Netherlands: Elsevier. [Google Scholar]
31. Topić, M., Karin, T., Biedermann, H. (2015). Energy management model an innovative tool for benchmarking the energy management system in industrial companies. Economy and Market Communication Review, 5(2), 337–355. [Google Scholar]
32. Pereira, L. S., Rodrigues, R. N., Neto, E. A. (2020). Modeling of energy management systems using artificial intelligence. IEEE International Systems Conference (SysCon), pp. 1–6. Montreal, QC, Canada. DOI 10.1109/SysCon47679.2020.9275831. [Google Scholar] [CrossRef]
33. Abdoulaye, P., Bouscayrol, A., Fiani, P. (2021). Comparison of different models for energy management strategy design of a parallel hybrid electric vehicle: Impact of the rotating masses. IET Electrical Systems in Transportation, 11(1), 36–46. DOI 10.1049/els2.12003. [Google Scholar] [CrossRef]
34. Mazoon Electricity Distribution Company, Oman (2010). Annual report, pp. 1–68. https://mzec.nama.om/PublicationDocuments/Annual%20Report2010Eng.pdf. [Google Scholar]
35. Authority for Electricity Regulation, Oman (2014). Annual report, pp. 1–108. https://www.apsr.om/downloadsdocs/annual-reports/Annual_Report_2014_Eng.pdf. [Google Scholar]
36. Authority for Electricity Regulation, Oman (2020). Study on Renewable Energy Resources, Oman. https://energypedia.info/wiki/Oman_Energy_Situation. [Google Scholar]
Cite This Article
 Copyright © 2023 The Author(s). Published by Tech Science Press.
This work is licensed under a Creative Commons Attribution 4.0 International License , which permits unrestricted use, distribution, and reproduction in any medium, provided the original work is properly cited.
 Downloads
 Citation Tools