
 Submit a Paper
 Propose a Special lssue
 Open Access
ARTICLE

Operation State of the Wind Turbine Pitch System Based on Fuzzy Comprehensive Evaluation
1 Engineering Research Center of Hunan Province for the Mining and Utilization of Wind Turbines Operation Data, Hunan University of Science and Technology, Xiangtan, 411201, China
2 XEMC Wind Power Co., Ltd., Xiangtan, 411102, China
* Corresponding Author: Qiancheng Zhao. Email:
(This article belongs to the Special Issue: Wind Energy Development and Utilization)
Energy Engineering 2023, 120(2), 425-444. https://doi.org/10.32604/ee.2023.023049
Received 07 April 2022; Accepted 19 July 2022; Issue published 29 November 2022
 View Full Text
 Download PDF
Abstract
To ensure wind turbine (WT) safe operations and improve the utilization rate of wind energy, effective evaluation of the operation state of the pitch system is critical. Therefore, a new method was proposed to evaluate the operation state of the pitch system of WT based on fuzzy comprehensive evaluation. Firstly, based on SCADA data, the working state of the pitch system under rated power state and power state of WT were analyzed. Secondly, through the analysis of characteristic parameters and physical mechanism of the pitch system, the consistency principle of characteristic parameters, the stability principle of power under rated state, and the stability principle of blade angle underpowered state were obtained. Next, based on the aforementioned principles, the evaluation indexes were established, and the fuzzy comprehensive evaluation method was used to establish the operation state evaluation model of the pitch system under rated power state and under power state of the WT. Finally, an example was provided to verify the effectiveness of the method. The evaluation model established in this study can be used as a technical reference for the online monitoring of WT pitch systems to ensure the safe and stable operation of WTs.Keywords
Wind energy is a clean energy source and has attracted considerable attention for satisfying the ever-increasing demand for energy [1]. Wind turbines (WTs) are used for conversion of wind energy into electricity and provides stable electricity to the grid effectively. To achieve efficient wind energy efficiency and ensure safe operation, adjusting the blade attitude through the WT pitch system is critical to realize blade pitch control [2,3]. Therefore, the operating status of the pitch system directly affects the state of the WT. Thus, evaluation of the operating status of the WT pitch system is needed.
Studies on WT operation status evaluation is mainly focused on the evaluation of the WT and the evaluation of key components. WTs have been evaluated using the mathematical model [4], regression model [5], neural network [6], and machine learning [7]. Ouyang et al. [8] proposed a support vector machine (SVM) method based on data partitioning and data mining to achieve state evaluation. The method contained three kernel functions, and a power curve model was established to analyze the deviation degree of the actual model from the normal model by fitting a normal distribution curve. The performance of the turbine was predicted using multiple linear regression and an artificial neural network in a wide range of duct opening angles [9]. Sun et al. [10] proposed to use the long short-term memory and weighted evaluation method to determine the health level of the WT. A sparse vector is obtained by the orthogonal matching pursuit algorithm, and subsequently the fault feature vector was extracted. The fault feature vectors were input to the improved AdaBoost-SVM classifier to realize WT condition assessment [11].
The pitch system, which is the core control component of WTs, has been investigated extensively. Khurshid et al. [12] proposed the Kalman filter to estimate the blade pitch angle and valve spool position of the blade pitch system for state evaluation. In response to the unbalanced sample categories and complex sample distribution of the operating data of the pitch system of the WT generator system, Tang et al. [13] proposed a method for the fault detection of the pitch system of the WT generator system based on the multiclass optimal margin distribution machine. Zhu et al. [14] proposed multiple model adaptive estimation model based on an extended Kalman filter to estimate the states of the pitch system. Fang et al. [15] proposed a neural network-based condition assessment method for the pitch system based on the characteristic parameters related to the operation status of the pitch system extracted from the SCADA system.
Expert systems and other methods are typically used for evaluating critical components of WTs [16]. In the expert system, historical experience and expert knowledge are used to evaluate the system, and updating the knowledge base is typically slow and difficult to maintain, which affects the feasibility of the method. VIKOR is a multi-attribute decision-making method based on ideal points by maximizing the group utility and minimizing the individual regret value for the trade-off ranking of finite decision options, and is mainly applied to the evaluation and selection of multi-attribute decision options in management science and socio-economic fields [17]. LINMAP is based on a two-by-two comparison of solutions given by the decision-maker and is a useful method used to determine the attribute weights and the optimal solution closest to the positive ideal point. The non-consistent model based on weighted Euclidean distance can be transformed into a linear programming model for solution, but the solution is still complex due to the presence of unconstrained variables in the model, especially in the case of a large number of objectives, and the solution will be high-dimensional [18]. WT system is a complex comprehensive system, which is affected by many factors, the number of system parameters is large, and the effect of each factor on the system is fuzzy. The evaluation method based on fuzzy theory not only overcomes the shortcomings of complexity, but also does not need to rely too much on experimental data, and better process uncertain information. At the same time, it also has a better processing mechanism for the fuzzy and random characteristics of index factors on system state, which makes this method more suitable for the state evaluation of important components of WT in complex operating environment.
In the aforementioned study, 10-min data were used for the analysis of the WT pitch system. However, the 10-min average data cannot reflect the real state of the pitch system satisfactorily. Therefore, this study analyzed the working state of the pitch system in the rated power state and the underpowered state of the WT based on the second-level data obtained from the SCADA data sample library. The characteristic parameters and physical mechanism of the pitch system were analyzed, and the principle of consistency of characteristic parameters, the principle of stability of power under rated state, and the principle of stability of blade angle underpowered state were proposed to evaluate the operation state of the pitch system. Most of the WT operating states are in the rated power state and under power state. Therefore, the evaluation indexes were established and the fuzzy comprehensive evaluation method was applied to establish the evaluation models of the operating status of the pitch system under rated power state and the operating status of the pitch system to realize the evaluation of the operating status of the pitch system of the WT.
2 Introduction of the Pitch System
2.1 Working Principle of the Pitch System
The WT pitch system converts wind energy into electricity by controlling the generator speed to obtain the maximum wind energy utilization [19]. The pitch angle is the included angle between the fan blade and the plane of the wind wheel. When the wind speed is less than the rated wind speed, the pitch system maintains the blade angle at the minimum pitch angle so that the WT is in a state of maximum wind energy absorption. When the wind speed is greater than the rated wind speed and less than the cut-out wind speed, the turbine retains the output power near the rated power by adjusting the blade angle. When the wind speed exceeds the wind speed of the WT cut out, the pitch system accepts the command from the main controller to realize safe WT pitching [20]. The relationship between wind speed, pitch angle, and power are illustrated in Fig. 1.
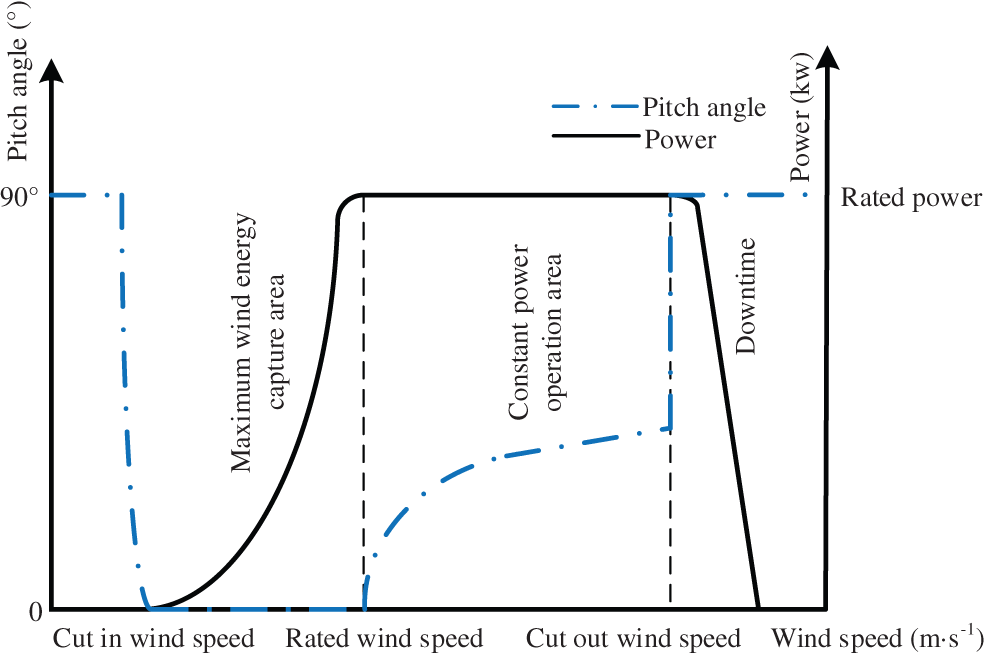
Figure 1: Variation curve of pitch system characteristics
2.2 Working State of the Pitch System
The pitch system is a key part of the WT control system. The pitch system behaves differently for different WT operating states.
When the actual wind speed is greater than or equal to the rated wind speed, and the output power of the WT remains near the rated power, the WT is in the rated power state. To ensure the stable power output of the WT, the pitch system adjusts the blade angle and wind energy generation by the unit according to the feedback power signal. Fig. 2 reveals that when the wind speed of the WT is greater than the rated wind speed, the pitch system adjusts the blade angle according to the wind speed to ensure stable output power of the WT.
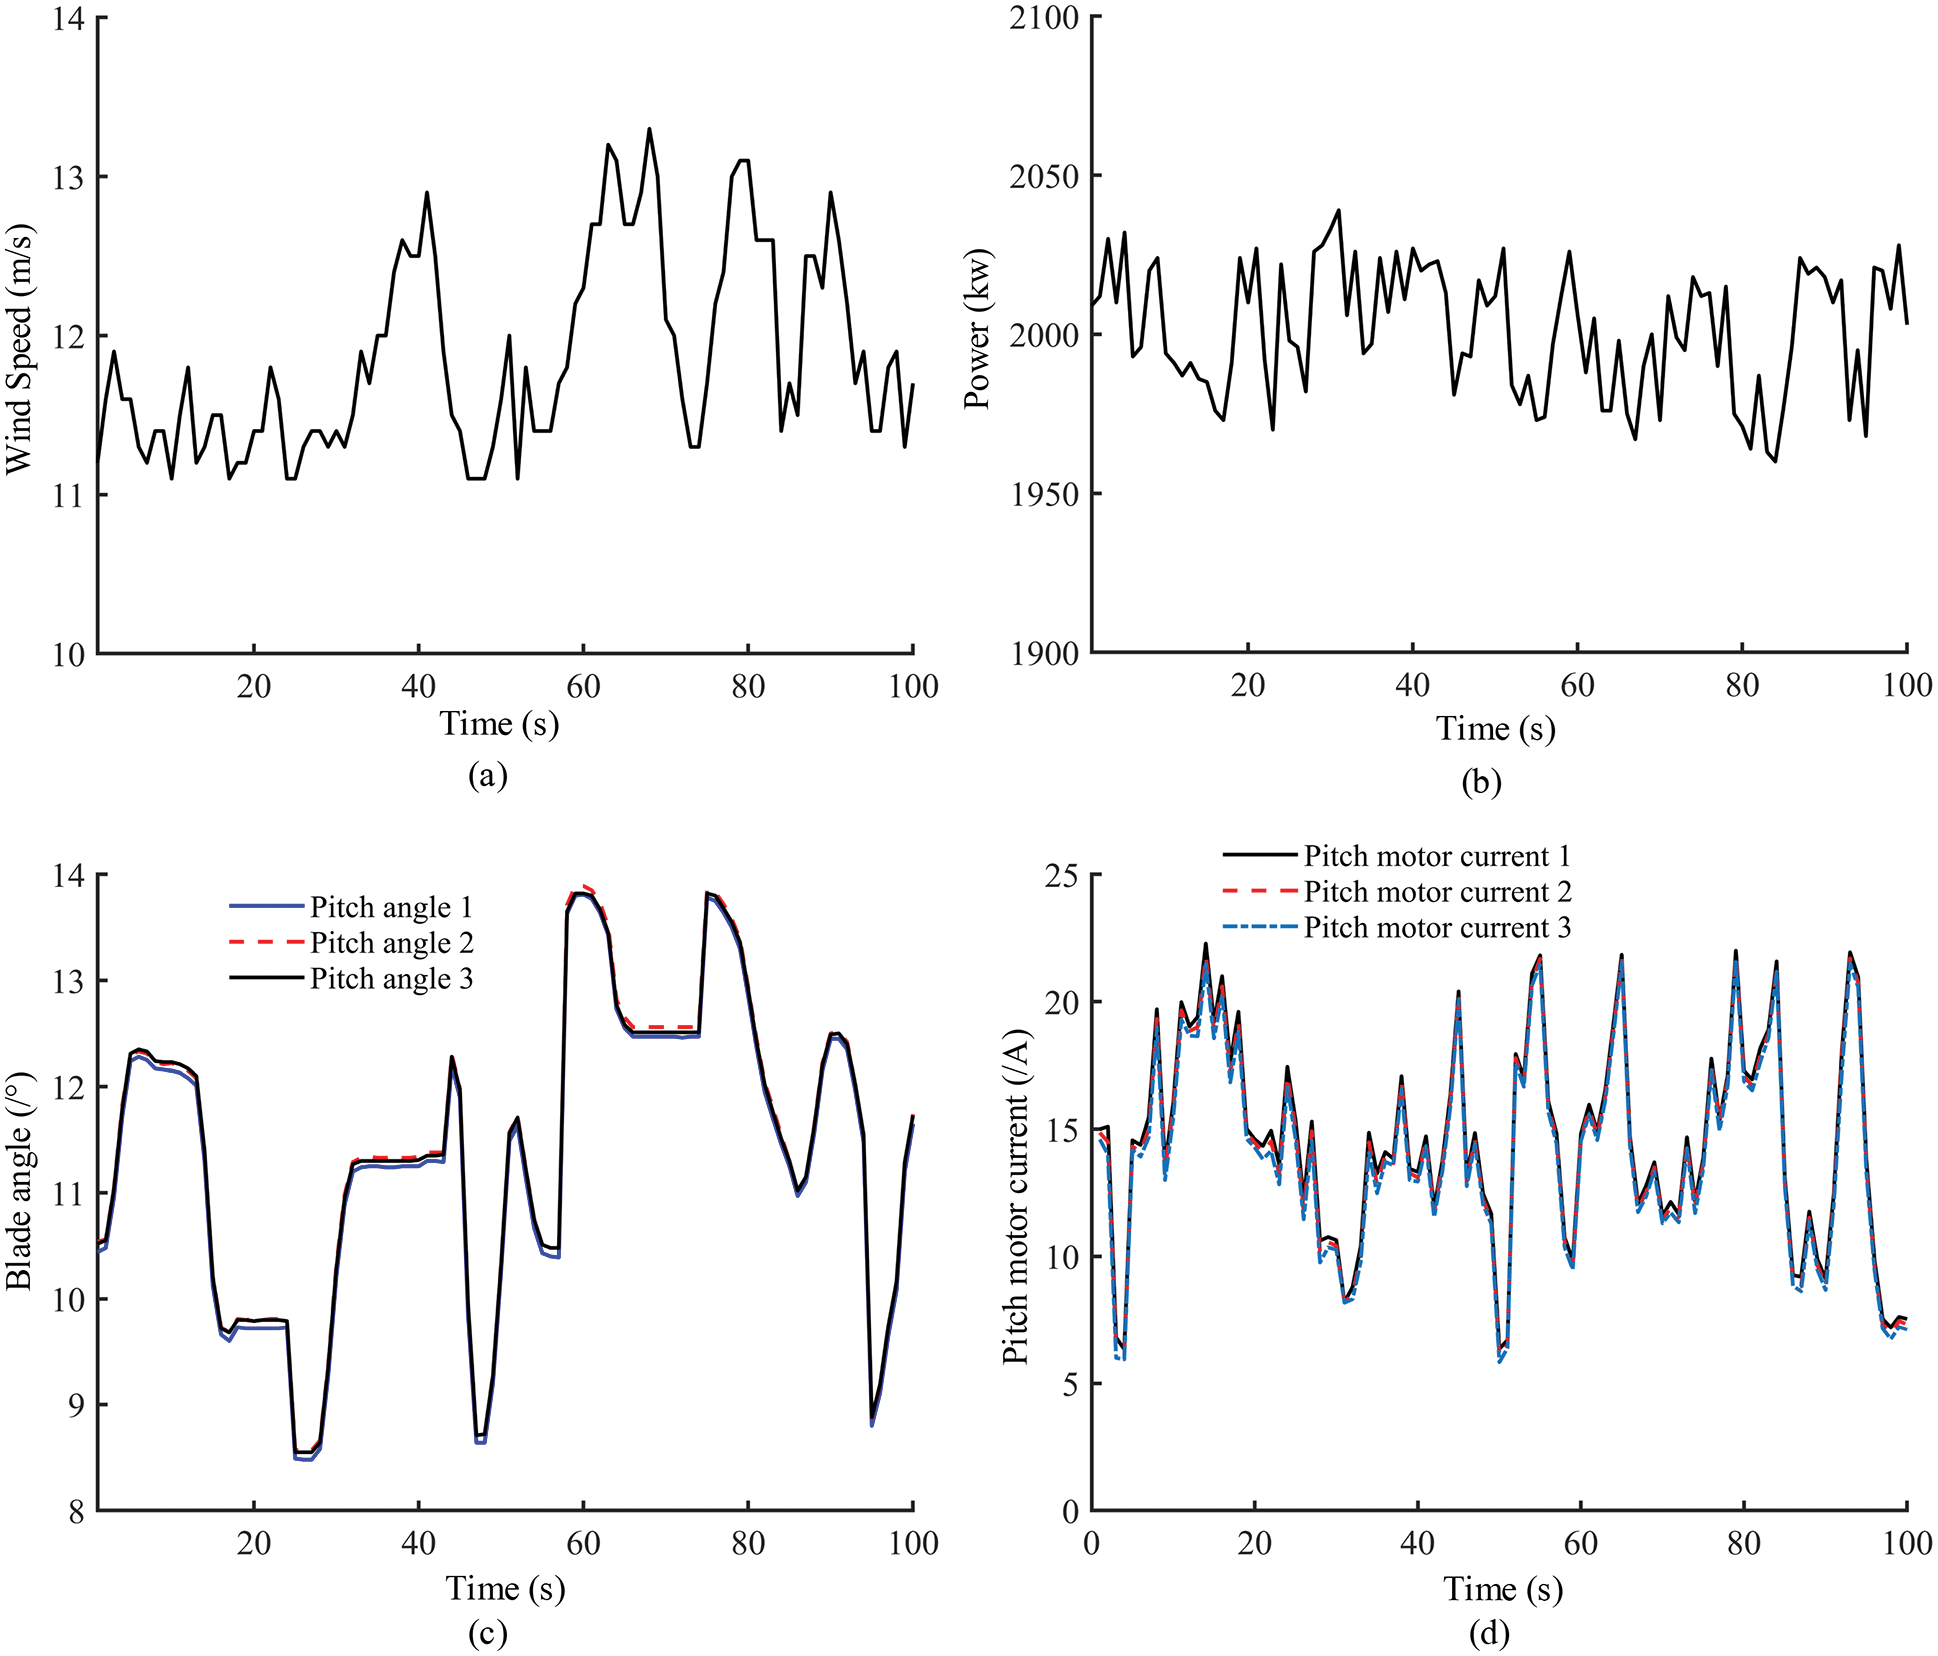
Figure 2: Rated power state, (a) Wind speed, (b) Power, (c) Blade angle, (d) Pitch motor current
The underpowered state refers to the operation state where the generator is connected to the grid, but the wind speed does not reach the rated wind speed; therefore, the WT is below the rated power. The output power of the WT does not reach the rated power, but the WT is in the power generation state, and the main purpose of the pitch system in this state is to ensure that the wind energy is captured to the maximum extent. Fig. 3 reveals that when the WT is in the underpowered state, the blade angle is kept near 0° to let the unit fully utilize the wind energy.
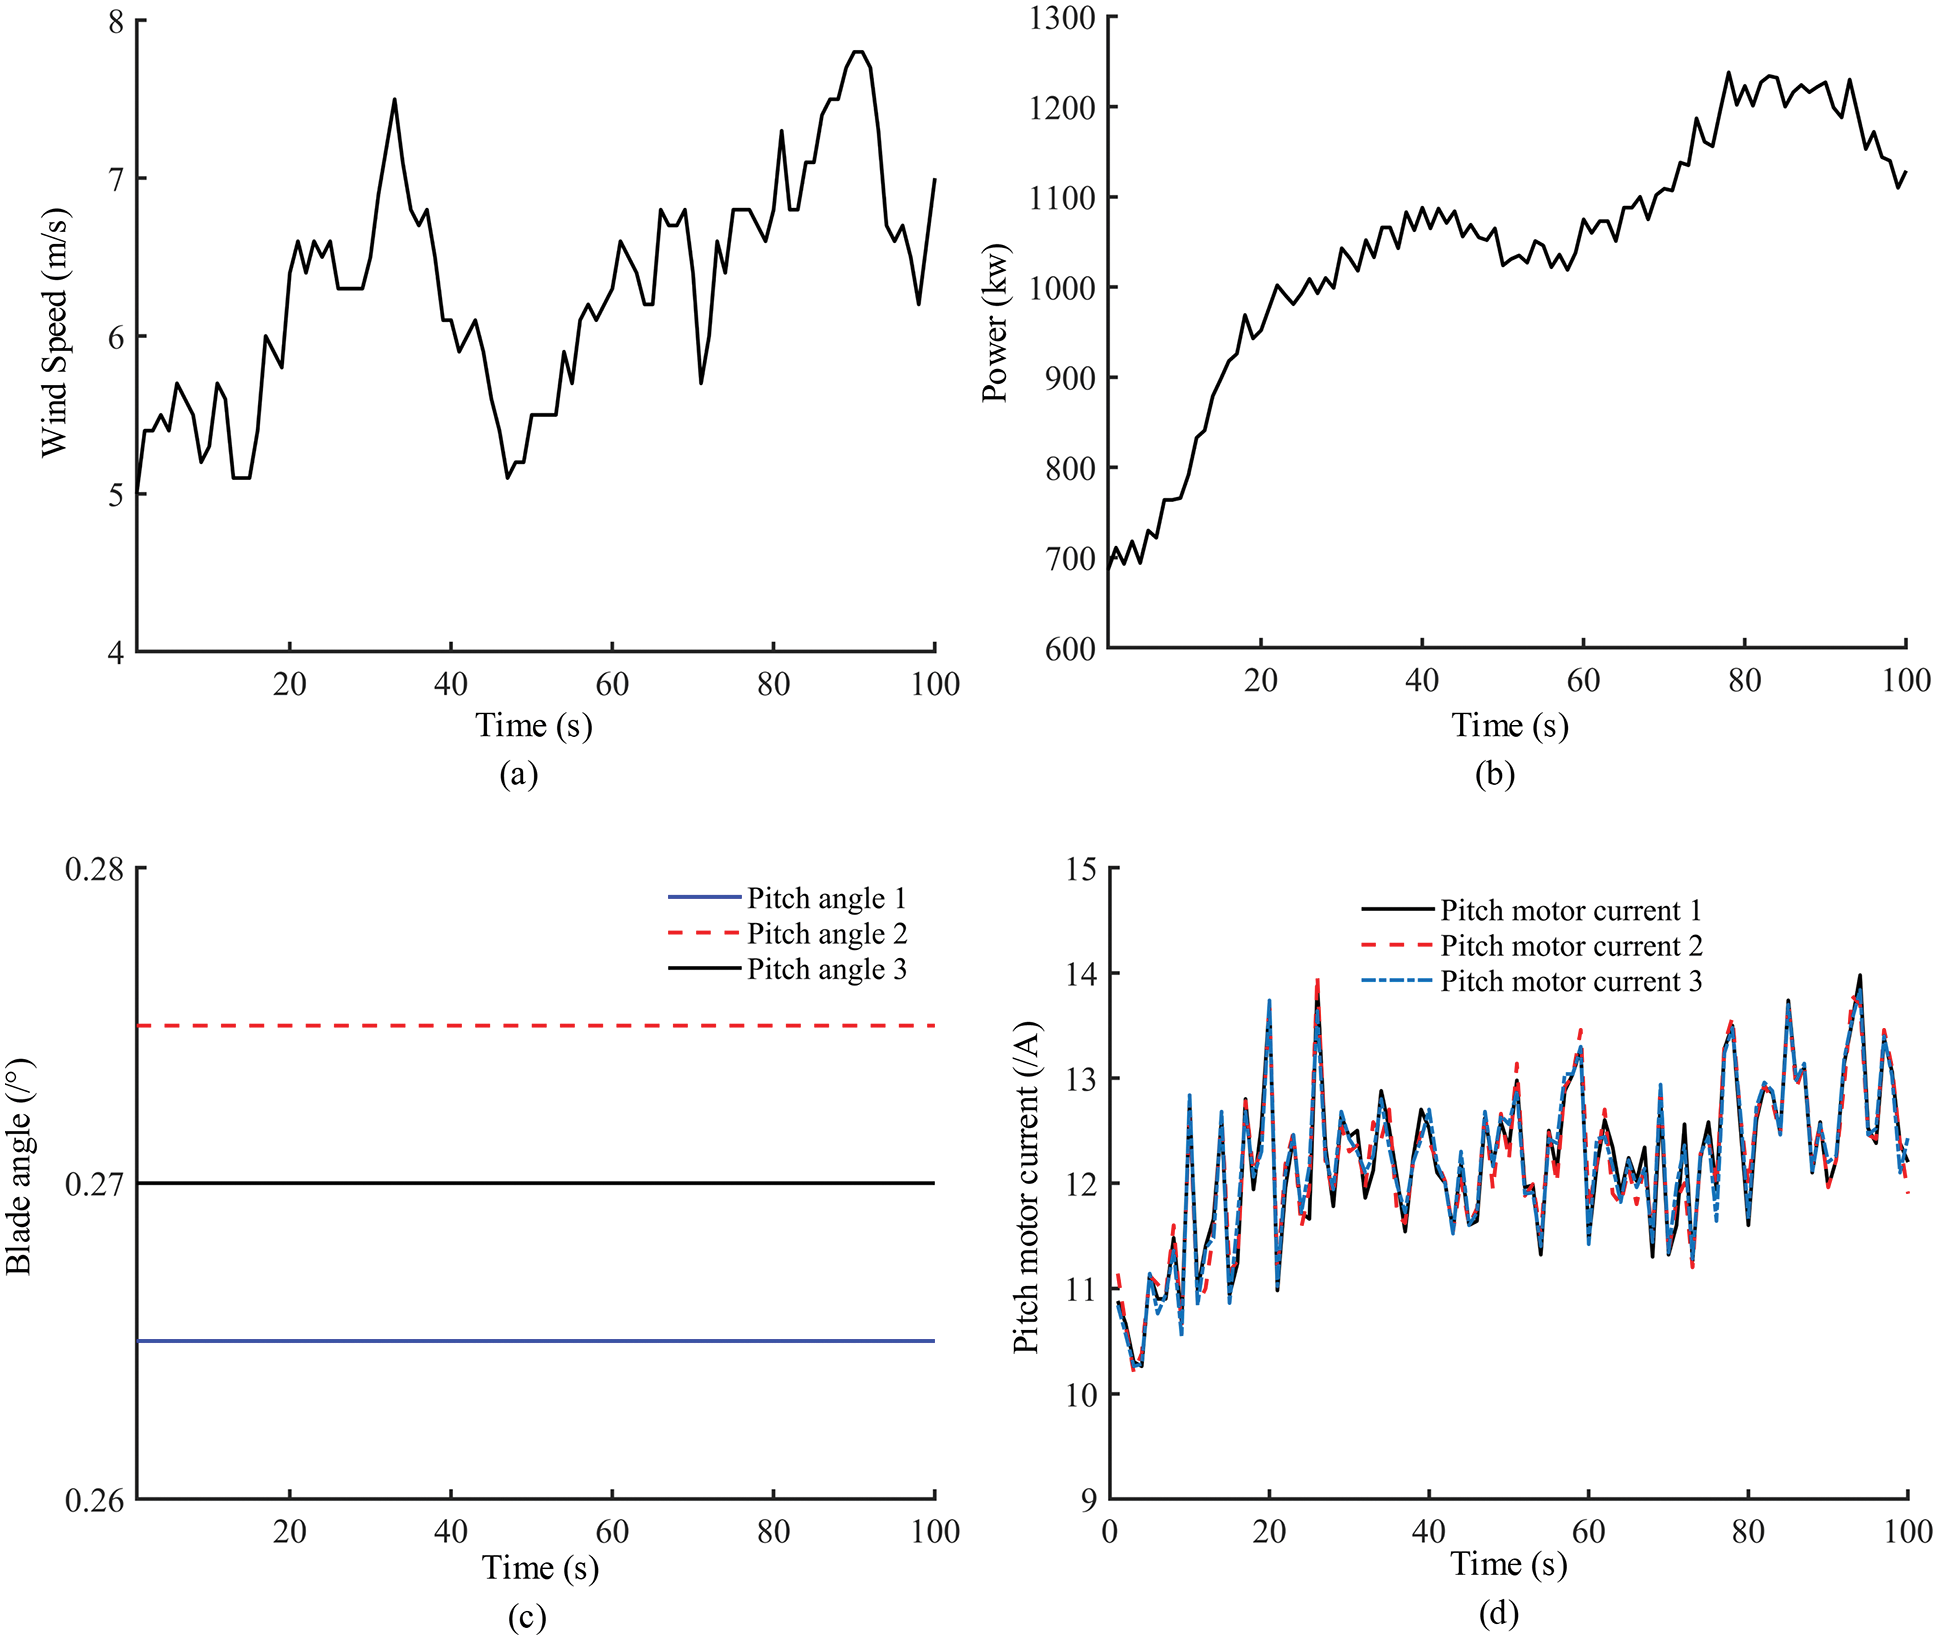
Figure 3: Underpowered state, (a) Wind speed, (b) Power, (c) Blade angle, (d) Pitch motor current
2.3 Control Method of the Pitch System
The pitch angle variation is realized by controlling the current of the pitch motor and using the stalling torque and wind speed to achieve the pitch and ensure stable operation of the system. Current control exists in all states of the WT. The pitch motor current changes according to the actual wind speed condition. When the actual wind speed increases or decreases, the pitch motor current also increases or decreases to adjust the blade angle at the right position. The WT underpower condition and rated power condition were analyzed. Fig. 4 displays the pitch state under the underpower condition. In the underpower condition of the WT, the pitch system does not change angle, but the locked-rotor current still maintained to keep pitch system working. The current follows the wind speed variation. Therefore, the blade angle is kept near 0° so that the WT can capture the maximum energy.
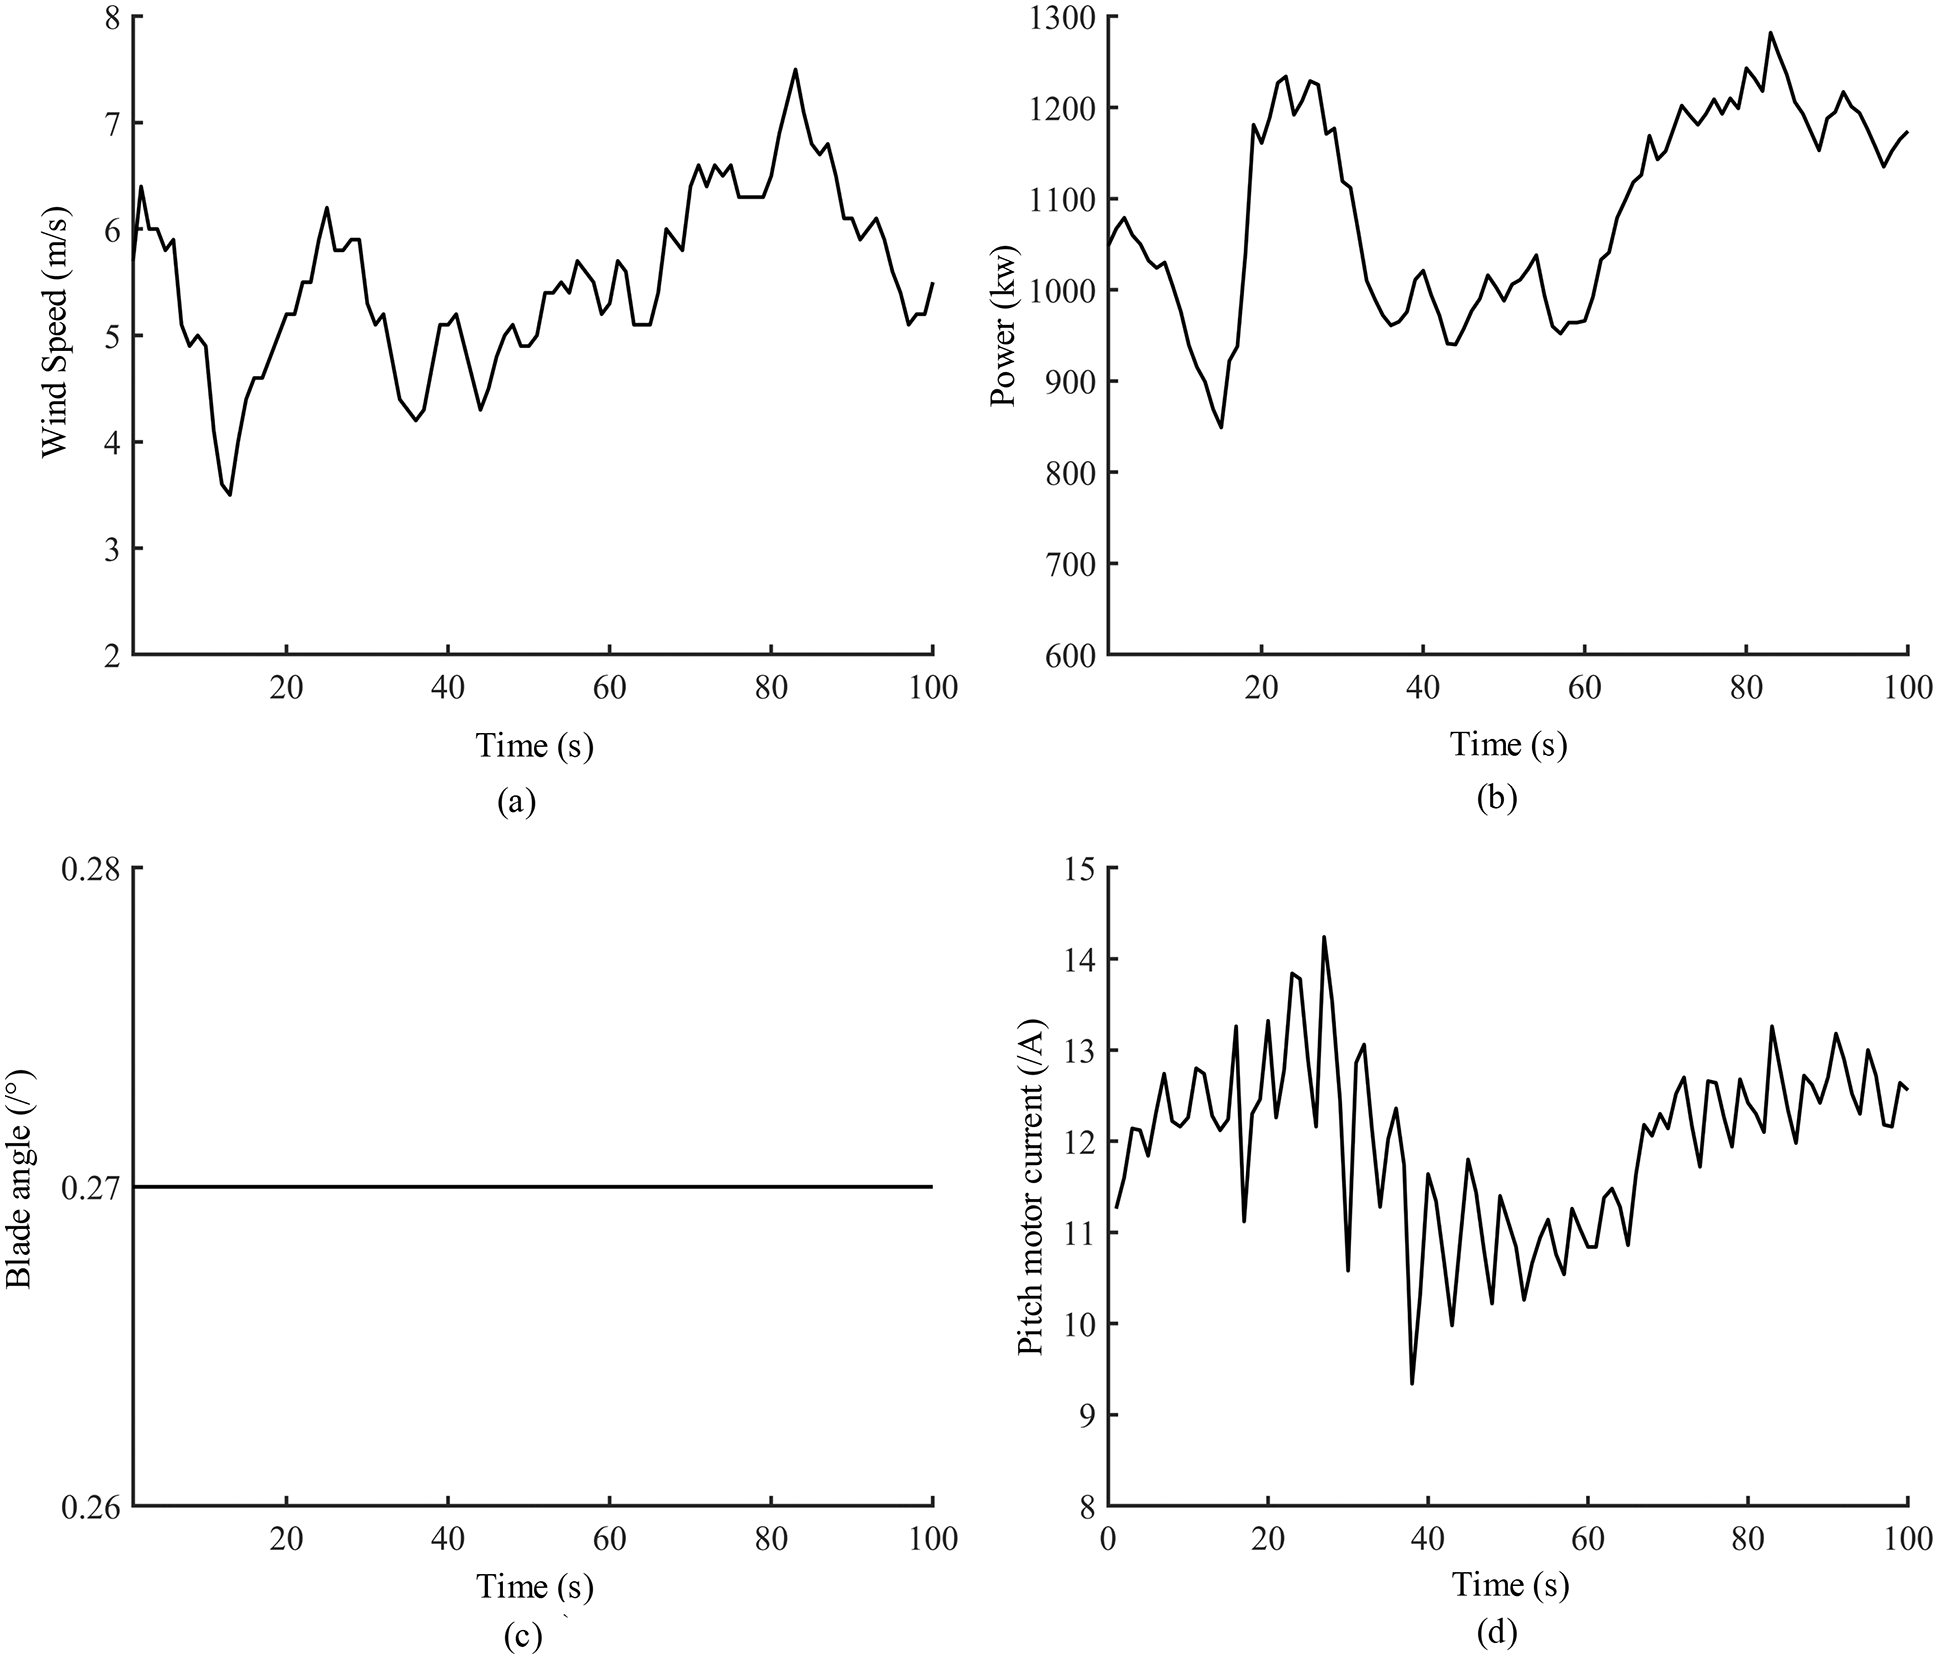
Figure 4: Pitch state in the underpowered condition, (a) Wind speed, (b) Power, (c) Blade angle, (d) Pitch motor current
The pitch state at rated power is displayed in Fig. 5. The figure reveals that when the wind speed increases or decreases rapidly under the rated power condition, the pitch system controls the blade angle by locked-rotor current. Therefore, the output power of the WT is still maintained near the rated power.
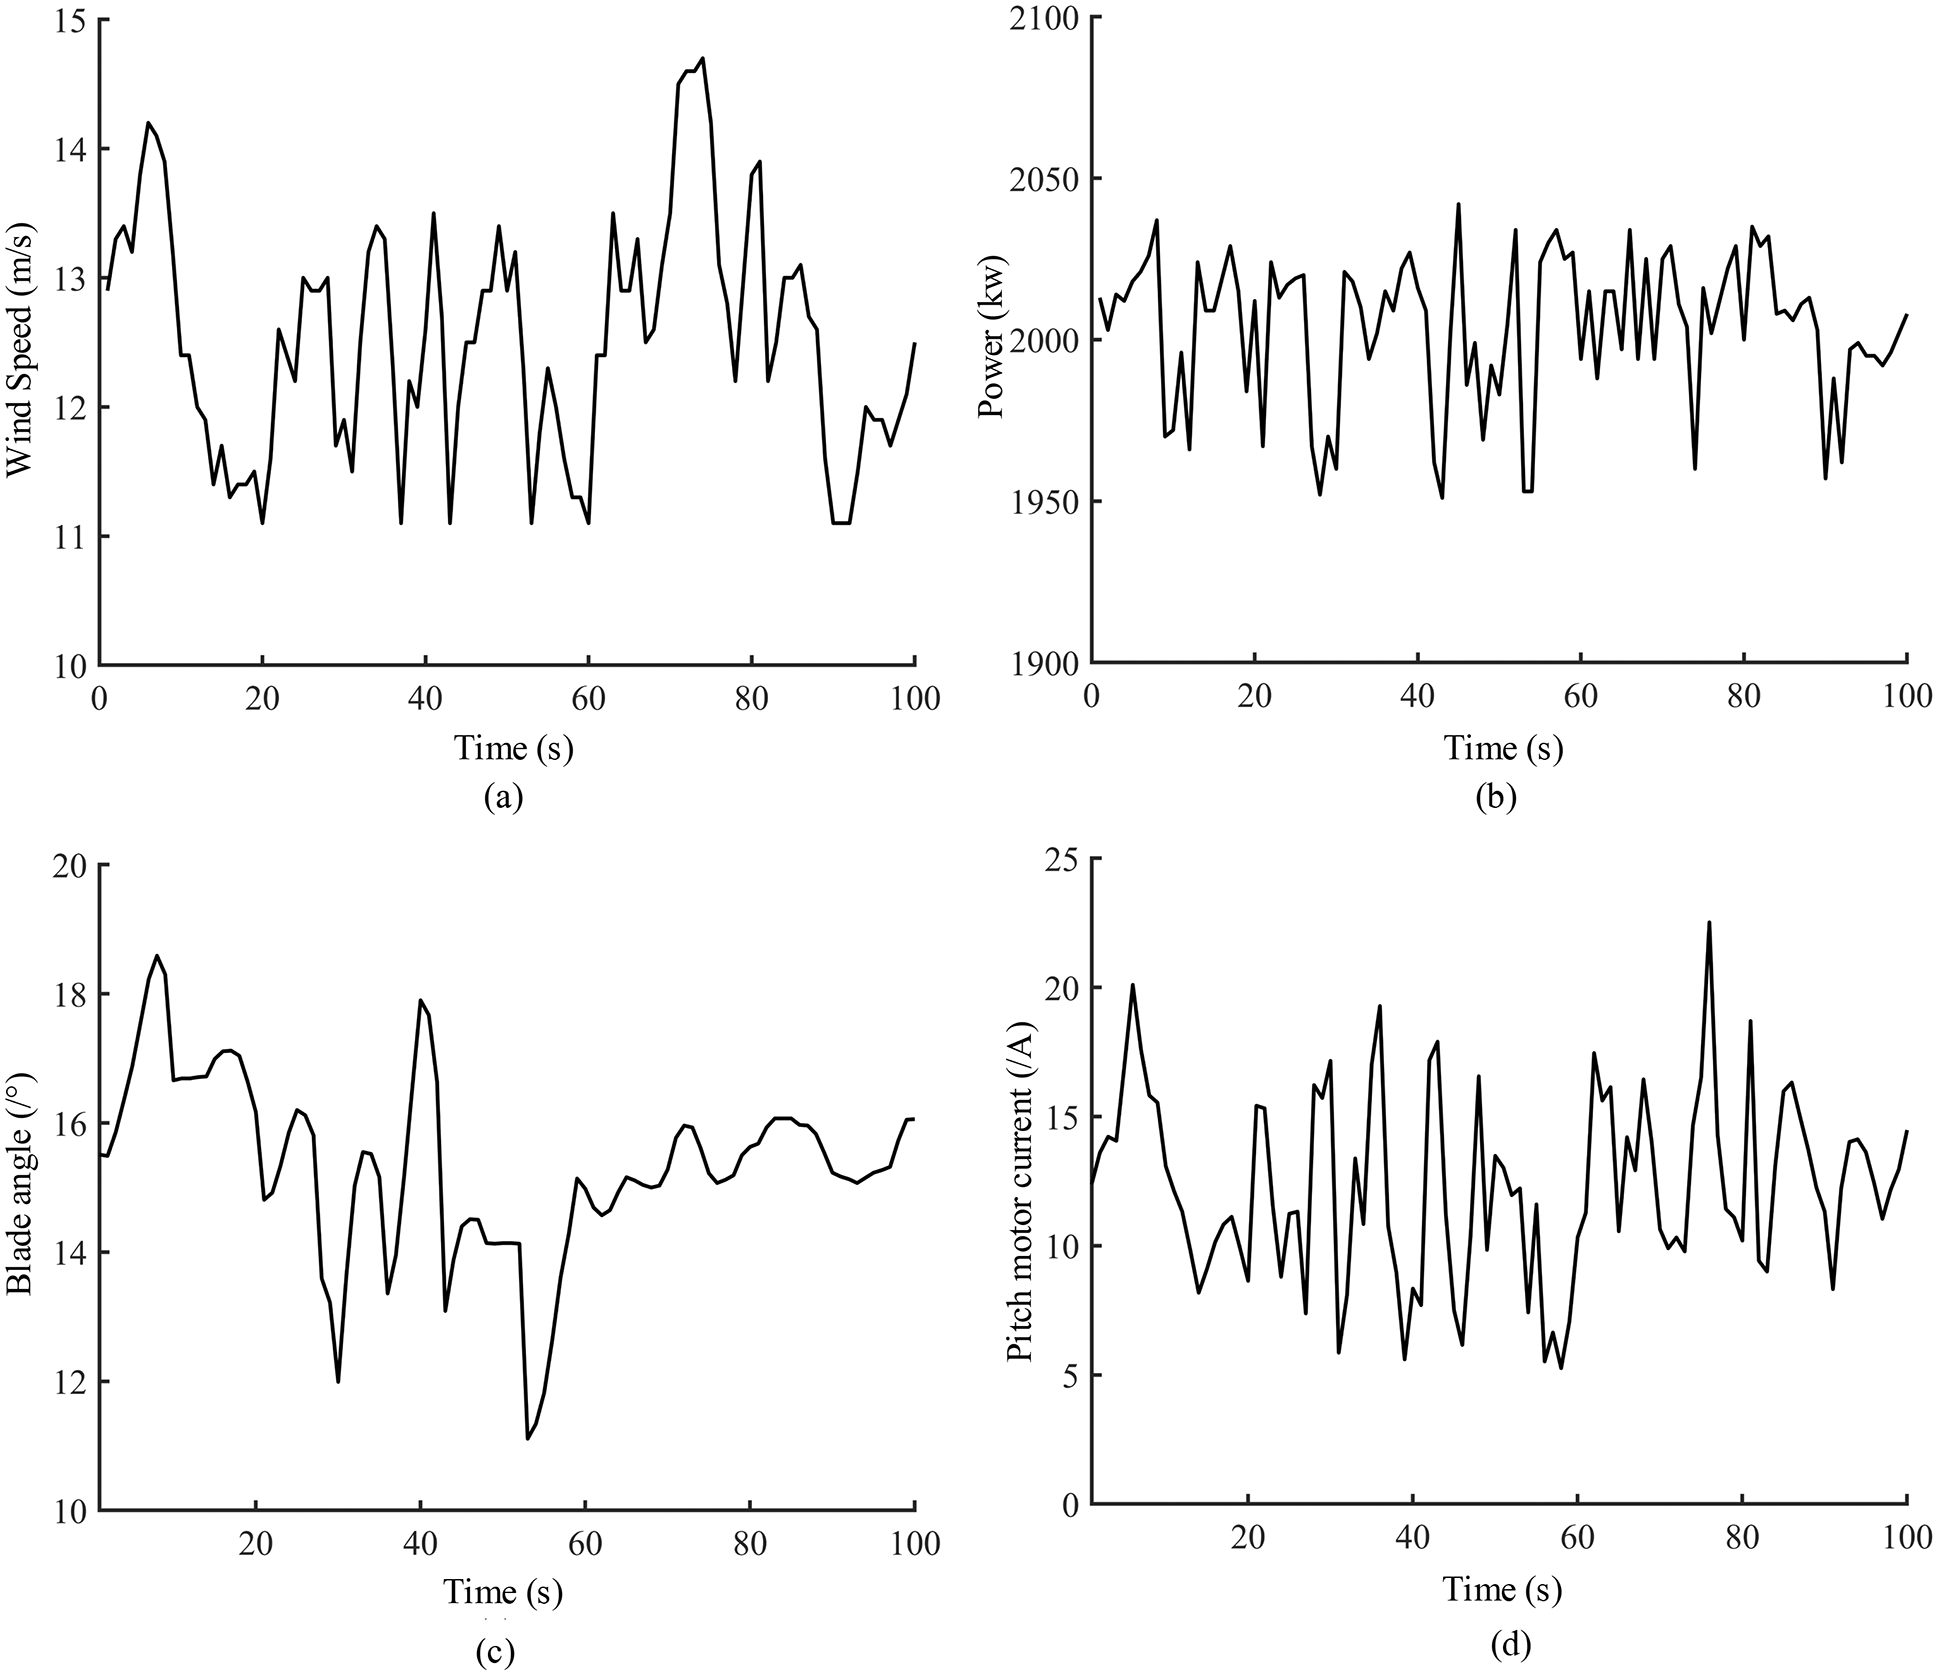
Figure 5: Pitch state at the rated power condition, (a) Wind speed, (b) Power, (c) Blade angle, (d) Pitch motor current
3 Pitch System Characteristic Parameters Analysis
In this study, a 2-MW WT with a rated power of 2000 kW, cut-in wind speed of 3 m/s, rated wind speed of 11 m/s, and cut-out wind speed of 25 m/s, was investigated. The SCADA data selected were second-level data for July 2017. The SCADA system records the characteristic parameters corresponding to the pitch system, mainly including wind speed, power, blade pitch angle, and pitch motor current.
3.2 Characteristic Parameter Characteristic
(1) Consistency properties of feature parameters
Analyses of the pitch angle and pitch motor current data in the WT SCADA data and the physical mechanism revealed that the three pitch angles and pitch motor currents of the WT system should maintain similar trend and be close in value under normal operating conditions, as displayed in Figs. 2, 3 and 6.
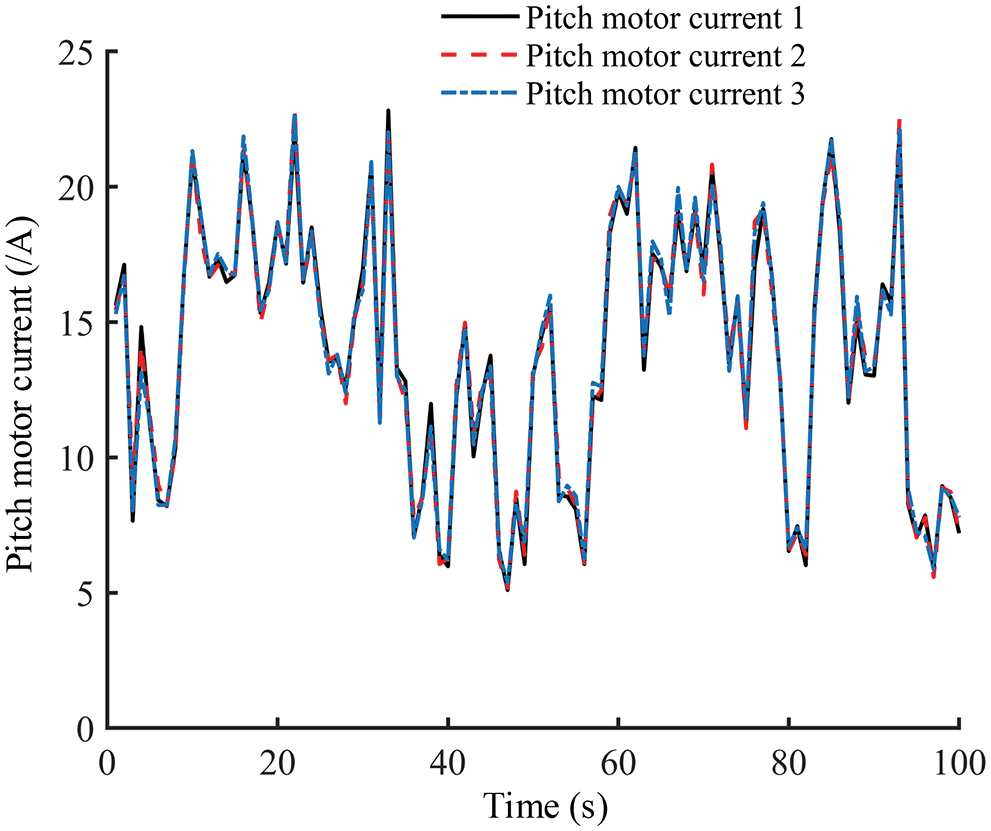
Figure 6: Pitch motor current
(2) Power stability under the rated state
When the WT is at rated power, the pitch system adjusts the blade angle according to the wind speed to ensure the stable output power of the WT as displayed in Fig. 2.
(3) Stability of the blade angle in the underpower condition
When the WT is in underpowered condition, the pitch system should stabilize the blade angle to work near 0° to allow the WT to obtain maximum wind energy, as displayed in Fig. 3.
4 Pitch System Evaluation Index
The power stability index,
The power generation capacity of WTs is directly reflected by the output power of the turbine; therefore, the stability of the output power is a critical measure of the power generation capacity of WTs. The ratio of WT power fluctuation to its own installed capacity is
where
The variance of the three pitch angles is calculated separately, and then the average value of the variance of the three pitch angles is calculated. Finally, the average value of the variance of the pitch angles is used as the angle stability index R2 as follows:
where
Three thousand sets of data of WT in normal operation were selected to develop the BP prediction model. The wind speed, three blade pitch angles, and three pitch motor current data were used as model inputs and the output was power. Here, 70%, 15%, and 15% of the sample data were selected as training data, validation data, and test data, respectively. The power residual is the difference between the actual power value of the WT and the predicted power value of the model. The theoretical wind speed power data provided by the wind farm was used to obtain the theoretical power,
where
4.4 Pitch Angle Pitch Motor Current Consistency Index
Dynamic time regularisation algorithm (DTW) is used to measure the similarity between two time series. In this study, we first calculate the three pitch angles and three pitch motor currents separately to obtain the corresponding DTW distances. Next, the average relative deviation values of the corresponding DTW distances are calculated, and finally weight the average relative deviation values of the pitch angles and the average relative deviation values of the pitch motor currents were calculated to obtain the comprehensive consistency index R4.
where
5 Development of the Fuzzy Evaluation Model for the WT Pitch System
Fuzzy comprehensive evaluation is the process of using fuzzy mathematics to quantify all the factors and indicators related to the evaluated parameter. Next, a reasonable comprehensive evaluation of each evaluation object was used by the principle of fuzzy relationship synthesis. In this study, the evaluation index is established by analysing the operation status of the pitch system, and the fuzzy comprehensive evaluation model was used to evaluate the pitch system of WT, and the flow chart is displayed in Fig. 7.
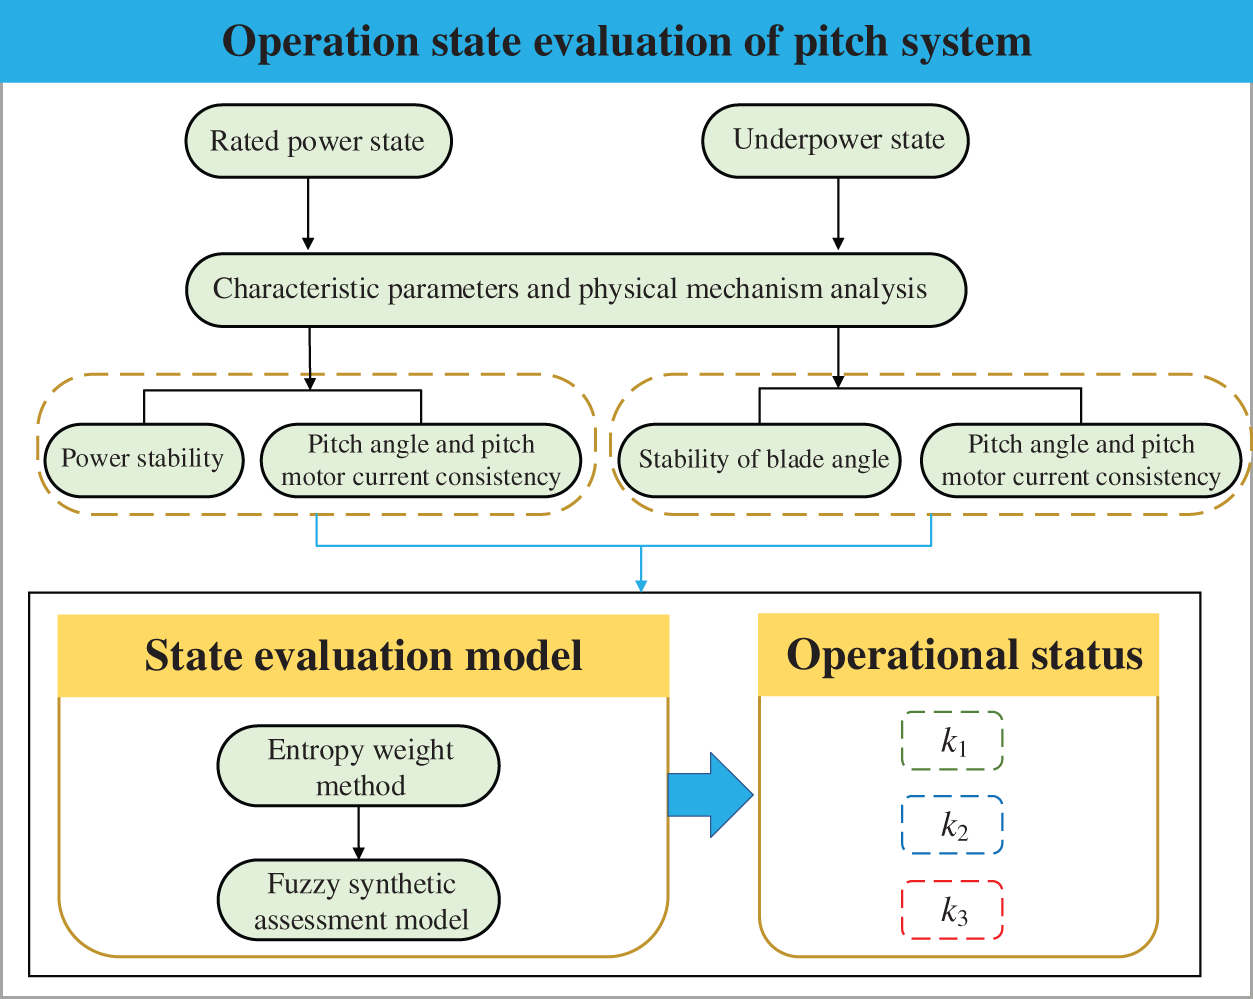
Figure 7: Flowchart of proposed in this study
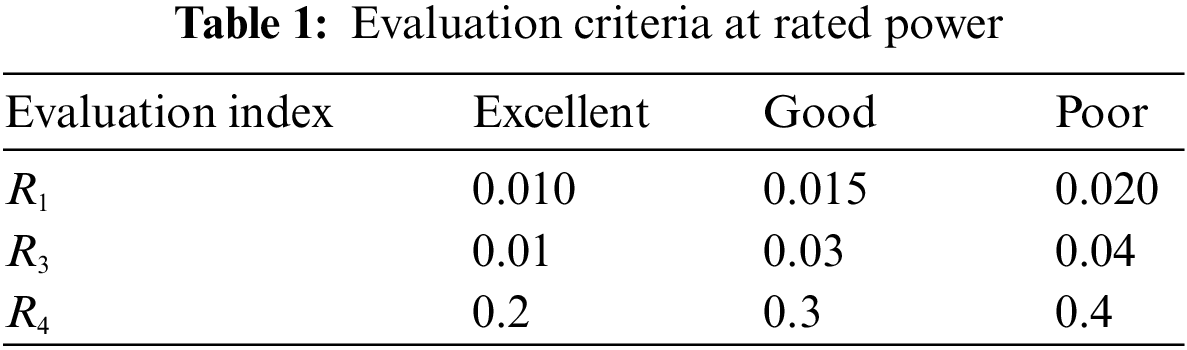
5.1 Establishing the Appropriate Evaluation Set and Evaluation Criteria
The evaluation set is the set of comprehensive evaluation results of the WT pitch system, and the number of elements in the evaluation set is related to the complexity of the evaluation process [21,22]. To obtain reasonable evaluation results, the evaluation set of three elements was selected as the evaluation set for the evaluation of the WT pitch system in rated power state and under power state. Thus, the evaluation set was determined as
Power stability index
Because calculating the distribution function of the triangular and semi-trapezoidal combination is easy and does not differ considerably from the results calculated by other complex affiliation functions [23]. In this study, this function is used to establish the affiliation functions of each indicator corresponding to various state levels.
For smaller, the membership function is calculated as follows:
where
For Intermediate type, the membership function is calculated as follows:
where
For larger, the membership function is calculated as follows:
where
5.3 Determination of Evaluation Index Weights
The key link in fuzzy comprehensive evaluation is the value of the weights, which directly reflects the degree of influence of various assessment indicators on the evaluation results [24]. The value of the weights is generally determined by expert experience, which is typically highly subjective and not conducive to reflecting objective facts. To reduce the subjectivity present in determining the weights and ensure the evaluation results become reliable, the entropy weight method is used to determine the index weights. The entropy weighting method is based on the principle that the smaller the variability of an indicator, the less information it reflects, and the lower its corresponding weight should be [25]. Assuming that m evaluation indicators and n objects exists, for the j-th indicator, its calculation formula is as follows:
Let the information utility value and the weight of the j-th indicator be
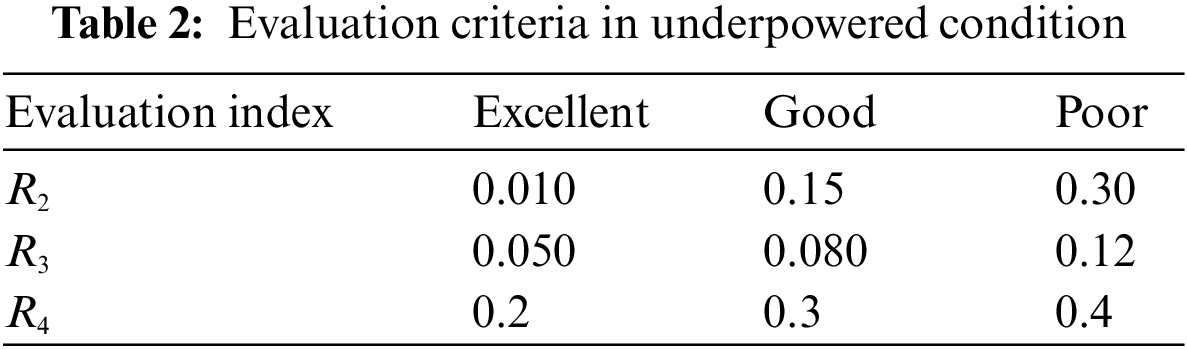
To verify the effectiveness and accuracy of the evaluation method of the WT pitch system proposed in this study, two sets of data in the underpowered condition and three sets of data under the rated power condition of the WT were selected for analysis. Here, 300 data points were obtained for each set of data. Each evaluation index obtained by calculating each group of data is presented in Table 3. In this paper, the distribution function of triangle and semi trapezoid combination is selected to establish the membership function of each index corresponding to different state levels. As shown in Fig. 8.
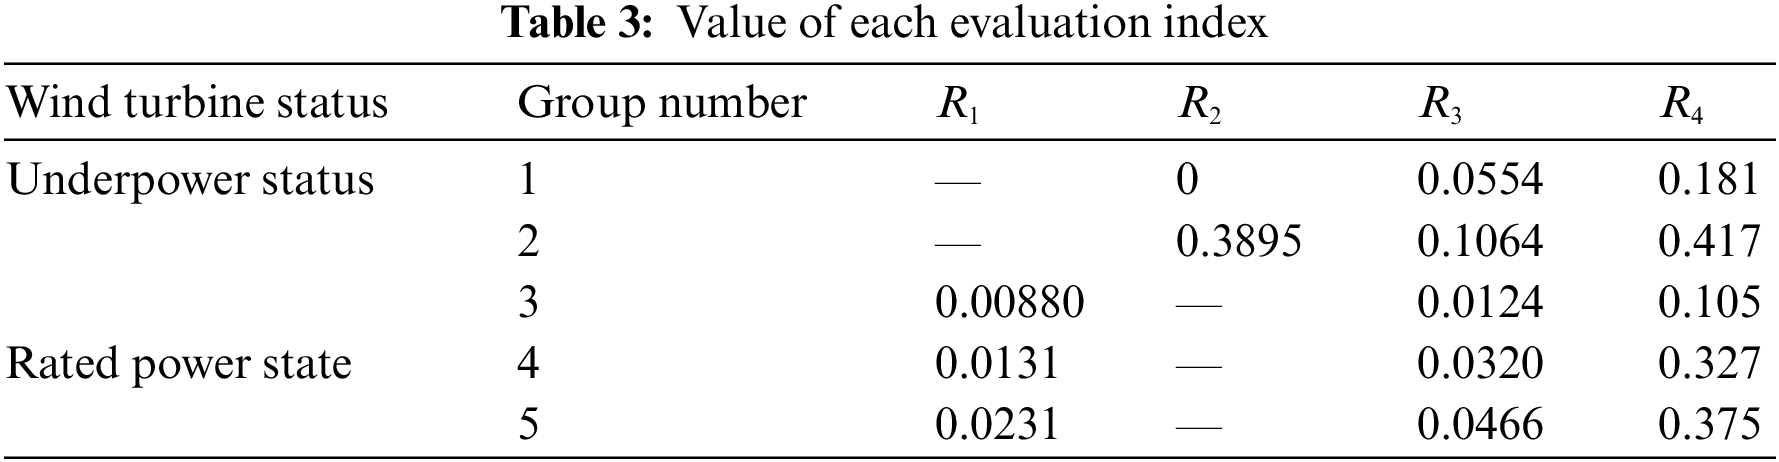
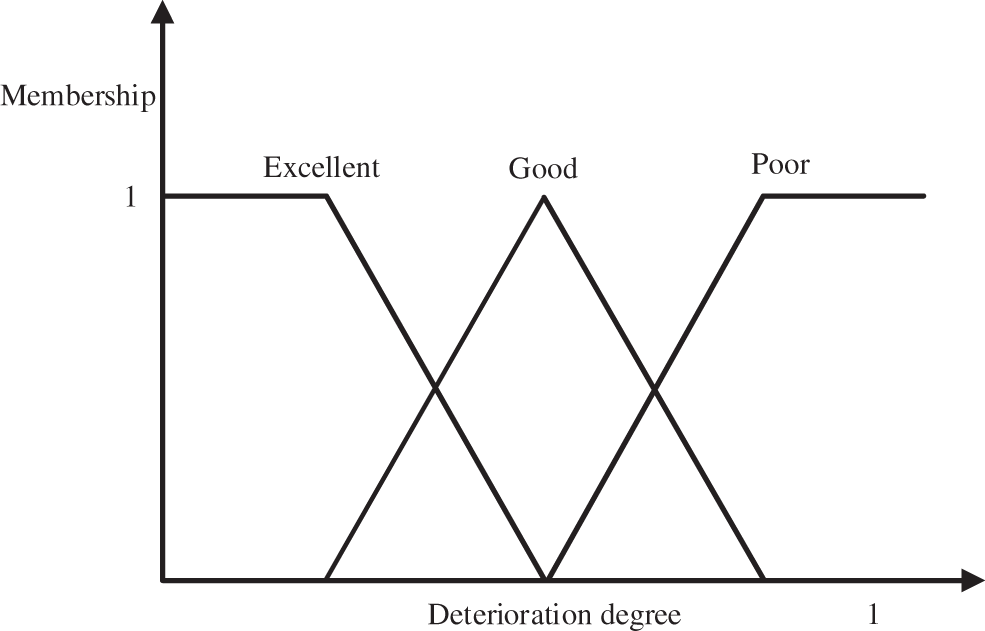
Figure 8: Distribution map of half-ladder-shaped and triangular membership function
Because the pitch system of WT in rated power state is primarily used to maintain the stability of power, the pitch system of WT in under power state is primarily to maintain the stability of pitch angle. Therefore, the evaluation index weights of these two states are not the same. By using the entropy weighting method, the evaluation index weight of the pitch system in the underpowered state is
The results of the state evaluation of the pitch system in the underpowered and rated power states according to the fuzzy judging principle are as follows:
According to the principle of maximum affiliation, the affiliation degrees of B1, B2, B3, B4 and B5 are 0.960, 0.9242, 0.967, 0.701 and 0.929, respectively, which leads to the evaluation results of group 1 and group 3 data as excellent, the evaluation results of group 4 data are good and the evaluation results of group 2 and group 5 as poor respectively. The data timing diagram of group 1 data is displayed in Fig. 9, which reveals that when the WT is in the underpowered state, the pitch motor current changes with the wind speed, the stability of the blade angle is good and remains basically unchanged, and the consistency of the pitch motor current is good, which is consistent with the evaluation results of this paper.
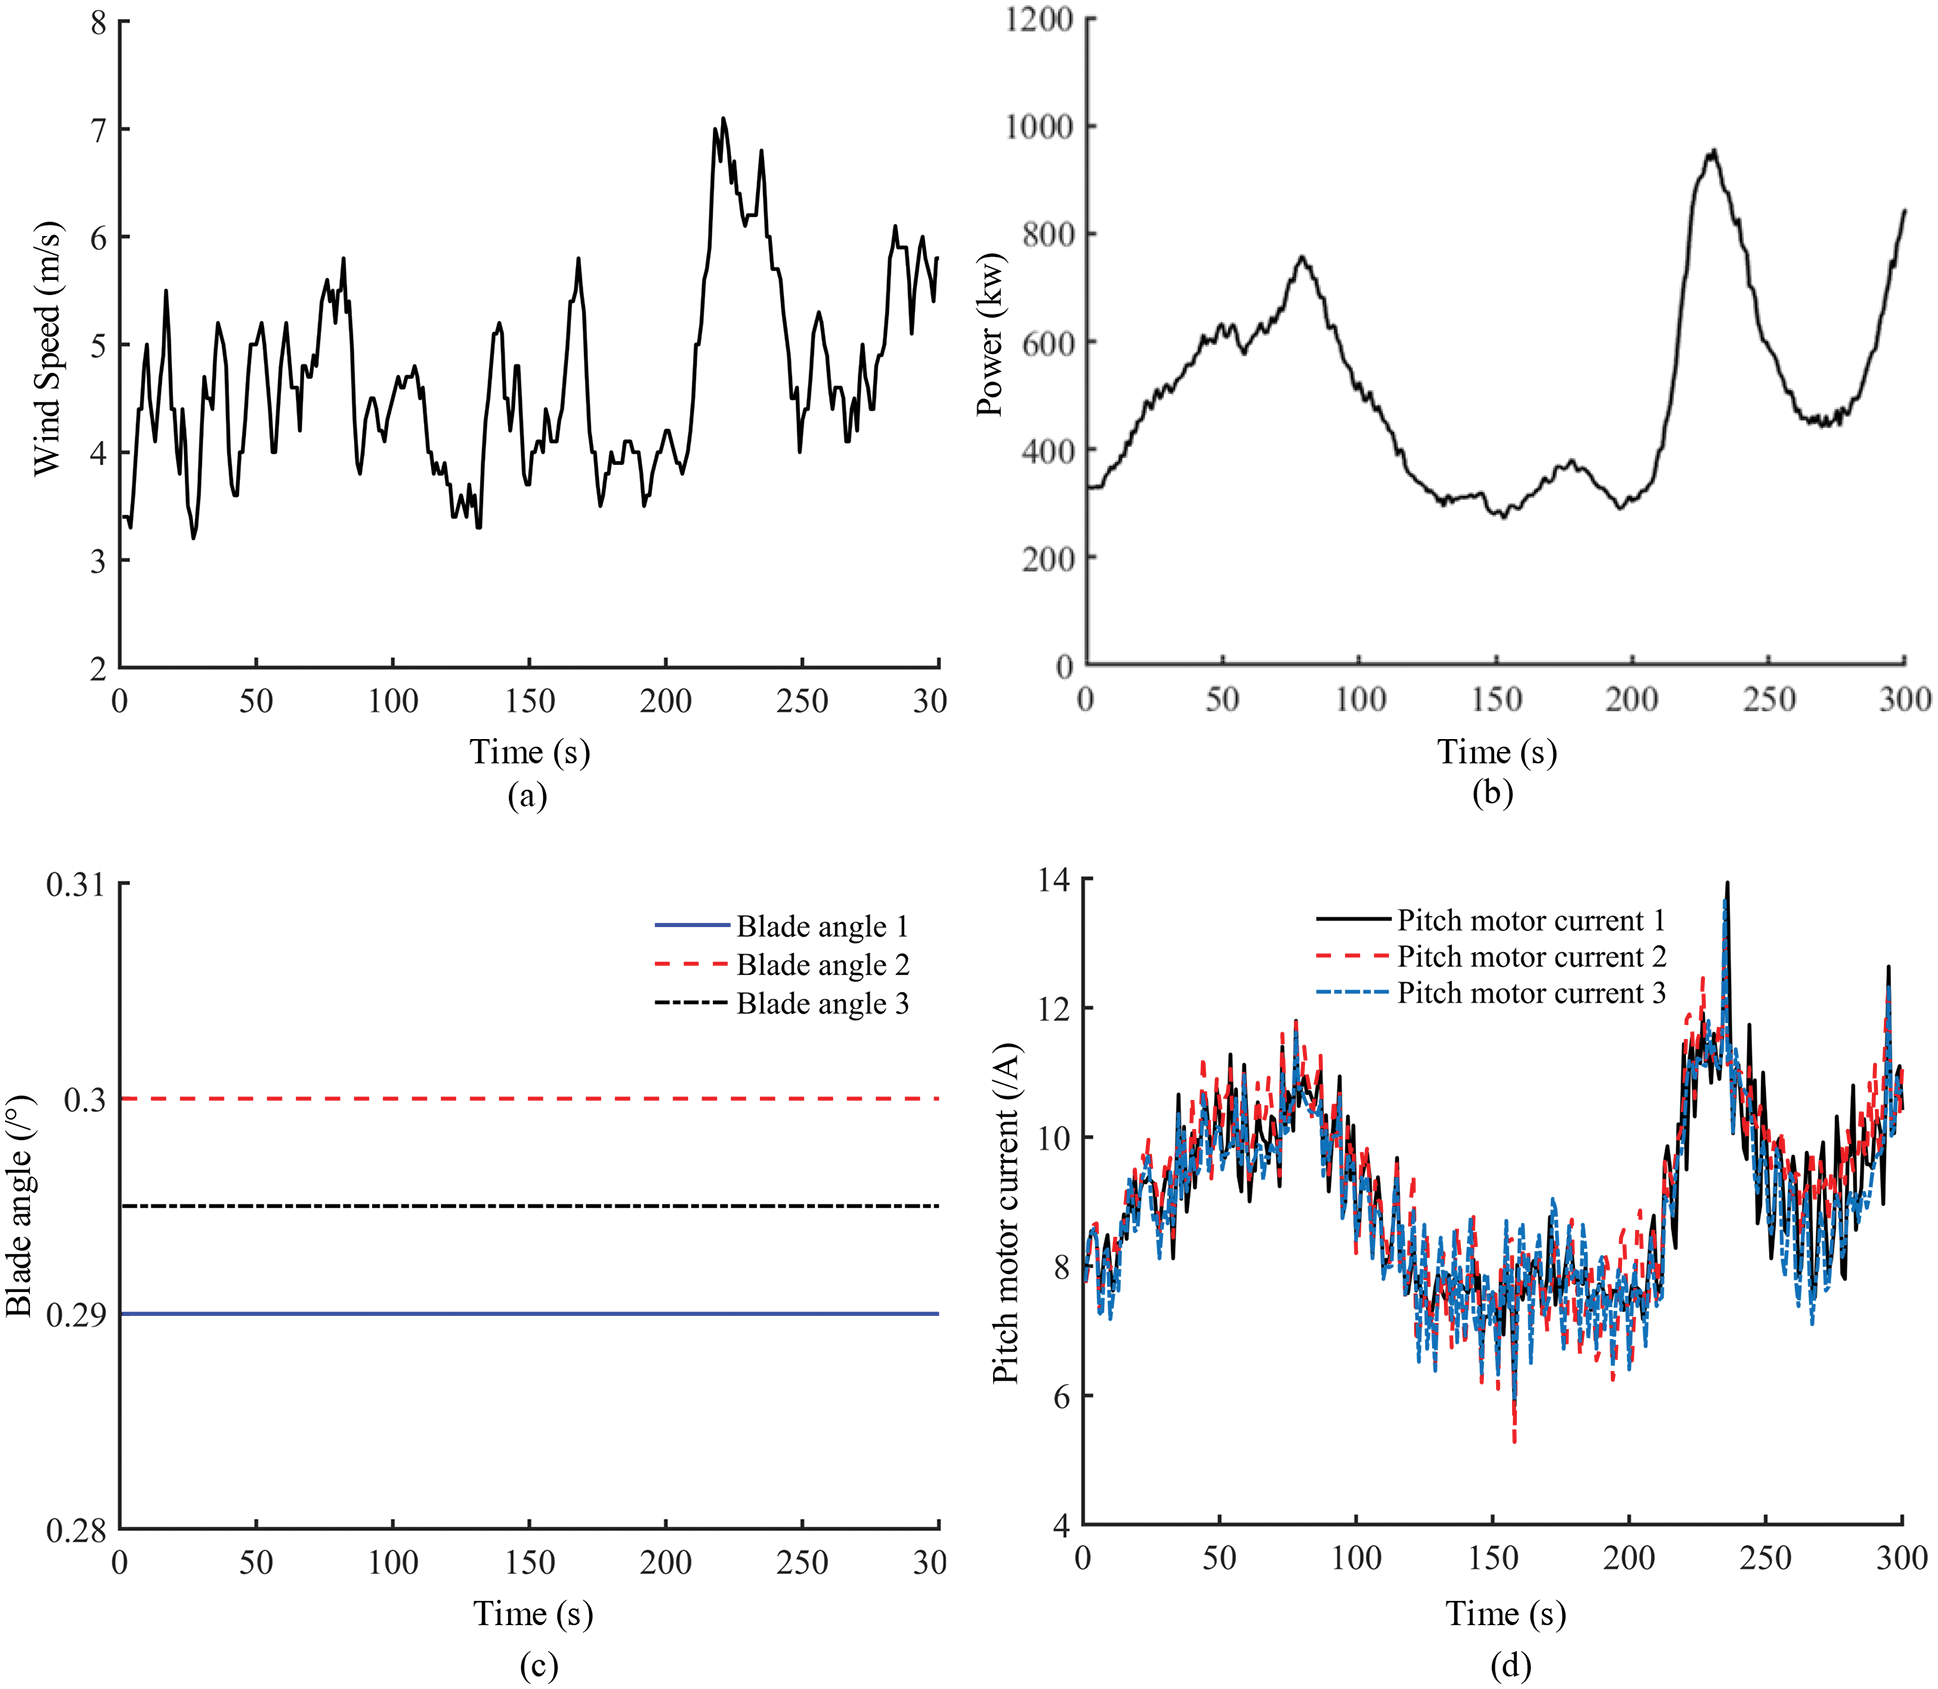
Figure 9: First set of data underpowered state, (a) Wind speed, (b) Power, (c) Blade angle, (d) Pitch motor current
The data timing diagram of group 2 data is displayed in Fig. 10. It can be seen that when the WT is underpower state, the fluctuation of blade angle is large, and the consistency of pitch motor current is poor, which is basically consistent with the evaluation results in this paper.
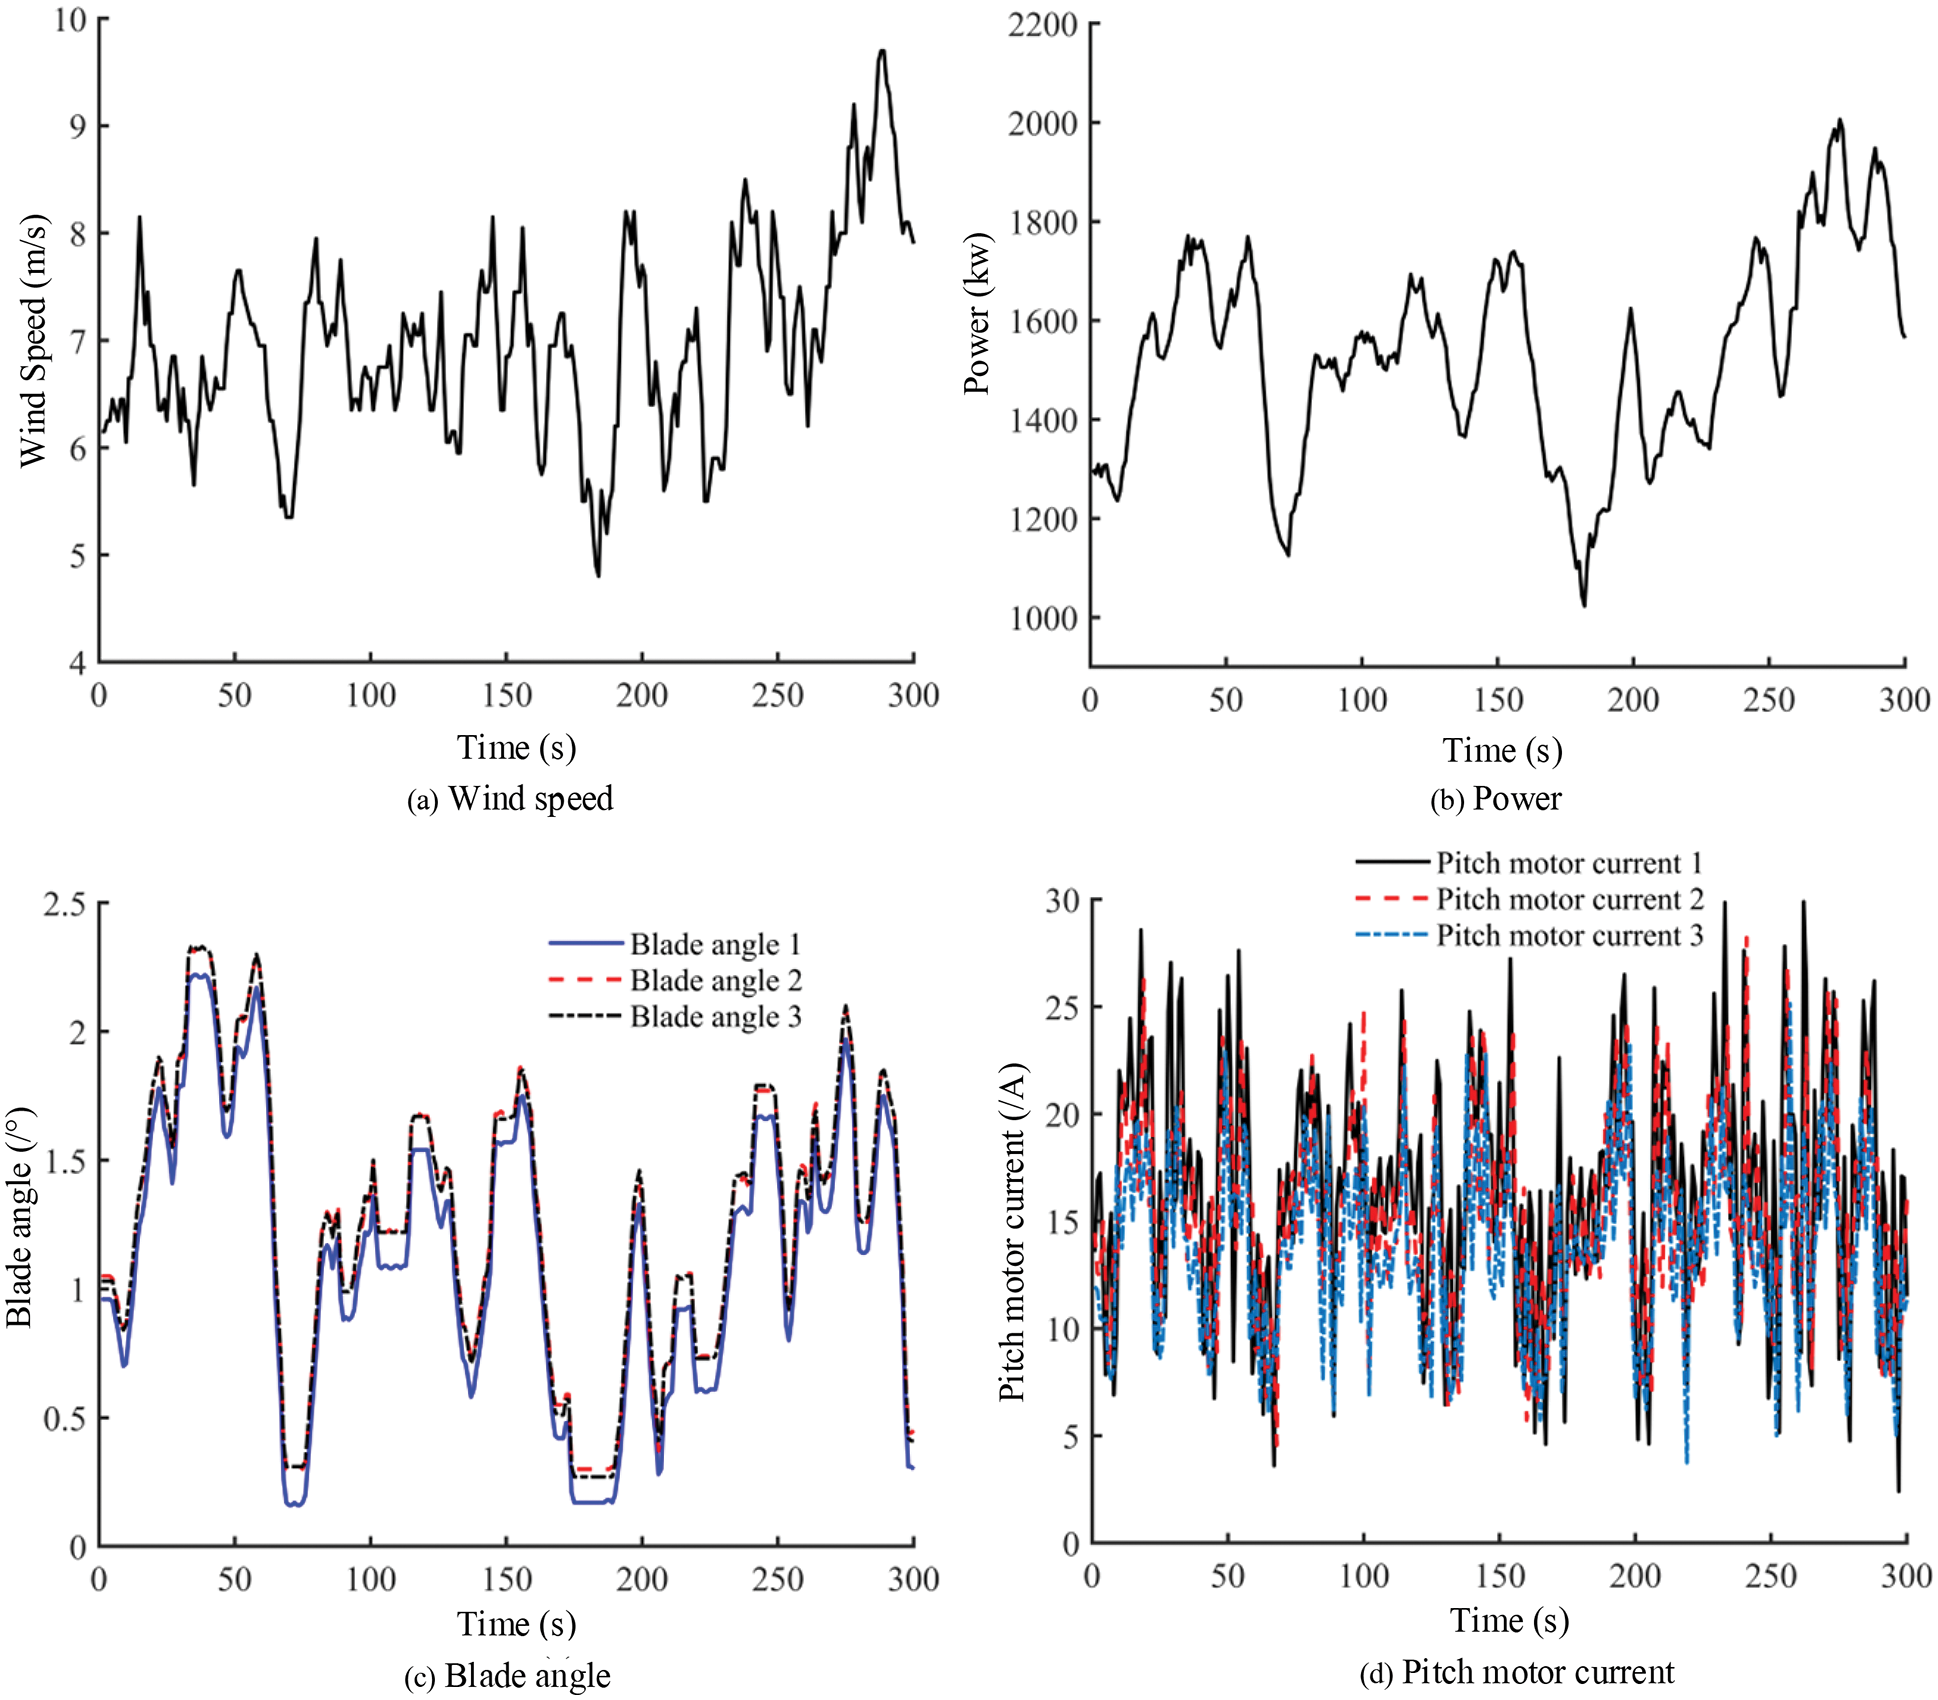
Figure 10: Second set of data underpowered state, (a) Wind speed, (b) Power, (c) Blade angle, (d) Pitch motor current
The data power time series plots of groups 3, 4, and 5 data are presented in (a), (b), and (c) in Fig. 11, the variance and coefficient of variation were selected as parameters to measure the stability of the three groups of power data in Table 4. Comparing the data in Fig. 11 and Table 4, the stability of the power of group 3 data is better than that of group 4 data, and the stability of the power of group 4 data is better than that of group 5 data, which is consistent with the evaluation results of the three groups of data at the rated power condition. This result also verifies the validity and accuracy of this evaluation method.
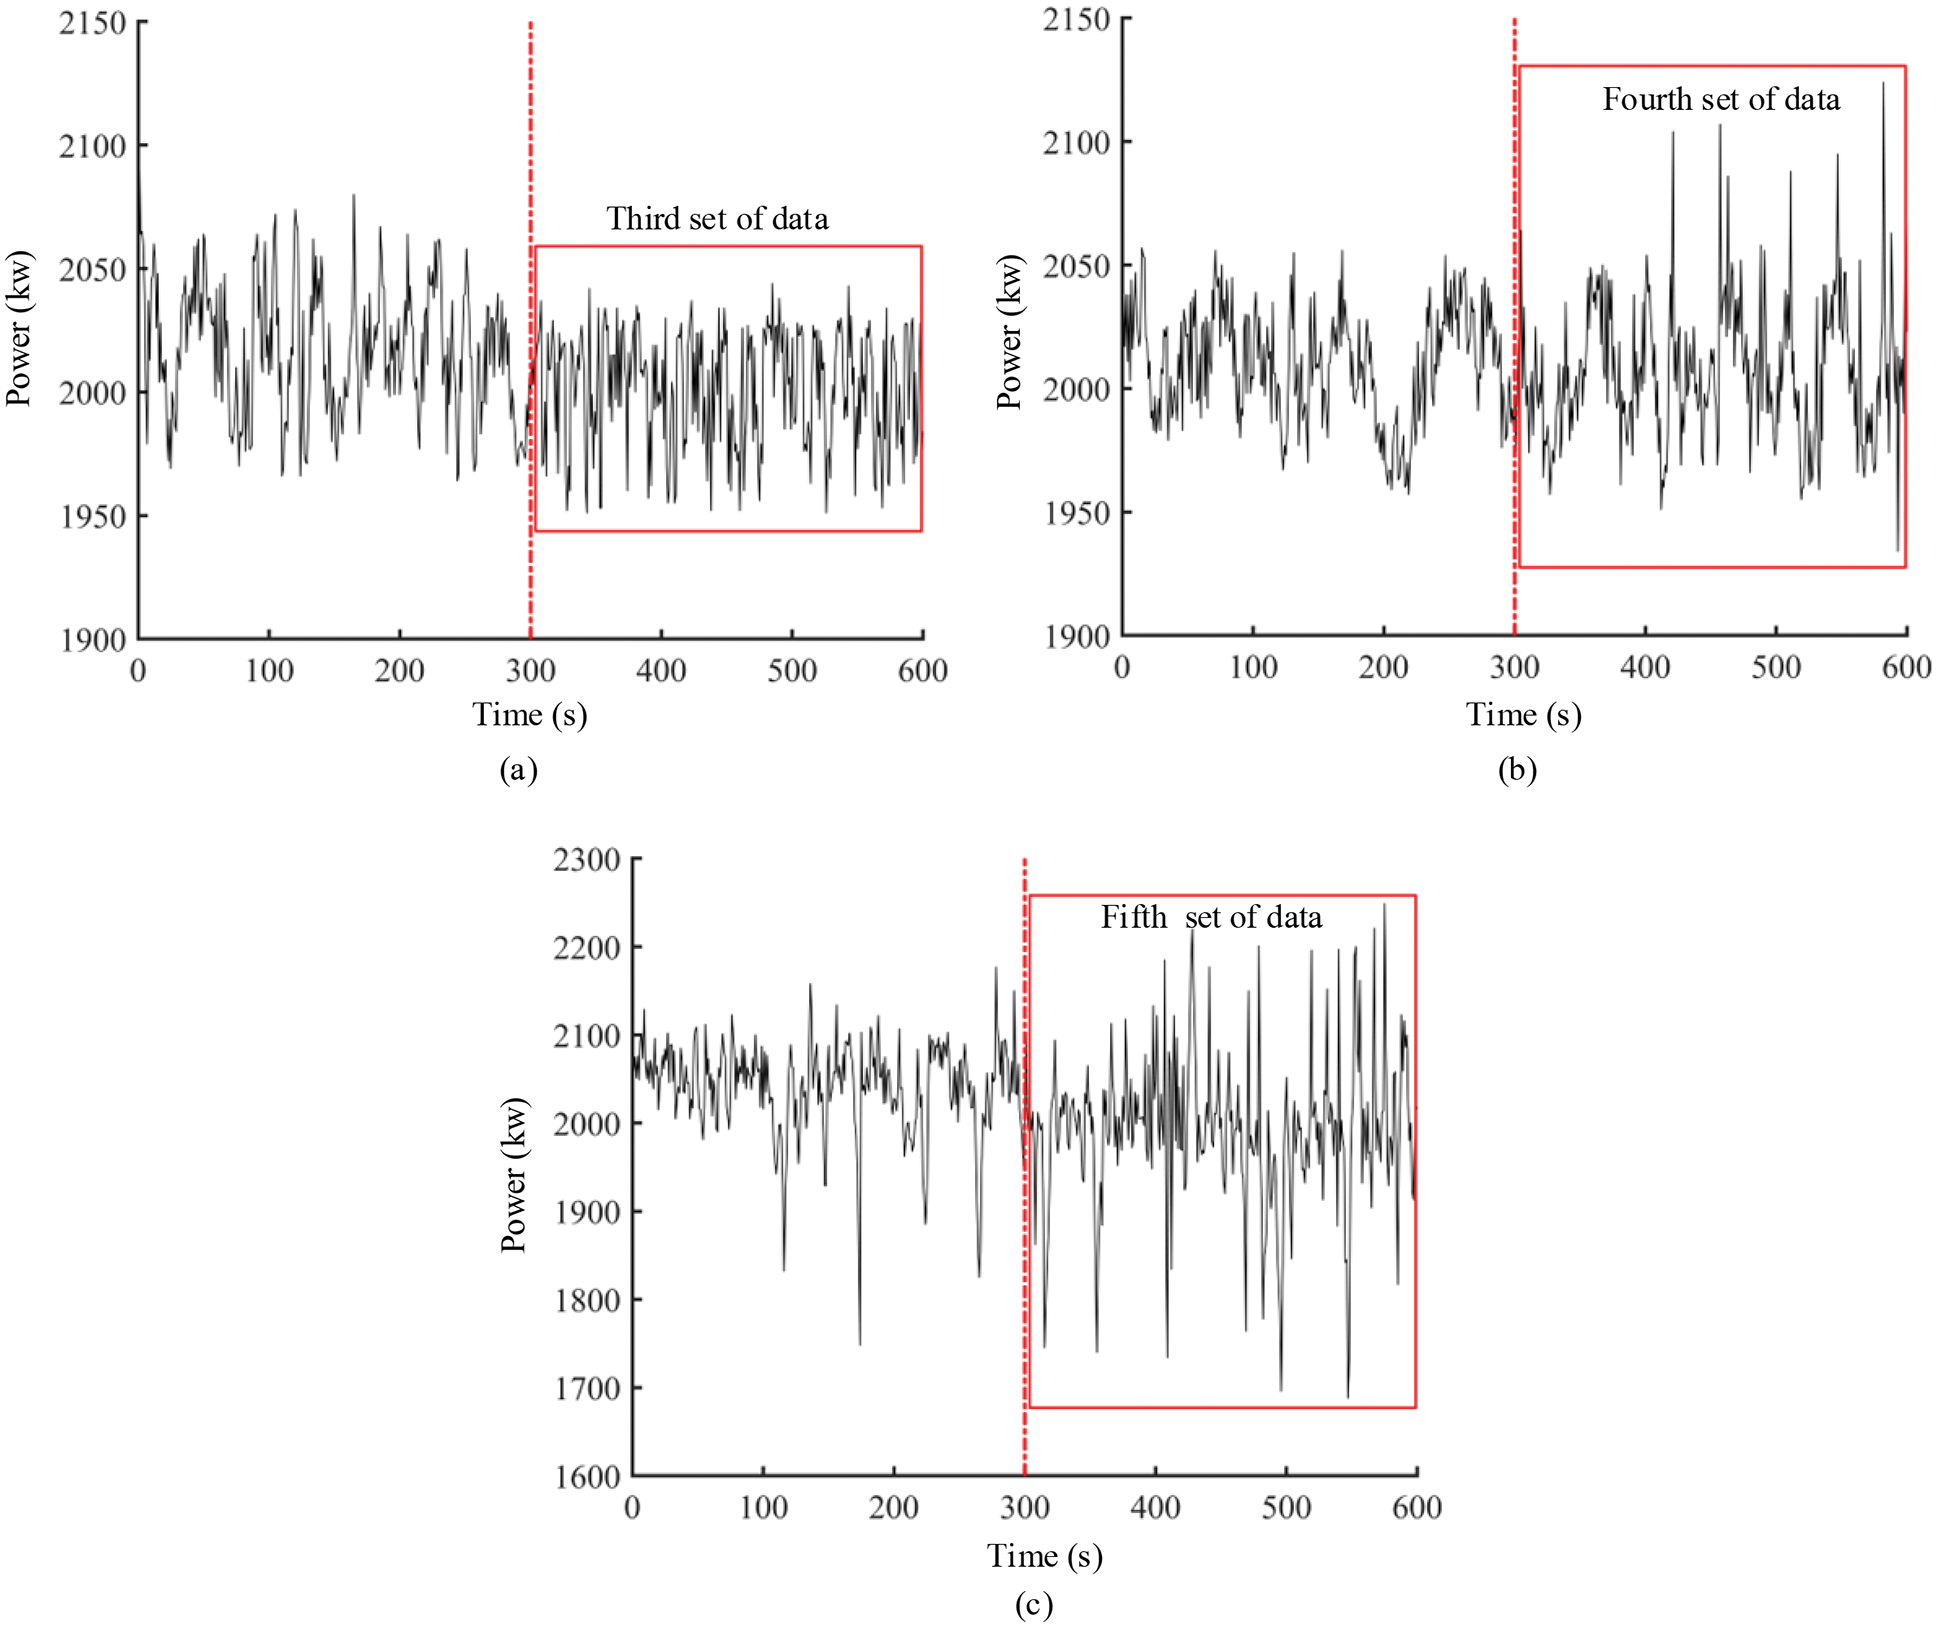
Figure 11: Rated power state timing diagram, (a) Third set of data, (b) Fourth set of data, (c) Fifth set of data

A novel method for evaluating the operating condition of the WT pitch system was proposed in this paper. Five sets of actual data are analysed and compared with the actual operating condition of the turbine to verify the effectiveness of the method. When the underpower condition is poor, the fluctuation of blade angle is large, and the consistency of pitch motor current is poor. The rated power condition is judged by the index variance and coefficient of variation. The new method proposed in this paper can better evaluate the operating condition of the pitch system, find hidden dangers in time, and avoid safety accidents.
This study proposed a pitch system condition assessment method to evaluate the operational status of the pitch system. However, identifying the specific type of fault should be considered in the future. This study focused on the pitch system to establish indicators by describing the operation status using the fuzzy comprehensive evaluation method to assess its operation status. In the future, the method will be extended to other aspects of the WT, such as generator, gearbox, yaw system, even the whole WT system.
Acknowledgement: The authors are thankful to the Engineering Research Center of Hunan Province for the Mining and Utilization of Wind Turbines Operation Data, Hunan University of Science and Technology, Xiangtan, China, for its extended support in using the facilities available at laboratory.
Funding Statement: This research was supported by National Natural Science Foundation of China (Nos. 51875199 and 51905165), Hunan Natural Science Fund Project (2019JJ50186), the Key Research and Development Program of Hunan Province (No. 2018GK2073).
Conflicts of Interest: The authors declare that they have no conflicts of interest to report regarding the present study.
References
1. Zhu, A., Zhao, Q., Wang, X., Zhou, L. (2022). Ultra-short-term wind power combined prediction based on complementary ensemble empirical mode decomposition, whale optimisation algorithm, and elman network. Energies, 15(9), 3055. DOI 10.3390/en15093055. [Google Scholar] [CrossRef]
2. Liu, W. Y., Tang, B. P., Han, J. G., Lu, X. N., Hu, N. N. et al. (2015). The structure healthy condition monitoring and fault diagnosis methods in wind turbines. Renewable and Sustainable Energy Reviews, 44(3), 466–472. DOI 10.1016/j.rser.2014.12.005. [Google Scholar] [CrossRef]
3. Bhardwaj, V., Kukreja, V. (2021). Effect of pitch enhancement in Punjabi children’s speech recognition system under disparate acoustic conditions. Applied Acoustics, 177(3), 107918. DOI 10.1016/j.apacoust.2021.107918. [Google Scholar] [CrossRef]
4. Chen, L., Shen, Y., Yi, H., Liu, Z., Song, Q. (2021). Mathematical modeling of heat transfer in GO-doped reinforce polymer for anti-/deicing of wind turbines. International Communications in Heat and Mass Transfer, 123(4), 105235. DOI 10.1016/j.icheatmasstransfer.2021.105235. [Google Scholar] [CrossRef]
5. Pathak, R., Wadhwa, A., Khetarpal, P., Kumar, N. (2021). Comparative assessment of regression techniques for wind power forecasting. IETE Journal of Research, 1–10. DOI 10.1080/03772063.2020.1869591. [Google Scholar] [CrossRef]
6. Wang, L., Zhang, Z., Long, H., Xu, J., Liu, R. (2017). Wind Turbine gearbox failure identification with deep neural networks. IEEE Transactions on Industrial Informatics, 13(3), 1360–1368. DOI 10.1109/TII.2016.2607179. [Google Scholar] [CrossRef]
7. Wang, L., Guo, Y., Fan, M., Li, X. (2022). Wind speed prediction using measurements from neighboring locations and combining the extreme learning machine and the AdaBoost algorithm. Energy Reports, 8, 1508–1518. DOI 10.1016/j.egyr.2021.12.062. [Google Scholar] [CrossRef]
8. Ouyang, T. H., Kusiak, A., He, Y. S. (2017). Modeling wind-turbine power curve: A data partitioning and mining approach. Renewable Energy, 102(11), 1–8. DOI 10.1016/j.renene.2016.10.032. [Google Scholar] [CrossRef]
9. Siavash, N. K., Ghobadian, B., Najafi, G., Rohani, A., Tavakoli, T. et al. (2021). Prediction of power generation and rotor angular speed of a small wind turbine equipped to a controllable duct using artificial neural network and multiple linear regression. Environmental Research, 196(8), 110434. DOI 10.1016/j.envres.2020.110434. [Google Scholar] [CrossRef]
10. Sun, Z., Sun, H. (2018). Health status assessment for wind turbine with recurrent neural networks. Mathematical Problems in Engineering, 2018(2), 1–16. DOI 10.1155/2018/6972481. [Google Scholar] [CrossRef]
11. Zheng, X. X., Peng, P. (2019). Fault diagnosis of wind power converters based on compressed sensing theory and weight constrained AdaBoost-SVM. Journal of Power Electronics, 19(2), 443–453. [Google Scholar]
12. Khurshid, A., Mughal, M. A., Othman, A., Al-Hadhrami, T., Kumar, H. et al. (2022). Optimal pitch angle controller for DFIG-based wind turbine system using computational optimization techniques. Electronics, 11(8), 1290. DOI 10.3390/electronics11081290. [Google Scholar] [CrossRef]
13. Tang, M., Kuang, Z., Zhao, Q., Wu, H., Yang, X. (2020). Fault detection of wind turbine pitch system based on multiclass optimal margin distribution machine. Mathematical Problems in Engineering, 2020(2), 1–10. DOI 10.1155/2020/5892312. [Google Scholar] [CrossRef]
14. Zhu, J., Ma, K., Hajizadeh, A., Soltani, M., Chen, Z. (2017). Fault detection and isolation for wind turbine electric pitch system. IEEE 12th International Conference on Power Electronics and Drive Systems (PEDS), pp. 618–623. Honolulu, HI, USA. [Google Scholar]
15. Fang, R. M., Wu, M. L., Jiang, S. H. (2016). On-line status assessment of wind turbines based on improved fuzzy comprehensive evaluation method. Journal of Intelligent & Fuzzy Systems, 31(6), 2813–2819. DOI 10.3233/JIFS-169163. [Google Scholar] [CrossRef]
16. Cerqueiro-Pequeño, J., Comesaña-Campos, A., Casal-Guisande, M., Bouza-Rodríguez, J. B. (2021). Design and development of a new methodology based on expert systems applied to the prevention of indoor radon gas exposition risks. International Journal of Environmental Research and Public Health, 18(1), 269. DOI 10.3390/ijerph18010269. [Google Scholar] [CrossRef]
17. Lin, M., Chen, Z., Xu, Z., Gou, X., Herrera, F. (2021). Score function based on concentration degree for probabilistic linguistic term sets: An application to TOPSIS and VIKOR. Information Sciences, 551(3), 270–290. DOI 10.1016/j.ins.2020.10.061. [Google Scholar] [CrossRef]
18. Zuo, W. J., Li, D. F., Yu, G. F. (2020). A general multi-attribute multi-scale decision making method based on dynamic LINMAP for property perceived service quality evaluation. Technological and Economic Development of Economy, 26(5), 1052–1073. DOI 10.3846/tede.2020.12726. [Google Scholar] [CrossRef]
19. Civelek, Z., Luy, M., Cam, E., Mamur, H. (2017). A new fuzzy logic proportional controller approach applied to individual pitch angle for wind turbine load mitigation. Renewable Energy, 111(2), 708–717. DOI 10.1016/j.renene.2017.04.064. [Google Scholar] [CrossRef]
20. Cho, S., Choi, M., Gao, Z., Moan, T. (2021). Fault detection and diagnosis of a blade pitch system in a floating wind turbine based on Kalman filters and artificial neural networks. Renewable Energy, 169(11), 1–13. DOI 10.1016/j.renene.2020.12.116. [Google Scholar] [CrossRef]
21. Pang, N., Nan, M., Meng, Q., Zhao, S. (2021). Selection of wind turbine based on fuzzy analytic network process: A case study in China. Sustainability, 13(4), 1792. DOI 10.3390/su13041792. [Google Scholar] [CrossRef]
22. Fang, R. M., Wu, M. L., Jiang, S. H. (2016). On-line status assessment of wind turbines based on improved fuzzy comprehensive evaluation method. Journal of Intelligent & Fuzzy Systems, 31(6), 2813–2819. DOI 10.3233/JIFS-169163. [Google Scholar] [CrossRef]
23. Wu, H., Dong, P., Liu, M. (2018). Random fuzzy power flow of distribution network with uncertain wind turbine, PV generation, and load based on random fuzzy theory. IET Renewable Power Generation, 12(10), 1180–1188. DOI 10.1049/iet-rpg.2017.0696. [Google Scholar] [CrossRef]
24. Cao, S., Ming, P., Zhao, X. (2021). Fuzzy comprehensive evaluation of human thermal comfort in simulating natural wind environment. Building and Environment, 188(3), 107447. DOI 10.1016/j.buildenv.2020.107447. [Google Scholar] [CrossRef]
25. Chen, J. S., Chen, W. G., Li, J., Sun, P. (2018). A generalized model for wind turbine faulty condition detection using combination prediction approach and information entropy. Journal of Environmental Informatics, 32(1), 14–24. DOI 10.3808/jei.201800393. [Google Scholar] [CrossRef]
Cite This Article
 Copyright © 2023 The Author(s). Published by Tech Science Press.
This work is licensed under a Creative Commons Attribution 4.0 International License , which permits unrestricted use, distribution, and reproduction in any medium, provided the original work is properly cited.
 Downloads
 Citation Tools