
 Submit a Paper
 Propose a Special lssue
 Open Access
ARTICLE

Automatic Extraction Method of Weld Weak Defect Features for Ultra-High Voltage Equipment
1 Jiangsu Key Laboratory of Mine Mechanical and Electrical Equipment, School of Mechatronic Engineering, China University of Mining and Technology, Xuzhou, 22116, China
2 Anji Chang Hong Chain Manufacturer Co., Ltd., Anji, 313300, China
3 Pearl River Water Resources Research Institute, PRHRI, Guangzhou, 510000, China
4 Henan Pinggao Electric Co., Ltd., Pinggao Group Co., Ltd., Pingdingshan, 467001, China
* Corresponding Author: Mengen Shen. Email:
Energy Engineering 2023, 120(4), 985-1000. https://doi.org/10.32604/ee.2023.024372
Received 29 May 2022; Accepted 05 September 2022; Issue published 13 February 2023
 View Full Text
 Download PDF
Abstract
To solve the problems of low precision of weak feature extraction, heavy reliance on labor and low efficiency of weak feature extraction in X-ray weld detection image of ultra-high voltage (UHV) equipment key parts, an automatic feature extraction algorithm is proposed. Firstly, the original weld image is denoised while retaining the characteristic information of weak defects by the proposed monostable stochastic resonance method. Then, binarization is achieved by combining Laplacian edge detection and Otsu threshold segmentation. Finally, the automatic identification of weld defect area is realized based on the sequential traversal of binary tree. Several characteristic analysis dimensions are established for weld defects of UHV key parts, including defect area, perimeter, slenderness ratio, duty cycle, etc. The experiment using the weld detection image of the actual production site shows that the proposed method can effectively extract the weak feature information of weld defects and further provide reference for decision-making.Keywords
In the field of ultra-high voltage (UHV), the projects under construction and pending approval will drive the development of equipment manufacturing, construction and installation, operation and maintenance of the whole power equipment industry. Welding is one of the important processes of UHV equipment key parts. The quality of UHV equipment is directly related to the safety performance and work efficiency of the whole power grid. In the manufacturing process of UHV equipment welded parts, welding is a complex process. The influence of various human and non-human factors leads to the inevitable defects such as pores, cracks and slag inclusion [1]. Therefore, welding quality inspection is very important. The automation of traditional welding quality inspection is not high, and the inspection standards and process methods are difficult to be unified. Taking X-ray detection as an example, the manual detection process is cumbersome and depends on experienced inspectors. There are inevitable subjective differences in defect recognition, low efficiency and high cost [2,3]. In addition, the missed inspection rate and over inspection rate can only be maintained at a certain level, which is difficult to be further reduced, and the reliability of the product is not high. Due to the particularity of products and the challenge of technology, it is urgent to develop automatic X-ray welding quality detection and recognition technology for UHV key parts, so as to extract and segment defect information from images quickly and effectively.
Scholars have made exploration and research in relevant aspects. Representative works include Alwaheba et al. [4,5] applied scanning contact potentiometry for defects detection, and for determining the location coordinates of defects in welded joints, Shen et al. [6] proposed water flooding segmentation algorithm to weld defect detection, Chen et al. [7] extracted X-ray weld image defects based on SUSAN algorithm, Li et al. [8] identified weld defects based on independent component analysis, Yu et al. [9,10] extracted weld centerline based on pyramid sparse network, Abdelkader et al. [11] considered the characteristics of low contrast, poor quality, and uneven illumination of X-ray images, and studied weld defect extraction based on X-ray images. Ding et al. [12] proposed the wavelet soft and hard threshold compromise denoising method, Patil et al. [13] proposed the techniques of local binary pattern in which local binary code describing region, generating by multiplying threshold with specified weight to conforming pixel and summing up by grey-level co-occurrence matrix to extract statistical texture features, Boaretto et al. [14] extracted potential defects based on feedforward multilayer perceptron with back propagation learning algorithm. In addition, there are relevant research on weld feature extraction based on computer vision [15,16]. Although they have made some achievements, there are still problems to be solved [17–19]. Weld defect detection methods are various, but in the face of specific problems, it is still necessary to adapt measures to local conditions. For UHV equipment weld quality inspection, X-ray inspection is one of the common inspection methods, and inspectors usually judge the weld quality based on X-ray inspection images [20–23]. The automatic extraction of weld defects based on radiographic inspection images is of great significance for the next step to realize automatic evaluation of weld quality.
There are many reasons for the difficulty of extracting weak features from weld X-ray flaw detection images, and the inevitable noise pollution is one of the reasons. The study of nonlinear stochastic resonance system shows that an appropriate amount of noise can amplify weak signals [24,25]. In recent years, the application research of stochastic resonance in fault diagnosis [26], image processing [27,28] and other fields has expanded the engineering value of nonlinear stochastic dynamics. In conclusion, the novelty of this work are as follows, in order to improve the accuracy of weak defect feature extraction under noise background, we propose a monostable stochastic resonance image denoising method to preprocess the noise reduction of weld X-ray flaw detection image. Furthermore, in order to better preserve weak features, threshold segmentation is improved based on edge detection. Through a series of image processing on the X-ray images of UHV key parts to assist the process of welding quality detection, it is expected to improve the problem that weak features are easy to be lost. In order to identify the weak defects in the welds of UHV key parts more efficiently, this paper realizes the automatic extraction of defect connected region based on the first order traversal of binary tree, and then designs and quantifies the characteristic parameters of weld defects. To sum up, this paper provides an effective method to extract the weak features of weld X-ray flaw detection image, and gives a series of processing flow. In addition, the processing results of this method can provide reference for higher-level defect analysis.
The X-ray weld detection image of UHV key parts will inevitably be involved in electromagnetic pulse and other interference noise in the acquisition process [29,30]. Weak defect features are usually polluted by noise. If feature extraction is carried out directly, a lot of noise will also be mistaken for defects, and the result is to reduce the accuracy of defect feature extraction [31]. Therefore, it is necessary to denoise the X-ray weld detection image of UHV key parts. Classical image denoising methods such as median filter, mean filter, Wiener filter and Gaussian filter, among which the representative methods Gaussian filter is realized as follows.
In image processing, Gaussian filtering generally has two common implementation methods, one is window sliding convolution, the other is through Fourier transform. Usually, when the amount of calculation of window sliding convolution is very large, we will consider obtaining the image spectrum through Fourier transform, and then use the transfer function to realize frequency domain centralization.
where σ Determines the width of the Gaussian function. The steps of Gaussian window sliding convolution filtering are selecting Gaussian kernel, sliding window and convolution processing.
Traditional noise reduction methods such as Gaussian filtering often weaken the characteristics of weak defects while removing noise, which is unacceptable for industrial defect detection with high requirements. Therefore, an image denoising algorithm based on monostable stochastic resonance processing is proposed next.
2.2 Image Denoising Based on Monostable Stochastic Resonance
As a nonlinear stochastic dynamic phenomenon, stochastic resonance has important theoretical research significance and engineering application value. According to the beneficial principle of noise [32], an adaptive monostable stochastic resonance image denoising method is proposed in this paper. The system equation is as follows:
where a > 0, b > 0 are monostable system parameters, s(t) is image signal and N(t) is image noise. Monostable system can excite stochastic resonance of step, pulse and other signals [33]. The steps of monostable stochastic resonance image denoising are as follows: he operation steps are as follows:
(1) Image dimensionality reduction. The images were converted into one-dimensional information using Hilbert scanning and normalized.
(2) Monostable stochastic resonance processing. stochastic resonance processing is combined with optimization algorithms. Based on the Runge-Kutta algorithm, the optimal parameter combination is obtained and the optimization result is obtained through a series of iterative processing through the optimization algorithm within the value range of the parameters a and b.
(3) Decoding. The processed signal is reconstructed into a two-dimensional matrix by inverse Hilbert scanning. It is worth noting that the center of the signal is often biased after rescaled monostable stochastic resonance processing. Here, we normalize the resulting matrix and scale the signal to [0,1].
(4) Compared to ground truth. The fitness function PSNR of the optimization algorithm is obtained.
(5) Judgment. The program ends when the iterative conditions of the optimization algorithm are satisfied.
(6) Obtain the final denoised image.
As shown in Fig. 1, the Gaussian filter denoising and the monostable stochastic resonance denoising method in this paper are compared by denoising the real weld radiographic inspection images with porosity defects, as shown in (c) and (d). For ease of comparison, the original reference image and the simulated noise image are presented in (a) and (b) simultaneously.
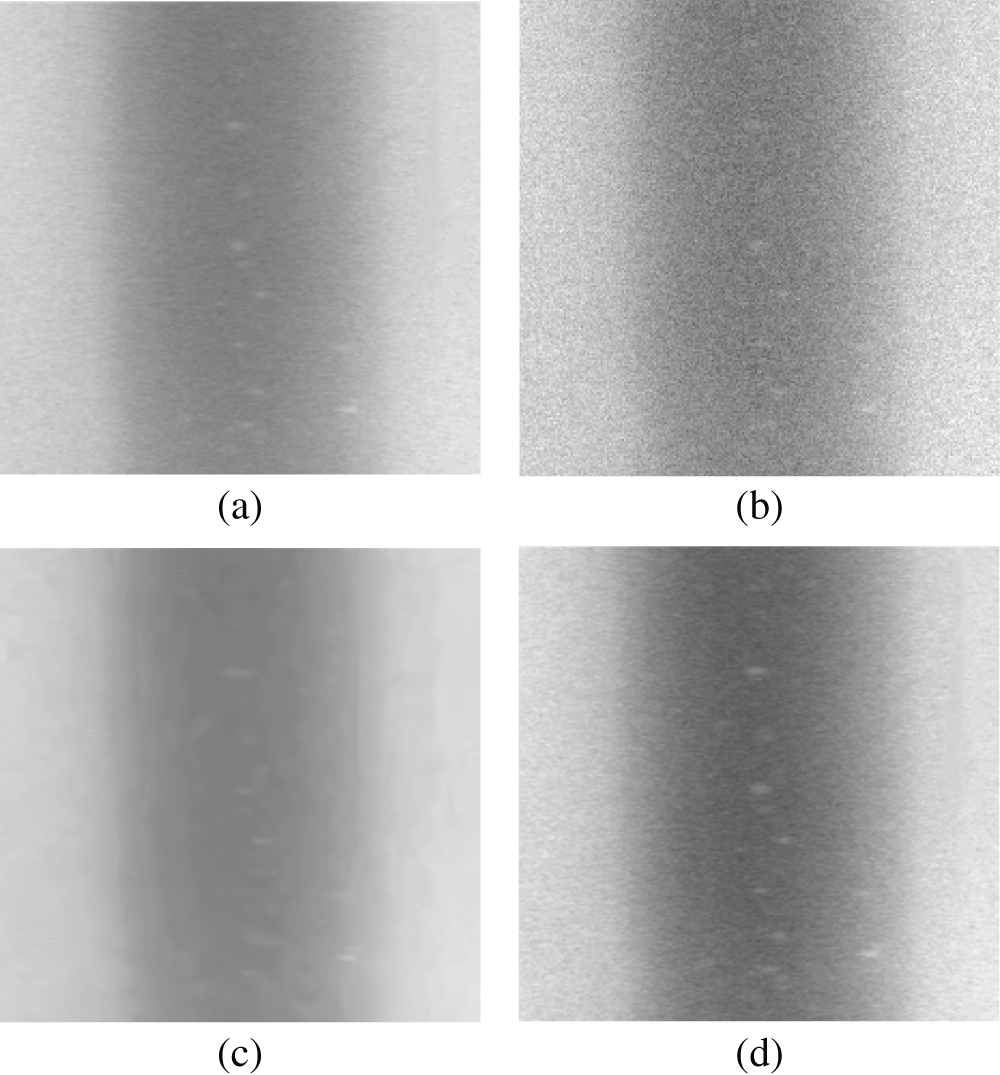
Figure 1: Comparison noise reduction preprocessing results of the two methods. (a) Ground-truth, (b) Noisy image to be processed, (c) Gaussian filtered image, (d) stochastic resonance denoised image
It can be seen from the figure that the denoising effect of the two methods is very significant. However, since the core of Gaussian denoising is filtering, it also removes many weak defect features while removing noise, which is not allowed in defect detection. In contrast, the monostable stochastic resonance method utilizes noise to enhance weak stomatal defect information, removing the noise while preserving the weak key features.
To better identify the image content in Fig. 1, we use a grayscale transformation to convert the grayscale image to a pseudocolor image. As shown in Fig. 2, the defects in the original reference image in subfigure (a) are also very weak. The pore defect feature in subplot (b) is completely immersed in noise and indistinguishable, subplot (c) shows the result after denoising by Gaussian filtering, and subplot (d) shows the result after denoising by the monostable stochastic resonance method. The results show that the monostable stochastic resonance method enhances the weak stomatal features, while the Gaussian filtering method weakens the weak stomatal features.
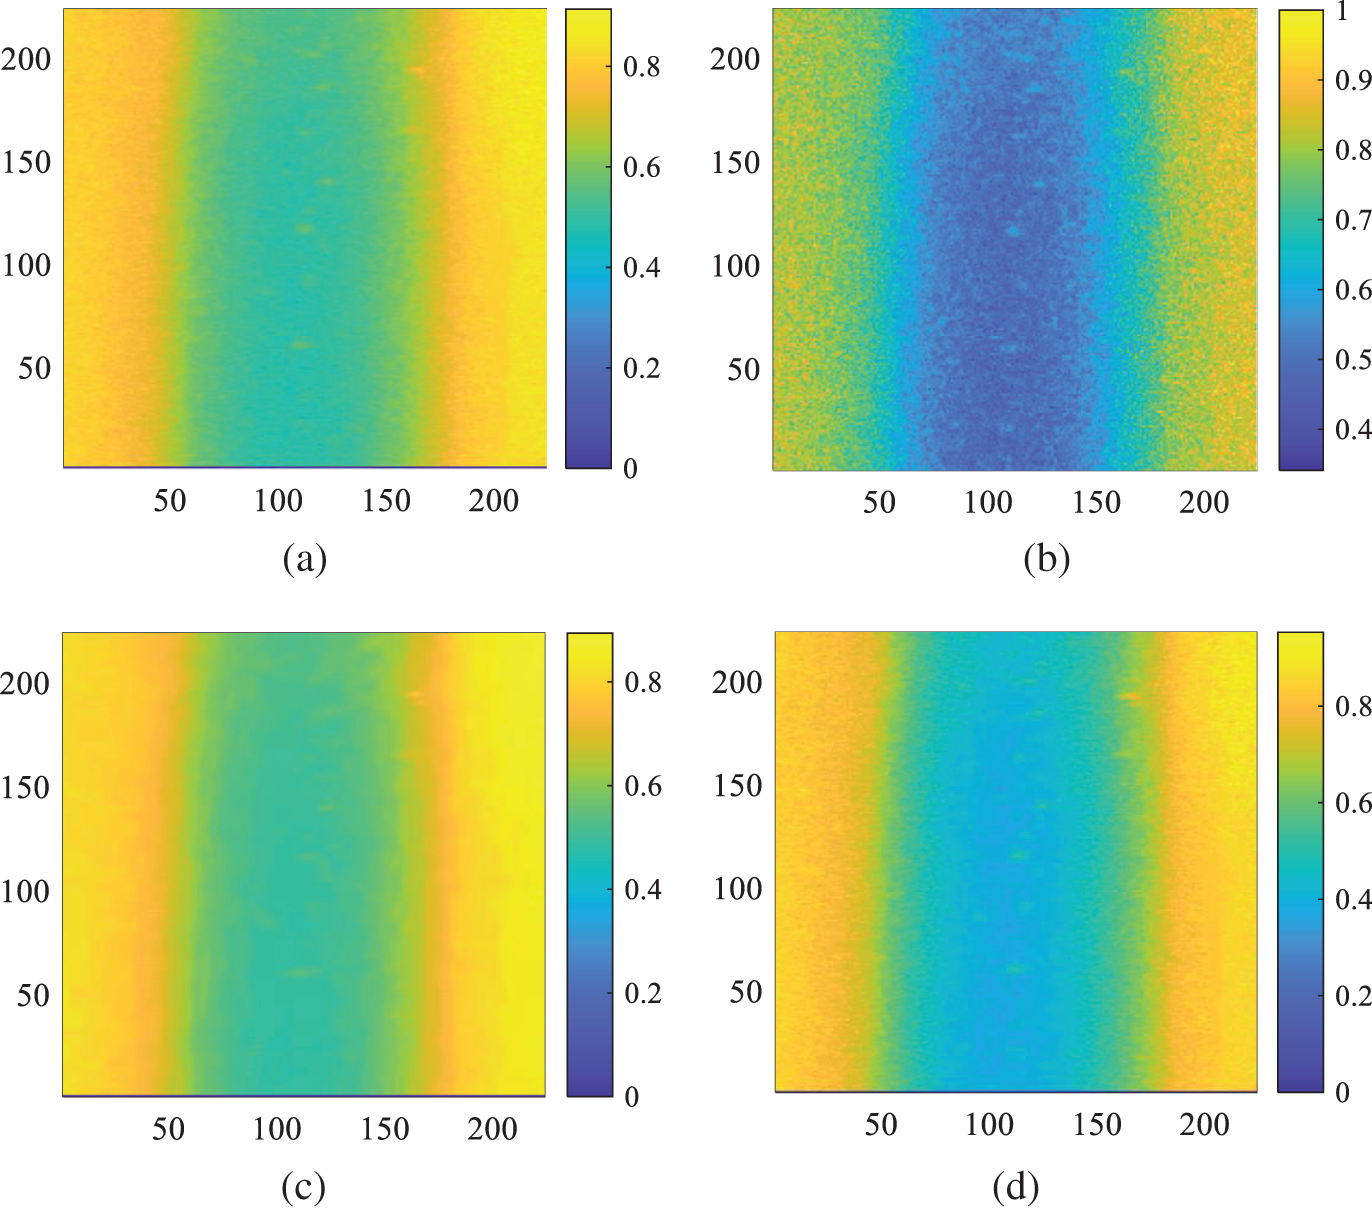
Figure 2: Comparison noise reduction preprocessing results of the two methods (pcolor). (a) Ground-truth, (b) noisy image to be processed, (c) Gaussian filtered image, (d) stochastic resonance denoised image
Table 1 gives the values of the objective evaluation indexes PSNR and SSIM of the subgraphs in Fig. 1. PSNR is an evaluation index based on the difference of corresponding pixels between the image to be evaluated and the reference image. SSIM is an evaluation index based on structural similarity, which is evaluated from three aspects of image brightness, contrast and structure. It can be seen from Table 1 that based on the two objective evaluation indicators, the denoising effects of the two methods are basically the same, and the monostable stochastic resonance denoising method is slightly better than the Gaussian filtering method in general. However, from the comprehensive image information and tabular data, it can be seen that the monostable stochastic resonance denoising method is more competitive and has application prospects.

After image denoising, threshold segmentation is carried out next. The most commonly used threshold segmentation method is Otsu threshold processing. After noise reduction, the image quality has been improved, but sometimes there are still defects in the image that cannot be well distinguished from the image background in threshold segmentation [34,35]. Therefore, this paper uses the edge detection information of Laplace operator to improve Otsu threshold processing.
3.1 Otsu Threshold Segmentation
Otsu’s principle is to normalize and square the initial image first. Then determine an initial threshold, divide the whole image into two categories: those greater than the threshold and those less than the threshold, calculate the proportion of gray level and record it as P1 and P2, record the average gray levels Q1 and Q2 at the same time, and record the average gray level of the whole image as Q. Then calculate the inter class variance:
simplify,
Traverse the whole image and calculate the inter class variance of each pixel. The pixel with the largest variance between classes is obtained, and its gray value is just the best threshold of the threshold segmentation method determined by Otsu algorithm.
Edge refers to the part of the image with the most significant change in local intensity, which mainly exists between the target and background, region and region. It is usually detected by means of first-order or second-order differentiation. In this paper, Laplace operator is used for edge detection. After second-order differentiation, a steep zero intersection is generated at the edge of the image, which can highlight the area where the intensity changes rapidly in the image. Note that the image pixel matrix is I(x, y), then the Laplace operator L(x, y) is as follows:
3.3 Improved Otsu Threshold Segmentation Based on Edge Detection
Weld defects are usually much smaller than the background and make little contribution to the histogram. If the direct threshold segmentation is used, the desired results may not be obtained most of the time. Therefore, this paper considers the introduction of edge information in threshold segmentation. Firstly, the edge with large gradient is selected to strengthen the separability of the image, and then the threshold processing is carried out.
The steps of the improved algorithm are as follows: Firstly, the value of the template of the image is calculated by an edge search method. Then, specify the threshold in percentage. In practice, since there is noise in the calculated edge template values, the calculated values can be sorted, and a value with a relatively high percentage (threshold value greater than the value below the percentage) can be selected as the threshold value. Next, according to the specified threshold, the value of the image edge in the first step is selected. The value of pixel points higher than the threshold is set to 1, and the value lower than the threshold is set to 0, thereby selecting a binary image (template) of some edge points. Next, multiply the original image with the template just calculated to obtain a new image. Finally, Otsu is used to segment the new image.
As shown in Fig. 3. Fig. 3a is the image to be thresholded, and it can be seen that there is a white feature in it. Fig. 3b is the corresponding histogram of Fig. 3a. It can be seen from the figure that the pixels occupied by the features contribute very little to the histogram. Fig. 3c is the result of direct otsu threshold segmentation. Features are completely lost. Fig. 3d is an improved graph incorporating edge information. Fig. 3e is the pixel distribution corresponding to Fig. 3d. Fig. 3f is the thresholding result using edge refinement. Laplacian edge extraction enhancement is performed before threshold segmentation. Threshold segmentation is more accurate when combined with edge detection.
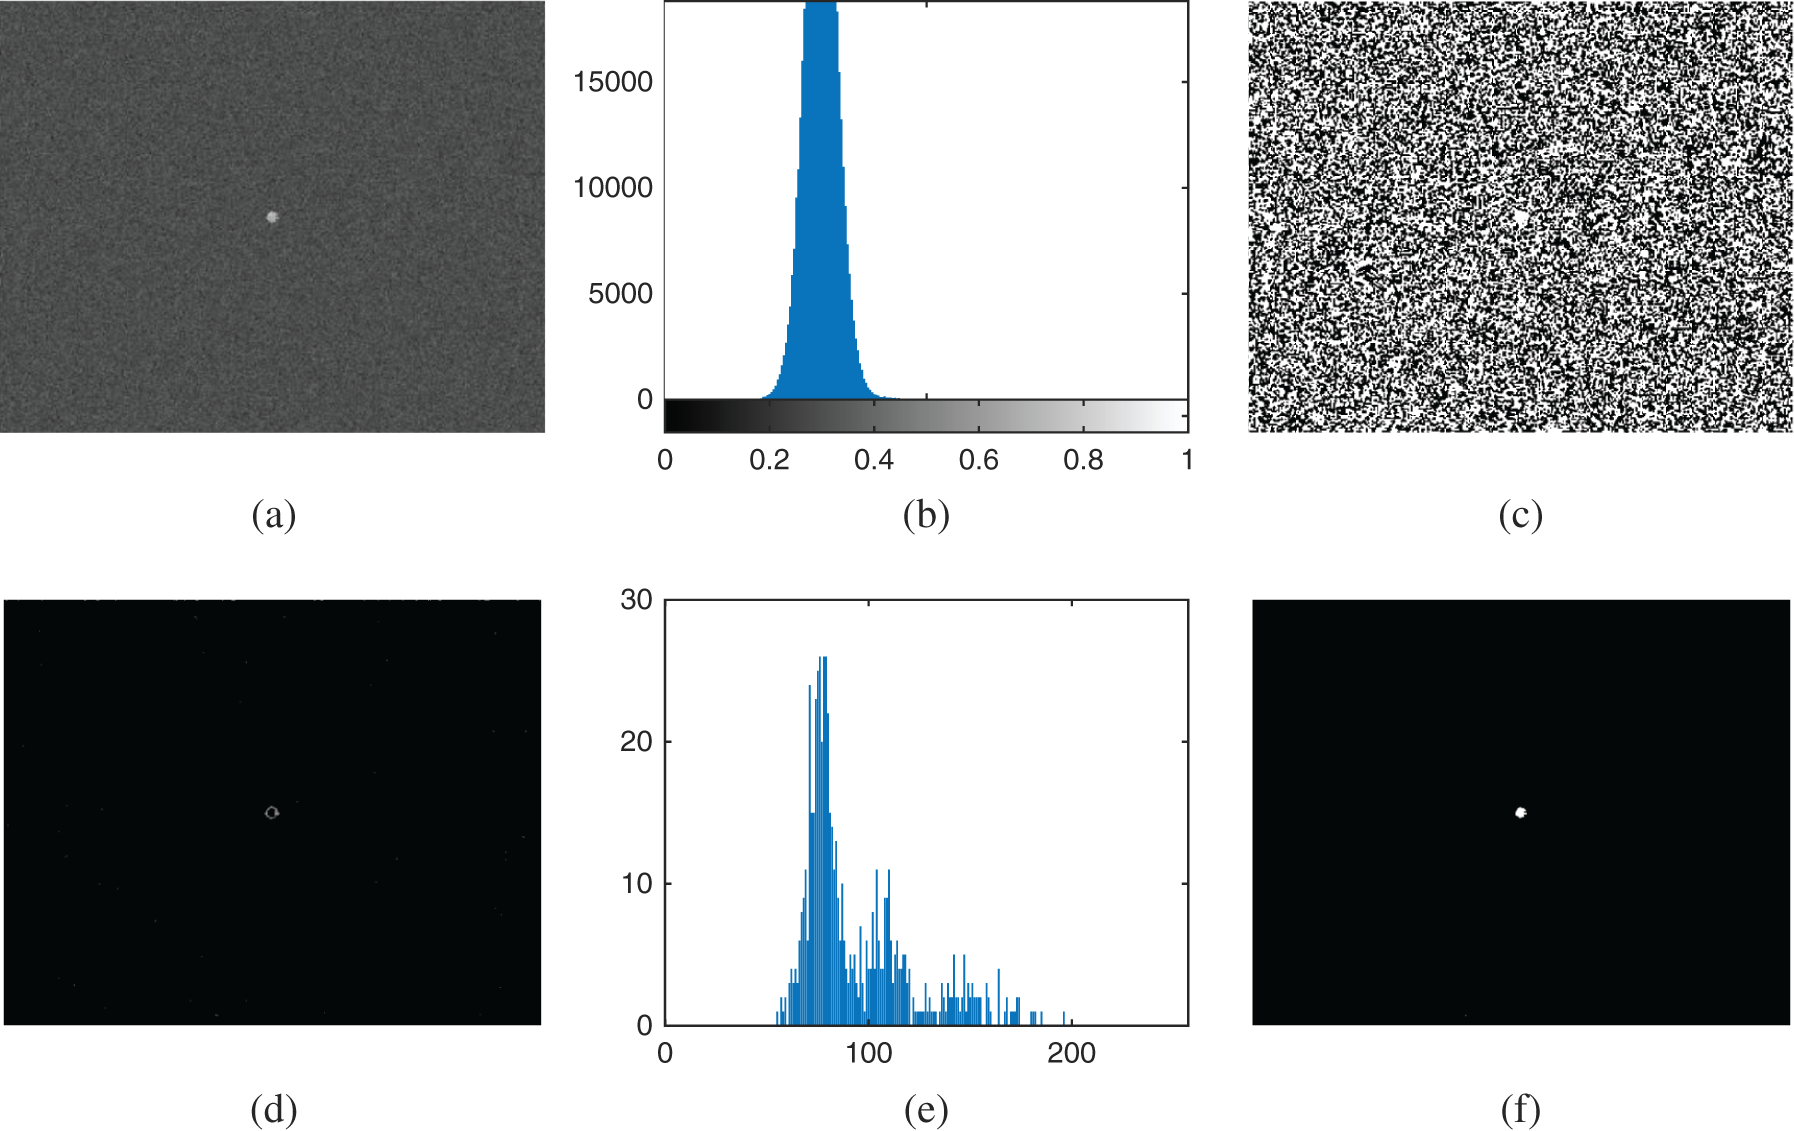
Figure 3: Comparison of the Otsu threshold segmentation and the improved Otsu threshold segmentation. (a) The image to be segmented with a small feature, (b) the grayscale histogram of (a), (c) Otsu segmentation result of (a), (d) the Laplacian edge enhancement result of (a), (e) the grayscale histogram of (d), (f) Otsu segmentation result of (d)
In conclusion, the improved threshold segmentation method can better segment the detailed features. It is precisely the detail features that are common in welds. Threshold segmentation combined with Laplacian edge detection has advantages in preserving detailed features.
After preprocessing the X-ray weld detection image with noise reduction and threshold segmentation, the defect features of the image are extracted. Feature extraction is based on connected regions. As shown in Fig. 4a, with one pixel in the image as the center, eight pixels adjacent to the center pixel are defined as the connection area of the center pixel. Because the connection region is transitive, the region represented by the defect can be recognized as a connected region.
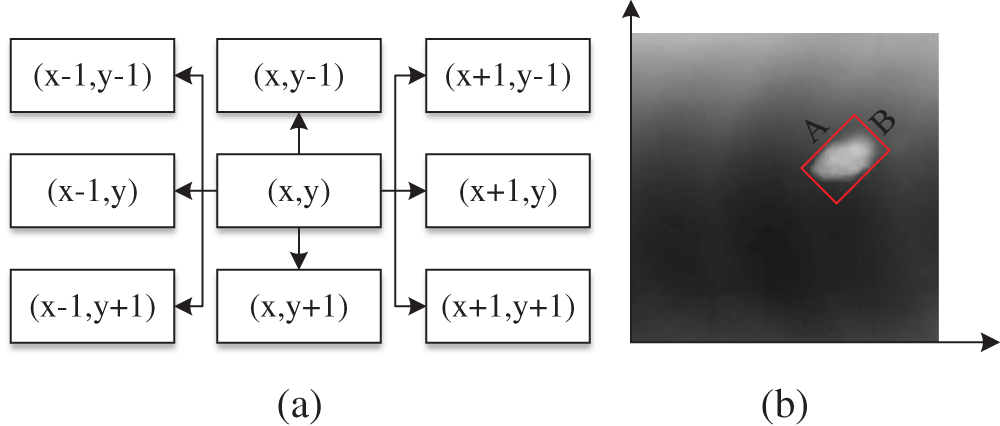
Figure 4: Schematic diagram of the shape characteristics of weld defects. (a) The connected area, (b) defect circumscribed rectangle, where A and B are the major and minor axes of the smallest circumscribed rectangle of the planar defect, respectively
4.1 Defect Area Identification
The connected area connected by defective pixels is the defective area. The identification of defect region is based on the idea of binary tree preorder traversal, as shown in Fig. 5. First, select the initial center pixel. Judge it. If the central pixel is 1, mark this pixel as a defect and start traversing its surrounding pixels until all the surrounding pixels are traversed, and then update the central point. If the pixel is 0, proceed directly to the next step, that is, update the center point. When all pixels are traversed, the process ends.
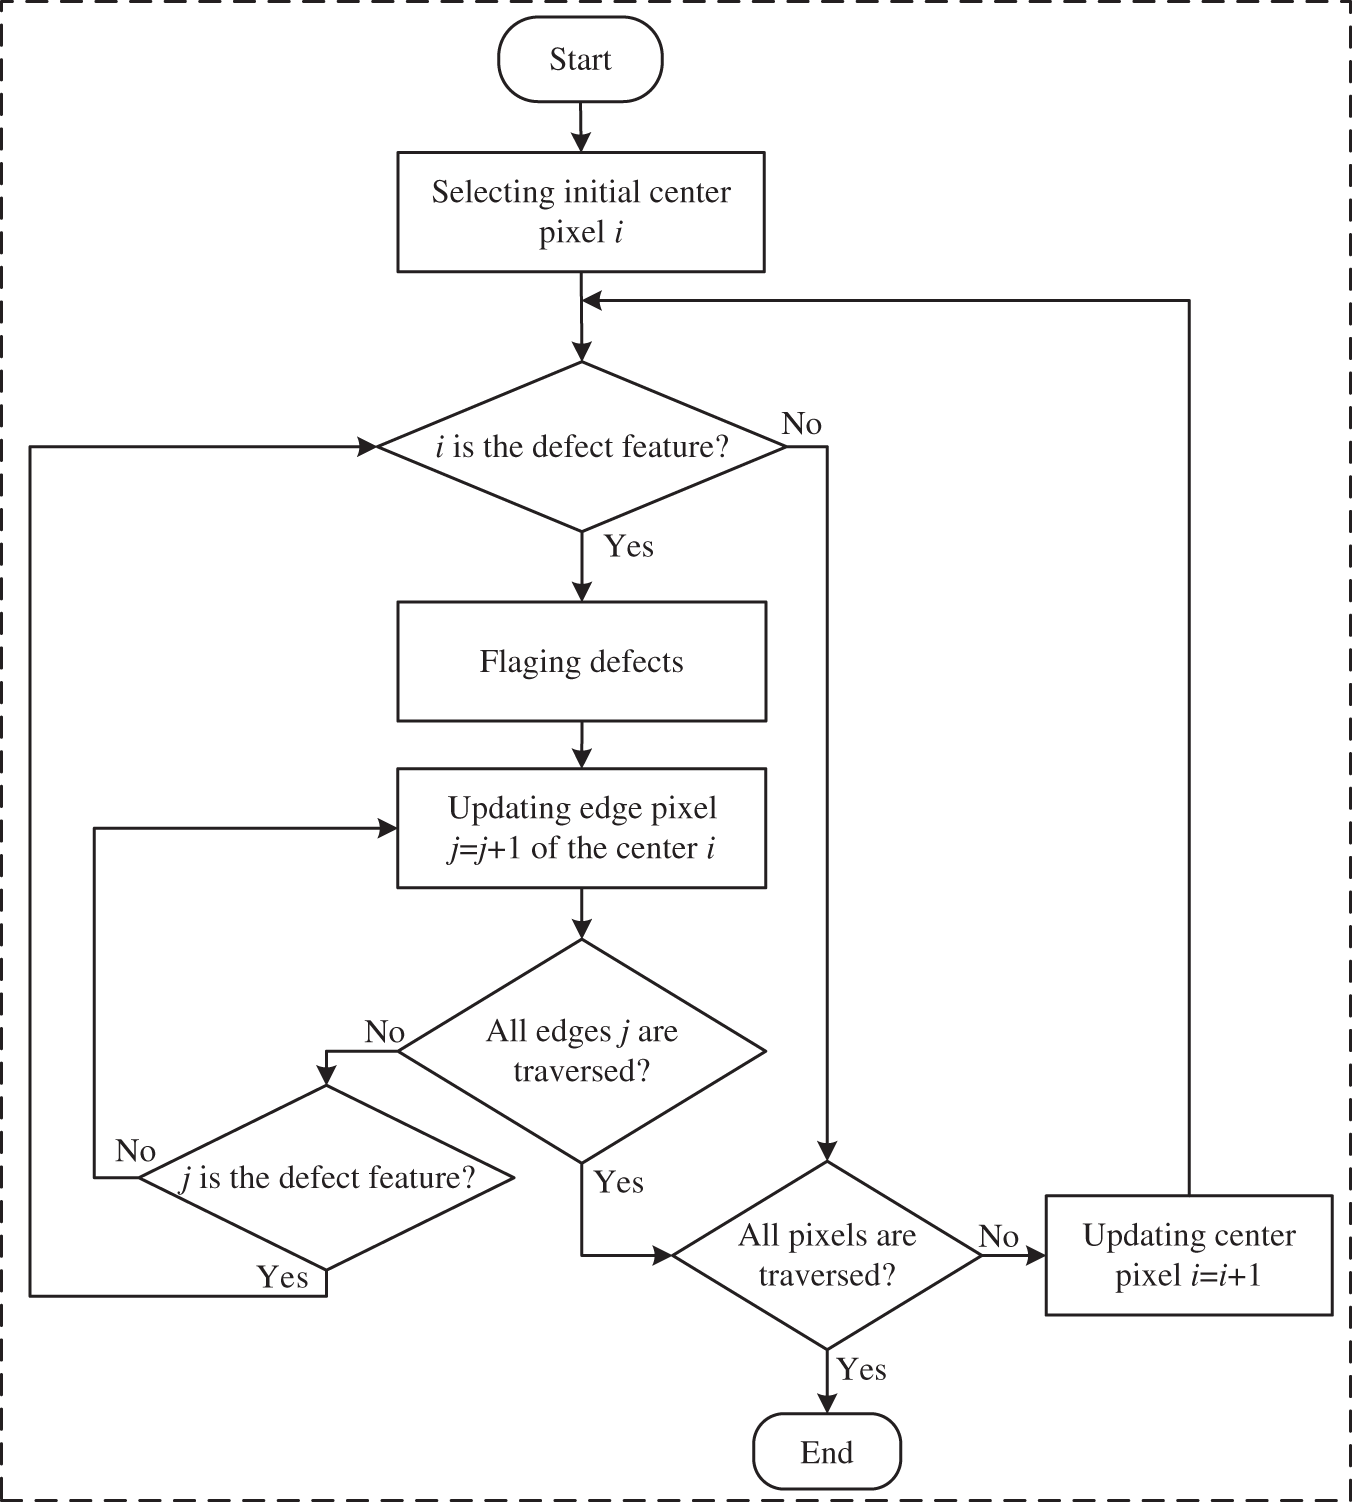
Figure 5: Flow chart of automatic identification of defect connected area
4.2 Defect Feature Parameters Extraction
After identifying the defect connection area, the characteristic parameters are extracted for the area, perimeter, fine length and interval duty cycle of defects such as slag inclusion, pores and cracks in the welds of UHV key parts. The above characteristic parameters are selected and set according to the relevant requirements of the industry standard NBT 47013.11-2015.
(1) Area of defect
The area of the defect area is equal to the pixels in the defect area. By directly calculating the number of pixels in the defect area, the area of the defect area can be obtained. The area of defect area is one of the important characteristics of defects. The hidden information of each defect area can be further analyzed by the size of defect area.
(2) Perimeter of defect
The perimeter of the defect area is another important characteristic parameter of the defect area. Although the perimeter of the defect area cannot directly reflect the size and shape of the defect, it can be combined with the area of the defect area to get more information about the defect.
(3) Slenderness ratio of defect
The slenderness ratio is the length width ratio of the circumscribed rectangle in the defect area. As shown in Fig. 4b, the minimum circumscribed rectangle of weld defect is given in the figure, and the fine length of this defect area is the ratio of long axis A to short axis B.
(4) Duty cycle of defect
The duty cycle of the defect area refers to dividing the area of the defect area by the area of its smallest circumscribed rectangle. As also shown in Fig. 4b, the duty cycle of the defect area is the number of pixels of the defect area divided by the area of its smallest circumscribed rectangle, that is, the product of the long axis A and the short axis B.
To sum up, the image processing of auxiliary feature extraction for weld X-ray detection of UHV equipment key parts mainly includes three steps: image noise reduction, image threshold segmentation and image feature extraction. The flow chart of specific operation is shown in Fig. 6.

Figure 6: Flow chart of weld defect feature extraction
The experimental verification is carried out with the weld X-ray detection image of UHV equipment key parts on the production site. As shown in Fig. 7, weld defects include slag inclusion, pores and cracks.
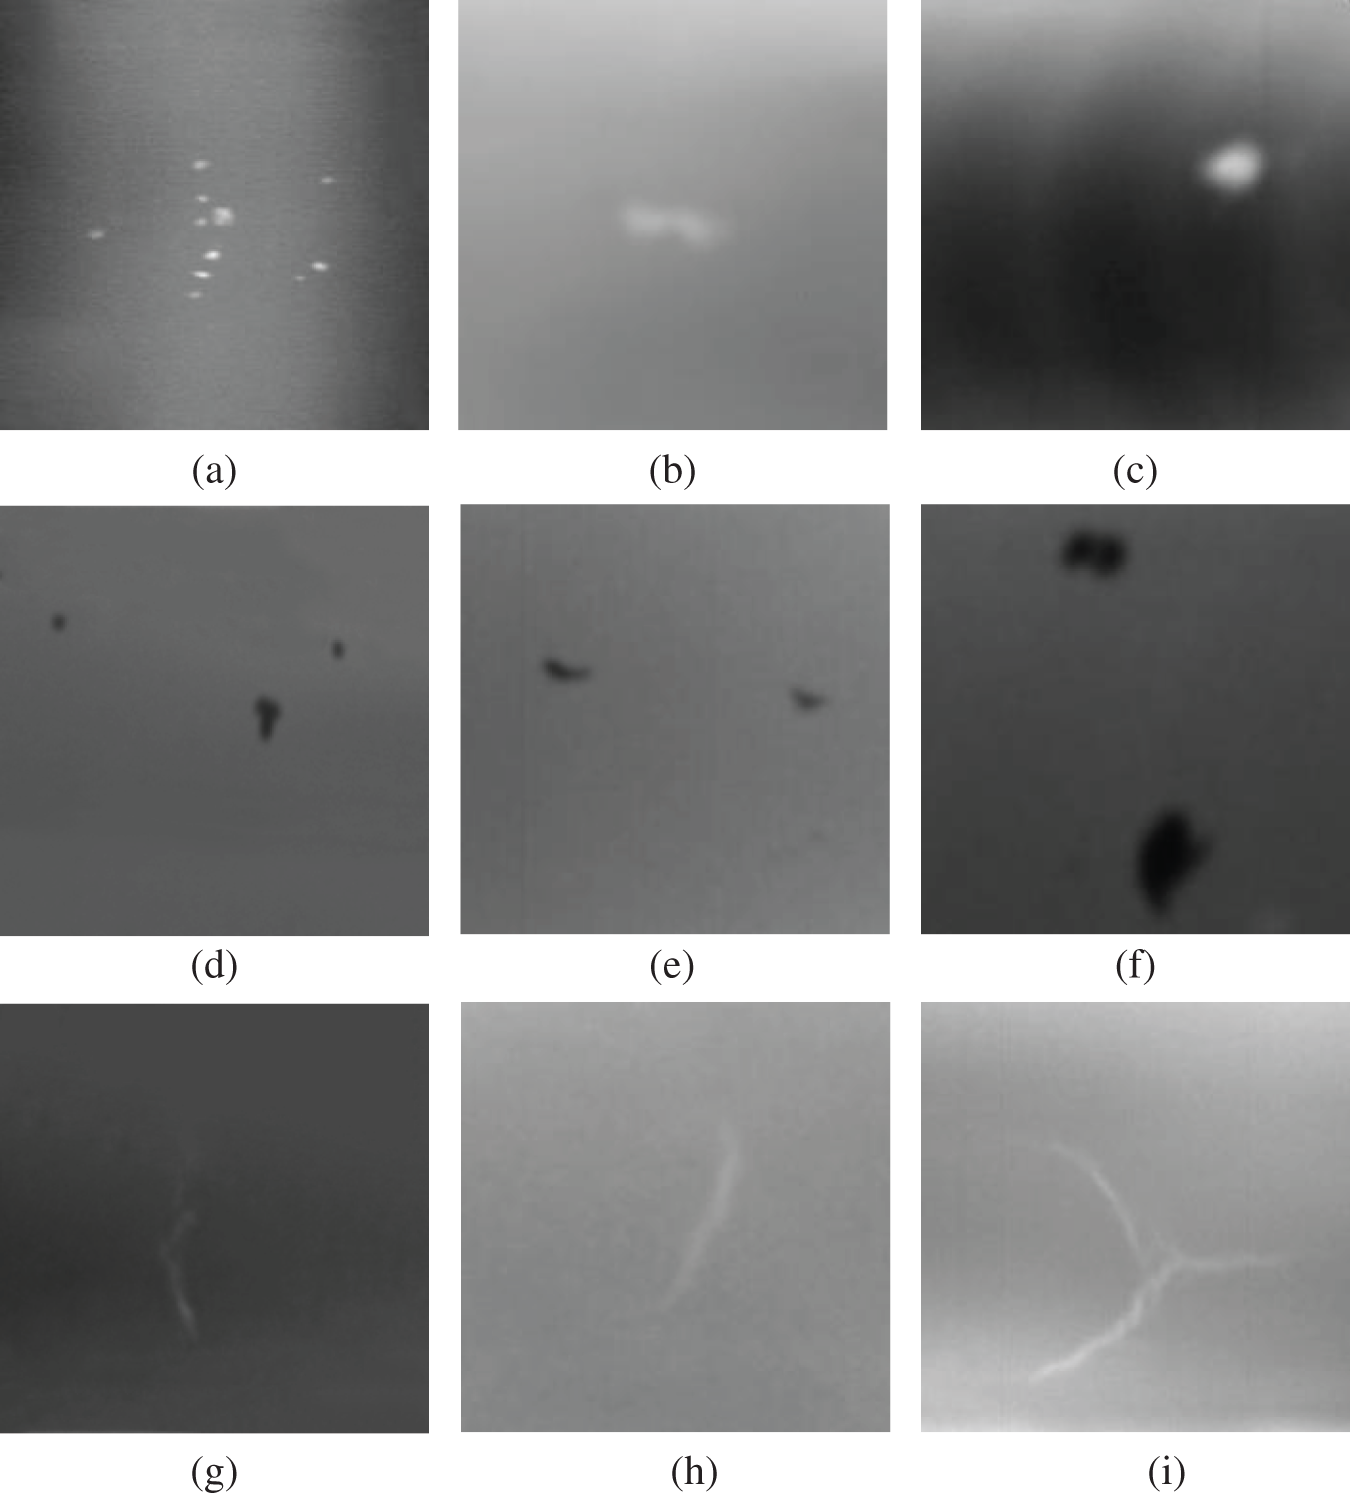
Figure 7: X-ray inspection images of defects in UHV key parts welds. (a) pores 1, (b) pores 2, (c) pores 3, (d) slag inclusions 1, (e) slag inclusions 2, (f) slag inclusions 3, (g) hot cracks 1, (h) hot cracks 2, (i) hot cracks 3
After the extraction of the defect area, the main body of the image is the weld defect. The image denoising and threshold segmentation image processing are carried out for the defect position, and the results are shown in Fig. 8. It can be seen that the noise reduction method based on monostable stochastic resonance can adapt to the production field images of different color levels, and can enhance and retain weak defects to a great extent. The haze of the field image will affect the image contrast, but generally speaking, the X-ray image of the weld of UHV key parts can be processed into the result of easily distinguishable defects through noise reduction and threshold segmentation.
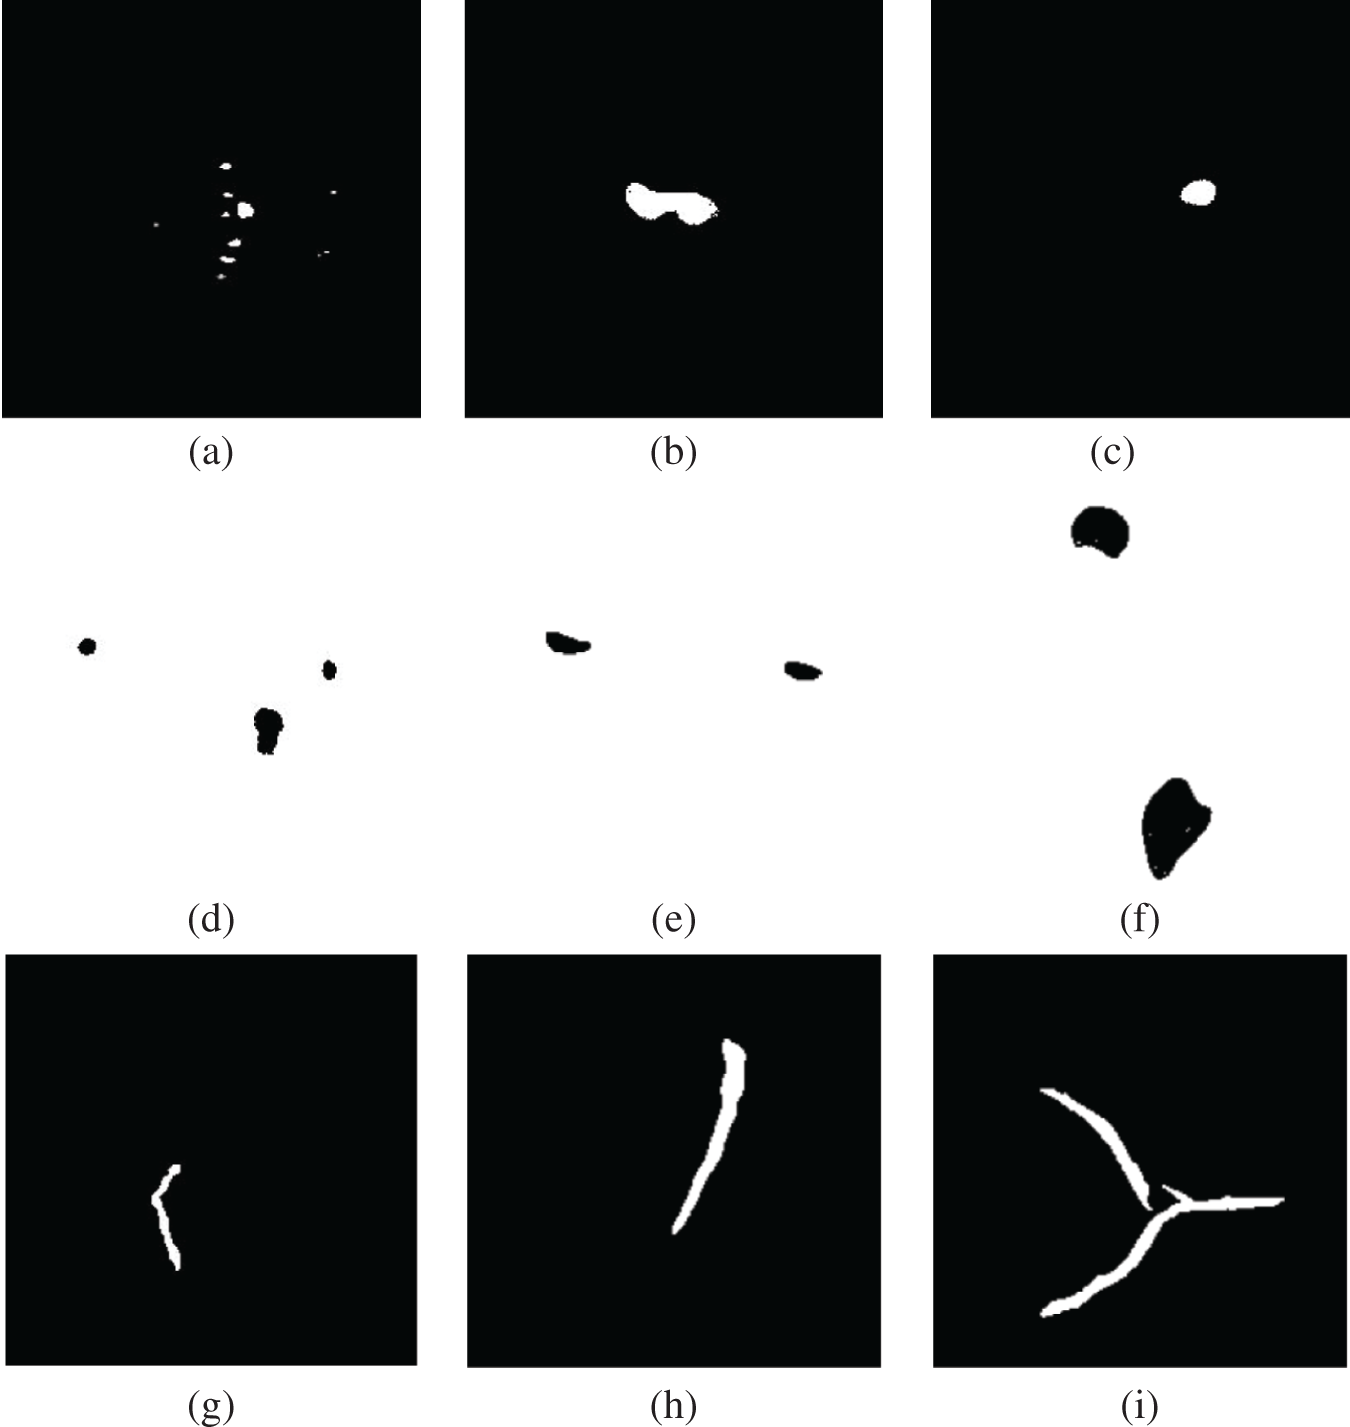
Figure 8: Defect images after noise reduction and threshold segmentation
After obtaining a clear binary image with weak defects, the defect area, perimeter, slenderness ratio and duty cycle are extracted. As shown in Fig. 9, the overall extraction result is good, but sometimes there is excessive extraction. In Fig. 9b, a whole defect is extracted into three defects. At this point, manual help is needed to judge the real defects and make further decisions.

Figure 9: Automatic extraction results of weld weak defect features including slag inclusions, pores, and cracks
The feature parameters automatically extracted from the defect area are shown in Table 2. The defect grade can be set according to the characteristic parameters, and the defect severity can be further evaluated.

The low accuracy of weak welding seam defect identification of key components of UHV equipment based on X-ray images is a long-standing problem. Traditional methods can no longer meet the detection needs of higher requirements. In order to better identify weak defects, a series of processing is performed on X-ray images, including image noise reduction based on monostable stochastic resonance, and the improved threshold segmentation processing based on edge detection. Finally, based on the pre-order traversal of the binary tree, the automatic identification of the defect connected area is realized, and the characteristic parameters are set according to the industry detection standard. The main features of weld defects are automatically extracted and quantified.
Compared with Gaussian filter which is the representative of traditional image noise reduction methods, the proposed noise reduction method based on monostable stochastic resonance can better retain weak features while removing noise. Compared with the classical Otsu threshold segmentation, the improved Otsu threshold segmentation combined with Laplacian edge detection can better realize the segmentation of features and background. According to the industry standard NBT 47013.11-2015, the area, perimeter, slenderness and interval duty ratio are selected as parameters, which solve the problems of lack of dimension and low feature extraction efficiency for X-ray image defect feature extraction of key components of UHV equipment.
The experimental results show that the method in this paper can accurately extract the weak weld defect features and improve the weld quality detection accuracy. At the same time, the relevant results provide a basis for subsequent decision-making such as the evaluation of weld defects, and significantly improve the efficiency of weld quality inspection of UHV equipment key components. In addition, the proposed method is not only suitable for X-ray weld inspection images, but also for other image detail feature extraction under noise background.
Acknowledgement: We thank professor Jianhua Yang of CUMT for his suggestions and guidance on this study.
Funding Statement: This work is supported by the Priority Academic Program Development of Jiangsu Higher Education Institutions.
Conflicts of Interest: The authors declare that they have no conflicts of interest to report regarding the present study.
References
1. Zhang, L., Zhang, Y. J., Dai, B. C., Chen, B., Li, Y. F. (2019). Welding defect detection based on local image enhancement. IET Image Processing, 13(13), 2647–2658. DOI 10.1049/iet-ipr.2018.5840. [Google Scholar] [CrossRef]
2. Hou, W., Wei, Y., Jin, Y., Zhu, C. (2019). Deep features based on a DCNN model for classifying imbalanced weld flaw types. Measurement, 131(5), 482–489. DOI 10.1016/j.measurement.2018.09.011. [Google Scholar] [CrossRef]
3. Sun, J., Li, C., Wu, X. J., Palade, V., Fang, W. (2019). An effective method of weld defect detection and classification based on machine vision. IEEE Transactions on Industrial Informatics, 15(12), 6322–6333. DOI 10.1109/TII.2019.2896357. [Google Scholar] [CrossRef]
4. Alwaheba, A. I., Surin, V. I., Ivanova, T. E., Ivanov, O. V., Beketov, V. G. et al. (2021). Detection of defects in a welded joint by scanning contact potentiometry. Nondestructive Testing and Evaluation, 36(3), 261–277. DOI 10.1080/10589759.2020.1740702. [Google Scholar] [CrossRef]
5. Yang, D., Cui, Y., Yu, Z., Yuan, H. (2021). Deep learning based steel pipe weld defect detection. Applied Artificial Intelligence, 35(15), 1237–1249. DOI 10.1080/08839514.2021.1975391. [Google Scholar] [CrossRef]
6. Shen, Q. M., Gao, J. M., Li, C. (2010). Water submerged segmentation algorithm for weld defects. Journal of Xi’an Jiaotong University, 44(3), 90–94. [Google Scholar]
7. Chen, Q., Xun, Y., Cui, D., Bao, G. J., Yang, Q. H. (2012). X-ray weld image defect extraction based on SUSAN algorithm. Mechatronic Engineering, 29(10), 1159–1162. [Google Scholar]
8. Li, Z., Mu, X. Y. (2019). Weld defect identification based on independent component analysis. Modern Computer, 2019(5), 59–61. [Google Scholar]
9. Yu, W., Li, Y., Yang, H. (2021). The centerline extraction algorithm of weld line structured light stripe based on pyramid scene parsing network. IEEE Access, 9, 105144–105152. DOI 10.1109/ACCESS.2021.3098833. [Google Scholar] [CrossRef]
10. Zhang, H., Miao, H. X., Guo, Z. W. (2021). Extraction method of laser fringe centerline in dynamic environment. Computer Measurement and Control, 29(12), 226–233. [Google Scholar]
11. Abdelkader, R., Ramou, N., Khorchef, M., Chetih, N., Boutiche, Y. (2021). Segmentation of x-ray image for welding defects detection using an improved Chan-Vese model. Materials Today: Proceedings, 42, 2963–2967. [Google Scholar]
12. Ding, X. D., Gao, X. D., Lin, S. D., Hu, D., Pan, C. R. (2021). Wavelet soft-hard threshold compromise denoising method for welding seam forming measurement. Chinese Journal of Welding, 42(2), 51–55+100–101. [Google Scholar]
13. Patil, R. V., Reddy, Y. P. (2021). Weld imperfection classification by texture features extraction and local binary pattern. In: Modeling, simulation and optimization, pp. 367–378. Singapore: Springer. [Google Scholar]
14. Boaretto, N., Centeno, T. M. (2017). Automated detection of welding defects in pipelines from radiographic images DWDI. NDT & E International, 86(10), 7–13. DOI 10.1016/j.ndteint.2016.11.003. [Google Scholar] [CrossRef]
15. Bologna, F., Tannous, M., Romano, D., Stefanini, C. (2022). Automatic welding imperfections detection in a smart factory via 2-D laser scanner. Journal of Manufacturing Processes, 73(1), 948–960. DOI 10.1016/j.jmapro.2021.10.046. [Google Scholar] [CrossRef]
16. Tripicchio, P., Camacho-Gonzalez, G., D’Avella, S. (2020). Welding defect detection: Coping with artifacts in the production line. The International Journal of Advanced Manufacturing Technology, 111(5), 1659–1669. DOI 10.1007/s00170-020-06146-4. [Google Scholar] [CrossRef]
17. Huang, Y., Xu, S., Yang, L. (2019). Defect detection during laser welding using electrical signals and high-speed photography. Journal of Materials Processing Technology, 271(3), 394–403. DOI 10.1016/j.jmatprotec.2019.04.022. [Google Scholar] [CrossRef]
18. He, Y., Yu, Z., Li, J. (2019). Weld seam profile extraction using top-down visual attention and fault detection and diagnosis via EWMA for the stable robotic welding process. The International Journal of Advanced Manufacturing Technology, 104(9), 3883–3897. DOI 10.1007/s00170-019-04119-w. [Google Scholar] [CrossRef]
19. Shin, S., Jin, C., Yu, J. (2020). Real-time detection of weld defects for automated welding process base on deep neural network. Metals, 10(3), 389. DOI 10.3390/met10030389. [Google Scholar] [CrossRef]
20. Zhang, Y. S., Yang, G. W., Wang, Q. Q., Ma, L., Wang, Y. Z. (2019). Weld feature extraction based on fully convolutional neural network. China Laser, 46(3), 36–43. [Google Scholar]
21. Schmoeller, M., Stadter, C., Kick, M. K., Geiger, C., Zaeh, M. F. (2021). A novel approach to the holistic 3D characterization of weld seams—Paving the way for deep learning-based process monitoring. Materials, 14(22), 6928. DOI 10.3390/ma14226928. [Google Scholar] [CrossRef]
22. Li, Q. G., Gao, W. X. (2019). X-ray weld defect identification based on deep learning. Journal of Xi’an Shiyou University, 34(4), 74–81. [Google Scholar]
23. Shang, J., An, W., Liu, Y. (2020). Oil pipeline weld defect identification system based on convolutional neural network. KSII Transactions on Internet and Information Systems, 14(3), 1086–1103. [Google Scholar]
24. Liu, J., Hu, B., Yang, F., Zang, C., Ding, X. (2020). Stochastic resonance in a delay-controlled dissipative bistable potential for weak signal enhancement. Communications in Nonlinear Science and Numerical Simulation, 85(1), 105245. DOI 10.1016/j.cnsns.2020.105245. [Google Scholar] [CrossRef]
25. Kang, Y., Liu, R., Mao, X. (2021). Aperiodic stochastic resonance in neural information processing with Gaussian colored noise. Cognitive Neurodynamics, 15(3), 517–532. DOI 10.1007/s11571-020-09632-3. [Google Scholar] [CrossRef]
26. Gong, T., Yang, J., Sanjuán, M. A., Liu, H. (2022). Adaptive stochastic resonance for bolt looseness identification under strong noise background. Journal of Computational and Nonlinear Dynamics, 17(7), 071003. DOI 10.1115/1.4053799. [Google Scholar] [CrossRef]
27. Xu, Z. H., He, Y. Z., Kang, Y. M. (2022). Research on color image perception based on random firing neuron network. Acta Physica Sinica, 71(7), 64–75. [Google Scholar]
28. Morfu, S., Usama, B. I., Marquié, P. (2021). On some applications of vibrational resonance on noisy image perception: The role of the perturbation parameters. Philosophical Transactions of the Royal Society A, 379(2198), 20200240. DOI 10.1098/rsta.2020.0240. [Google Scholar] [CrossRef]
29. Fu, K. Q., Ma, Y., Wu, Y. J., Yang, T. W., Sun, X. L. et al. (2021). Feature extraction algorithm and realization for typical defects in X-ray imaging of aluminum alloy die castings. Special Casting and Nonferrous Alloys, 41(12), 1472–1477. DOI 10.15980/j.tzzz.2021.12.005. [Google Scholar] [CrossRef]
30. Chang, Y., Gao, J. (2021). Tamper detection in pipeline girth welding based on radiographic images. Measurement, 167(4), 108436. DOI 10.1016/j.measurement.2020.108436. [Google Scholar] [CrossRef]
31. Shen, M., Yang, J., Jiang, W., Sanjuán, M. A., Zheng, Y. (2022). Stochastic resonance in image denoising as an alternative to traditional methods and deep learning. Nonlinear Dynamics, 109(3), 2163–2183. DOI 10.1007/s11071-022-07571-8. [Google Scholar] [CrossRef]
32. Fan, B. Q., Zhang, Y. J., He, Y., You, K., Li, M. Q. et al. (2020). Adaptive monostable stochastic resonance for processing UV absorption spectrum of nitric oxide. Optics Express, 28(7), 9811–9822. DOI 10.1364/OE.384867. [Google Scholar] [CrossRef]
33. Shen, M., Yang, J., Sanjuán, M. A., Zheng, Y., Liu, H. (2021). Adaptive denoising for strong noisy images by using positive effects of noise. The European Physical Journal Plus, 136(6), 698. DOI 10.1140/epjp/s13360-021-01693-5. [Google Scholar] [CrossRef]
34. Zhang, H., Di, X., Zhang, Y. (2020). Real-time CU-Net-based welding quality inspection algorithm in battery production. IEEE Transactions on Industrial Electronics, 67(12), 10942–10950. DOI 10.1109/TIE.2019.2962421. [Google Scholar] [CrossRef]
35. Anuranjeeta, N. A., Sharma, S., Sharma, N., Singh, M., Shukla, K. K. (2020). Enhancement and segmentation of histopathological images of cancer using dynamic stochastic resonance. International Journal of Medical Engineering and Informatics, 12(2), 180–193. DOI 10.1504/IJMEI.2020.106901. [Google Scholar] [CrossRef]
Cite This Article
 Copyright © 2023 The Author(s). Published by Tech Science Press.
This work is licensed under a Creative Commons Attribution 4.0 International License , which permits unrestricted use, distribution, and reproduction in any medium, provided the original work is properly cited.
 Downloads
 Citation Tools