
 Submit a Paper
 Propose a Special lssue
 Open Access
ARTICLE

Two-Stage Optimal Dispatching of Wind Power-Photovoltaic-Solar Thermal Combined System Considering Economic Optimality and Fairness
1 School of New Energy & Power Engineering, Lanzhou Jiaotong University, Lanzhou, 730000, China
2 China Petroleum Pipeline Engineering Corporation, Langfang, 065000, China
3 Electric Power Research Institute of State Grid Gansu Electric Power Company, Lanzhou, 730000, China
* Corresponding Author: Haiying Dong. Email:
Energy Engineering 2023, 120(4), 1001-1022. https://doi.org/10.32604/ee.2023.024426
Received 30 May 2022; Accepted 26 August 2022; Issue published 13 February 2023
 View Full Text
 Download PDF
Abstract
Aiming at the problems of large-scale wind and solar grid connection, how to ensure the economy of system operation and how to realize fair scheduling between new energy power stations, a two-stage optimal dispatching model of wind power-photovoltaic-solar thermal combined system considering economic optimality and fairness is proposed. Firstly, the first stage dispatching model takes the overall economy optimization of the system as the goal and the principle of maximizing the consumption of wind and solar output, obtains the optimal output value under the economic conditions of each new energy station, and then obtains the maximum consumption space of the new energy station. Secondly, based on the optimization results of the first stage, the second stage dispatching model uses the dispatching method of fuzzy comprehensive ranking priority to prioritize the new energy stations, and then makes a fair allocation to the dispatching of the wind and solar stations. Finally, the analysis of a specific example shows that the model can take into account the fairness of active power distribution of new energy stations on the basis of ensuring the economy of system operation, make full use of the consumption space, and realize the medium and long-term fairness distribution of dispatching plan.Graphic Abstract
Keywords
At present, China has become the country with the largest installed capacity of wind power and photovoltaic power generation in the world, and the problems of wind and solar abandonment have become increasingly prominent [1,2]. The solar thermal power generation technology with the characteristics of clean, good regulation performance and equipped with energy storage system has gradually become a hot spot [3]. With the rapid development of the new energy industry, how to coordinate the fair dispatching of the scenic spots on the basis of ensuring the overall economy of the system is of great significance to the sustainable development of China’s new energy industry [4].
Miao et al. [5] proposed the concept of a photovoltaic solar-thermal combined power generation base. After the combined power generation base is connected to the power grid, the optimal dispatching of the power system is realized with the goal of reducing the peak-to-valley difference and reducing costs. Xiao et al. [6] established the hierarchical optimization of photovoltaic-photothermal combined optimization operation system. He et al. [7] studied the grid connected optimal dispatching of integrated energy systems including wind power and photovoltaic power generation. In order to realize the friendly grid connection of a high proportion of new energy in the power system, Zhang et al. [8] integrates wind farms, photovoltaic power plants and solar thermal plants as multi-power systems, and proposes a fuzzy multi-objective optimization model for wind power-photovoltaic-solar thermal combined power generation systems. Xu et al. [9] established the grid connected operation model of wind power-solar thermal power generation system, and took the variance of system joint output as a robust optimization problem, so as to reduce the range of system output. Li et al. [10] established a two-stage comprehensive optimization model based on the robust theory. Eseye et al. [11] proposed a combined operation system of wind power, solar thermal, pumping and storage. In terms of fair dispatch, domestic research on fair dispatch of power systems with new energy focuses on the fairness evaluation of grid dispatch and dispatch mode. Wei et al. [12] proposed a fairness evaluation index considering the differences in dispatching fairness among enterprises in view of the existing “three public” dispatching, which only focuses on the dispatching results and ignores the dispatching execution process, resulting in uneven interests among power generation enterprises. In reference [13], aiming at the fairness of consumption among wind and solar power generation with different field groups and different sections, a multi-level active power control strategy is established by considering the weight of the consumption capacity of different levels of sections. Aiming at the challenges faced by multi-source coordinated control, Wang et al. [14] established a multi-energy coordinated control strategy with real-time control instructions as fairness constraints. Sun et al. [15] established an optimal dispatching model with wind power by introducing the Gini coefficient in economics and taking the power progress as the carrier as the fairness constraint. However, it still considers the fairness of the generation plan of conventional units in the regional system and lacks the research on the dispatching fairness of power stations with new energy. Guo et al. [16] has made a detailed study on the evaluation criteria of fairness of the “three public” dispatching mode applied in Mengxi power grid, but less consideration has been given to the factors affecting fairness, and the analysis is not comprehensive enough. The factors affecting the fairness of power generation plans of new energy enterprises still need to be further improved. The foreign power system is different from that in China, and the priority dispatching research for new energy power generation is earlier. The organic cooperation of scientific dispatching means and flexible power structure has fundamentally solved the priority dispatching problem of new energy [17,18].
To sum up, the research on dispatching fairness mainly focuses on fairness evaluation indicators and traditional fairness dispatching. There is less research on the fairness of multiple new energy entities participating in dispatching in the power market environment, and it is impossible to take into account the economy and fairness of system operation in the power system with new energy. The fuzzy comprehensive evaluation modeling method is different from the traditional objective function modeling or constraint condition modeling to reflect fairness. It mainly considers the intermittency and fluctuation of the wind and solar output of the new energy power system, which makes the model often have no solution. Moreover, at present, the technical level of new energy stations is uneven. On the one hand, it is necessary to ensure the rationality of the scheduling results, on the other hand, it is necessary to ensure that stations with better technical level have higher priority to power generation, which can promote the benign competition between stations and further improve the new energy power generation technology. The application of fuzzy comprehensive evaluation method can give good consideration to this problem.
In view of the above problems, this paper proposes an optimal dispatching method based on fuzzy comprehensive ranking priority evaluation. In the first stage, the calculation of the most output and consumption space of each new energy station is completed based on the regional grid load prediction value and the new energy station day ahead generation prediction value, with the minimum total operation cost of the combined system as the goal, and after comprehensively considering various constraints. In the second stage, based on fuzzy comprehensive ranking priority, carry out an objective comprehensive evaluation of new energy power stations, so as to obtain the comprehensive ranking of new energy power stations, and make a fair distribution of the dispatching plan of each power station in combination with the actual data, so as to ensure the fairness between new energy stations. Finally, the simulation calculation of each scene is carried out, and the optimization results of different scenes are compared and analyzed in the analysis of examples.
2 Two-Stage Optimal Dispatching Strategy
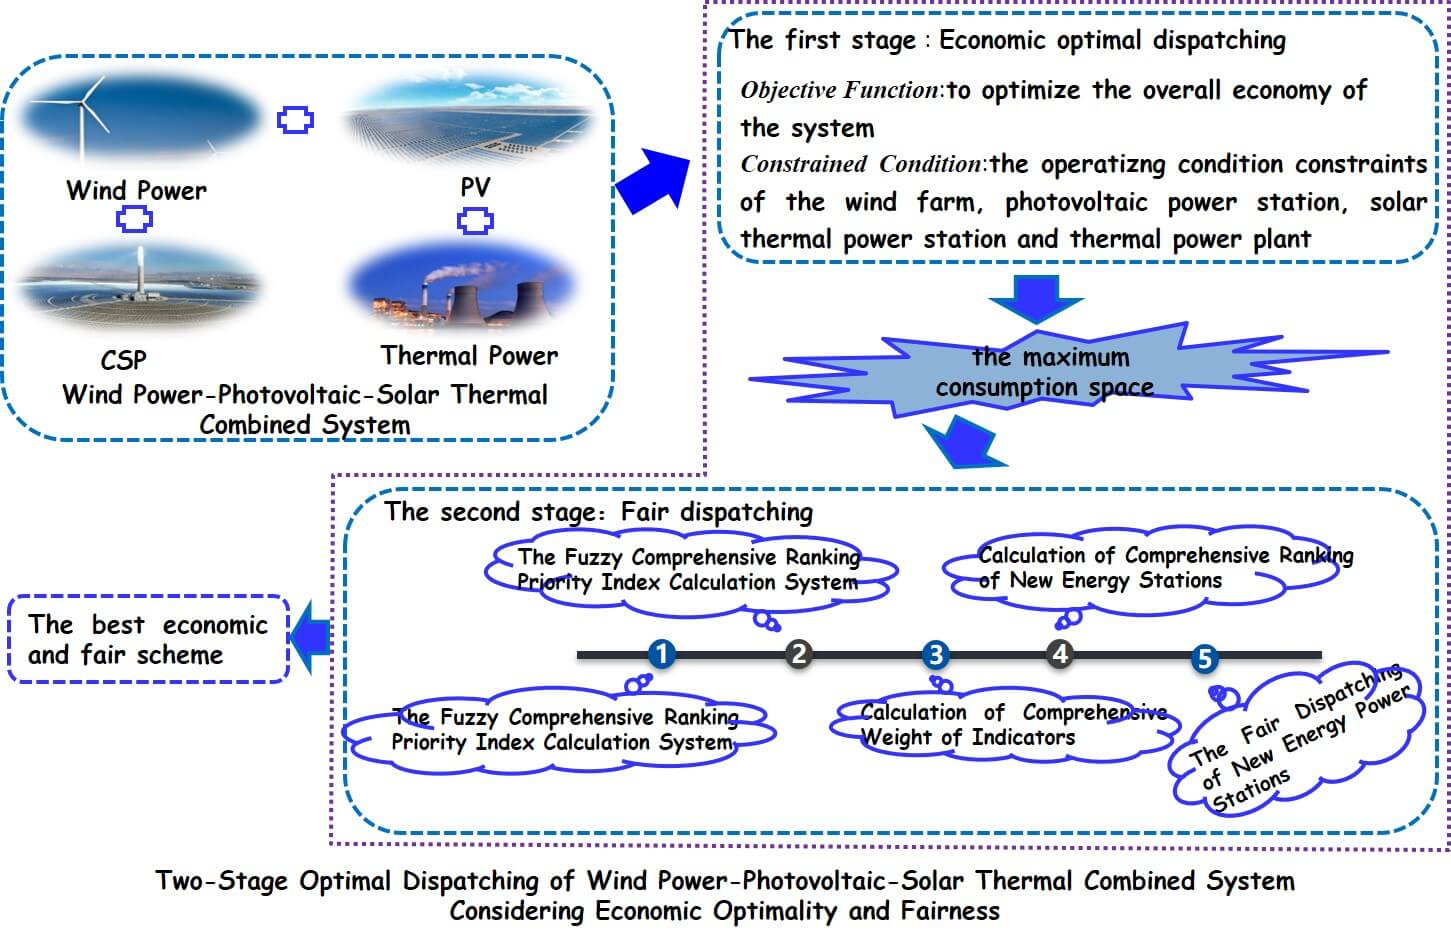
Aiming at the problems of how to ensure the economy of system operation and how to realize fair scheduling between new energy power stations after large-scale wind and solar grid connection, a two-stage optimal dispatching model of wind power-photovoltaic-solar thermal combined system considering the economic optimality and fairness is proposed. The two-stage optimal dispatching is:
In the first stage, the power is predicted according to the short-term predicted output value and regional load value of the wind farm and photovoltaic power station, with the overall economic optimization of the system as the goal, comprehensively considering the operating condition constraints of the wind farm, photovoltaic power station, solar thermal power station and thermal power plant, and taking the principle of maximizing the consumption of wind and solar power output as the principle, the optimal output value under the economic conditions of each power plant is obtained.
The second stage is to calculate the output value under the economic conditions of each station according to the calculation in the first stage, calculate the maximum consumption space of new energy stations, carry out a scientific comprehensive evaluation of new energy stations based on the fairness dispatching method of fuzzy comprehensive ranking priority, prioritize each new energy station according to the correlation degree, and then make a fair allocation to the corresponding wind and solar station dispatching plan, so as to ensure the fairness of consumption between new energy stations, and finally get the best scheme with the best system economy and fairness. The two-stage optimal dispatching strategy in this paper is shown in Fig. 1.

Figure 1: Two-stage optimal dispatching strategy for wind power-photovoltaic-solar thermal combined system
3 The Economic Optimal Dispatching Model for the First Stage
In the operation of power system with new energy, the basic objective is to minimize the total cost of system operation, maximize the consumption of new energy, minimize the pollutant emission of conventional units, and meet the load requirements of power system [19].
wherein,
(1) Peak load regulation cost of conventional thermal power units in the dispatching cycle.
where, i is the serial number of thermal power units, and N is the total number of thermal power units, T is the calculation time length, and
wherein,
(2) Carbon emissions and pollution penalty costs in the dispatching cycle.
where,
(3) Penalty cost of wind abandonment in the dispatching cycle.
where,
(4) Penalty cost of light rejection in the dispatching cycle.
where,
(5) Operation cost of solar thermal unit in the dispatching cycle.
wherein,
(1) System power balance constraint
where,
(2) Output constraints of thermal power unit
wherein,
(3) Climbing constraint of thermal power unit
where,
(4) Output constraint of photovoltaic power station
(5) Output constraint of wind farm
(6) System rotation reserve constraint
where,
(7) Output constraint of optical thermal power station
where,
Unit climbing constraints:
where,
(8) Capacity constraints for TCES (thermochemical energy storage) devices:
where,
The thermal storage and release power constraints of TCES device are:
where,
When solving the upper economic model, the commercial software package CPLEX is called on the GAMS platform to find the optimal solution to this optimization problem, and the optimal output value of wind power, photovoltaic, solar thermal and thermal power stations under the economic conditions of system operation is obtained, and then the maximum consumption space
where,
4 The Fair Dispatching Model Based on Fuzzy Comprehensive Ranking Priority for the Second Stage
Based on the fair scheduling strategy of fuzzy comprehensive ranking priority, the fair scheduling plan of each period is obtained according to the maximum predicted value of each station and the correlation degree of each station calculated through each index.
Fuzzy mathematics is the basic theory to deal with and study fuzzy phenomena. In the process of measuring the rationality of the dispatching plan issued by the dispatching organization, there will be fuzziness. It is difficult to absolutely say which unit is “fair” or “unfair” in priority, but only how “fair” it is. Based on this characteristic of fair dispatching in power system and considering various influencing factors of fair generation planning, this paper proposes an index calculation system of fuzzy comprehensive ranking priority, which is used as a fair dispatching strategy of power system with new energy to improve the degree of “fairness”.
4.1 The Fuzzy Comprehensive Ranking Priority Index Calculation System
The fuzzy comprehensive ranking priority index calculation system contains many factors that affect decision-making, and most of them are difficult to quantify. Using fuzzy language to give different degrees of evaluation values and properly synthesize the evaluation values is to properly combine the analytic hierarchy process with the fuzzy theory, and combine the weight comparison, hierarchical structure and fuzzy mathematics for analysis. This is called the fuzzy comprehensive evaluation method [20,21].
(1) The mathematical models of fuzzy comprehensive ranking priority can be divided into one-level or multi-level models. Generally, it can be summarized into the following steps [22]:
1) According to a certain classification principle, the subject to be decided is divided into n indicators of domain
2) The corresponding relationship between universe U and evaluation set can be obtained from fuzzy mapping, which is expressed by fuzzy matrix
3) Through fuzzy operation
(2) This paper proposes the following fuzzy comprehensive ranking priority fair dispatching method. The basic idea is as follows:
1) Determine the set of multiple factors that need to be considered to affect fair dispatching. It is assumed that there are n influencing factors. According to the influence degree of each factor, the weight factor
2) Analyze each influencing factor, give its calculation method, give the quantitative index and priority of dispatching plan arrangement under this principle, and give the weight value of each station under this principle to reflect the fairness of arranging the station.
3) After calculating the weight value under each principle, the comprehensive index weight value containing multiple factors is obtained. The dispatching organization can decide which station to dispatch first according to the weight value of the comprehensive index, which is the comprehensive criterion for the fair dispatching.
Considering the production characteristics, technical characteristics, operation characteristics, economic characteristics, reliability and other indicators of new energy stations, as the main factors affecting fair dispatching, a fuzzy comprehensive ranking priority evaluation system for two-tier new energy stations is established. The fuzzy comprehensive ranking priority evaluation system includes five first-class indicators, and each first-class indicator contains corresponding second-class indicators. The evaluation system is shown in Fig. 2.

Figure 2: The Fuzzy comprehensive ranking priority evaluation system
4.2 The Fuzzy Comprehensive Ranking Priority Index Calculation System
(1) Production index is the key index to measure the power generation capacity of the power station.
1) The power progress is defined as
wherein,
2) Equivalent utilization hours is defined as
where,
3) The comprehensive field power consumption rate is defined as
wherein,
4) The equipment availability is defined as
where,
5) The rate of abandoning wind and light is defined as
(2) Technical indicators. When measuring the technical level of the power station, the most valuable reference is a series of technical indicators.
1) Active power, reactive power control capability and automatic active power control capability can effectively measure the stability of power stations participating in power system dispatching.
2) Automatic active power, reactive power control capability and low-voltage transition capability, they are respectively defined as
The overall technical index is set as K, which is defined as:
(3) Operational indicators
1) The concession power station is defined as
2) The annual fluctuation variation coefficient
where,
3) The annual power factor out of limit rate is expressed in
4) The annual qualification rate of grid connected voltage is defined as
Wherein,
The overall operating characteristic index is defined as M, and the calculation formula is:
(4) Economic indicators. The economic indicators have important reference value in the comprehensive priority ranking of the scenic spots, which can not only ensure the fair distribution of the dispatching plan, but also reasonably measure the operation and maintenance costs of the scenic spots.
The annual operation and maintenance cost is defined as
The economic index is defined as E, and the calculation formula is:
(5) Reliability index: common reliability indexes include annual actual utilization rate of equipment, energy storage coefficient, mean time to repair failure and annual failure rate of power generation equipment. The annual failure rate of the power station is defined as
where,
The annual actual availability of the power station is defined as
where,
R stands for reliability index, which is defined as:
4.3 Calculation of Comprehensive Weight of Indicators
In this paper, the entropy weight method is used to solve the primary and secondary indicators of new energy power stations, and then the comprehensive weight of secondary indicators is solved. The corresponding steps are summarized as follows:
(1) According to the operation data of new energy power stations and relevant information, calculate the corresponding evaluation index values to obtain the primary and secondary index data of new energy power stations.
(2) Complete the construction of the primary index evaluation matrix
(3) According to the following steps, calculate the weight
1) Data standardization.
Standardize matrix X, and the higher the value of the positive indicator, the better:
For negative indicators, that is, when the indicator value is as small as possible:
2) Calculate the information entropy of each index
According to the definition of information entropy made by information theory, calculate the entropy
Among them,
3) Determine the weight of each indicator.
The weight of the i-th indicator
Among them,
4) Calculate the comprehensive weight of secondary indicators, as shown in formula (37):
Among them,
4.4 Calculation of Comprehensive Ranking of New Energy Stations
The comprehensive ranking of new energy power stations is calculated by grey correlation analysis method. Calculate the correlation degree between power stations according to the preset reference sequence, and realize the scientific quantification of the comprehensive ranking of power stations according to the actual size of the correlation degree. The basic process is summarized as follows:
(1) Determine the comparison sequence.
(2) Determine the reference sequence F of new energy power stations.
According to the evaluation matrix, list the reference sequence F = (
(3) Calculate the comprehensive evaluation index of power station j and its correlation coefficient with F.
where,
(4) Calculate the correlation degree
4.5 The Fair Dispatching of New Energy Power Stations
As the installed capacity of wind power and photovoltaic power plants in Jiuqvan area is quite different, the wind farm and photovoltaic power station shall be ranked according to the correlation degree under the conditions of the same type of units, so as to obtain a higher degree of fairness dispatching plan. The dispatching plan allocation steps are as follows:
(1) According to the predicted value of maximum output of each wind power and photovoltaic station and the calculated correlation degree, the dispatching plan of each period of each wind power and photovoltaic station is reallocated.
where,
(2) Compare the initial dispatching plan
The first type is
The second type is
(3) In order to ensure the maximum consumption of new energy power generation, the intermediate dispatching plan in the second case shall be adjusted appropriately.
According to the number of power stations in the second case, the residual consumption plan is redistributed according to the correlation degree, so the adjusted output
where,
Then the final dispatching plan
5.1 The Basic Data Description of Calculation Example
This paper analyzes the operation of new energy stations in Jiuquan, Gansu province. Four wind farm groups (W1, W2, W3, W4) with a total installed capacity of 800 MW, four photovoltaic power station groups (S1, S2, S3, S4) with a total installed capacity of 1600 MW, one solar thermal power station with an installed capacity of 100 MW and four traditional generating units are selected to build a system model to verify the advantages and disadvantages of the adjustment method proposed in this paper. See Table 1 for the data of traditional generating units and Table 2 for the data of new energy stations. A typical daily load forecast curve of the region in 2018 is shown in Fig. 3, and the forecast value of wind and solar output of each station is shown in Fig. 4.
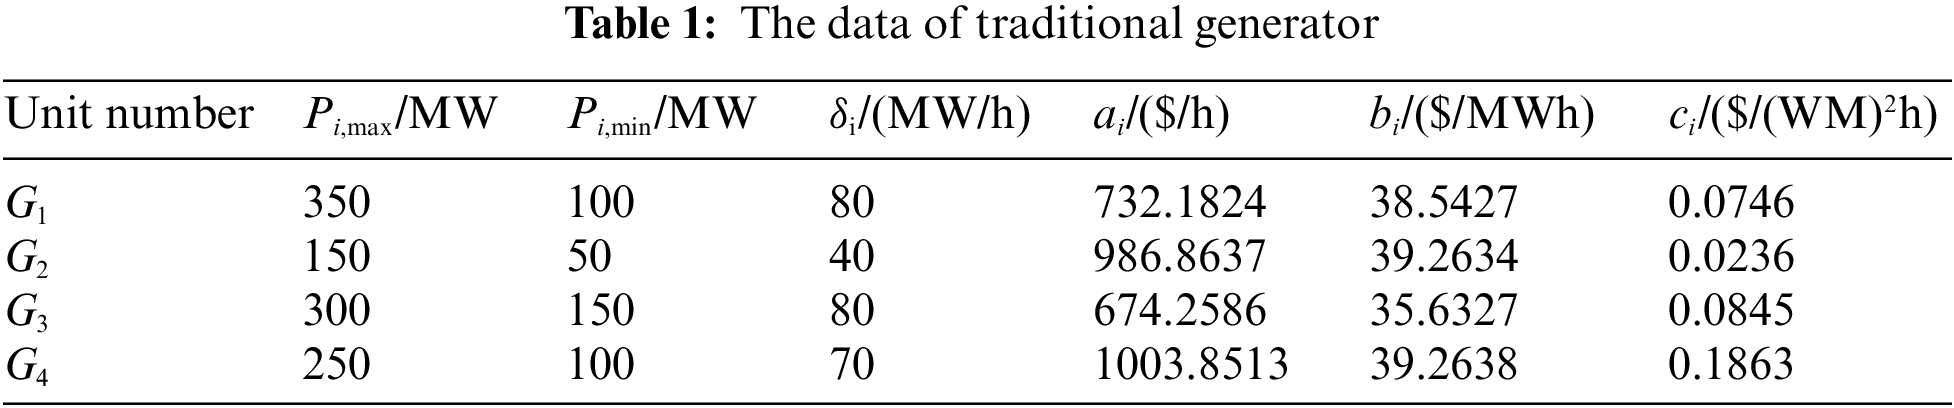
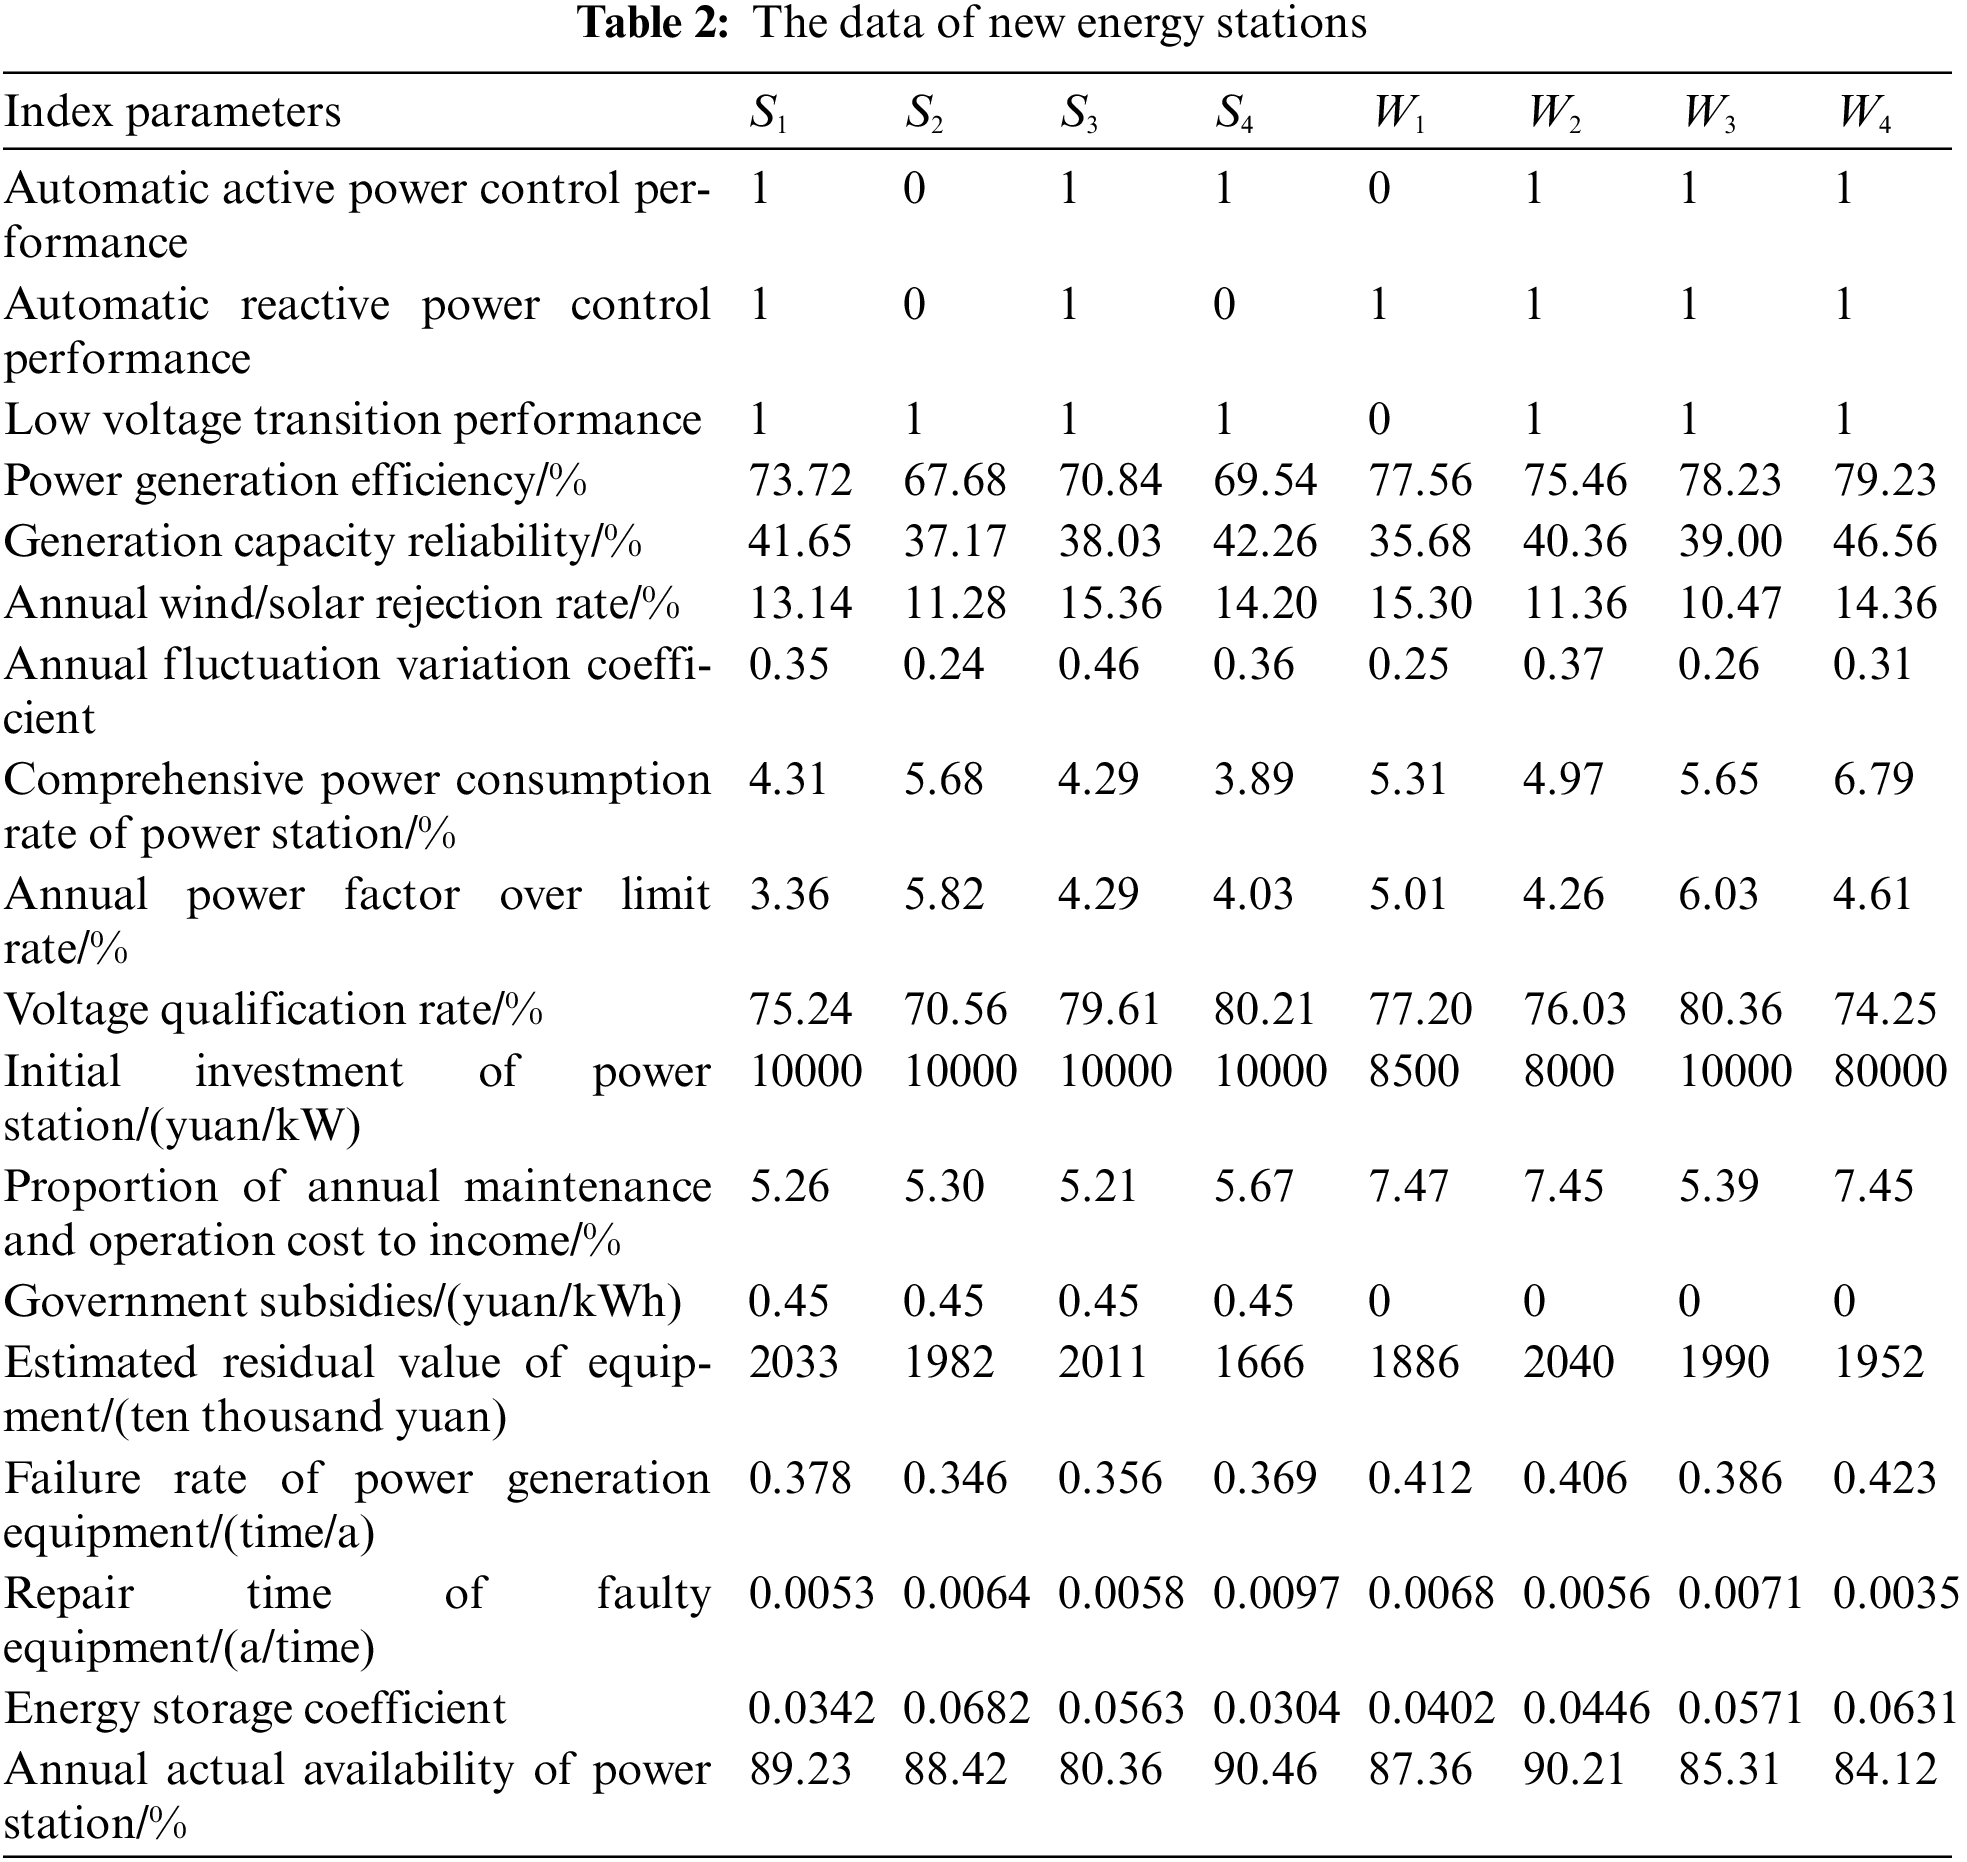

Figure 3: Load forecasting output

Figure 4: Predicted output of each station
5.2 The Fuzzy Comprehensive Ranking Priority Calculation of New Energy Power Stations
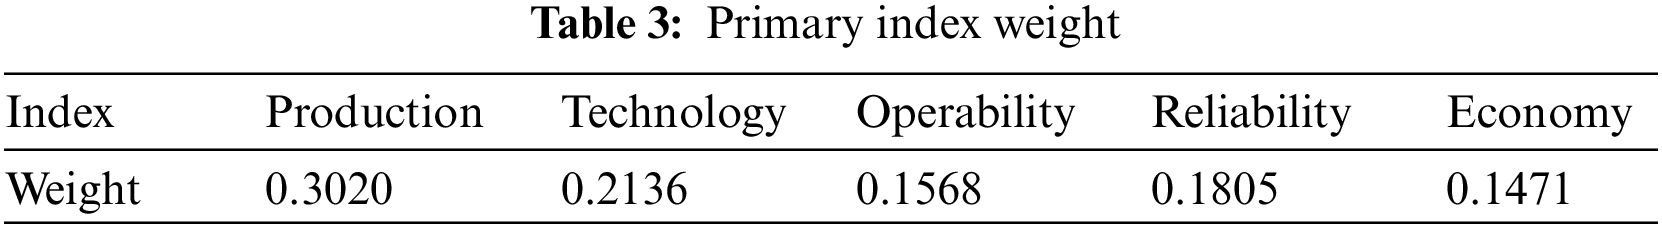
(1) Calculate the weight of primary indicators. According to the data of each new energy station, the primary index coefficient of each station is calculated based on the fuzzy comprehensive ranking priority evaluation system, and the entropy weight method is used to calculate the weight of each primary index relative to the evaluation system, as shown in Table 3.
(2) Calculate the weight of secondary indicators relative to each primary indicator. See Tables 4–8.
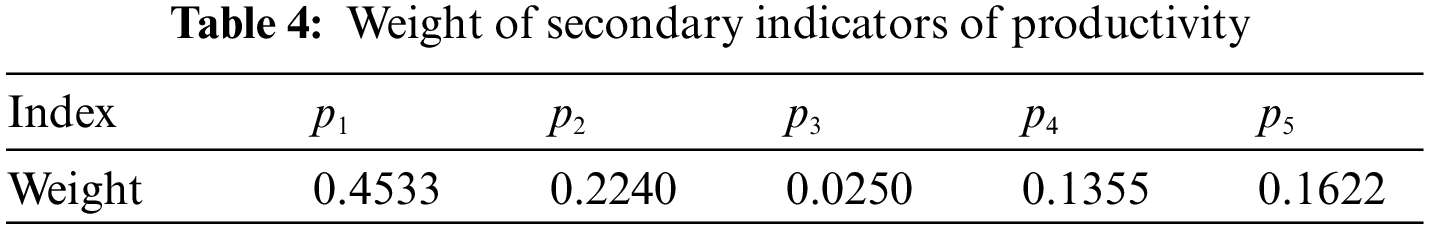
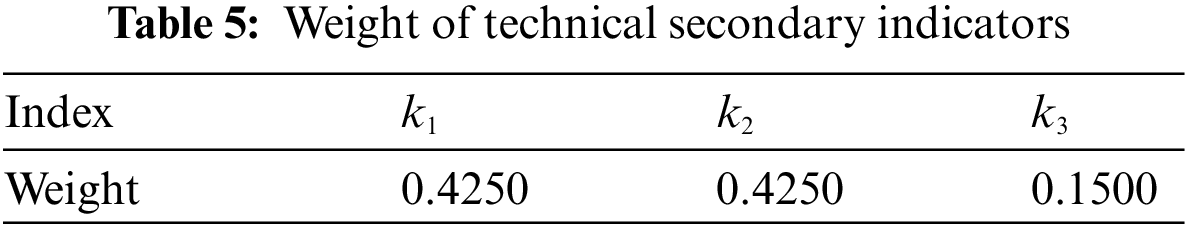

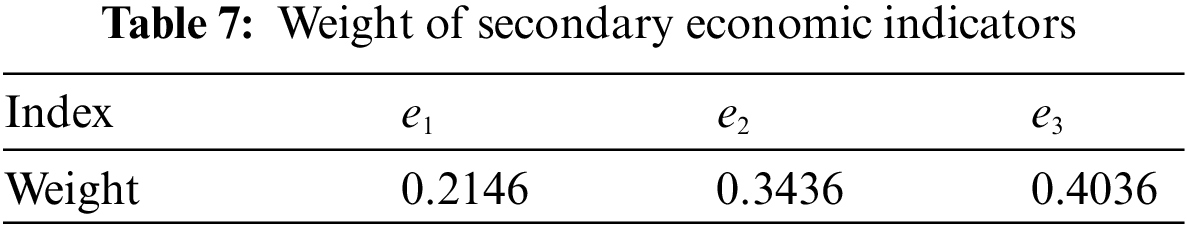

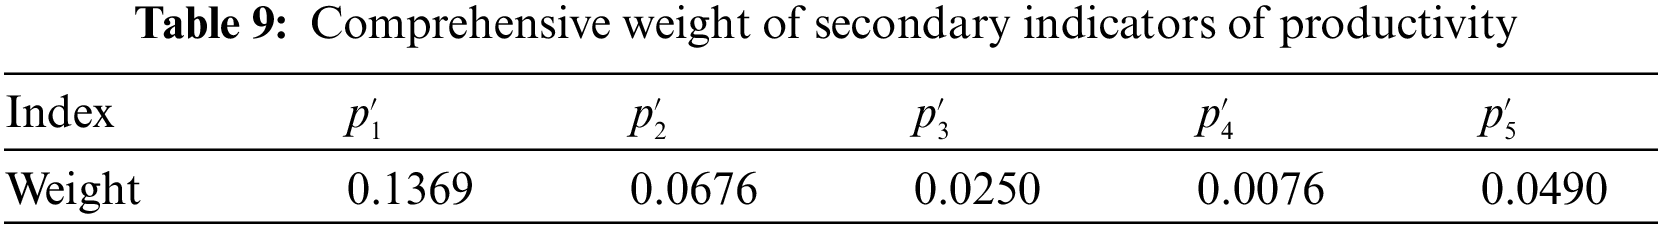
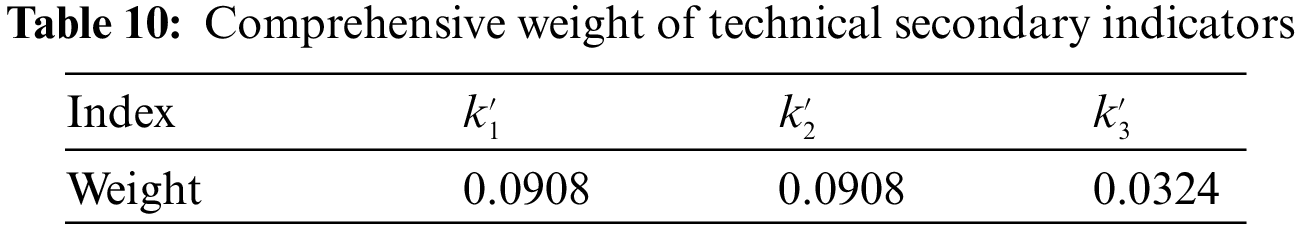
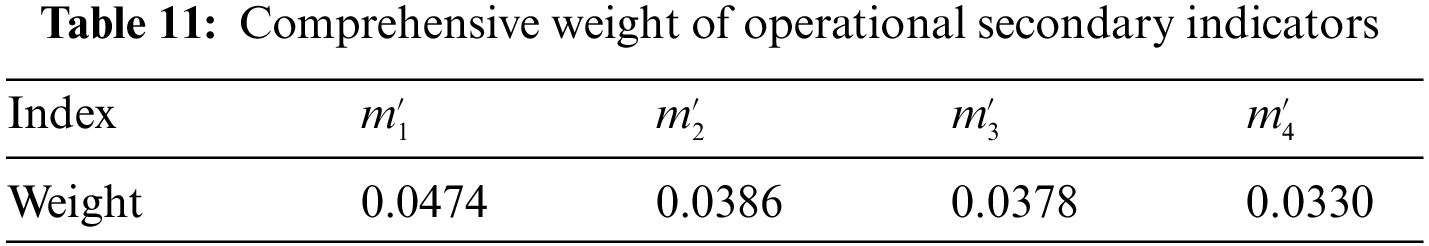
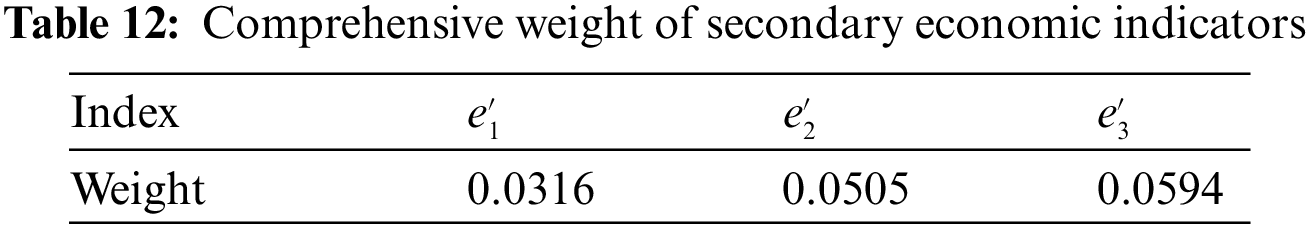
(3) Determine the comprehensive weight.
See Tables 9–13 for the comprehensive weight values of all secondary indicators.

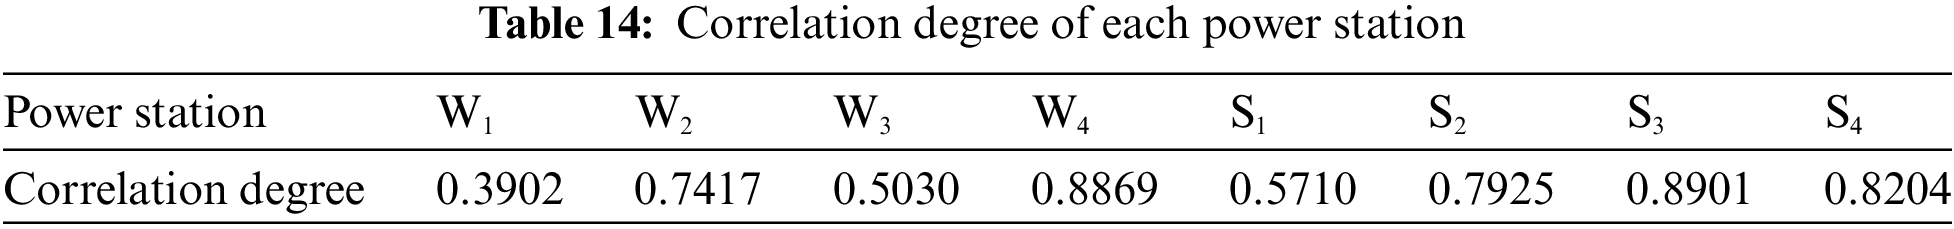
(4) Calculate the correlation degree of each station relative to the reference sequence.
After data standardization, determine the reference sequence
5.3 Multi Scenario Operation Result Analysis
In order to verify the effectiveness of the wind solar Pumping Storage joint optimal dispatching model proposed in this chapter, the whole system dispatching situation is analyzed from the macro level. Different scenarios are given as follows:
Scenario 1: Only economic dispatching is conducted for the combined system to meet the load power supply requirements.
Scenario 2: Only fair dispatching is conducted for the combined system to meet the load power supply requirements.
Scenario 3: Carry out economic dispatching for the combined system, and use the fairness dispatching method proposed in this paper to distribute the output of new energy power station fairly, so as to meet the requirements of load power supply.
The dispatching situation of each station under the three scenarios is shown in Fig. 5, and the comparison of total cost and consumption rate is shown in Table 15.

Figure 5: Dispatching results of each scenario

Based on the dispatching of three scenarios, it can be concluded that:
(1) From 0:00 to 6:00, that is, the load of the combined system is low. At this time, the photovoltaic output is 0 and the wind farm output is high. In scenario 1, only the system operation economy is considered. In this scenario, there is a large deviation between the combined output of the wind farm and the predicted output. The combined output of the wind farm is the smallest of the three. The energy storage function of the optical thermal power plant is not maximized, and there is a certain amount of wind and solar abandonment at this stage. In scenario 2, only considering the fair distribution of the dispatching plans of each station, the combined output of the wind farm is the largest compared with the other two scenarios, but it also restricts the economic operation of the system accordingly. In scenario 3, considering the economy of system operation and the fairness of each wind farm dispatching plan in this period, the combined output of the wind farm is between scenarios 1 and 2. In the three scenarios of this section, the optical thermal power station will store excess electric energy.
(2) From 8:00 to 12:00 and from 16:00 to 23:00, the output of new energy in this period fluctuates greatly. However, during the peak load of the combined system, the output of new energy under the three scenarios is not enough to meet the requirements of power supply load. Both thermal power units and solar thermal power units start to generate electricity, which reflects their own good peak shaving effect and gives full play to the complementary advantages of wind power, photovoltaic, solar thermal power and thermal power output, it can effectively reduce the fluctuation of new energy output, improve the inherent defects of single power supply, and ensure the safety of power grid operation.
(3) Through the comparison of total system cost and consumption rate under the three scenarios, scenario 1 only conducts economic dispatching for the joint system. At this time, the consumption rate of new energy is the lowest compared with the other two scenarios, but its total operation cost is the lowest; Scenario 2 only carries out fair dispatching, and its new energy consumption rate is the highest, because under the principle of fair dispatching, the joint system gives priority to dispatching new energy stations, and the total operating cost in this scenario is the highest among the three;Scenario 3 uses the strategy proposed in this paper. Its total cost and new energy consumption rate are in the middle of the three scenarios, which can be considered as the optimal scheme.
The above data show that in scenario 3, under the requirements of these two main objectives, the new energy dispatching plan and the total system operation cost are the most “reasonable” through the two-stage optimal dispatching of the combined system.
5.4 Comparison and Analysis of Dispatching Plans of Stations
The analysis of the overall output of the wind power-photovoltaic-solar thermal combined system does not reflect whether the internal dispatching of the new energy stations is reasonable. Therefore, this paper focuses on the micro level, that is, the comparative analysis of the day ahead output plans of each wind and solar new energy station, the dispatching plan and real-time predicted power of each unit obtained by the traditional economic dispatching method (i.e., “three public” dispatching mode) and the dispatching method in this paper are compared, respectively.
The situation of each photovoltaic power station is shown in Fig. 6, the output of the wind farm is shown in Fig. 7, and the comparison of dispatching plan allocation of each station is shown in Table 16.

Figure 6: Comparison of output results of each wind farm

Figure 7: Comparison of output results of each photovoltaic power station
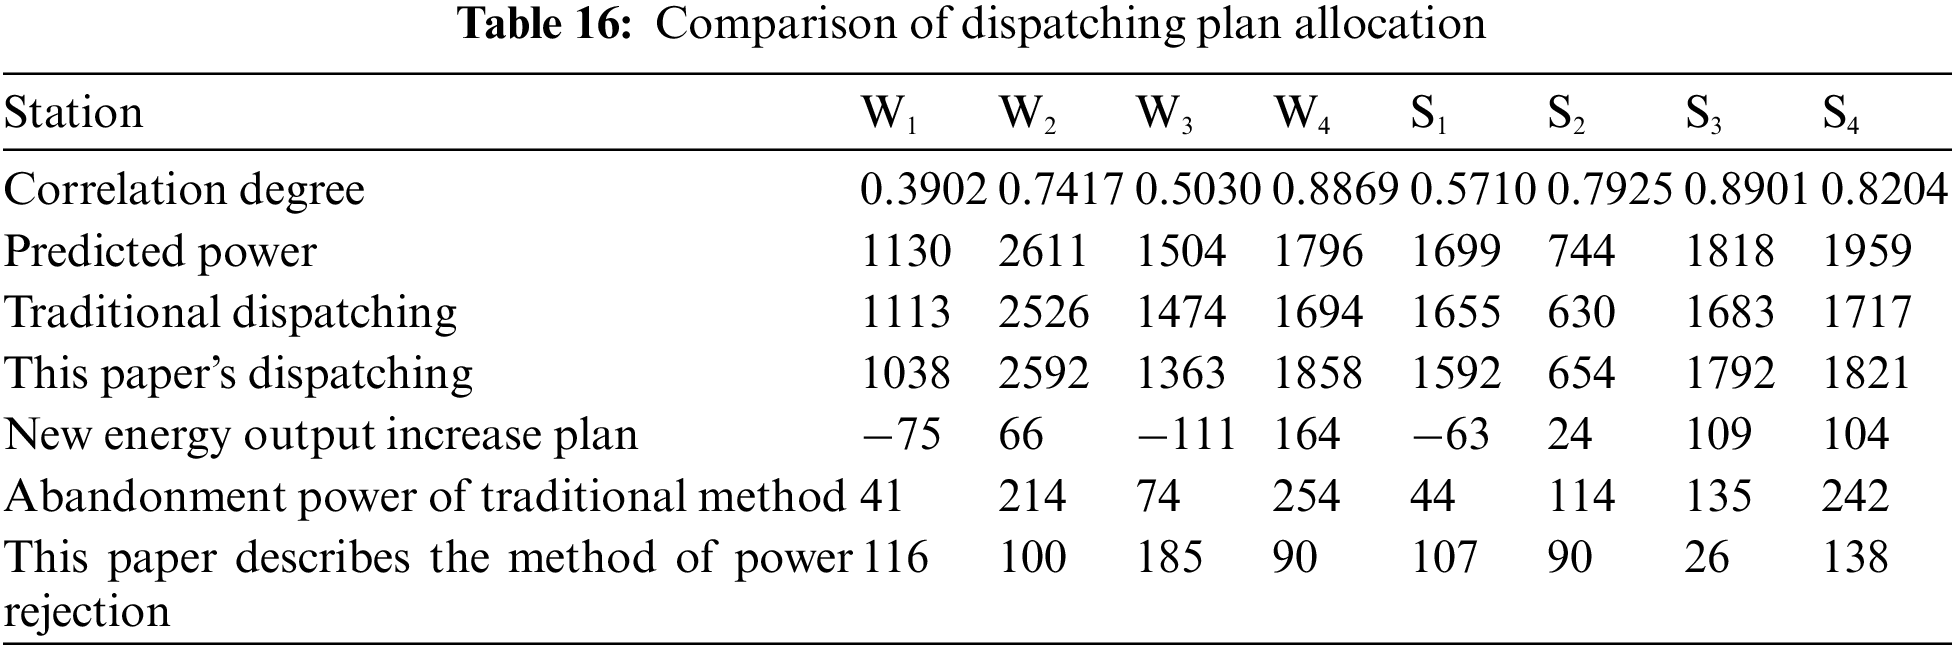
(1) Compared with the economic dispatching, the fair dispatching in this paper has the effect of increasing the issuance of renewable energy in general. The output of four wind farms has increased by 44 MW in total, and the output of four photovoltaic power stations has increased by 174 MW in total, which has increased by 218 MW in total. Therefore, the dispatching method in this paper can make full use of the consumption space.
(2) By analyzing the power limitation period of each unit in the wind farm (i.e., 0:00~6:00), the economic dispatching mode allocates the power generation indicators according to the principle of the lowest total cost while retaining a certain safety margin, and issues the peak shaving command curve manually. In general, the economic dispatching mode has a limited number of orders and a large adjustment range, which is not conducive to the consumption of renewable energy. In the period of power limitation, the wind abandonment of this strategy is 147.37 MW less than that of economic dispatching strategy; During the period of large output (i.e., 10:00~15:00), under the fair dispatching plan in this paper, each photovoltaic power station has a high degree of coincidence with the power prediction curve, and can basically achieve the maximum consumption of the predicted power of new energy power stations.
(3) According to the scheduling strategy in this paper, according to the fuzzy comprehensive ranking priority method, stations with large correlation value should get more scheduling plans.
A two-stage optimal dispatching model of wind power-photovoltaic-solar thermal combined system considering economic optimality and fairness is proposed. The fair dispatching strategy based on the fuzzy comprehensive ranking priority is used to allocate the fairness of the dispatching plan of new energy stations. Through the calculation of the comprehensive ranking priority of each station, the fair distribution of the day ahead dispatching plan is realized, the new energy is maximized, and the output of each station is optimized. The results of a specific example show that:
(1) Using the strategy proposed in this paper, the total operating cost is 12.1124 million yuan, the scenery consumption rate reaches 88.04%, and the total operating cost and scenery consumption rate are “in the middle”, which can be used as the optimal scheme. Moreover, 218 MW dispatching plan has been added to renewable energy under the dispatching method in this paper, which can make full use of the consumption space.
(2) The regional power grid model is established through the combination of multiple types of power sources. Using the flexible coordination and dispatching ability of optical thermal power stations, and the dispatching method based on the fuzzy comprehensive ranking priority, when the system cannot fully absorb new energy, it can make the dispatching plan of new energy power stations distribute fairly, effectively reduce the waste of wind and solar, and protect the interests of new energy power generation enterprises.
(3) While ensuring fairness, it also takes into account the economy of the operation of the multi energy complementary combined power generation system, so that the new energy power generation industry can realize the overall and orderly operation. The medium and long-term dispatching based on this method can also realize the fair distribution of power station dispatching plan.
Funding Statement: This paper is a phased achievement of Gansu Province’s Major Science and Technology Project (19ZD2GA003) “Key Technologies and Demonstrative Applications of Market Consumption and Dispatching Control of Photothermal-Photovoltaic-Wind Power New Energy Base (Multi Energy System Optimization)”.
Conflicts of Interest: The authors declare that they have no conflicts of interest to report regarding the present study.
References
1. Wu, H. J., Shen, J. J., Cheng, C. T., Lu, J. Y., Li, G. (2005). Multi power short-term joint peak shaving method for network provincial two-level dispatching. Chinese Journal of Electrical Engineering, 35(11), 2743–2755. [Google Scholar]
2. Pan, C., Li, R. Y., Cai, G. W., Yang, Y. Q., Zhang, Y. H. (2022). Combined forecasting model considering attribute reduction and aggregation of wind speed. Power Grid Technology, 46(4), 1355–1362. [Google Scholar]
3. Du, E. S., Zhang, N., Kang, C. Q., Miao, M. (2016). Summary and prospect of research on grid connected operation and optimization planning of solar thermal power generation. Chinese Journal of Electrical Engineering, 21, 5765–5775. [Google Scholar]
4. Zhang, P., Huang, Y. H., Li, C., Kang, L., Yue, G. W. (2020). Research on coordinated dispatching method of new energy power stations based on fair power generation. Electric Measurement and Instrumentation, 57(5), 76–85. [Google Scholar]
5. Miao, M., Liu, S., Shi, T., Guo, Y. S., Zhang, Y. Q. et al. (2019). Grid connected optimal dispatching model for photovoltaic solar thermal combined power generation base. China Power, 52(4), 51–58. [Google Scholar]
6. Xiao, B., Wang, T. (2020). Optimal operation model of solar photovoltaic solar thermal combined power generation. Modern Power, 37(2), 163–170. [Google Scholar]
7. He, P., Wu, X. X., Chen, J., Li, C. S., Ji, Y. Q. (2019). Low frequency oscillation of integrated energy system including wind power and photovoltaic power generation. Journal of Electric Power Science and Technology, 34(1), 20–27. [Google Scholar]
8. Zhang, H., Chen, Z., Huang, R., Ding, K., Dong, H. Y. (2021). Fuzzy multi-objective optimization model for wind photovoltaic solar thermal combined power generation system. Journal of Power Supply, 19(2), 112–120. [Google Scholar]
9. Xu, T., Zhang, N. (2016). Coordinated operation of concentrated solar power and wind resources for the provision of energyand reserve services. IEEE Transactions on Power Systems, 32(2), 1260–1271. [Google Scholar]
10. Li, X. Z., Wang, W. Q. (2021). Two stage robust game optimal scheduling of regional integrated energy system. Journal of Zhejiang University (Engineering Edition), 55(1), 177–188+212. [Google Scholar]
11. Eseye, A. T., Zheng, D., Li, H., Zhang, J. (2017). Grid-price dependent optimal energy storage management strategy for grid-connected industrial microgrids. 2017 Ninth Annual IEEE Green Technologies Conference (GreenTech), pp. 124–131. Denver, CO, USA. [Google Scholar]
12. Wei, X. H., Hu, C. Y., Yang, L. (2012). Thinking and suggestions on the existing evaluation indicators of “three public” dispatching. Automation of Electric Power Systems, 36(20), 109–112. [Google Scholar]
13. Shi, G. R., Sun, R. F., Xu, H. X., Qiao, Y. (2018). Hierarchical coordination control strategy for active power of large-scale cluster renewable energy. Power Grid Technology, 42(7), 2160–2167. [Google Scholar]
14. Wang, H. H., Xu, T. S., Ma, Y. H. (2019). Active power control strategy considering coordination of multiple types of power sources. Power System Protection and Control, 47(4), 167–175. [Google Scholar]
15. Sun, L., Zhang, N., Li, N., Liu, X. L., Li, W. D. (2020). Intraday rolling power generation plan based on Gini coefficient electricity schedule fairness. Power Grid Technology, 44(1), 340–347. [Google Scholar]
16. Guo, Q., Jing, Z. B., Gao, Z. (2014). Research on the dispatching method of wind power generation in West Inner Mongolia power grid. Inner Mongolia Electric Power Technology, 32(5), 1–4+10. [Google Scholar]
17. Tummuru, N. R., Mishra, M. K., Srinivas, S. (2013). Integration of PV/battery hybrid energy conversion system to the grid with power quality improvement features. Institute of Electrical and Electronics Engineers Inc., USA: IEEE. [Google Scholar]
18. Kapsail, M. J., Kaldellis, K. (2010). Combining hydro and variable wind power generation by means of pumped-storage under economically viable terms. Applied Energy, 87(11), 3475–3485. DOI 10.1016/j.apenergy.2010.05.026. [Google Scholar] [CrossRef]
19. Peng, Y. Y., Zhou, R. J., Li, B., Fang, S. F., Wang, Y. Z. (2020). Two stage optimal dispatch of light wind fire virtual power plant considering the characteristics of solar thermal power generation. Journal of Power System and Automation, 32(4), 21–28. [Google Scholar]
20. Wang, P., Fang, K. G., Zhang, Q. Z. (2020). Research on comprehensive evaluation of coordinated development of new energy and regional power grid. Statistics and Information Forum, 35(2), 121–128. [Google Scholar]
21. Chen, S., Jiang, Q., He, Y. Q., Huang, R. M., Li, J. Y. et al. (2020). A BP neural network-based hierarchical investment risk evaluation method considering the uncertainty and coupling for the power grid. IEEE Access, 8, 110279–110289. DOI 10.1109/ACCESS.2020.3002381. [Google Scholar] [CrossRef]
22. Chen, R. Z., Sun, H. B., Guo, Q. L., Li, Z. G., Deng, T. H. et al. (2015). Reducing generation uncertainty by integrating CSP with wind power: An adaptive robust optimization-based analysis. IEEE Transactions on Sustainable Energy, 6(2), 583–594. DOI 10.1109/TSTE.2015.2396971. [Google Scholar] [CrossRef]
Cite This Article
 Copyright © 2023 The Author(s). Published by Tech Science Press.
This work is licensed under a Creative Commons Attribution 4.0 International License , which permits unrestricted use, distribution, and reproduction in any medium, provided the original work is properly cited.
 Downloads
 Citation Tools