
 Submit a Paper
 Propose a Special lssue
 Open Access
ARTICLE

Modelling and Optimization of Clean and Affordable Electricity Solution for Small-Scale Savings and Credit Cooperatives (SACCOs)
1 College of Science and Technology, The Open University of Fujian, Fuzhou, 350013, China
2 Intelligence and Automation in Construction Provincial Higher–Educational Engineering Research Centre, Huaqiao University, Xiamen, 361021, China
3 African Centre of Excellence in Energy for Sustainable Development, University of Rwanda, Kigali, 4285, Rwanda
4 Morayo College, Nairobi, 999070, Kenya
5 Department of Economics and Management, Hebei University of Technology, Tianjin, 300401, China
6 College of Science and Technology, University of Rwanda, Kigali, 4285, Rwanda
7 Fujian Baichuan Construction Technology Co., Ltd., Huli, Xiamen, 361021, China
8 Haoqi (Xiamen) Construction Technology Co., Ltd., Haicang, Xiamen, 361021, China
9 School of Design, Ajeenkiya D Y Patil University, Pune, 412105, India
10 College of Civil Engineering, Huaqiao University, Xiamen, 361021, China
11 College of Transportation and Civil Engineering, Fujian Agriculture and Forestry University, Fuzhou, 350100, China
12 Highway Southeast Engineering Co., Ltd., Xiamen, 361100, China
13 Fuzhou Sinotom Information Technology Co., Ltd., Fuzhou, 350001, China
* Corresponding Author: Samuel Bimenyimana. Email:
Energy Engineering 2023, 120(4), 791-810. https://doi.org/10.32604/ee.2023.026746
Received 23 September 2022; Accepted 15 December 2022; Issue published 13 February 2023
 View Full Text
 Download PDF
Abstract
Renewable energy exploitation is among the development strategies set by the government of Rwanda on the roadmap to 2023/2024 universal electricity access and the United Nations plans by 2030. Numerous previous studies on clean energy technologies in Rwanda have mostly focused on households’ usage but there are currently no studies describing the feasibility of clean energy technologies for financial institutions. The skepticism on renewable energy in Africa was previously reported by some personnel. Having realized that most SACCOs (Savings and Credit Co-Operatives) in Rwanda use diesel technology for backup/emergency electricity supply, taking consideration of abundant solar resources in Rwanda, having seen the viability and feasibility studies from other countries of renewable energy for different institutions (financial included); this work uses the HOMER Energy Software and the electricity load profile of a typical SACCO in Rwanda to analyse the affordability and viability of on-site renewable energy generation for SACCO in Rwanda. The results reveal that a solar PV system with storage can be the optimal solution (with levelized cost of electricity (LCOE) of 0.713 $/kWh which is cheaper than 0.73 $/kWh for diesel technology) for SACCOs located in both off-grid areas and grid-connected areas (with 0.041 $/kWh LCOE which is lower than the current electricity tariff in Rwanda). The findings in this work can serve as basic tools/materials for policy drafters in Rwanda on how financial institutions can contribute to climate change mitigation through self-renewable energy exploitation.Keywords
Financial institutions play a significant role in the social and economic development of developing and transitional economies; where banking and non-banking financial institutions, are governed by a central government entity. Such institutions aid in the transition from net savers to net borrowers by bridging the gap between idle savings and investment and their borrowers [1,2]. Many efficient financial markets let economic agents trade, hedge, and pool risk, resulting in increased investment and economic growth as they provide a diverse range of services and banking products to both consumers and business customers. They are set to provide the economy with more liquidity and allow for more economic activity than would otherwise be achievable [3]. Among the key functions of such financial institutions can be listed not limited to management and process of deposits, commercial loans, and shares activities. The financial institutions transfer financial resources from individuals who are saving them to others who require them for economic activity. The saving and credit cooperatives are community-based and grassroots financial institutions that operate in both rural and urban regions, offering a variety of financial services not available through standard lending institutions [4]. The saving and credit cooperatives are the financial organizations owned and operated by and for their members according to democratic ideals; to encourage savings and extend loans to members at fair rates of interest utilizing pooled funds; members’ economic and social well-being is improved by offering financial services.
The history of the savings and credit cooperative dates back to 1938. With the establishment of the Grameen Bank in Bangladesh in 1976, the system/structure for savings and credit cooperative enterprise as we know it today was born. It rose to prominence in the 1980s as a result of concerns and studies about the state’s provision of subsidized credit to poor farmers Bangoura [5]. Financial cooperatives should make it possible for the poor to obtain loans at a reasonable cost and under favourable terms and circumstances. The Savings and Credit Co-operatives (SACCOs) are the institutions that have been legally established under the Cooperative Laws in Rwanda where they are owned by their members through the payment of share capital and membership fees to the institutions. Umurenge SACCO is one of them where it was initially swiftly proliferated across Rwanda through an initial government backing in the form of management wages and employee training; and up to now, in each of Rwanda’s 416 sectors, there is an Umurenge SACCO spread across thirty districts and five provinces Landall [6]. These SACCOs were established in each Rwandan administrative sector in 2009. The 416 autonomous institutions are serving 2.7 million members in total; they have made a substantial contribution to the impoverished and rural population’s financial inclusion Sparkassenstiftung [7]. They were established to alleviate poverty by improving the economic and social situations of its members by allowing them access to financial services and combating the abuse of powerless people and by pooling their resources to suit their demands, powerful individuals, or institutions. In the absence of SACCOs, the majority of the low- and middle-income group who has no land tittles/security to offer would find it difficult to obtain financing and would continue to be impoverished; thus, through SACCOs, the people should be given the tools they need to maximize their productivity.
A power outage at a bank or financial institution could have disastrous effects. Aside from not being able to complete consumer transactions, there is a chance that sensitive consumer information will be exposed which means that a data breach could result in a serious liability concern that harms the institution's reputation in the Long Run Committee [8]. Banks and financial organizations must have emergency power generation technologies on hand. In the event of a power outage, a backup electricity generation technology will kick in immediately and keep all electrically linked systems working. If electricity from the grid is absent for a few hours, several days, or longer, reliable electricity backup technology for banks can provide a continuous power source. The Bank emergency electricity technology will reduce the hazards of a power outage by allowing the institution to continue serve its customers while adhering to its usual business practices. It also helps in maintaining the building’s doors’ operation so that customers and employees can freely enter and exit. In ensuring that the building’s alarm systems are operational; assisting in the protection of sensitive client information and keeping it out of the hands of cybercriminals; keeping call centres open to answer customer questions, and providing users with access to online banking platforms while maintaining appropriate security requirements. Backup electricity units can also assist the bank in adhering to federal data protection and privacy standards Woodstockpower [9].
In Rwanda, there is an ongoing program being implemented through ‘Renewable Energy Fund (REF)’ BRD [10] which was set to address the issue of affordability by making it easier for consumers to obtain financing and for the business sector to invest in off-grid renewable energy. The Ubudehe category [11] and location [12] which the consumers (customers or customers) are affiliated determines their eligibility for that program. Customers that have received REF support and are in SACCOs, banks, or solar companies are eligible for this fund, subject to credit vetting by their respective financial institutions. All the consumer has to do is to visit their financial institutions (SACCOs, Banks, and solar companies) and fill out a solar loan application form by selecting the type of solar home system equipment they require. If their application is approved, such consumers will be subjected to credit screening before being advised of the following steps in obtaining their equipment BRD [10].
The SACCOs in Rwanda are among institutions engaged in the REF activities where they financially facilitate different customers on affordability of renewable energy technologies acquisition through different loans schemes; but the SACCOs themselves have not yet adopted at all renewable energy technologies as exemplary proof to customers on how much clean energy technologies are feasible, viable, and environment-friendly. Yet, SACCOs usually release tenders for the supply and installation of generators (as backup & emergency electricity supply) due to the fact that any financial institution (no matter its size or scale) needs a reliable electricity supply to keep its operation moving efficiently and continuously. The reasons for this gap of solar energy feasibility studies on Rwandan financial buildings/institution may be stated that numerous previous studies mostly focused on domestic and other field usages [13–15] and the fact that up today; there are no studies describing the feasibility studies of clean energy technologies for financial institutions in Rwanda; these two factors lead to the main objectives of this manuscript targeting to model and optimize the clean and affordable energy system for SACCOs. Based on the facts that: (a) SACCOs are among financial institutions working with the REF programme that catalyse Off-Grid Household Electrification in Rwanda through subsidy programme and loans BRD [10]; (b) skepticism for renewable energy technologies in some African countries “believing that it is feasible [16]; and (c) the proof of energy technology ‘field demonstration in West Africa (Nigeria) of a hybrid microgrid for rural microfinance organizations’ [17]; this paper is intended to explore the feasibility and viability study on how renewable energy in Rwanda can provide affordable and clean electricity services for SACCOs (clean energy sources for SACCOs located in areas with grid-powered areas and whole energy service provider for SACCOs located in off-grid areas). This study can be practical, demonstrative, and exemplary proof of how renewable energy technologies is profitable, viable, and feasible for both financial institutions and end-users/consumers interested in acquiring solar home systems loans from SACCOs and other financial institutions.
2 Affordable and Clean Energy Technologies for Financial and Non-Financial Institutions
The exploitation of renewable energy and energy efficiency are among pathways to action on climate change as well as sustainable development. However, due to a lack of visibility and a clear focus on renewable energy exploitation and energy efficiency, as well as underinvestment, the majority of this potential has gone unrealized. Worldwide, there are numerous banks, financial institutions, and organizations which have already started with the initiatives of renewable energy projects toward sustainable and clean energy generations [18]; on 5th June 2019 released notices that through its Onsite Solar Initiative, the Bank has expanded its environmental operations efforts to include the installation of solar panels across numerous locations. The solar panels installed in financial centres, ATMs, office suites, and other operational facilities will help the bank save money on electricity and reduce greenhouse gas (GHG) emissions. This scheme was intended to generate over 25 megawatts of renewable energy, which will be used to directly power the bank’s activities. One executive leader from the Bank of America stated that “low-carbon energy programs like this show how Bank of America is working to achieve our goal of using 100 percent renewable electricity by expanding our solar energy sources and alternatives”. At that time, the bank’s onsite solar installations have already saved energy and reduced carbon emissions in six financial centres. Within the 2019 year, the bank was planning for solar systems on other 15 financial centres and 10 ATMs, while their three years plan was that more than 60 solar systems were scheduled to be added across the Bank’s operations. One personnel from the Bank stated that “Using solar energy to power our facilities is part of our responsible growth strategy and helps to lessen our environmental impact” [19], a company with financial activities had wisely decided to use renewable energy to power its business buildings and branches where the firm has agreed to use 100 percent renewable energy (90 million kWh will be required to power 813 branches and 45 corporate facilities using renewable energy; this renewable energy adoption will contribute to a reduction of CO2 emissions, 45,000 tons which is equivalent to the amount of carbon dioxide released by more than 3 million trees in a single year. Decorah Bank and Trust Leaner [20] in 2008 erected its first solar panel, and at its Decorah and Cresco banks, it now has enough rooftop and parking canopy solar arrays to power nearly 20 Iowa residences.
The Asia Development Bank is among financial institutions which had already opted to install a large rooftop solar system for a variety of reasons such as to prove their belief in renewable energy (solar energy); demonstrate how business buildings in Asia may use renewable energy to lower their carbon impact and diversify their energy supply; and increase demand for solar PV panels to lower production costs and hasten the technology’s adoption [21]. In Africa, the authors Ayodele et al. [22] published their research work on a field demonstration in West Africa of a hybrid microgrid for rural microfinance organizations; their model had different renewable (solar and wind) and non-renewable energy technology (generators) plus the energy storage systems; and their findings revealed that a system with a Net Present Cost (NPC) of $468,914.00 and a Cost of Energy (COE) of 0.667 $/kWh, the hybrid system combining solar PV, battery, and diesel was the most techno-economically viable.
The sun regularly bombards the rooftops of commercial buildings with free energy. The solar systems installed on roofs and even over parking spaces can be a cost-effective solution to capture natural energy while also repurposing otherwise underutilized space. However, in the rapidly increasing solar panel market, knowing what to look for and what to avoid when it comes to installing the panels can be a difficult procedure to traverse. The majority of the energy consumption needs of commercial buildings (offices and other business entities) are met by electricity and the use of energy in an office building during the day is substantially higher, making it an ideal location for solar panels, and there are hundreds of state and federal tax rebate and credit opportunities for those interested in using solar energy in commercial buildings. Switching to generating power on-site from an internally free source of energy and can lower the company’s operational costs for decades.
For non-financial institutions; researchers have identified the potential of renewable energy technology for different building types including commercial ones. For example; the authors Datta et al. [23] performed a case study of the economic potential of rooftop photovoltaic (PV) systems in business buildings in Bangladesh and analysed the financial and environmental implications of rooftop PV installation in a case study of commercial buildings; in their study research, as a measure of performance indicator for the implemented project, a variety of economic indices such as net present value, payback period, internal rate of return, and benefit-cost ratio were considered. Their case study’s determined economic conclusion is a net present value of $756,896, with a 14.2 percent internal rate of return, a 10.1-year simple payback time, an 8.1-year equity payback, and a 1.5 benefit-cost ratio which indicates that the project has a lot of potentials. Additionally, their project’s sensitivity analysis revealed that, in most circumstances, the investment’s profitability is safeguarded by a 30 percent variance in input parameters. One research on India case study showed that solar energy can be an obvious alternative for commercial buildings, as rooftop solar systems may meet up to 20% of an office building's electrical needs Schley et al. [24–26].
The authors Prajapati et al. [27] analysed the rooftop Solar PV System for EV Charging Load in Commercial Office Buildings; their findings revealed that the proposed system was determined to be more affordable and efficient than the home charging system due to the comparable pattern of solar availability and load demand. The authors Adewale et al. [28] carried out research work for a commercial building in Nigeria, considering a time frame over of 10 years, and also based on the load profile and energy consumption. They analysed the efficient power supply which is required through an energy audit. Their findings revealed that among the three different types of energy technology (including the suggestion of solar PV system, national power grid, and the diesel technology supply); the solar PV system can be counted as renewable energy source technology that minimizes greenhouse gas emissions caused by diesel combustion. The authors Chisale et al. [29] worked on an Energy Audit and Solar PV Energy System Feasibility in a Commercial Building in Malawi; their findings revealed that if a commercial facility replaces some of its appliances with more energy-efficient ones, it can save up to 33.46 percent on electricity. Additionally, A feasibility study was done to see if solar and batteries could be integrated into the existing grid system; this proposed system had a 9.8-year simple payback period while the energy cost of the system was predicted to be 0.0372 $/kWh, with a capital cost of $150,887.
Different works have been carried out on the exploitation of renewable energy technologies in numerous perspectives. Ishraque et al. worked on the optimization whole power system and techno-economic factors of a rich islanded microgrid with various dispatch strategies taken into consideration with Bangladesh case study; according to their simulation results, the ‘load following’ was found to be the optimum dispatch strategy for the planned microgrids with the lowest net present cost, levelized cost of energy, operational cost, and CO2 emission rate [30]. Shezan SA conducted his research activities on the feasibility study for an offshore island hybrid wind-diesel-battery microgrid with voltage and power response where in the context of offshore Islands, an islanded hybrid wind-diesel-battery microgrid system (IHMS) was investigated; and the results revealed that his proposed Islanded Hybrid Microgrid System was both economically and environmentally practical [31]. An Alternative dispatch strategies and optimal scale of an islanded hybrid microgrid was also carried out [32]; the findings provided a basic guideline for estimating the generation mix and required resources for an islanded microgrid’s optimal functioning under various dispatch scenarios. Shezan, S.A. and Ishraque, M.F provided a detailed evaluation of a micro-grid hybrid alternative energy system suitable for offshore islands that combines wind, diesel, and batteries; their results from proliferation experiments demonstrate the consideration and viability of the proposed coordination; and also when compared to conventional power plants, the Net Present Cost (NPC) was reduced by roughly 79 percent and the CO2 surge was reduced by 87 percent, respectively [33]. The discussion research made by Shezan, Sk A., et al on how the effective dispatch techniques vary depending on how an island hybrid microgrid is operating; revealed that optimal dispatch method for standalone microgrid architecture was load-following because it had the lowest LCOE and NPC all based on the data information from simulation [34]. Goswami and Sadhu discussed on how using floating solar photovoltaics in waste water management systems creates a novel nexus between the use of water and energy, low-cost clean energy production, and water conservation; their findings showed that the social and economic performance of the floating solar photovoltaic (FSPV) system was superior to that of the land-based PV (LBPV) system Goswami et al. [35]. Also, a typical PV battery system techno-economic study analysis was done by Han et al. on a case study of Switzerland; For some residential customer groups, their results showed that integrating photovoltaic (PV) with batteries already yields superior net present values than PV alone additionally the payback timeframes vary between 2020 and 2035 as a result of the conflicting effects of shifting policies, rising costs, and fluctuations in the price of power [36].
The research in this paper used the HOMER software [37], a tool utilized to build and assess off-grid and on-grid power systems for remote, stand-alone, and distributed generation applications from a technical and financial standpoint were used in this paper. The technologies analysed for the typical SACCO case study located in Rwamagana district (2°2.2′S, 30°15.2′E) include off-grid diesel technology, grid-connected diesel technology, off-grid PV system with storage technology, and grid-connected PV technology with storage). The HOMER cycle charging was used as a dispatch strategy during the simulations. A typical daily electricity load of 9.4 kWh (calculated from collected electricity bills/receipts over 12 months for one SACCO in Rwanda); Rwanda electricity tariff in use (both off-grid and grid-connected); diesel cost in Rwanda and climate weather parameters (those which have an impact on solar energy generation) were all used to accomplish the purpose of this study. Additionally, the authors also studied many study materials to make the research work contained in this paper more concise. Fig. 1 represents the workflow overview of HOMER software which is a designing tool for Power systems in order to make it easier to compare power generation technology across a variety of applications. HOMER software [37,38] carries out three main tasks: simulation, optimization, and sensitivity analysis. In the simulation process, HOMER models a power system configuration’s performance during each hour of the year in order to assess its technical viability and life-cycle cost. In order to find the system configuration that satisfies the technical requirements at the lowest life-cycle cost, HOMER simulates a variety of possible system configurations all this through the optimization process. In the sensitivity analysis process, HOMER runs several optimizations under a variety of input assumptions to measure the consequences of uncertainty or changes in the model inputs. Several Equations can be derived and used form operational concept listing for example Eqs. (1)–(7) [37,39,40].

Figure 1: HOMER Workflow overview
where the multiplication product of capital recovery factor and total initial capital cost equals to the total annualized; Rcomp component lifetime [year]; Eprim,AC AC primary load served [kWh/year]; Eprim,DC DC primary load served [kWh/year]; Egrid,sales total grid sales [kWh/year]; Crep component replacement cost [$]; CoE levelised cost of energy [$/kWh] , CRF capital recovery factor; and CNPC,tot total net present cost [$]. The operating cost is defined as annualized value of all expenses and income, excluding initial capital costs.
This manuscript uses HOMER software and its concept is only limited to economic modelling and optimization of clean and affordable electricity solution for SACCOs in Rwanda; deep technical concept and parameters (such as synchronization, harmonics, overvoltage and undervoltage, stability and technical reliability) were not considered. Future studies maybe be suggested combining HOMER and other softwares such as MATLAB to analyse the conceptional effect of using the recommended optimal and clean energy technology covered in this research. Additionally, further studies may consider the exploration of other and multiple clean energy technologies for different applicability other than SACCOs.
Fig. 2 indicates the schematic diagrams of the energy technology mixes used in the study. Fig. 2a is an off-grid diesel generator technology. Fig. 2b is grid-connected diesel generator technology. Fig. 3c is an off-grid solar PV system with storage. Fig. 2d is a grid-connected PV system with storage. Fig. 3 indicates the average daily radiation and clearness indices for the study location. Furthermore, the average daily irradiations were 5.0 kWh/m2/day (January), 5.3 kWh/m2/day (February), 5.1 kWh/m2/day (March), 4.9 kWh/m2/day (April), 4.7 kWh/m2/day (May), and 5.0 kWh/m2/day (June), respectively. Others were 5.4 kWh/m2/day (July), 5.5 kWh/m2/day (August), 5.3 kWh/m2/day (September), 4.9 kWh/m2/day (October), 4.6 kWh/m2/day (November) and 4.7 kWh/m2/day (December), respectively. Overall, the average daily irradiation varied between 4.6 kWh/m2/day (November) and 5.5 kWh/m2/day (August), respectively. Also, the clearness indices (CIs) were 0.48 (January), 0.52 (February), 0.48 (March), 0.48 (April), 0.50 (May), and 0.55 (June), respectively. Others were 0.59 (July), 0.56 (August), 0.50 (September), 0.47 (October), 0.45 (November), and 0.47 (December), respectively. Overall, the clearness index varied between 0.45 (November) and 0.59 (July), respectively. Fig. 4 indicates the average daily temperatures for a year of the location case study. The average daily temperatures were 20.7°C (January), 21.2°C (February), 20.8°C (March), 20.1°C (April), 19.6°C (May), and 19.3°C (June), respectively. Others were 19.4°C (July), 20.8°C (August), 21.4°C (September), 20.8°C (October), 20.1°C (November), and 20.2°C (December), respectively. Overall, the average daily temperatures ranged between 19.3°C (June) and 21.4°C (September), respectively.
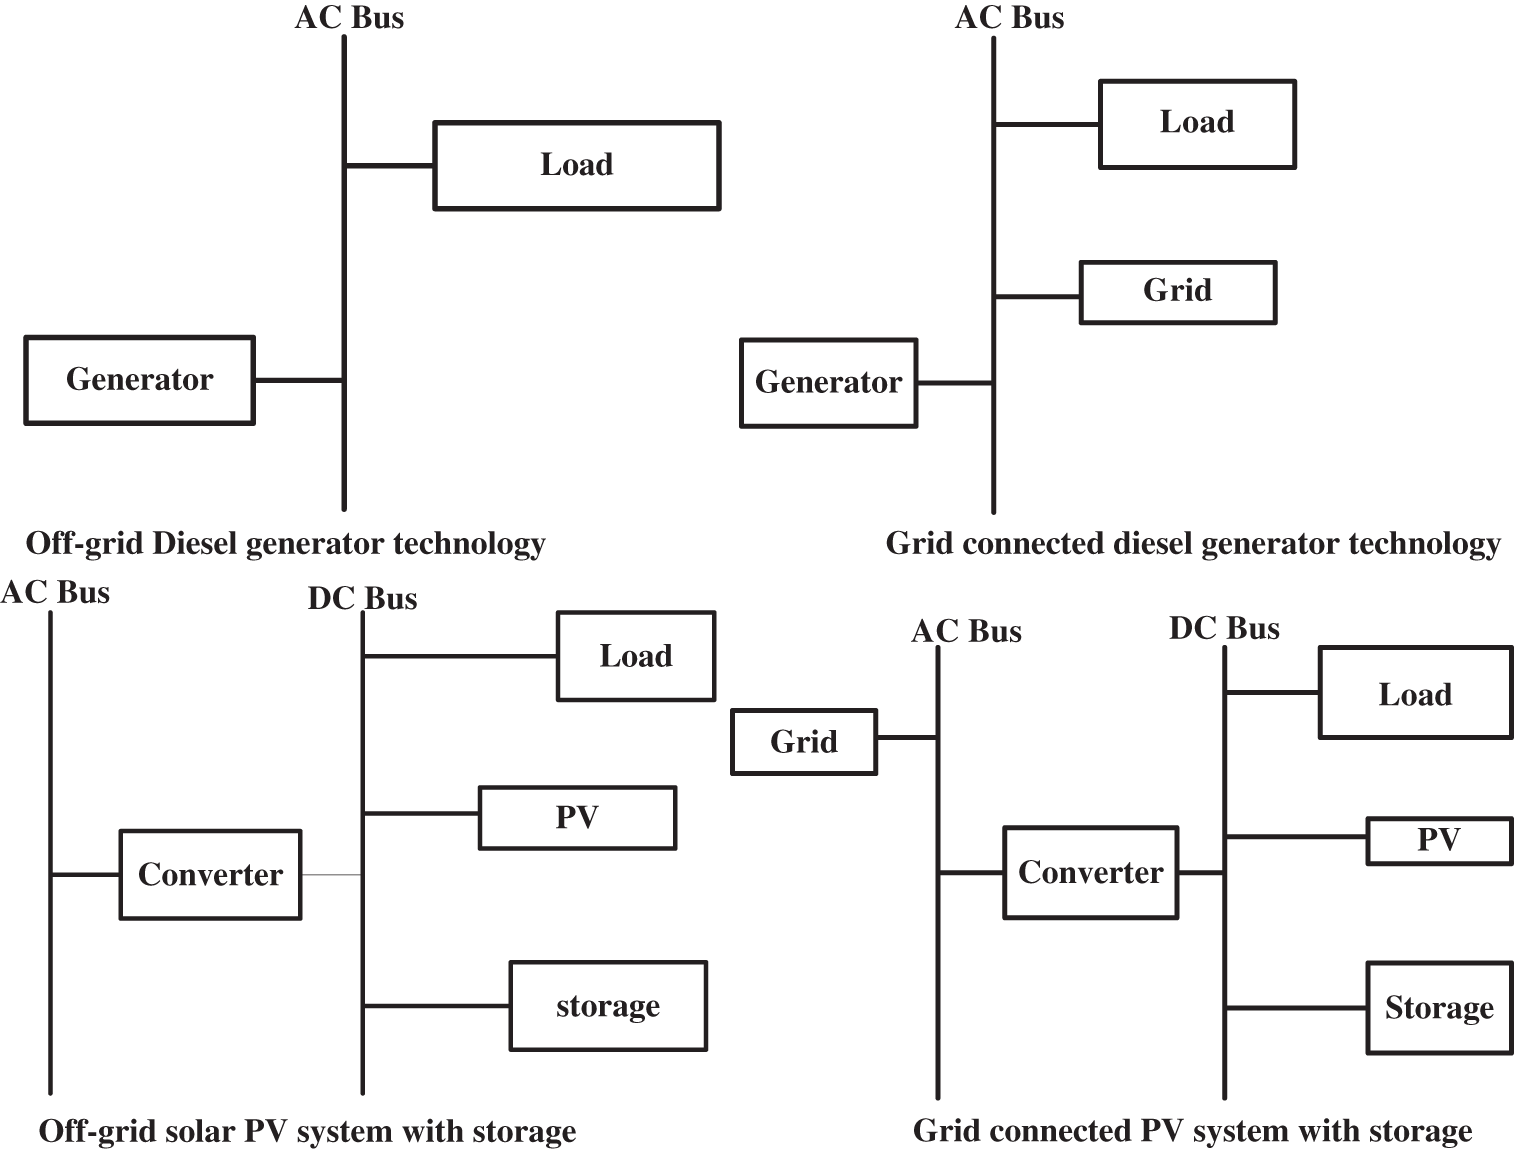
Figure 2: Schematic diagram of energy technologies mixed involved in this study
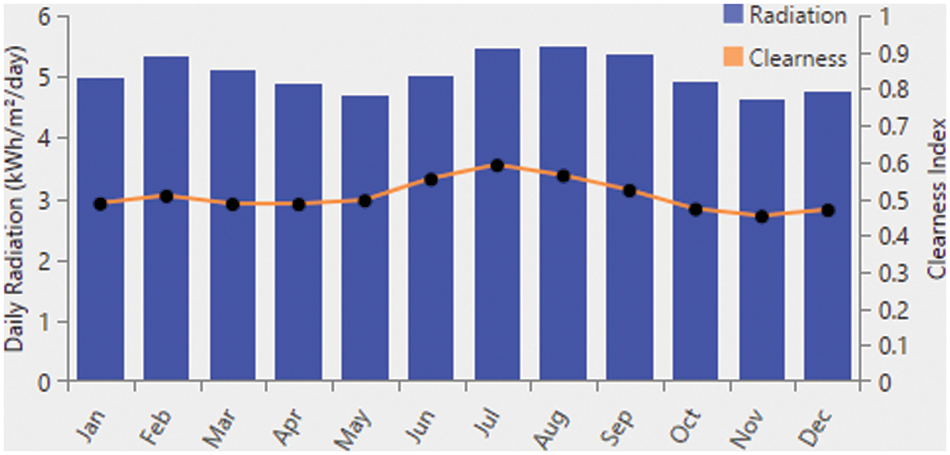
Figure 3: Daily radiation and clearness index for the location case study

Figure 4: Daily temperature for the location case study
4.1 Scenario of Off-Grid Diesel Technology
Fig. 5 indicates the cash flow overview of the diesel generator technology comprising the capital invested, fuel costs, operating costs, replacement costs, and salvage value. At inception, the capital outlay was US$3,000.00. The yearly fuel costs were US$3,750.00, US$5,250.00 annual operating costs, and US$7,875.00 yearly replacement costs. The salvage value was around US$1,125.00 only. Fig. 6 shows that the diesel generator was usually operated between 7.30 am and8.00 pm daily. The diesel generator power output ranges between 0.40 and 1.80 kW, respectively. The 1.8 kW peak load was usually demanded between 10.45 am and 8.00 pm when the SACCOs finally close business for the day. This trend was the same throughout the year and for all the 360 accounting days in a year. Fig. 7 indicates the diesel fuel consumption of the off-grid diesel technology for the location case study. The results show that between 0.20 and 0.55 litre/hour diesel are consumed is between 7.30 am and 8.00 pm at the close of SACCO’s business day.
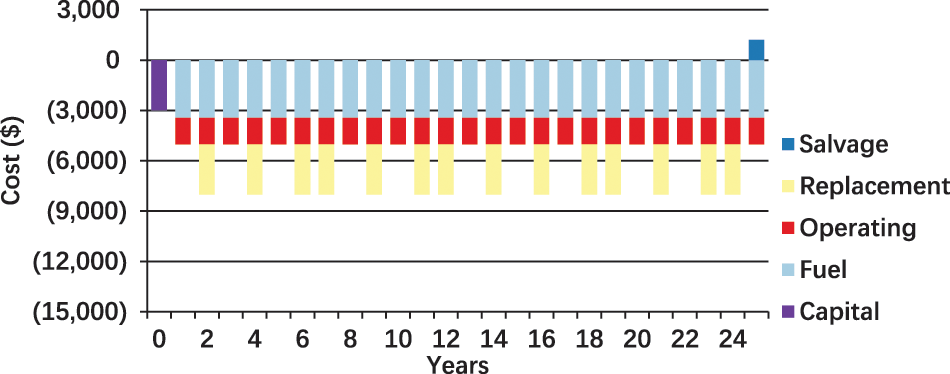
Figure 5: Cash flow overview of the diesel technology
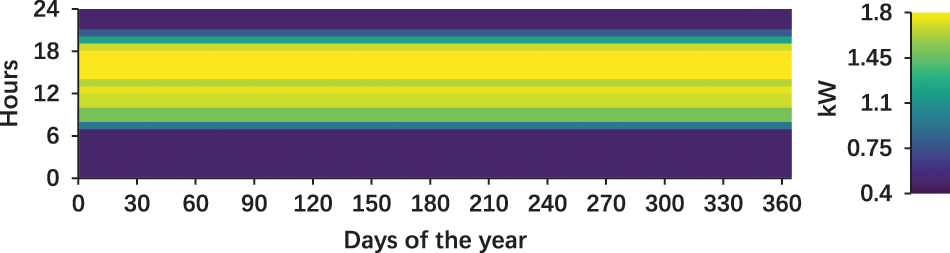
Figure 6: Electricity power output (kW) of the off-grid diesel technology

Figure 7: Diesel fuel consumption (litre per hour) of the off-grid diesel technology
Table 1 is the costs summary for off-grid diesel generator technology while Table 2 represents the Diesel Technology summary. The total net present cost (NPC) was US$89,353.00. It comprises US$3,000.00 capital outlay, US$20,384.00 operating costs, US$21,764.00 replacement cost, US$44,492.00 resource cost, and US$287.47 salvage value (gain). Furthermore, the annualized cost was US$6,912.00. It comprises US$232.06 annual capital cost, US$1,577.00 annual operating cost, US$1,684.00 annual replacement cost, −US$22.24 annual salvage value (gain), and US$3,442.00 annual resource cost, respectively. Overall, the diesel generator technology had US$89,353.00 capital expense (CAPEX), US$6,680.00 operating expense (OPEX), US$0.730/kWh levelized cost (LCOE), and 8,572.0. kg/year CO2 emission, respectively. For the diesel technology, the details were found as follows: CAPEX: $89,353.00; OPEX: $6,680.00; LCOE($/kWh): $0.730; CO2 Emitted (kg/yr): 8,572.0.

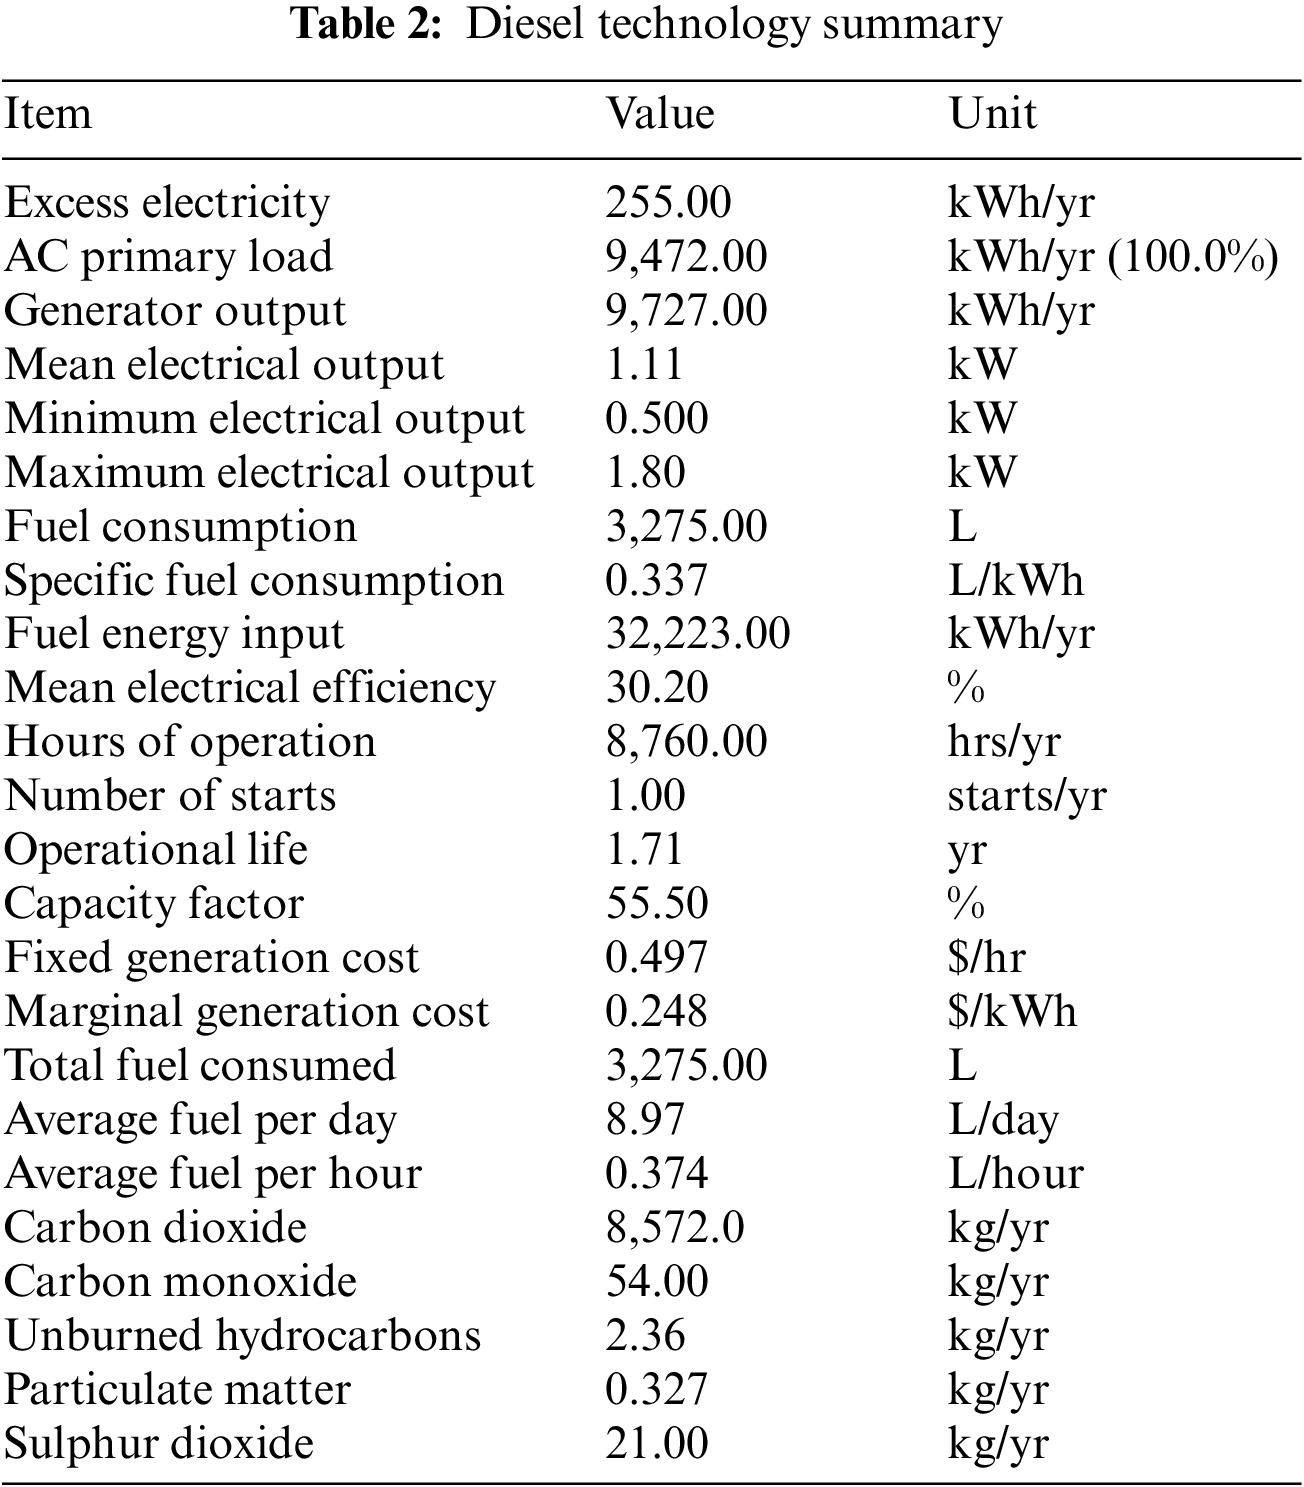
The simulation details from diesel generator technology summary indicated that primary AC load was 9,472.00 kWh/year, 9,727.00 kWh/year generator output, and 255.0 kWh/year excess electricity. The minimum and maximum electrical output ranged between 0.5 and 1.8 kW, respectively while the mean electrical power output was 1.11 kW. The fuel energy input was 32,223.0 kWh/year, 3,275.0 litres fuel consumption, 0.337 l/kWh specific fuel consumption, and 30.2% mean electrical efficiency. Although it operated 8,760 hours/year, its operational life was 1.71 years. Also, the fixed generation cost was US$0.497/hour, US$0.248/kWh marginal generation cost, and a 55.5% capacity factor. Furthermore, the average daily fuel usage was 8.97 litres/day, 0.374 litres/hour average hourly fuel usage, and 3,275.0 litres total fuel consumption. In addition, 8,572.0 kg/year Carbon dioxide emission (CO2), 54.0 kg/year Carbon monoxide (CO) emission, 2.36 kg/year unburned hydrocarbons, 0.327 kg/year particulate matter, and 21.0 kg/year Sulphur dioxide (SO2) emission, respectively.
4.2 Scenario of Grid-Connected Diesel Technology
The grid-connected diesel technology was found to be unaffordable because the LCOE was equal to the cost of electricity tariff currently in use for the Rwanda power grid. This grid-connected diesel technology can be recommended only if: (a) the national power grid has frequent blackouts and (b) when there is no other more affordable energy technology that can be considered. As it can be seen from Table 2, the HOMER analysis, and optimization considered the diesel generator as the optimal solution. This is so because the cost of operations for generating the required electricity would be higher than the electricity tariff from the national power grid.
The simulation details of the electricity flow structure for grid-diesel generator connected technology indicates that the energy purchased was each 804.0 kWh for the months of January, March, May, July, August, October, and December, respectively. Also, the energy purchased was each 778.0 kWh for the months of April, June, September, and November, respectively. Furthermore, 727.0 kWh was the energy purchased in February and the total energy purchased was 9,472.0 kWh. The energy charge was US$205.94 for the months of January, March, May, July, August, October, and December, respectively. Also, US$199.30 each was the energy charge for the months of April, June, September, and November, while US$186.01 was the energy charge for February. Although there was no energy sold, the peak demand was 1.8 kW, and the total energy charge was US$2,425.00 only.
4.3 Scenario of Off-Grid PV with Storage Technology
Table 3 indicates an off-grid PV system with storage. The capital expense was US$54,467.00 (CAPEX), US$2,530.00 operating expense (OPEX), US$0.713/kWh levelized energy cost (LCOE), and no CO2 emission nor fuel consumption.

The PV system has a nominal capacity of 21.8 kW. The annual production is 32,146.0 kWh/yr. Table 4 indicates a summary of off-grid PV systems with storage. Its nominal capacity was 21.8 kW and 32,146.0 kWh/year annual power production, respectively. The capital cost was US$39,264.00, US$218.00/year maintenance cost, 1,474.0 kWh/kW specific yield, US$0.101/kWh levelized cost, and 339.0% penetration rate.

Fig. 8 indicates the output power of the off-grid PV system with storage. The PV output ranges between 0.0 kW (when there was no sunlight) and 25.0 kW (maximum when the sunlight was overhead). The 6.2 kW output power occurs about 8.20 am while the 25.0 kW peak output occurs about 12.00 mid-day when the sun was overhead. The 6.25 and 25.0 kW power output range was to be expected throughout the year except during cloudy and wet days that commonly occur. Fig. 9 depicts the converter system output for an off-grid PV system with storage. The PV-converter system output ranged between 0.5 and 2.0 kW during 8.20 am and 20.00 pm at the close of SACCO’s workday. Two days, about 312 and 341 days could not give the converter output because of the two vertical blue lines in the figure without possible power output. Fig. 10 indicates the battery system state of charge for the PV system with storage. The battery state of charge was around 100.0% about 6.00 pm daily throughout the year except for about 38 days when there was either heavy rainfall or heavy cloud cover such that 100.0% battery charge was impossible. Overall, the battery state of charge throughout the year hovered between 85.0% and 100.0%, respectively.
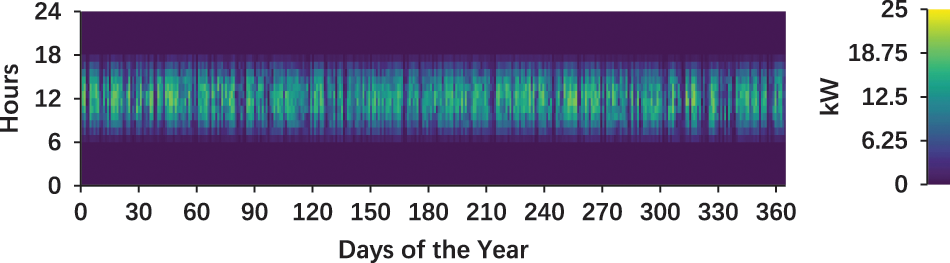
Figure 8: Output power of the off-grid PV system with storage

Figure 9: The converter system output for the off-grid PV system with storage

Figure 10: Battery storage system state of charge for the off-grid PV system with storage
The solar PV array electrical summary from simulation showed that the output power ranged between 0.0 kW (minimum) and 20.6 kW (maximum). The PV penetration rate was 339.0%, 4,380.0 operation hours per year, and US$0.101/kWh levelized energy cost.
The solar PV array statistics from simulation shows that the rated output power was 21.8 kW, 3.67 kW mean output power, and 88.1 kWh/day maximum power output. The total annual power production was 32,146.0 kWh/year.
From the storage battery properties, the battery bank comprises 48 batteries of 12.0 Volts batteries stringed in parallel for maximum and optimal storage. From the storage battery datasheet, the average energy lost was US$0.0/kWh, 4,239.0 kWh/year energy input, 3,398.0 kWh/year energy output, 8.25 kWh/year storage depletion, 849.0 kWh/year losses, and 3,800.0 kWh/year annual throughput, respectively. The storage battery statistics revealed that the autonomy was 26.7 h, US$0.419/kWh storage wear cost, 48.0 kWh nominal capacity, 28.8 kWh nominal usable capacity, 37,996.0 kWh lifetime throughput, and 10.0 years expected life, respectively. The electrical system’s converter summary indicated that the optimal operating hours were 8,758.0 hours/year, 9,463.0 kWh/year energy output, 9,961.0 kWh/year energy input, and 498.0 kWh/year losses, respectively.
Through the simulation, the power system converter statistics showed that the capacity was 2.68 kW, 1.08 kW mean output power, 0.0 kW minimum power output, 1.80 kW maximum output power, and 40.3% capacity factor, respectively. The battery parameters summary revealed that the rated power capacity was 48.0 kWh, 3,800.0 kWh/year annual throughput, and US$1,440.0/year maintenance cost, respectively. Also, the expected life was 10.0 years, US$14,400.00 capital expense, and 849.0 kWh/year losses. The battery storage system’s nominal capacity is 48.0 kWh. The annual throughput is 3,800.0 kWh/yr. Table 5 indicates the cash flow of the off-grid PV system with storage. The battery storage cost was US$1,440 per year for each of the 25 years lifespan. Also, the solar PV array cost was US$218.13 annually for each of the 25 years lifespan. Table 6 indicates the renewable energy summary categorised into (a) Capacity-based metrics, (b) Energy-based metrics, and (c) Peak values. The ratio of the nominal renewable capacity to the total nominal capacity was 100.0%. Also, the ratio of the usable renewable capacity to the total capacity was 100.0%. Furthermore, the ratio of total renewable power production to the load was 340.0%. The ratio of the total renewable production to the generation was 100.0% and the ratio of one minus the total non-renewable production to the load was equally, 100.0%. The ratio of peak renewable output power to the load using the HOMER standard was 1,425.0%. The ratio of the renewable output power to the total generation was 100.0% while the ratio of one minus the non-renewable power output to the total load was also 100.0%.


4.4 Scenario of Grid Connected PV with Storage Technology
Table 7 indicates the proposed grid-connected PV system with storage. The net present cost (NPC) was US$12,169.00, US$28,355.00 capital expense (CAPEX), −US$1,252.00 operating expense (OPEX), US$0.0414/kWh levelized energy cost (LCOE), 2,207.0 kg/year CO2 emission, and no fuel consumption. Furthermore, the CO2 emissions (2,207.0 kg/year) are due to the standards chosen and the assumptions made in the modelling by HOMER software of grid-connection to the PV system. That means a certain amount of greenhouse gases are emitted once the non-renewable power grid is in operation. Table 8 indicates a PV system with 14.3 kW rated nominal capacity and 21,004.0 kWh/year annual power production. The capital expense was US$25,655.00, US$143.00/year maintenance cost, 1,474.0 kWh/kW specific yield, US$0.101/kWh levelized energy cost (LCOE), and 222.0% PV penetration rate.


Fig. 11 indicates the PV output power for the grid-connected PV system with storage. The output ranged between 0.0 kW and 14.0 kW (peak). The 14.0 kW output peak occurred about mid-day throughout the day although much of the year produced between 7.0 and 10.5 kW, respectively. Fig. 12 indicates energy purchased from the grid. The energy purchased from the grid for the grid-connected PV system with storage ranged between 0.0 and 2.0 kW. The results show that almost every day, the SACCO purchased energy around 2.0 kW every day throughout the year. The power purchase from the grid hovered between 12.30 pm and 19.50 pm. That means on the days where there was not enough power generated from the grid-connected PV system with storage and at night falls.

Figure 11: PV output power for the grid-connected PV system with storage

Figure 12: Energy purchased from the grid (grid connected PV system with storage)
Fig. 13 indicates the energy sold to the grid from a grid-connected PV system with storage. The energy sold to the grid ranged from 0.0 to 8.0 kW. There were very many days that no energy was sold to the grid in the year. These zero sales figures may be due to rainfall, cloud cover, or there was no excess PV output such that what was generated from the PV was consumed by the SACCO’s operations or there was a grid power failure that precluded the SACCO from having excess electricity for sale.
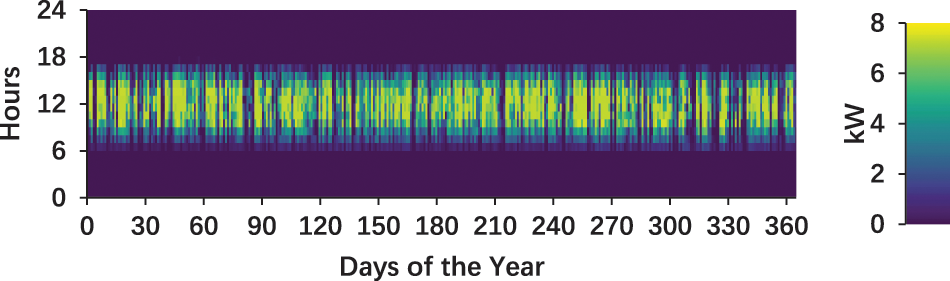
Figure 13: Energy sold to the grid (grid connected PV system with storage
Table 9 indicates cash flow for the grid-connected PV with storage. The grid-generated supply costs US$1,467.00 annually for each of the 25 years lifespan. Also, the solar PV array costs US$142.53 annually for each of the 25 years lifespan. Table 10 indicates the monthly energy flow for the grid-connected PV technology. The energy purchased ranged between 251.0 kWh (February) and 313.0 kWh (December), and 3,493.0 kWh annual energy purchase. Also, the energy sold ranged between 950.0 kWh (November) and 1,275.0 kWh (July), while the total energy sold was 13,269.0 kWh, respectively. Furthermore, the net energy purchase ranged from deficit −1,001 kWh (July) and deficit −758 kWh (January), while the deficit net energy purchase was −9,777.0 kWh in total. The peak demand was 1.8 kW while the total energy charge was −US$1,467.00. The energy charge varied between –US$150.18 (July) and –US$95.71 (November). Overall, the total energy purchase was 3,493.00 kWh; 13,269.0 kWh total energy sold; 9,776.0 kWh net energy sold; peak annual demand hovered around 1.79 kW, while the total energy charge was –US$1,467.00, respectively.


Solar energy is accounted as renewable resource that plays a significant part in lowering greenhouse gas emissions and preventing climate change, which is essential for safeguarding people, animals, and ecosystems. The contribution of this manuscript highlights and reveals the solar PV system with storage as an optimal solution (with levelized cost of electricity (LCOE) of 0.713 $/kWh which is cheaper than 0.73$/kWh for diesel technology) for SACCOs located in both off-grid areas and grid-connected areas (with 0.041$/kWh LCOE which is lower than the current electricity tariff in Rwanda); thus, its exploitation on financial buildings in Rwanda will significantly contribute to the mitigation efforts and strategies. The average daily irradiation of the location case study varied between 4.6 kWh/m2/day (November) and 5.5 kWh/m2/day (August), respectively. In addition, the clearness index varied between 0.45 (November) and 0.59 (July), respectively. In addition, the average daily temperatures of the location case study ranged between 19.3°C (June) and 21.4°C (September), respectively. At inception, the diesel generator technology capital outlay was US$3,000.00. The yearly fuel costs were US$3,750.00, US$5,250.00 annual operating costs, and US$7,875.00 yearly replacement costs. The salvage value was around US$1,125.00 only. The 1.8 kW peak load was usually demanded between 10.45 am and 8.00 pm when the SACCOs finally close business for the day. The PV system output ranges between 0.0 kW (when there was no sunlight) and 25.0 kW (maximum when the sunlight was overhead). The 6.2 kW output power occurs about 8.20 am while the 25.0 kW peak output occurs about 12.00 mid-day when the sun was overhead. The battery state of charge for the PV system with storage was around 100.0% about 6.00 pm daily throughout the year except for about 38 days when there could be either heavy rainfall or heavy cloud cover such that 100.0% battery charge was impossible. Overall, the battery state of charge throughout the year hovered between 85.0% and 100.0%, respectively.
Also, the proposed grid-connected PV system with storage had net present cost (NPC) US$12,169.00, US$28,355.00 capital expense (CAPEX), −US$1,252.00 operating expense (OPEX), US$0.0414/kWh levelized energy cost (LCOE), 2,207.0 kg/year CO2 emission, and no fuel consumption. Furthermore, the CO2 emissions (2,207.0 kg/year) are due to the standards chosen and the assumptions made in the modelling by HOMER software of the grid-connection to the PV system. That means a certain amount of greenhouse gases are emitted once the non-renewable power grid is in operation. Although the peak demand was 1.8 kW, the total energy charge was –US$1,467.00. The energy charge varied between –US$150.18 (July) and –US$95.71 (November). Overall, the total energy purchase was 3,493.00 kWh; 13,269.0 kWh total energy sold; 9,776.0 kWh net energy sold; peak annual demand hovered around 1.79 kW, while the total energy charge was –US$1,467.00, respectively.
Funding Statement: Authors are grateful to Fujian Provincial Department of Science and Technology (Grant Number: 2021I0014) Fujian Provincial Department of Housing and Construction (Grant Number: 2022-K-67; Fujian Provincial Department of Education (Grant Number: JAT201518). Additionally, Authors are grateful to Quanzhou Tongjiang Scholar Special Fund for financial support through Grant Number: (600005-Z17X0234); Quanzhou Science and Technology Bureau for financial support through Grant Number: (2018Z010), and Huaqiao University through Grant Number: (17BS201); and the Fujian Provincial Department of Science and Technology for financial support through Grant (2018J05121). Authors are also grateful for financial support from the Fujian Provincial Department of Science and Technology through Grants Numbers: 2021I0014 and 2018J05121.
Availability of Data and Materials: The data used in this research are available upon the request from the corresponding author.
Conflicts of Interest: The authors declare that they have no conflicts of interest to report regarding the present study.
References
1. Gupta, B. (2021). Role of financial institutions. https://www.wallstreetmojo.com/role-of-financial-institutions. [Google Scholar]
2. Asemota, G. N. (2009). Approximate maximum likelihood commercial bank loan management model. Journal of Social Sciences, 5(4), 271–278. [Google Scholar]
3. Tobin, J. (2000). Financial globalization. World Development, 28(6), 1101–1104. [Google Scholar]
4. Llanto, G. M. (1994). The financial structure and performance of philippine credit cooperatives (No. 1994-04). Journal of Social Science, 5(4), 271–278. [Google Scholar]
5. Bangoura, L. (2012). Microfinance as an approach to development in low income countries. The Bangladesh Development Studie, 35(4), 87–111. [Google Scholar]
6. Landall, D. (2014). Financial inclusion up close in Rwanda. https://blogs.worldbank.org/psd/financial-inclusion-close-rwanda. [Google Scholar]
7. Sparkassenstiftung, G. (2021). SACCO professionalization and development of a cooperative bank. https://sparkassenstiftung-easternafrica.org/projects/activities/sacco-professionalization. [Google Scholar]
8. Financial and Banking Information Infrastructure Committee (2003). Impact of the recent power blackout and hurricane isabel on the financial sector. [Google Scholar]
9. Woodstockpower (2021). Used generators for banks. https://woodstockpower.com/industries/used-generators-for-banks. [Google Scholar]
10. BRD (2021). Cana uhendukirwe. https://www.brd.rw/ref/. [Google Scholar]
11. Bishumba, N. (2021). Rwanda: New ubudehe categories to be activated by december. https://allafrica.com/stories/202108230252.html. [Google Scholar]
12. REG (2021). Rwanda National Electrification Plan. https://www.reg.rw/public-information/reports/. [Google Scholar]
13. Nkuriyingoma, O., Özdemir, E., Sezen, S. (2022). Techno-economic analysis of a PV system with a battery energy storage system for small households: A case study in Rwanda. Frontiers in Energy Research, 10, 1–13. [Google Scholar]
14. Bimenyimana, S., Asemota, G. N. O., Niyonteze, J. D. D., Nsengimana, C., Ihirwe, P. J. et al. (2019). Photovoltaic solar technologies: Solution to affordable, sustainable, and reliable energy access for all in Rwanda. International Journal of Photoenergy, 2019(5), 1–29. DOI 10.1155/2019/5984206. [Google Scholar] [CrossRef]
15. Chang, K. C., Hagumimana, N., Zheng, J., Asemota, G. N. O., Niyonteze, J. D. D. et al. (2021). Standalone and minigrid-connected solar energy systems for rural application in Rwanda: An in situ study. International Journal of Photoenergy, 2021(11), 22. DOI 10.1155/2021/1211953. [Google Scholar] [CrossRef]
16. Kazeem, Y. (2018). The biggest obstacle to deploying solar energy in Africa is skepticism in high places. https://qz.com/africa/1238545/the-biggest-obstacle-to-deploying-solar-energy-in-africa-is-skepticism-in-high-places. [Google Scholar]
17. Ayodele, E., Misra, S., Damasevicius, R., Maskeliunas, R. (2019). Hybrid microgrid for microfinance institutions in rural areas–A field demonstration in West Africa. Sustainable Energy Technologies and Assessments, 35(11), 89–97. DOI 10.1016/j.seta.2019.06.009. [Google Scholar] [CrossRef]
18. Sapp, K. (2019). Bank of America installs solar panels on more than 60 locations, including financial centers, ATMs and offices through its onsite solar initiative. https://newsroom.bankofamerica.com/press-releases/consumer-banking/bank-america-installs-solar-panels-more-60-locations-including. [Google Scholar]
19. BBVA (2020). Garanti BBVA to power its corporate buildings and branches with renewable energy. [Google Scholar]
20. Learner, H. (2020). Iowa community bankers know a good deal: Solar energy. https://www.decorahbank.com/environmental-law-policy-center-recognizes-decorah-bank-for-solar-initiatives. [Google Scholar]
21. Zhou, A. (2012). Lighting the way Asian Development Bank’s. Philipines: Asian Development Bank. [Google Scholar]
22. Ayodele, E., Misra, S., Damasevicius, R., Maskeliunas, R. (2019). Hybrid microgrid for microfinance institutions in rural areas–A field demonstration in West Africa. Sustainable Energy Technologies and Assessments, 35(11), 89–97. DOI 10.1016/j.seta.2019.06.009. [Google Scholar] [CrossRef]
23. Datta, U., Kalam, A., Shi, J. (2020). The economic prospect of rooftop photovoltaic (PV) system in the commercial buildings in Bangladesh: A case study. Clean Technologies and Environmental Policy, 22(10), 2129–2143. DOI 10.1007/s10098-020-01963-3. [Google Scholar] [CrossRef]
24. Schley, A. (2020). Top tips for integrating solar panel systems on your commercial building. https://www.buildings.com/articles/42626/solar-panel-systems-commercial-building. [Google Scholar]
25. Solar, A. (2021). Solar energy for commercial buildings. https://amplussolar.com/solar-energy-for-commercial-buildings. [Google Scholar]
26. Industrytoday (2020). Do solar panels work on commercial buildings? https://industrytoday.com/do-solar-panels-work-on-commercial-buildings/. [Google Scholar]
27. Prajapati, S., Fernandez, E. (2019). Rooftop solar PV system for commercial office buildings for EV charging load. 2019 IEEE International Conference on Smart Instrumentation, Measurement and Application (ICSIMA), pp. 1–5. Kuala Lumpur, Malaysia, IEEE. [Google Scholar]
28. Adewale, A. A., Adekitan, A. I., Idoko, O. J., Agbetuyi, F. A., Samuel, I. A. (2018). Energy audit and optimal power supply for a commercial building in Nigeria. Cogent Engineering, 5(1), 1546658. DOI 10.1080/23311916.2018.1546658. [Google Scholar] [CrossRef]
29. Chisale, S. W., Mangani, P. (2021). Energy audit and feasibility of solar PV energy system: Case of a commercial building. Journal of Energy, 2021(5), 1–9. DOI 10.1155/2021/5544664. [Google Scholar] [CrossRef]
30. Ishraque, M. F., Shezan, S. A., Rashid, M. M., Bhadra, A. B., Hossain, M. A. et al. (2021). Techno-economic and power system optimization of a renewable rich islanded microgrid considering different dispatch strategies. IEEE Access, 9, 77325–77340. DOI 10.1109/ACCESS.2021.3082538. [Google Scholar] [CrossRef]
31. Shezan, S. A. (2021). Feasibility analysis of an islanded hybrid wind-diesel-battery microgrid with voltage and power response for offshore Islands. Journal of Cleaner Production, 288(12), 125568. DOI 10.1016/j.jclepro.2020.125568. [Google Scholar] [CrossRef]
32. Shezan, S. A., Hasan, K. N., Datta, M. (2019). Optimal sizing of an islanded hybrid microgrid considering alternative dispatch strategies. 29th Australasian Universities Power Engineering Conference (AUPEC), pp. 1–6. Nadi, Fiji, IEEE. [Google Scholar]
33. Shezan, S. A., Ishraque, M. F. (2019). Assessment of a micro-grid hybrid wind-diesel-battery alternative energy system applicable for offshore islands. 5th International Conference on Advances in Electrical Engineering (ICAEE), pp. 457–462. Dhaka, Bangladesh, IEEE. [Google Scholar]
34. Shezan, S. A., Ishraque, M. F., Muyeen, S. M., Arifuzzaman, S. M., Paul, L. C. et al. (2022). Effective dispatch strategies assortment according to the effect of the operation for an islanded hybrid microgrid. Energy Conversion and Management, 14(3), 100192. DOI 10.1016/j.ecmx.2022.100192. [Google Scholar] [CrossRef]
35. Goswami, A., Sadhu, P. K. (2021). Adoption of floating solar photovoltaics on waste water management system: A unique nexus of water-energy utilization, low-cost clean energy generation and water conservation. Clean Technologies and Environmental Policy, 1–26(4), 323. DOI 10.1007/s10098-021-02077-0. [Google Scholar] [CrossRef]
36. Han, X., Garrison, J., Hug, G. (2022). Techno-economic analysis of PV-battery systems in Switzerland. Renewable and Sustainable Energy Reviews, 158(7), 112028. DOI 10.1016/j.rser.2021.112028. [Google Scholar] [CrossRef]
37. HOMER (2021). HOMER energy. https://www.homerenergy.com/. [Google Scholar]
38. Belu, R. G., Chiou, R., Ghaisas, K., Tseng, T. L. B. (2014). Teaching renewable energy system design and analysis with HOMER. ASEE Annual Conference & Exposition, pp. 24–1169. Indianapolis, Indiana. [Google Scholar]
39. Riayatsyah, T. M. I., Geumpana, T. A., Fattah, I. R., Rizal, S., Mahlia, T. I. (2022). Techno-economic analysis and optimisation of campus grid-connected hybrid renewable energy system using HOMER grid. Sustainability, 14(13), 7735. DOI 10.3390/su14137735. [Google Scholar] [CrossRef]
40. Oulis Rousis, A., Tzelepis, D., Konstantelos, I., Booth, C., Strbac, G. (2018). Design of a hybrid AC/DC microgrid using Homer Pro: Case study on an islanded residential application. Inventions, 3(3), 55. DOI 10.3390/inventions3030055. [Google Scholar] [CrossRef]
Cite This Article
 Copyright © 2023 The Author(s). Published by Tech Science Press.
This work is licensed under a Creative Commons Attribution 4.0 International License , which permits unrestricted use, distribution, and reproduction in any medium, provided the original work is properly cited.
 Downloads
 Citation Tools