
 Submit a Paper
 Propose a Special lssue
 Open Access
ARTICLE

External UHF Sensor for GIS PD Insulation Defect from Resin Hole
1 Nanrui Group (State Grid Electric Power Research Institute) Co., Ltd., Nanjing, 211006, China
2 Wuhan Nari Limited Liability Company of State Grid Electric Power Research Institute, Wuhan, 430074, China
* Corresponding Author: Xu Yang. Email:
Energy Engineering 2023, 120(5), 1239-1252. https://doi.org/10.32604/ee.2023.025530
Received 18 July 2022; Accepted 09 October 2022; Issue published 20 February 2023
 View Full Text
 Download PDF
Abstract
In view of the effective perception demand of PD (Partial Discharge) insulation defect of in-service GIS (Gas Insulated Switchgear), the external UHF (Ultra High Frequency, 0.3−3 GHz) sensing technology for GIS PD insulation defect from resin hole is studied in this paper. Firstly, rectangular waveguide theory is used to analyze the electromagnetic wave propagation characteristics from rectangular resin hole in GIS disc insulator. It is found that the energy of leaked electromagnetic wave mainly concentrates in the frequency band above 1 GHz. Then based on this frequency band characteristics, a cavity-backed bowtie sensor for GIS PD external detection is designed optimized by HFSS finite element software, in band of 1–3 GHz, its maximum VSWR is 7, the minimum is 1.1, the average is 2.9, and in band of 0.3–1 GHz, the maximum and minimum VSWR is 42.8 and 7, the average is 20.6. Finally, a sensor prototype is made, its sensitivity experiment is carried out on 220 kV GIS, experimental results show that the designed sensor can stably detect the PD electromagnetic wave signal leaked from the resin hole, and the signal energy in frequency band range is consistent with the theoretical analysis results.Keywords
GIS (Gas Insulated Switchgear) encapsulates the power equipment of circuit breaker, isolation switch, bus and other power systems in SF6 insulated gas. It has the advantages of less floor area, high reliability, long maintenance period, etc. Once it fails, it will bring great maintenance cost and large area power failure. Therefore, it is necessary to conduct effectively on-line monitoring of the slowly developing PD (Partial Discharge) insulation defect, obtain the defect severity in advance, and repair it before the defect reaches a certain severity. At present, the methods used for on-line monitoring of GIS PD insulation defect mainly include UHF method, ultrasonic method and optical detection method, etc., [1–4]. Due to its high reliability and high sensitivity, etc., the UHF method has been widely studied and applied in the field of GIS PD insulation monitoring [5,6]. As a sensor to receive partial discharge (PD) ultra-high frequency (UHF, Ultra High Frequency, 0.3–3 GHz) electromagnetic signals, its sensitivity and anti-interference ability of UHF sensor directly affect the reliability of the entire UHF monitoring system, so the UHF sensor research is very important.
Depending on the installation location, UHF sensor can be divided into three types: external type, internal type and dielectric windows type [7–9]. The external type is installed on the outer surface of the disc insulator and receives electromagnetic waves leaked from resin hole. This type has characteristics of flexible installation, no seal problem, and does not affect the GIS uniform distribution of electric fields. For a lot of GISs which have been put into operation, or have no built-in UHF sensor, the external type is very suitable [10]. In order to avoid corrosion and electromagnetic wave leakage during the operation, the current GIS disc insulators are gradually based on the resin hole type, and the surface of the insulator is covered by a metal ring except for the resin hole [11,12]. The electromagnetic signal can be spread out through the resin hole, as shown in Fig. 1.
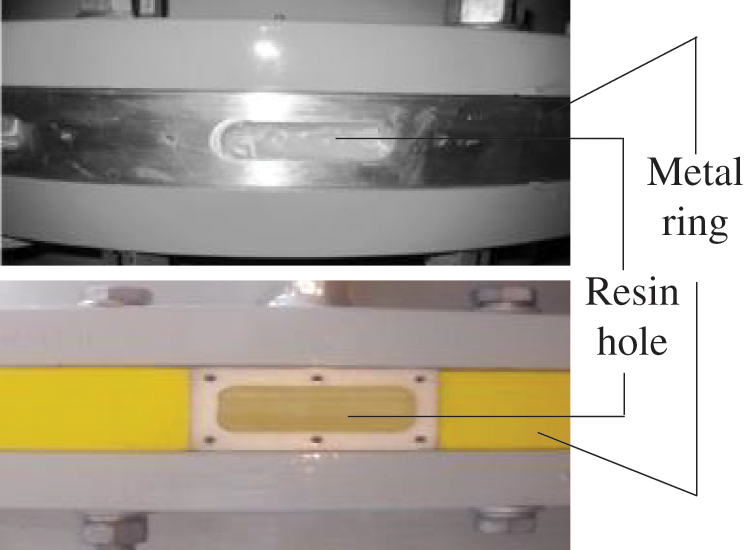
Figure 1: GIS disc-insulator resin hole
In view of above analysis, the electromagnetic wave propagation characteristic of rectangular resin hole in GIS disc insulator is analyzed. Then, based on this frequency band characteristics, a cavity-backed bowtie UHF sensor for GIS PD external detection is designed with bowtie sensor and linearly tapered Barron design principle by HFSS finite element software. Finally, PD testing experiment circuit on 220 kV GIS is carried out according to IEC 60270 and GB/T 7354-2018, the sensitivity of proposed UHF sensor is experimentally tested and analyzed [13,14].
2 Electromagnetic Wave Propagation Characteristics from Rectangular Resin Hole in GIS Disc Insulator
In the outward propagation of electromagnetic wave signal radiated by GIS internal PD insulation defect, or this can be called the leakage process of electromagnetic wave through resin hole, the propagation characteristics of the electromagnetic wave are inevitably influenced by the structure of the resin hole. Because the structure of the rectangular resin hole can be regarded as a metal cavity filled with epoxy resin, similar to the rectangular waveguide structure, we can use the theory of the rectangular waveguide to analyze the frequency band characteristics of leakage electromagnetic wave.
According to the electromagnetic wave propagation characteristics of the rectangular waveguide, there is no electromagnetic wave which has both electric field components and magnetic field components in the propagation direction in the waveguide. Therefore, the TEM wave cannot propagate in the rectangular waveguide, and only the TEmn wave and the TMmn wave propagate. For different modes of the wave, its cut-off frequency in the waveguide is also different; the cut-off frequency of different mode wave is calculated as follows:
where fc is the cut-off frequency of the electromagnetic wave propagated by the waveguide, and the unit is Hz. μ is the resin hole permeability, for epoxy material, μ = 4π × 10−7, the unit is H/m. ε is the permittivity of resin hole, ε = εrε0, εr is relative permittivity, ε0 is the permittivity of vacuum, and the unit is F/m. a is the waveguide width in m; b is the waveguide height in m; m and n are natural numbers. Different m and n combinations correspond to different waveforms: TEmn or TMmn, and m and n cannot be 0 at the same time.
According to the actual size of GIS pouring hole, we can know: a > 2b, the main mode in the waveguide is TE10 (m = 1, n = 0), and then m = 1 and n = 0 are brought into (1), the corresponding cut-off frequency is:
According to formula (2), if εr of the internal epoxy resin is 4.4, the cut-off frequency
The cutoff frequency of the resin hole EM wave in Section 2.1 is calculated according to the standard rectangular waveguide structure. However, the real GIS basin insulator casting hole is not a standard rectangular waveguide structure, it needs to be verified by simulation.
Fig. 2 is a graph of forward transmission coefficients S21 of a rounded rectangular waveguide structure, a standard rectangular waveguide structure, a rectangular waveguide structure with chamfers. The waveguide structure to be simulated was filled with an epoxy resin having a relative dielectric constant of 4.4, and the waveguide width is 55 mm and height is 20 mm, and the radius of the chamfer was 5 mm. It can be seen from the Fig. 2 that the cut-off frequencies of the resin holes of different structures are slightly different, but the difference is not large. The energy of the EM wave band leaking from the resin hole is mainly concentrated in the range of >1 GHz, which is basically consistent with the theoretical analysis result of the rectangular waveguide. Therefore, the effective frequency band of the designed resin hole UHF sensor should have higher detection sensitivity in frequency band of 1–3 GHz.
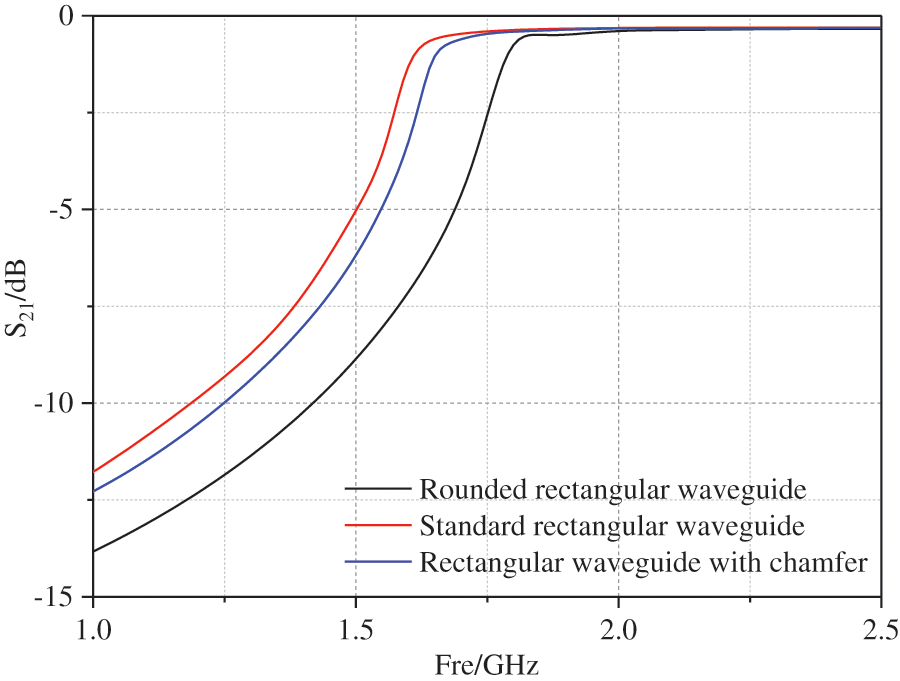
Figure 2: Forward transmission coefficient S21 curve of different style rectangular waveguides
3.1 Bowtie UHF Sensor Structure
Bowtie sensor evolved from the double cone sensor, the schematic structure is shown in Fig. 3, where l is the sensor arm length, w is sensor width, θ is sensor angle, increase of θ and expand the sensor bandwidth.
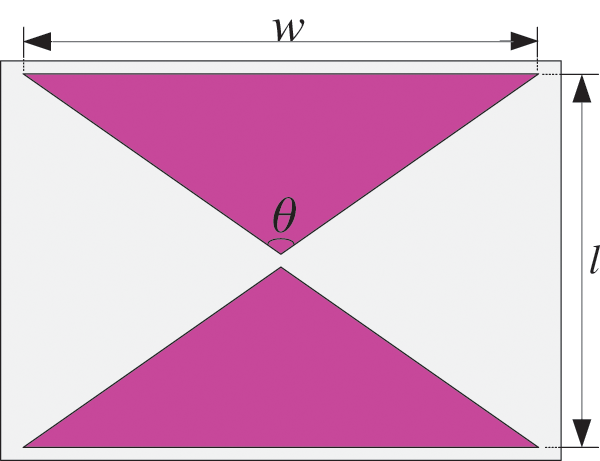
Figure 3: Schematic diagram Bowtie sensor
The characteristic impedance z and arm length l can be calculated from the Eqs. (3) and (4), respectively [15,16], where λ0 is the cutoff frequency in the air environment wavelength, εr is the relative permittivity of the sensor substrate, d is the substrate thickness, and w is the sensor width.
The cavity structure can restrain the backward radiation of the butterfly sensor and improve the anti-interference ability of the sensor. According to the principle of back cavity mirror effect, the height of back cavity should aim at the strongest frequency point of signal. The cavity depth can be designed as one quarter of the wavelength of the strongest frequency signal in engineering design [17].
3.2 Linearly Folding Tapered Balun
The feed balun is an important part of improving the energy transmission efficiency of sensor. It plays the role of impedance matching between the sensor radiating element and the transmission line. In the case where the size of the bowtie sensor itself is determined, in order to achieve wide-band impedance matching, miniaturization of the designed sensor and consideration of not increasing the volume of the sensor itself, linearly folding tapered balun is used.
Linearly tapered balun structure has miniaturized and wide band function. At the input, the signal line width W1 is calculated as the micro strip line impedance (usually 50 Ω) and the ground line width W2 is about 5 times the signal line width W1 [18,19]. At the output, according to the uniqueness theorem and mirror theorem, with the same impedance value, double-wire feed linewidth W3 is 0.5 times the micro strip line width [20]. The length L of the balun is 0.5 times the cutoff wavelength, L = 0.5λmax [21]. If L is too large for sensor size, the balun structure can be folded. According to the design experience of the sensor, the bevel edge D2 of the folding place is about 1.6 times that of the folding aperture D1 for the balun signal line. For balun ground line, the bevel edge D3 of the folding place requires software simulation to determine the best size. The structure of linearly folding tapered balun is shown in Fig. 4.
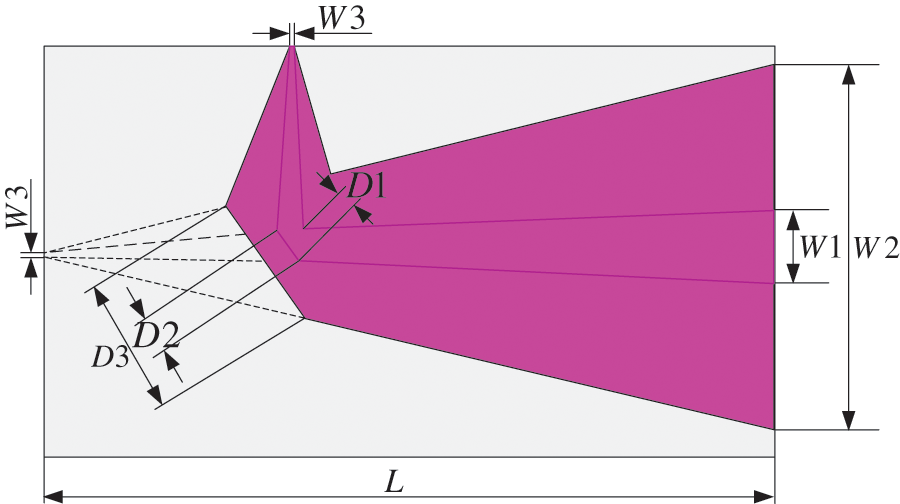
Figure 4: Linearly tapered microstrip balun
The structure and size of the cavity-backed bowtie sensor proposed in this paper are shown in Fig. 5. Sensor consists of a bowtie plane dipole, a tapered balun, a rectangular cavity and an N-type connector. The bowtie dipole is printed on the same plane of the dielectric substrate. The dielectric substrate material is FR4_epoxy, dielectric constant εr = 4.4, and the thickness is 2 mm. On the other dielectric substrate perpendicular to the printed bowtie dipole, the tapered impedance balun is printed on its both sides, respectively. The signal line and ground line width at the balun input were 15.6 and 3 mm, respectively. The balun output is connected with a 135 Ω parallel stripline for differential input. The dielectric constant of the dielectric substrate for printing balun is also 4.4, but the thickness is 1.5 mm.
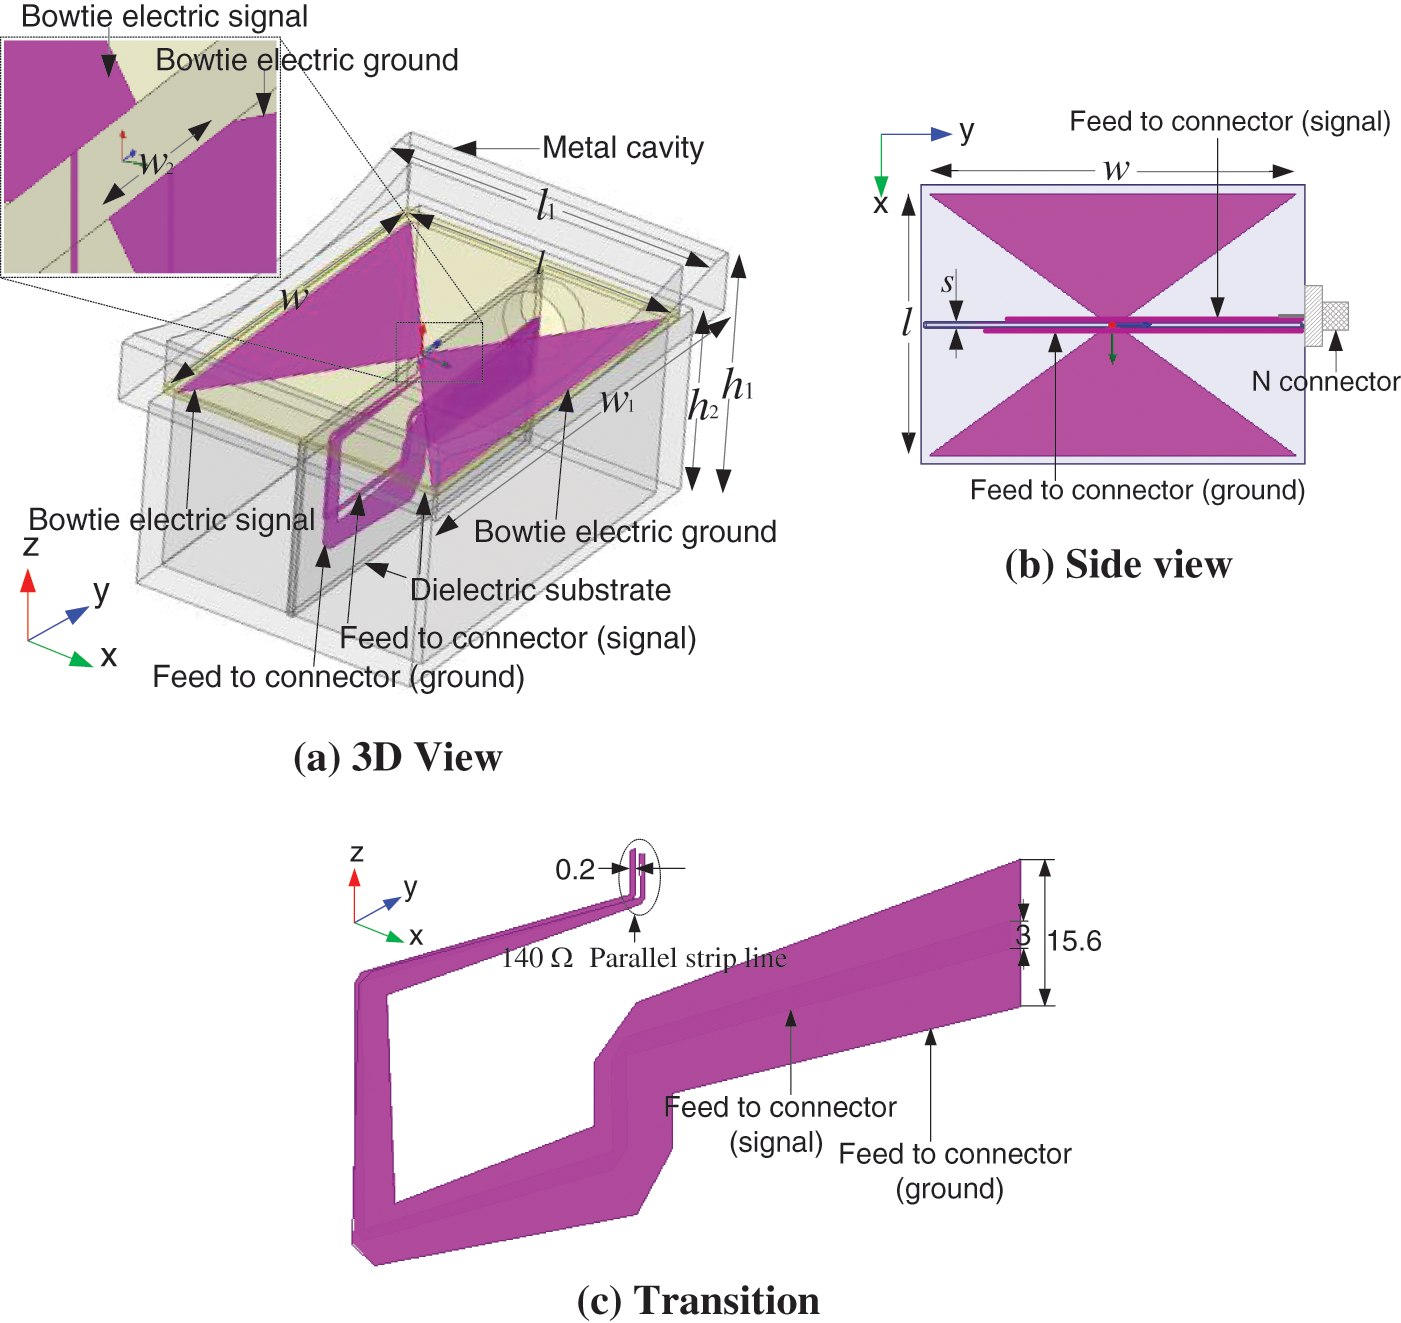
Figure 5: Geometry of proposed sensor (Unit: mm)
The length l of the bowtie plane is calculated by the formula (4) based on the wavelength of 1 GHz. The length and width of the metal back cavity are determined by following principles: ① ensuring that the final product is as compact as possible; ② ensuring that the metal back cavity can completely cover the GIS casting hole; ③ ensuring the back cavity width is less than or equal to the width of the basin insulator.
In order to study the effect of the metal shielding cavity on the sensor performance, the sensor VSWR (Voltage Standing Wave Ratio) performance parameter was simulated in situation of with and without metal cavity. The simulation results are shown in Fig. 6.
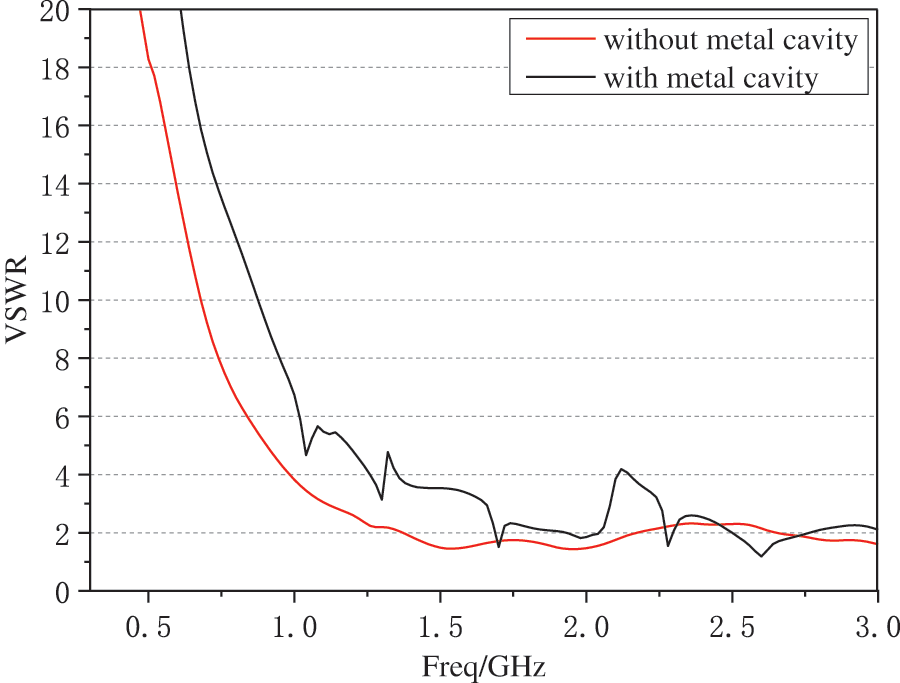
Figure 6: Effect of metal back cavity on sensor VSWR
From Fig. 6, it can be found that the metal back cavity reduces the sensor’s EM reception performance, while the overall variation trend of the sensor’s standing wave ratio remains unchanged: within the frequency range of less than 1 GHz, VSWR decreases exponentially with the increase of frequency, and shows the characteristics of gradual stability and small fluctuation in the range of 1–3 GHz. In the absence of metal back cavity, the bandwidth of sensor with VSWR less than 2 is 1.36–2.18 GHz and 2.65–3 GHz, and the relative bandwidth is about 43%. In the case of metal back cavity, the bandwidth of sensor with VSWR less than 2 is 1.69–1.72 GHz, 1.94–2.04 GHz, 2.27–2.31 GHz and 2.5–2.75 GHz.
In the case of a metal back cavity, the VSWR of proposed UHF sensor under different cavity depths is simulated. The simulation results are shown in Fig. 7. The cavity depths h2 are 39, 42, 45 and 48 mm, respectively. As can be seen from the Fig. 7, when the cavity depth is 39 mm, the sensor performance is the best. At the same time, influenced by the size of the sensor feeder, 39 mm is the minimum size allowed, so the back cavity depth of the sensor is set to 39 mm.
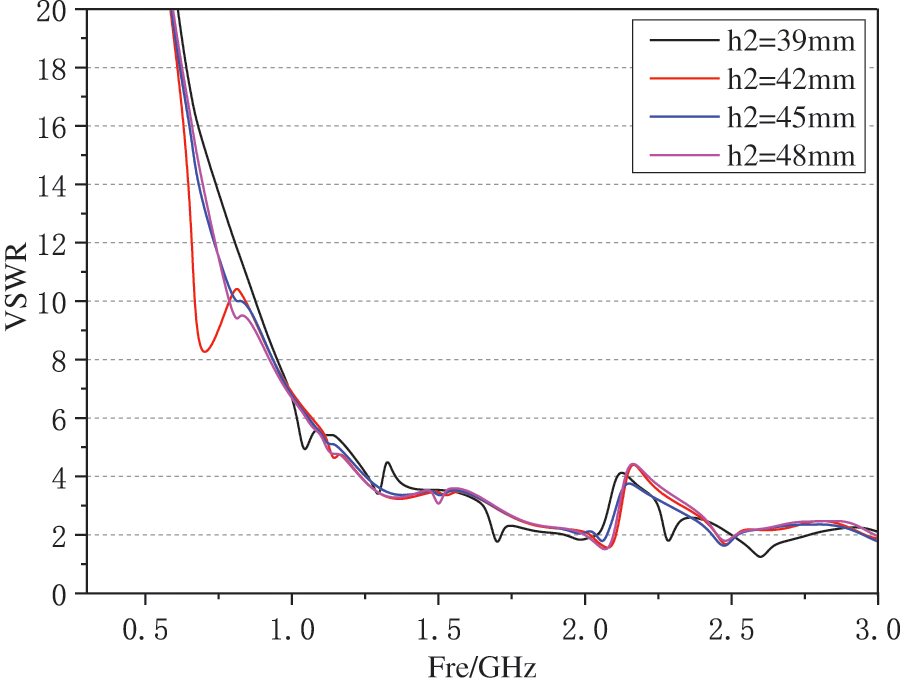
Figure 7: Effect of depth of metal back cavity on UHF sensor VSWR
By HFSS finite element software simulation optimization [22], the length l of the sensor is set at 74 mm, and the width w is 104 mm (corresponding angle θ is about 110°), and the metal cavity length l1, width w1 and depth h2 are 91, 127, 39 mm, separately, as shown in Table 1.
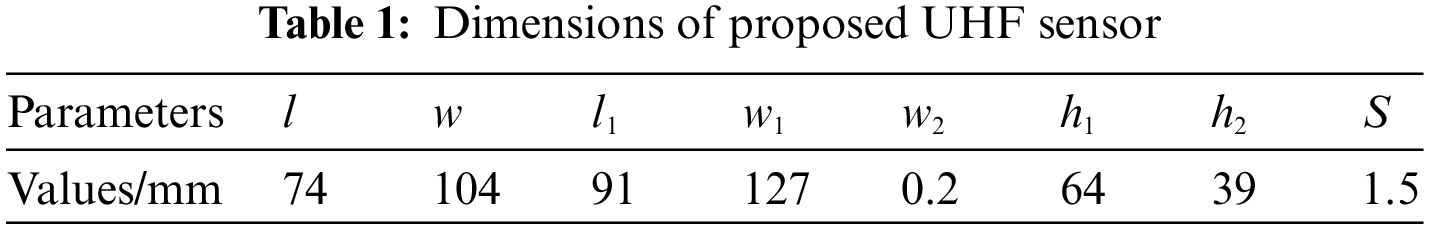
Fig. 8 is the prototype of proposed UHF sensor. The black foam serves as isolation and buffering. The VSWR parameter of sensor simulation result is done by HFSS and the test result is done by ENA Network Analyzer E5080 A. The simulated and tested result is shown in Fig. 9. The VSWR of prototype sensor basically matches the simulation result, and both have higher detection sensitivity in the frequency band of 1–3 GHz.

Figure 8: Photo of sensor prototype
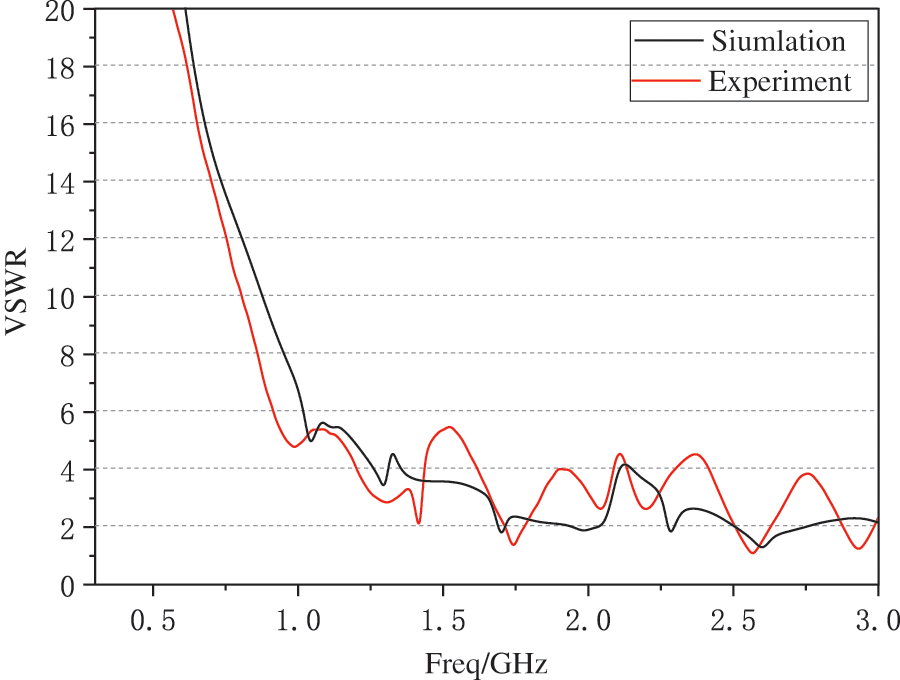
Figure 9: VSWR vs frequency of proposed UHF sensor
Fig. 10 is the radiation pattern of proposed UHF sensor at frequency of 1.2, 1.6 and 2 GHz, respectively, where red is the x-z plane radiation characteristic and blue is the x-y plane. It can be seen from the figure that the sensor has strong directivity at 1.2, 1.6 and 2 GHz. The main radiation directions are the open side of the cavity, which can effectively improve the anti-interference ability of the sensor.
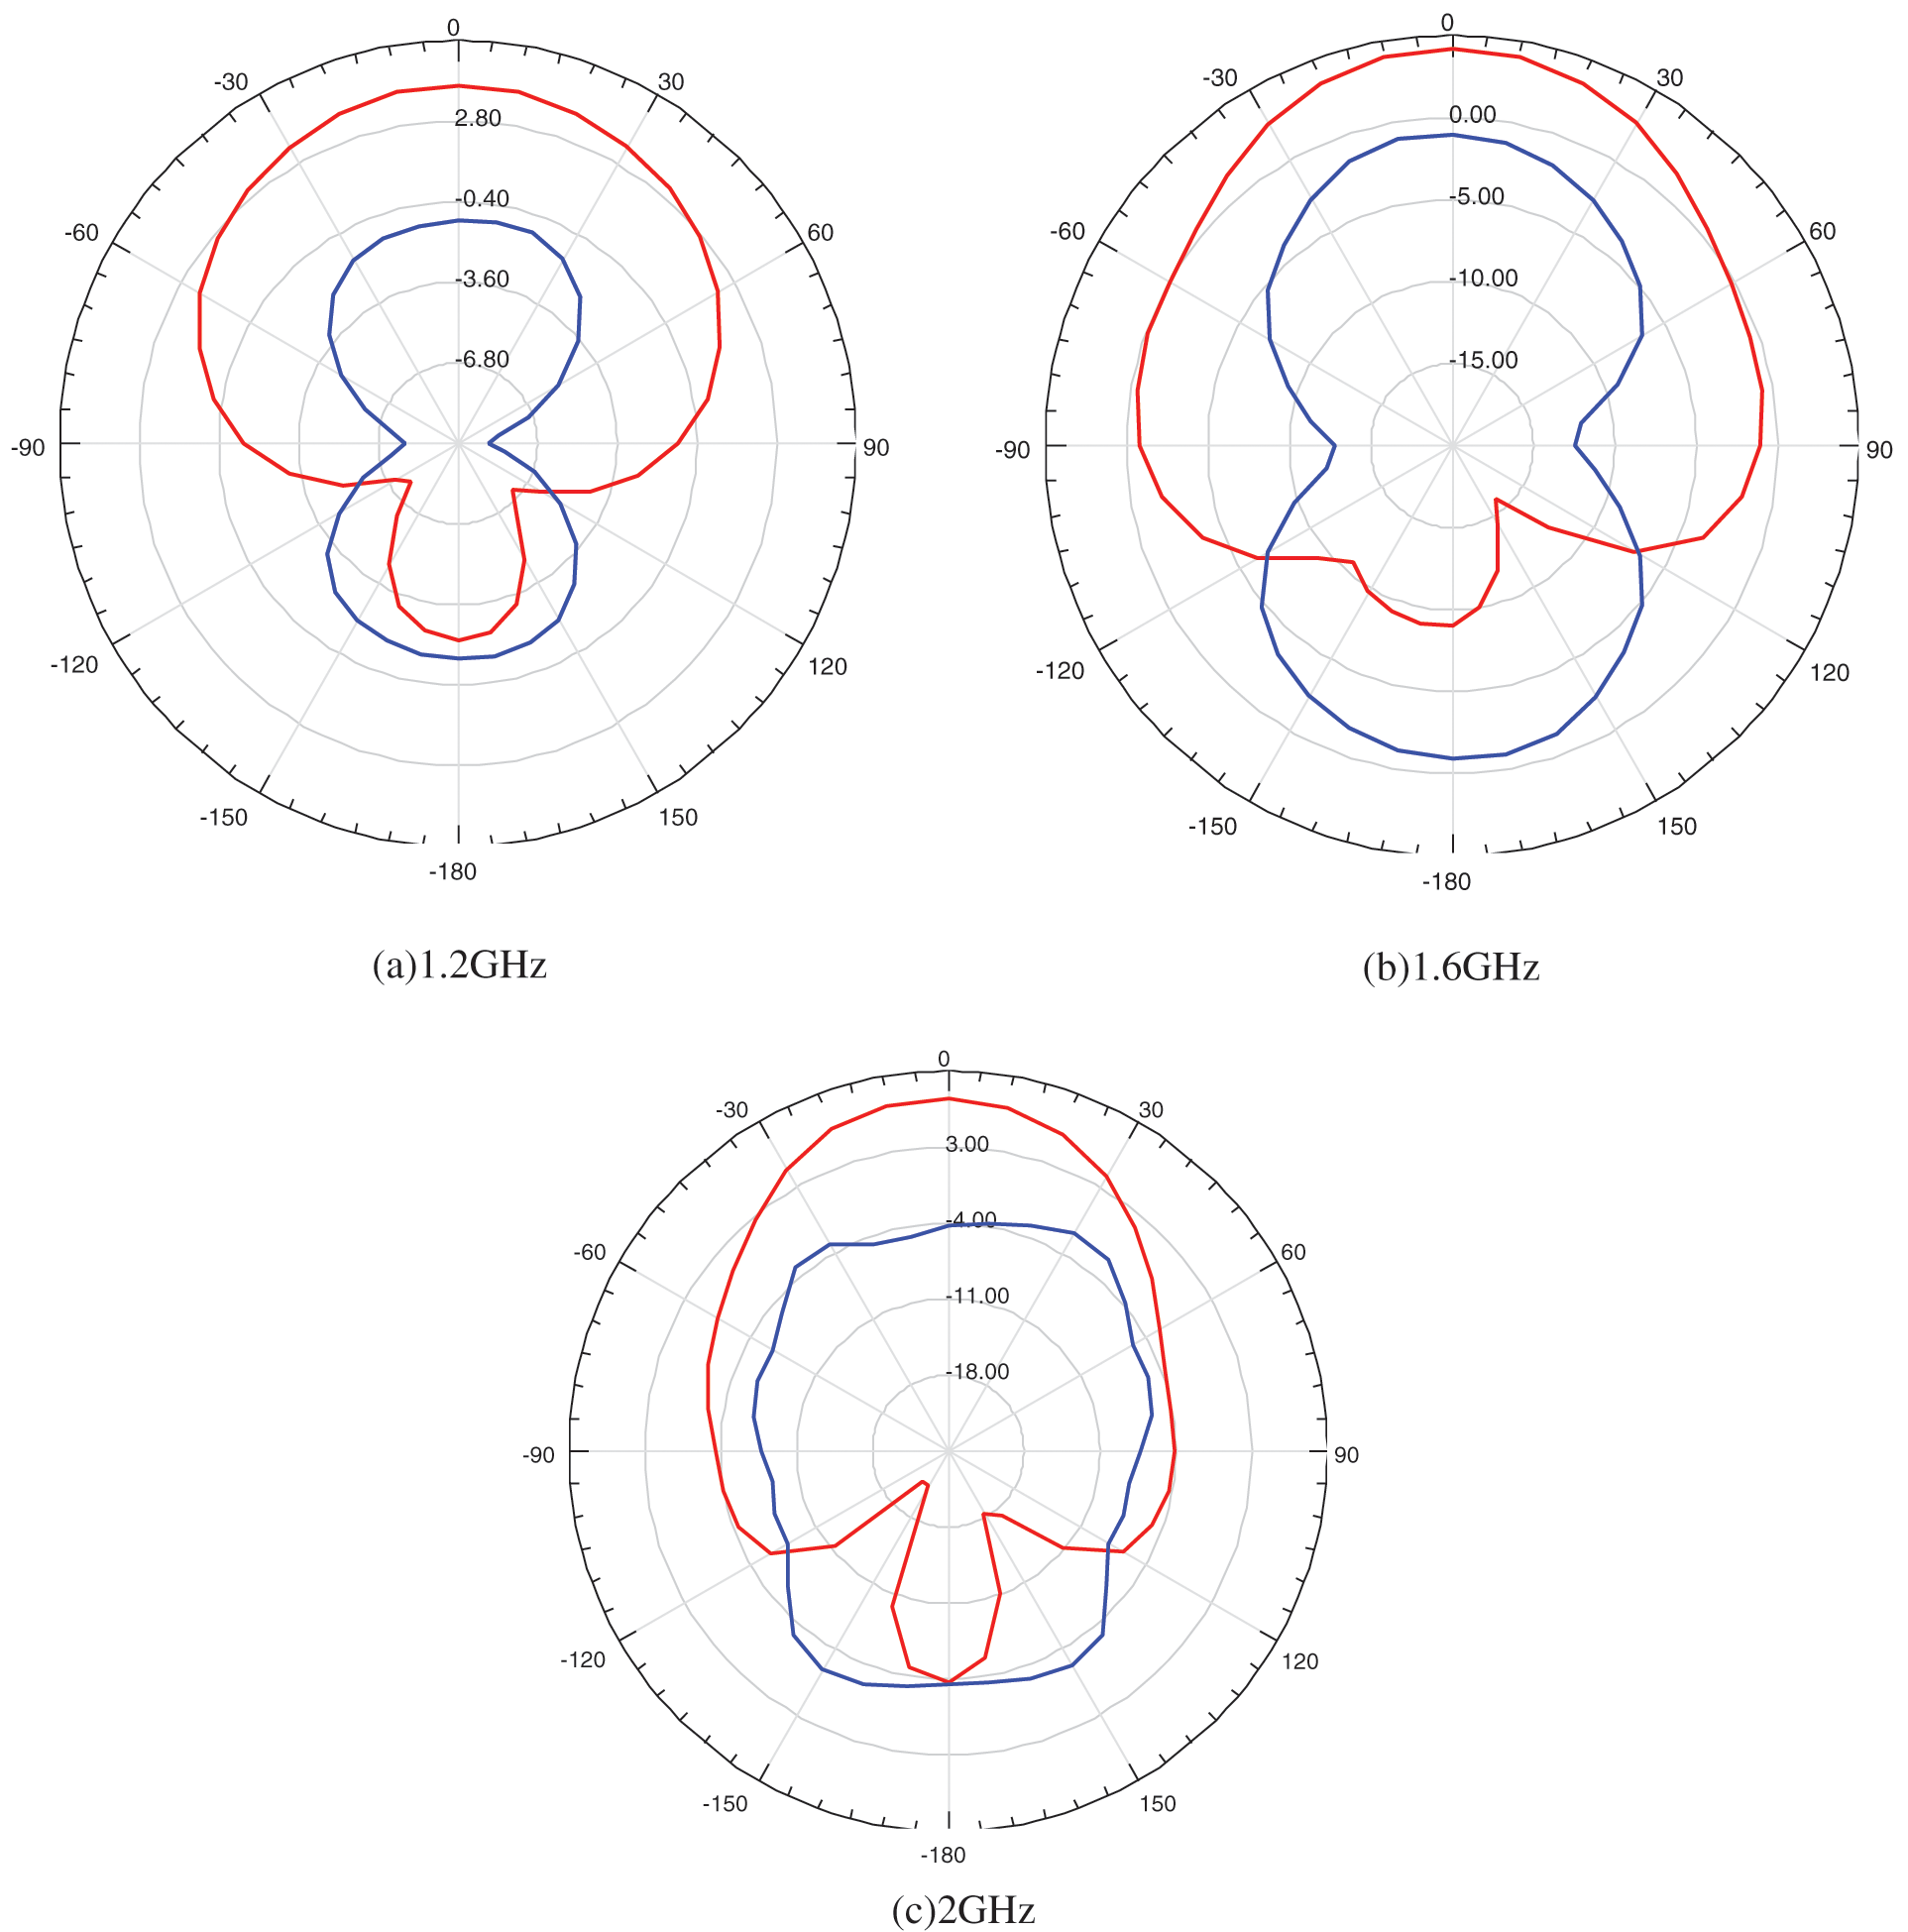
Figure 10: Radiation patterns of proposed UHF sensor (Blue is x-z plane; red is x-y plane)
4 Sensitivity Test of Proposed UHF Sensor in 220 kV GIS
In order to test the sensitivity of proposed sensor, PD UHF detection experiment is conducted on 220 kV GIS according IEC 60270 and GB/T 7354-2018. Metal protrusion defect is placed in the GIS SF6 chamber. The needle electrode is connected with the GIS high voltage terminal. The plate electrode is connected with the GIS shell, and the shell is grounded reliably, chamber is filled with 0.5 MPa SF6. The needle plate spacing is 10 mm. The proposed sensor detects the electromagnetic wave signal leaked from the resin hole on the adjacent disc insulator. The experimental circuit is shown in Fig. 11, where T1 is power frequency experimental console, T2 is none PD testing transformer (YDJW-50/100), C1/C2 is capacitor divider (DR-100/600), C3 is coupling capacitor, R2 is testing impedance. The 220 kV GIS is produced by Pinggao Group Co., Ltd. (China) (a high voltage electrical equipment manufacturer in China). The sampling rate of the oscilloscope is 10 G/s, Bandwidth is 2.5 GHz.
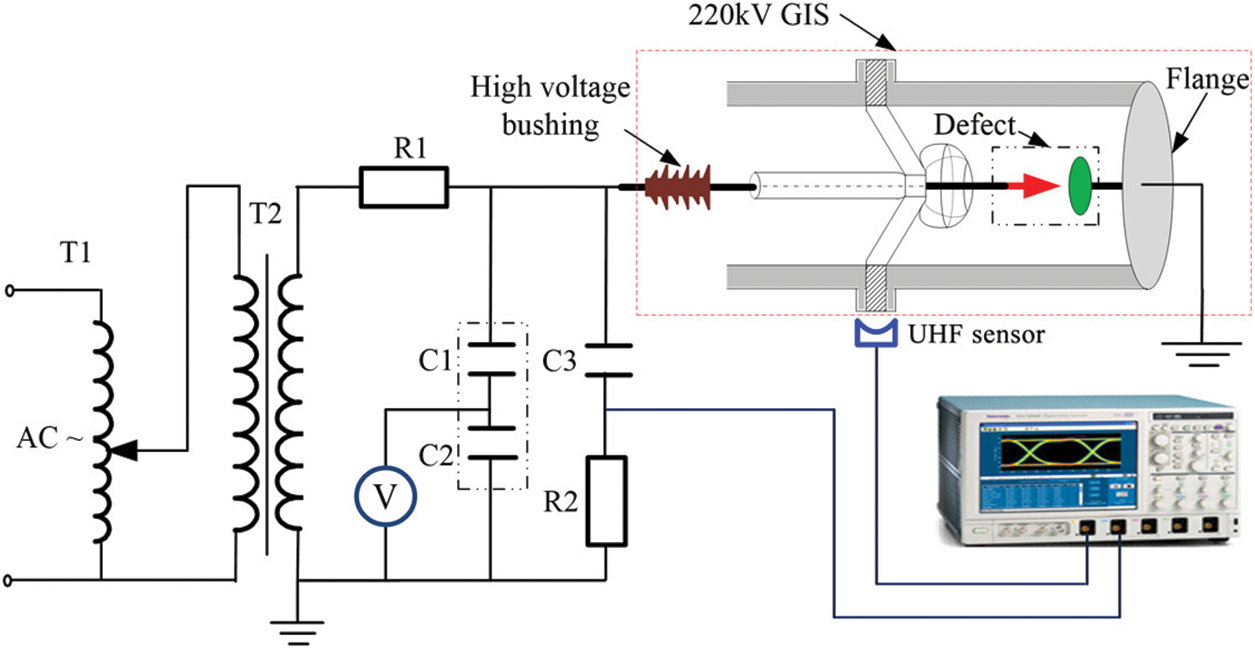
Figure 11: PD testing experiment circuit on 220 kV GIS
The implementation of the experiment is shown in Fig. 12. Proposed UHF sensor is fixed on GIS disc insulator to detect PD electromagnetic wave signal leaking from the resin hole.
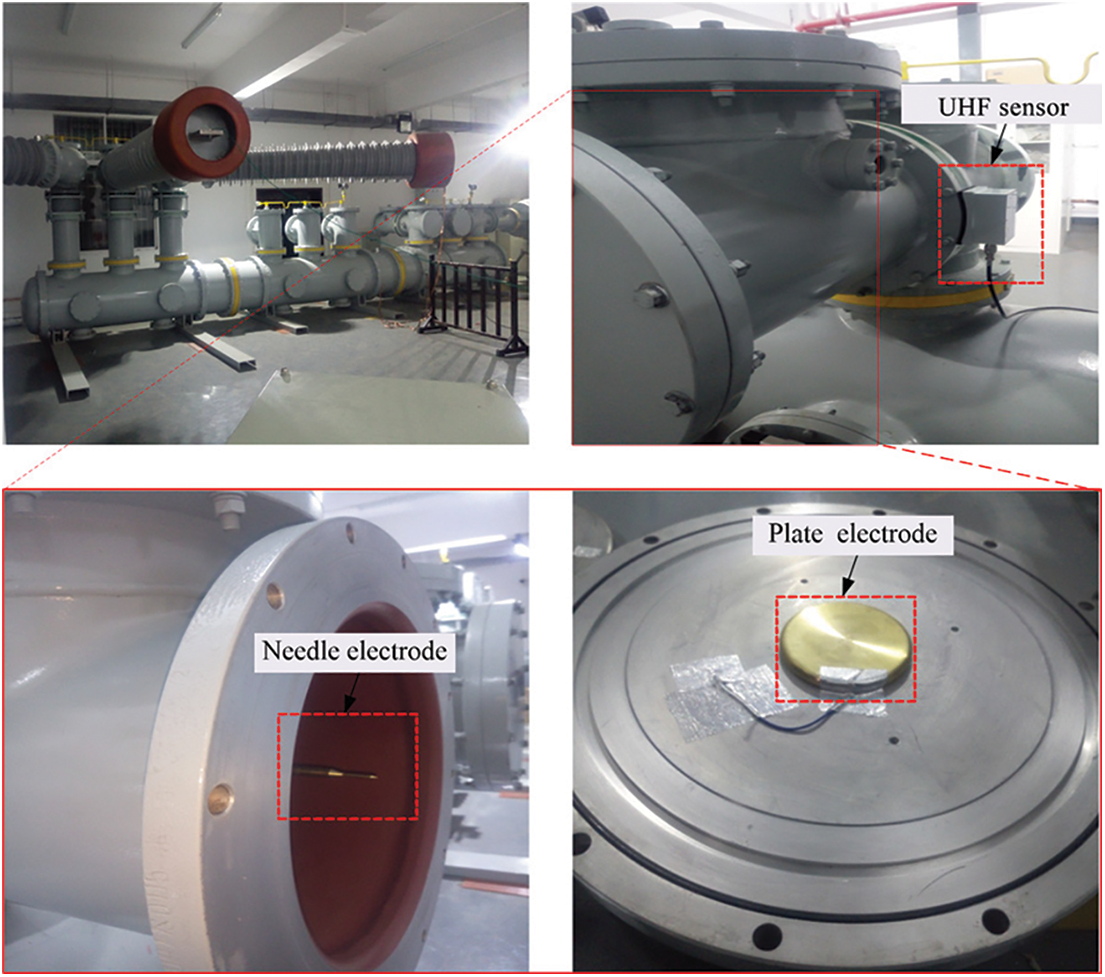
Figure 12: Photo of experiment implementation on 220 kV GIS
4.2 Experimental Result Analysis
The experimental voltage is 40 kV. The discharge amount is about 60 pc (according to the field operation experience, the UHF detection system of GIS PD insulation defects should realize effective perception within the discharge intensity range of 10–5000 pc with amplifier). Experimental result show that proposed UHF sensor can stably detect PD EM wave signal leaking from the resin hole, Fig. 13 is one of the PD UHF signals and its frequency spectrum characteristics. As can be seen from the Fig. 13, the energy of leaked EM signal is mainly above 1 GHz, it is mainly consistent with the sensor detection band, and the theoretical analysis of EM wave propagation characteristics from rectangular resin hole.
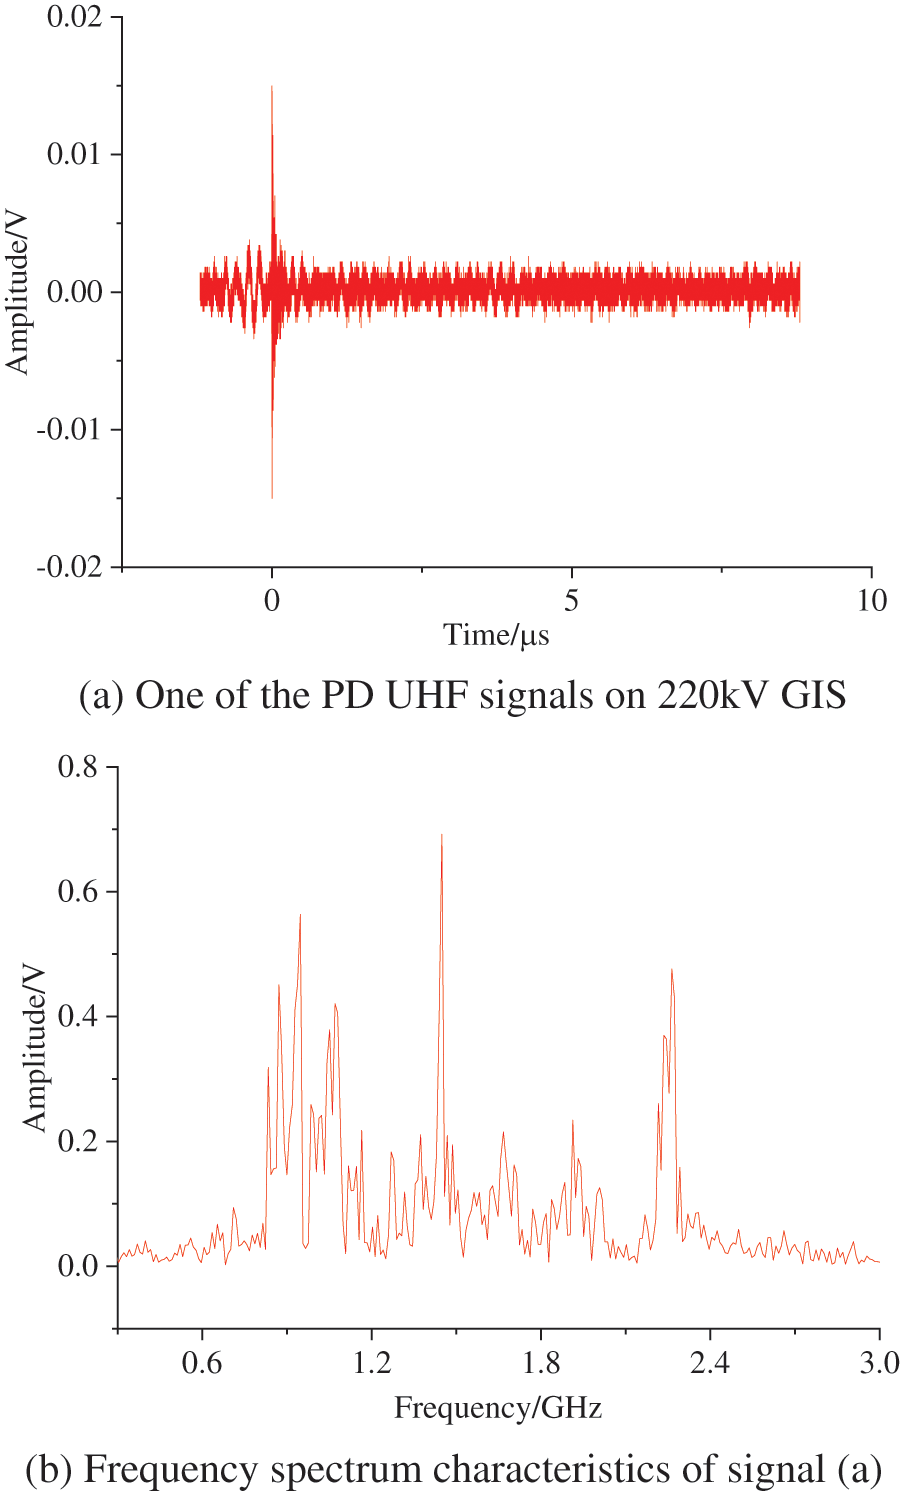
Figure 13: PD UHF signals and its frequency spectrum characteristics on 220 kV GIS
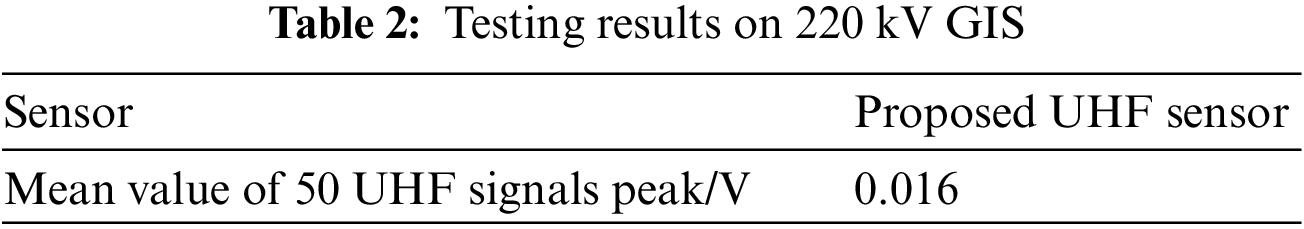
Besides, considering the fluctuation of PD process, the mean value of 50 UHF signals peak is calculated, calculation result is shown in Table 2, the mean value is about 0.016 V, and the signal is stable.
Finally, the UHF sensor designed in this paper is used to collect the discharge characteristic signals of 50 power frequency cycles, and the corresponding discharge map is drawn, as shown in Fig. 11. It can be seen from Fig. 14 that the GIS PD UHF signal is mainly concentrated at the peak of the positive half cycle the spectrum shows that the PD defect type of the formation is a metal protrusion defect, indicating that the external UHF Sensor designed in this paper can be effectively used for the detection of GIS PD Insulation Defect.
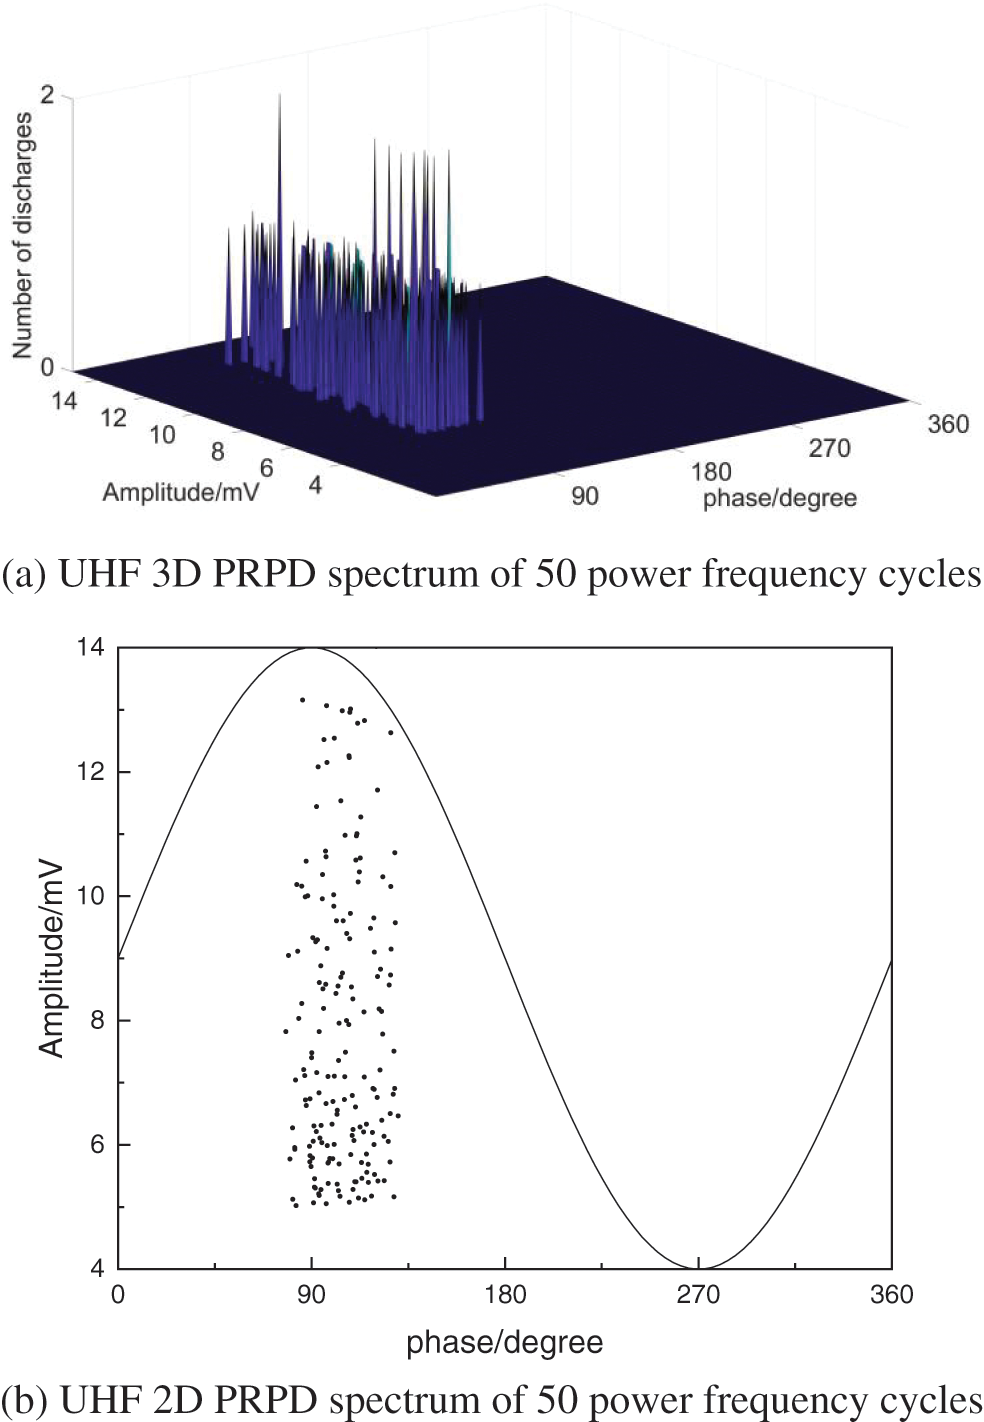
Figure 14: 50 power frequency cycle UHF PRPD spectrum
① Based on the theoretical analysis of the electromagnetic wave propagation characteristics in the rectangle resin hole of GIS disc insulator, it is found that the leaked electrom Agnetic wave signal of the resin hole has a higher energy distribution above the range of about 1 GHz frequency band. Based on this, an external GIS PD UHF sensor is designed. In band of 1–3 GHz, the proposed UHF sensor has higher detection sensitivity in the frequency band of 1–3 GHz, and lower detection sensitivity in the frequency band of 0.3–1 GHz.
② The proposed UHF sensor sensitivity test experiment is carried out on 220 kV GIS experiment circuit according to IEC 60270 and GB/T 7354-2018. The experimental results show that the UHF sensor proposed in this paper can stably detect the PD electromagnetic wave signal leaking from the resin hole, and signal frequency spectrum characteristics is consistent with the sensor detection band, and the theoretical analysis of EM wave propagation characteristics from rectangular resin hole.
Corona interference is common in substations. It is necessary to carry out research on anti-interference ability based on the external UHF sensor developed. It is required that the UHF sensor can effectively detect partial discharge signals under complex interference conditions. In addition to corona interference, large power equipment such as GIS is also affected by temperature during operation. The characteristics of the partial discharge signal will change under the influence of temperature, so it is also very important to further study the designed external UHF sensor so that it can effectively detect the discharge signal affected by temperature.
Acknowledgement: All the research work has been funded by the State Grid Electric Power Research Institute Co., Ltd. (Grant No. 5500-202040089A-0-0-00). We sincerely express our thankfulness here.
Funding Statement: Project supported by Science and Technology Project of SGCC (Research on Key Technologies for Fault Diagnosis and Early Warning of Intermittent Discharge in UHV GIS: 524625200028).
Conflicts of Interest: The authors declare that they have no conflicts of interest to report regarding the present study.
References
1. Zhang, S., Zhang, G., Lu, C. (2022). Flexible planar monopole built-in GIS PD sensor based on meandering technology. Sensors, 22(11), 4134. DOI 10.3390/s22114134. [Google Scholar] [CrossRef]
2. Zhang, G., Chen, K., Li, X., Wang, K., Fang, R. et al. (2022). GIS PD detection flexible built-in miniaturized Archimedes spiral antenna sensor. High Voltage Engineering, 48(6), 2244–2254. DOI 10.13336/j.1003-6520.hve.20210634. [Google Scholar] [CrossRef]
3. Ren, M., Zhou, J., Miao, J. (2021). Adopting spectral analysis in partial discharge fault diagnosis of GIS with a micro built-in optical sensor. IEEE Transactions on Power Delivery, 36(2), 1237–1240. DOI 10.1109/TPWRD.2020.3028511. [Google Scholar] [CrossRef]
4. Zhang, W., Lu, P., Ni, W., Xiong, W., Liu, D. et al. (2022). Gold-diaphragm based fabry-perot ultrasonic sensor for partial discharge detection and localization. IEEE Photonics Journal, 12(3), 1–12. DOI 10.1109/JPHOT.2020.3037623. [Google Scholar] [CrossRef]
5. Tang, J., Wang, D., Fan, L., Zhuo, R., Zhang, X. (2015). Feature parameters extraction of gis partial discharge signal with multifractal detrended fluctuation analysis. IEEE Transactions on Dielectrics & Electrical Insulation, 22(5), 3037–3045. DOI 10.1109/TDEI.2015.004556. [Google Scholar] [CrossRef]
6. Schichler, U. (2016). UHF partial discharge detection system for GIS: Application guide for sensitivity verification: CIGRE WG D1.25. IEEE Transactions on Dielectrics & Electrical Insulation, 23(3), 1313–1321. DOI 10.1109/TDEI.2015.005543. [Google Scholar] [CrossRef]
7. Zhang, X., Chen, Y., Tang, J., Wen, X. (2011). Minitype quasi-TEM horn antenna for partial discharge detection in GIS. High Voltage Engineering, 31, 1975–1981. [Google Scholar]
8. Hoshino, T., Maruyama, S., Ohtsuka, S., Hikita, M., Wada, J. et al. (2012). Sensitivity comparison of disc- and loop-type sensors using the UHF method to detect partial discharges in GIS. IEEE Transactions on Dielectrics & Electrical Insulation, 19(3), 910–916. DOI 10.1109/TDEI.2012.6215094. [Google Scholar] [CrossRef]
9. Judd, M. D., Farish, O., Pearson, J. S., Hampton, B. F. (2001). Dielectric windows for UHF partial discharge detection. IEEE Transactions on Dielectrics & Electrical Insulation, 8(6), 953–958. DOI 10.1109/94.971451. [Google Scholar] [CrossRef]
10. Tan, Q., Tang, J., Zeng, F. (2016). Design of fourfold-band micro-strip monopole antenna for PD detection in gas insulated switchgear. Proceedings of CSEE, 31(10), 127–144. [Google Scholar]
11. Hikita, M., Ohtsuka, S., Ueta, G., Okabe, S., Hoshino, T. et al. (2010). Influence of insulating spacer type on propagation properties of PD-induced electromagnetic wave in GIS. IEEE Transactions on Dielectrics & Electrical Insulation, 17(5), 1642–1648. DOI 10.1109/TDEI.2010.5595569. [Google Scholar] [CrossRef]
12. Zhang, Q., Han, X., Zhang, Z. (2019). Effects of size and location of air gap defect in solid insulation on its partial discharge characteristics. High Voltage Technology, 45(4), 1313–1322. [Google Scholar]
13. Huang, T., Hao, Y., Xiao, J. (2022). Comparative study on power frequency partial discharge characteristics of typical installation defects of 10 kV XLPE cable terminals. Power Grid Technology, 46(6), 2420–2428. [Google Scholar]
14. Wang, L., Zheng, S., Li, C., He, M., Lu, Q. et al. (2017). Distribution of electric field strength and spectral characteristic of UHF signal of PD inside GIS at resin sprue of metal ring. Power System Technology, 38(1), 241–247. [Google Scholar]
15. Wu, S., Ye, Q., Li, X., Wang, Z. (2014). Study on the relationship between the size of resin sprue on GIS and intensity of UHF electromagnetic waves radiated from PD. Transactions of China Electrotechnical Society, 29(S1), 531–536. [Google Scholar]
16. Qu, S. W., Chan, C. H., Xue, Q. (2009). Ultrawideband composite cavity-backed folded sectorial Bowtie antenna with stable pattern and high gain. IEEE Transactions on Antennas & Propagation, 57(8), 2478–2483. DOI 10.1109/TAP.2009.2024585. [Google Scholar] [CrossRef]
17. Zhou, Y., Pan, J., Nie, Z. (2005). Engineering design of the transient back-cavity Bowtie antenna. Journal of UEST of China, 34(1), 1–7. [Google Scholar]
18. Wu, S., Ye, Q., Li, X., Wang, Z. (2014). Study on the relationship between the size of resin sprue on GIS and intensity of UHF electromagnetic waves radiated from PD. Transactions of China Electrotechnical Society, 29(S1), 531–536. [Google Scholar]
19. Li, J., Zhang, X., Han, X. et al. (2018). A partial discharge detection method for SF6 insulated inverted current transformers adopting inner shield case as UHF sensor. IEEE Transactions on PowerDelivery, 33(6), 3237–3239. [Google Scholar]
20. Dau-Chyrh, C., Jr-Hung, L., Shih-Hung, L. (2004). The study of wideband bowtie antenna for ITDAMS. ICMMT 4th International Conference on Microwave & Millimeter Wave Technology, pp. 54–57. Beijing, China. [Google Scholar]
21. Chen, Z., Cao, Q. (2008). Study of a two-arm sinuous antenna and the relevant wideband balun. International Conference on Microwave & Millimeter Wave Technology, pp. 1837–1840. Nanjing, China. [Google Scholar]
22. Zhang, G. Z., Lu, C. Y., Zhou, H., Tian, H. L., Yu, X. Y. et al. (2022). Integrated sensing technology of partial discharge ultrasound and ultra-high frequency of power equipment. High Voltage Technology, 1–12. [Google Scholar]
Cite This Article
 Copyright © 2023 The Author(s). Published by Tech Science Press.
This work is licensed under a Creative Commons Attribution 4.0 International License , which permits unrestricted use, distribution, and reproduction in any medium, provided the original work is properly cited.
 Downloads
 Citation Tools