
 Submit a Paper
 Propose a Special lssue
 Open Access
ARTICLE

Peer-to-Peer Energy Trading Method of Multi-Virtual Power Plants Based on Non-Cooperative Game
Yancheng Power Supply Company of State Grid Jiangsu Electric Power Co., Ltd., Yancheng, 224008, China
* Corresponding Author: Jingjing Bai. Email:
Energy Engineering 2023, 120(5), 1163-1183. https://doi.org/10.32604/ee.2023.025553
Received 19 July 2022; Accepted 25 October 2022; Issue published 20 February 2023
 View Full Text
 Download PDF
Abstract
The current electricity market fails to consider the energy consumption characteristics of transaction subjects such as virtual power plants. Besides, the game relationship between transaction subjects needs to be further explored. This paper proposes a Peer-to-Peer energy trading method for multi-virtual power plants based on a non-cooperative game. Firstly, a coordinated control model of public buildings is incorporated into the scheduling framework of the virtual power plant, considering the energy consumption characteristics of users. Secondly, the utility functions of multiple virtual power plants are analyzed, and a non-cooperative game model is established to explore the game relationship between electricity sellers in the Peer-to-Peer transaction process. Finally, the influence of user energy consumption characteristics on the virtual power plant operation and the Peer-to-Peer transaction process is analyzed by case studies. Furthermore, the effect of different parameters on the Nash equilibrium point is explored, and the influence factors of Peer-to-Peer transactions between virtual power plants are summarized. According to the obtained results, compared with the central air conditioning set as constant temperature control strategy, the flexible control strategy proposed in this paper improves the market power of each VPP and the overall revenue of the VPPs. In addition, the upper limit of the service quotation of the market operator have a great impact on the transaction mode of VPPs. When the service quotation decreases gradually, the P2P transaction between VPPs is more likely to occur.Keywords
In recent years, the advantages of distributed energy development have gradually emerged, and it has become inevitable for the energy supply mode to transform from centralized to distributed [1–3]. However, China’s existing power generation/power supply mode is mainly a centralized operation with high sensitivity, a large amount of communication information, and low robustness. It cannot give full play to the advantages of distributed energy in security and economy, leading to the low marketization degree of distributed energy and the need for relevant national policy support. Under the background of deepening reform of the electric power system, various countries have accelerated the development of distributed market trading [4–6]. China released in November 2017 Notice on Developing Distributed Power Generation Market Trading Pilot, which puts forward to further open the user side market, play the positive guidance of market, and stimulate the vitality of market entities. In this context, a local power-sharing and trading method–Peer-to-Peer (P2P) energy trading method emerged. It can effectively lower the threshold and trading cost of the user-side market trading and stimulate the enthusiasm of market entities to participate in distributed trading. Now, it has been widely used in power trading between virtual power plants (VPPs). However, distributed energy trading still faces problems, such as random user behavior, random bidding strategy of each entity, and complex market relations. Therefore, it is urgent to optimize the market trading strategy of each entity and further clarify the game relationship between different market entities.
At present, the forms of power sharing and distributed trading between VPPs can be divided into the following two categories [7]: (1) Energy sharing and trading system based on cooperative game mode; (2) Energy sharing and trading system based on a non-cooperative game. For the former, its main form is that each VPP participates in the overall market trading in the form of an alliance and preferentially consumes the internal surplus electric energy in the form of energy sharing. Reference [8] proposed a cooperative game model based on one-to-many and many-to-many trading, and uses the nucleolus method to realize the redistribution of the cooperative surplus. References [9,10] improved the nucleolus method by clustering and calculating the excess degree, making it suitable for a large number of VPP groups. Reference [11] proposed a building group day-ahead optimal scheduling strategy based on energy sharing, and uses the Shapley value method to redistribute the overall revenue after scheduling. For the latter, different from a cooperative game, the electric energy trading mode based on a non-cooperative game focuses on the equilibrium under the conflict of interest between each entity, which can be divided into the platform-leading trading mode and participant-leading trading mode. References [12,13] built a platform-leading market trading model, where leading market operators and followers form a Stackelberg game relationship. Through electricity price guide and electric power sharing, it promotes the nearby consumption of clean energy, and reduces the transmission loss in the energy trading process. Reference [14] studied the participant-leading non-cooperative game model, establishes the non-cooperative competitive relationship between multiple sellers, and obtains the optimal bidding strategy of each seller based on the Nash equilibrium solution. Reference [15] combined the two forms with both the master-slave game relationship between agents and VPP, and the evolutionary game relationship between multiple VPP. Reference [16] presented a non-cooperative game model for optimal dispatching of virtual power plants considering distribution network security. Reference [17] provided the distributed transaction model considering the energy consumption characteristics of end users, and used the non-cooperative game model to analyze the game relationship between sellers and sellers and buyers in the process of P2P transaction. Reference [18] analyzed the seller’s price competition and buyer’s choice competition in the process of P2P trading through non-cooperative game theory and evolutionary game theory.
Based on the cooperative or non-cooperative game method, the above Reference studies the distributed trading between VPPs. But there are still the following deficiencies on the whole: First, in addition to electricity price and electricity these two variables directly related to trading results, the energy consumption characteristics and controllable potential of end users are also important factors. Although existing researches involve the load demand response of VPPs, they fail to systematically evaluate the VPP scheduling potential from the perspective of users’ energy consumption characteristics. Secondly, current research on P2P trading mode based on the non-cooperative game is mostly confined to analysis of the VPP trading strategy and energy management strategy at the game equilibrium point. Few conduct an in-depth analysis of the conditions and influencing factors of P2P from the perspective of game equilibrium.
From the above considerations, this paper proposes a VPP Peer-to-Peer energy trading method based on the non-cooperative game. Firstly, combined with operating principles of public building central air-conditioning system, a VPP day-ahead scheduling framework including public buildings is built. Next, the utility function for electric power sellers during the P2P trading process from the perspective of trading profit, service cost, power generation cost is constructed. And the non-cooperative game model between seller VPP and market operator (market operator, MO) is established. Then, the game model Nash equilibrium solution is summarized according to the definition of pure strategy Nash equilibrium, and the rationality of Nash equilibrium solution is also proved. Finally, through simulation example, the impact of different air conditioning operation strategies on P2P trading results is compared and the conditions and influencing factors of P2P trading between VPPs are also analyzed.
2 VPP Operation Framework and Basic Model
This paper mainly studies public building aggregations, energy storage, photovoltaic, and fixed load VPPs. Meanwhile, the type of VPPs aggregated public buildings varies, including but not limited to large shopping malls, office buildings and hotels. The main controllable equipment within the building is the central air conditioning system, which can optimize the operation mode of different units through a flexible control strategy, to save power consumption and improve the VPPs’ market schedulable potential. The basic VPP structure of aggregated public buildings is shown in Fig. 1.
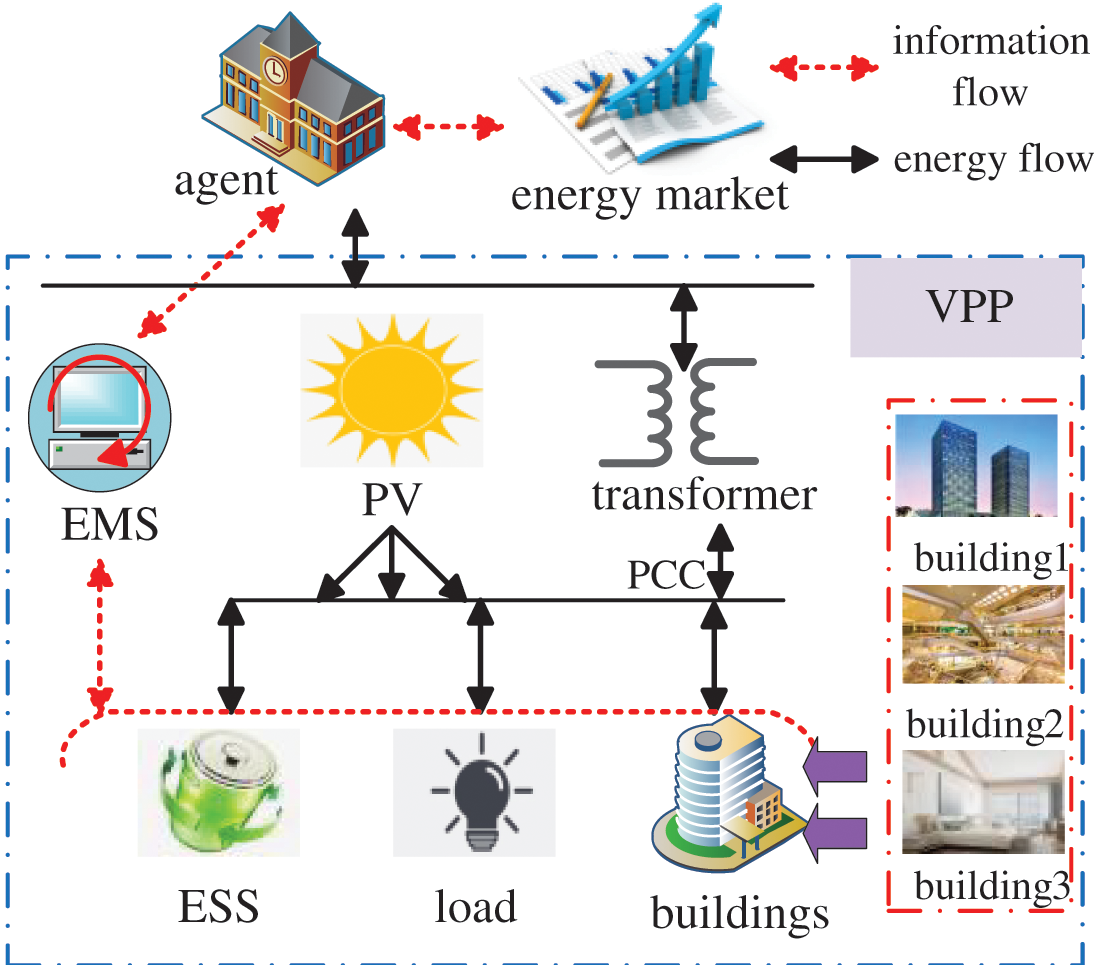
Figure 1: Schematic diagram of VPP basic structure
2.1 Central Air-Conditioning System Model in Public Buildings
Compared with distributed air conditioners on the resident side or in small factories, the central air conditioners in large public buildings are more centralized with larger controllable capacity. The existing public building central air conditioning operation strategy is mostly the constant temperature operation at a preset temperature. However, as long as the building room temperature is within a certain temperature range, there will not be much change in the user comfort [19,20]. Therefore, the energy consumption characteristics of the end-user equipment could be adjusted properly. For example, through flexible control of chillers and water pumps, the central air conditioning operation strategy could be optimized to reduce the VPP load demand and improve the VPP market trading potential. In this paper, the comfort requirements of users are determined using the predicted mean vote (PMV) index [21,22], denoted as
To ensure human comfort within an acceptable range, the present work applies the following constraint to the regulation and control processes of CACSs based on
The relationship between
Therefore, the reasonable temperature range of human comfort can be determined according to Eqs. (1) and (2).
According to the principle of energy conservation, the actual heat obtained by a public building in a certain period of time is equal to the difference between the incoming heat and the heat taken away by the central air conditioner. As shown in Fig. 2, that is, in any period of time, the sum of the instantaneous heat gain
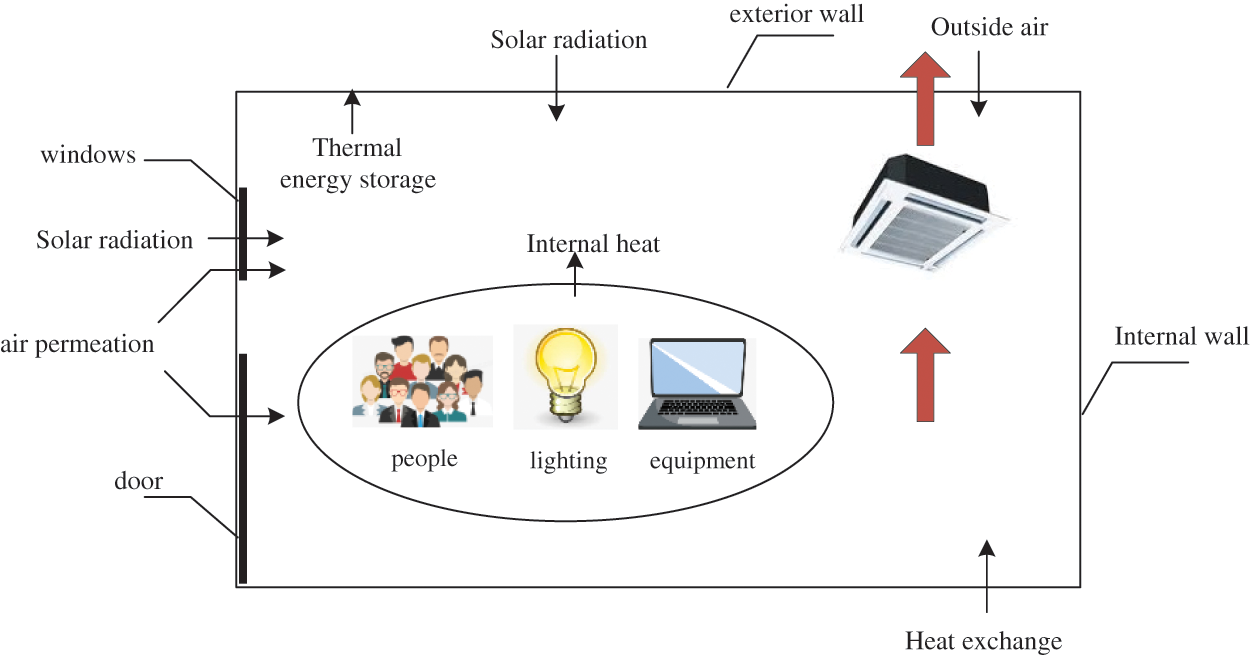
Figure 2: Schematic diagram of cooling and heating load balance
Public building air conditioning system regulation should meet the room temperature requirement of building users. This paper uses the modeling method based on cold and heat load calculations to describe the public building heat storage model. For public buildings, the central air conditioners provide a cooling load inside the buildings during work. Meanwhile, the heat release from the heat source inside and outside the building as well as heat storage of the building’s interior wall constantly raises the room temperature. Therefore, the heat balance relationship is as follows [23]:
Here,
Here,
As can be seen from Eqs. (3)–(5), to keep the room temperature within a certain range, the central air conditioning system needs to coordinate each unit’s operation to produce a stable cooling capacity. The central air conditioning system of a public building is mainly composed of three circulation systems: chilled water loop, condenser water loop, and refrigerant loop.
The cooling process of the central air conditioning system is to use electricity to move the indoor heat to the outdoor. For an air conditioning system with N1 chillers, N2 chilled water pumps, N3 cooling coil fans, N4 condenser water pumps, and N5 cooling towers, the energy consumption model can be expressed as [25]:
Here,
(1) Chiller
Chiller is the core of the central air conditioning system, and its energy consumption mainly depends on its energy efficiency ratio:
Here,
Here,
Here, Tchwr and Tcws represent the water temperature of return chilled water and temperature of supply condenser water, respectively. Qc represents the load of the condenser water loop. Fchw(mchw) and Fcw(mcw) are the empirical formulas for a chilled water flow mchw and condenser water flow mcw.
(2) Frequency conversion water pump
At present, most water pumps in building air conditioning systems operate at rated power, which leaves relatively large space for optimization. This paper assumes that all water pumps are installed with the frequency control system to control flow and reduce energy consumption. The power calculation formula of the frequency conversion water pump is as follows:
Here, Qroom.k is the cooling load of the corresponding area. msa,k and mchw,k are the fan air flow and chilled water flow in the coil, respectively; Tchws indicates the supply chilled water temperature, and Tma,k is the mixed indoor and outdoor air temperature, which can be expressed as
(3) Cooling tower
The cooling tower is the heat exhaust device of the central air conditioning system, which absorbs the heat in the room and discharges it to the outside through a condenser water loop. The heat dissipation process can be expressed as:
Here, mta,n and mcw,n are the airflow and condenser water flow respectively in the cooling tower; Tcwr and Twb are the temperatures of return chilled water and cooling tower wet bulb temperature, respectively. In addition, the total condenser water flow in the air conditioning system remains unchanged:
(4) Fan coil
The energy consumption of the fan coil and cooling tower both comes from fans. The energy consumption model is similar to that of the frequency conversion pump, which can be expressed as:
Here, msa/ta.nom is the rated value of the fan coil and cooling tower airflow.
(5) Operation constraints of the central air-conditioning system
Operation constraints of the central air-conditioning system mainly include operation constraints of each device and interaction constraints between different devices, where the interaction between the chiller and chilled/condenser water loop can be expressed as:
Here, based on the energy balance principle, condenser water eliminates the heat on the condenser water side, including heat generated by the compressor, and heat transmitted from evaporator to condenser through on the chilled water circulation side. Therefore, in the condenser water loop the cooling load
To ensure the optimal performance of the air conditioning system, variables should in the acceptable range.
Formulas (19) and (20) set the upper and lower limits of chilled water and condenser water supply temperature in the chiller; Formulas (21) and (22) indicate that the water flow in the pump should be controlled within a certain range; Formulas (23) and (24) indicates the control range of the fan airflow.
Furthermore, central air conditioning should keep room temperature within an acceptable range for users with the constraint expressed:
Here,
VPP’s internal converged energy storage model can make a profit through “low price storage and high price discharge” according to external electricity price, improve the VPP income level, and enhance the VPP operation mode flexibility. The equality constraint of energy storage capacity during energy storage system regulation is as follows:
In the formula,
The main constraints during the energy storage system operation are as follows:
In the formula,
3 Peer-to-Peer Trading Model of Multiple VPP Based on Non-Cooperative Game
Each VPP is different in social characteristics and aggregation source load unit. At the same time, adjacent VPP may have “power surplus”, “power shortage” and “power self-balance” in three states. Therefore, “price” could be used as the driving force for effective resource management of clustering VPPs, to give full play to the flexibility value of VPPs aggregation resources and improve their economic benefits. P2P is an effective means of decentralized trading between VPPs. At a moment, the demand for VPPs trading power is calculated as:
In addition, in the actual trading process, VPPs can combine the seller VPPs and market operator quotation with their situation to make the choice. There is a certain competition relationship between sellers at the same time, such as the seller VPPs and market operators. Both need to determine the best quotation strategy according to their benefit function to maximize the income. Therefore, this paper introduces a non-cooperative game mechanism to describe the competition between VPP and market operators.
3.1 Non-Cooperative Game Model
The basic form of the general non-cooperative game model is as follows:
In the formula,
(1) Game party
In the P2P trading process, the game party is the seller VPP and distribution network at time t. The set of all seller VPPs is marked as
(2) Game strategy
(2) For the seller VPPs, its game strategy is the electricity price
(3) Utility function
For seller VPPs, its utility function is the electricity sale income minus relevant cost at time t, which expressed as follows:
In the formula,
In the formulas,
The utility function of market operators is also its profit in market trading, that is, the retail market profit minus its wholesale electricity cost, which is calculated as follows:
In the formula,
In the formulas,
3.2 Induction and Proof of Nash Equilibrium Point
The Nash equilibrium point of the non-cooperative game is defined as: when the system reaches the game equilibrium, changes in either party’s game strategy will not improve its utility function. The strategy of the game equilibrium point is marked as
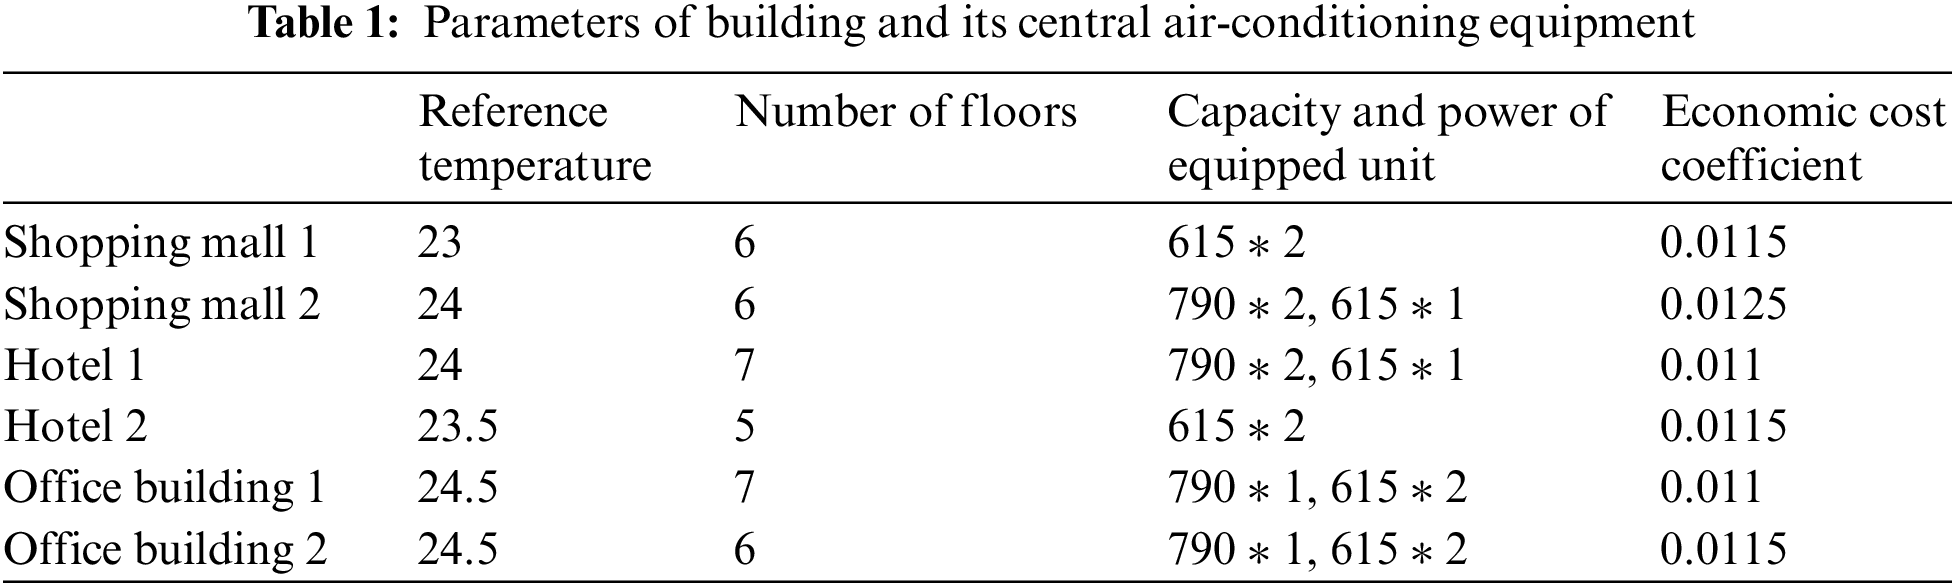
In this paper, one market operator and three VPPs aggregating different public buildings are used to verify the effectiveness of the established model. VPP1 aggregates two shopping malls, VPP2 aggregates 2 hotels, and VPP3 aggregates 2 office buildings. The basic parameters of these public buildings are shown in Table 1. Considering that the photovoltaic output of 0:00~7:00 and 18:00~24:00 is low, all VPPs are at the state of electricity purchase without P2P trading between each other. This paper only studies the VPPs electricity trading between 8:00 and 17:00. In this period, the predicted photovoltaic power, predicted load power, and outdoor temperature of each VPP are shown in Appendix Figs. C1–C3. The calculation of building thermal parameters in public buildings could refer to Reference [24] and the specific parameters of central air conditioning systems could be seen in reference [25]. The electricity purchase price, electricity sale price, and electricity wholesale price of market operators are shown in Appendix Fig. C4. In this paper, GAMS 24.4 software is used to call IPOPT solver to program and solve the model.
4.2 Analysis of Example Results
(1) Analysis of public building regulation strategies
Combined with the global optimization model of the central air conditioning system, the controllable potential of VPPs aggregated public buildings is evaluated. The controllable power of the six public buildings is shown in Fig. 3, respectively. It can be found that the VPP3 aggregated two office buildings have the largest load reduction quantity whereas the VPP1 aggregated Shopping mall 1 and VPP2 aggregated Hotel 2 have lower load reduction quantity. It is mainly because, the two office buildings are equipped with units with higher capacity and larger scheduling space. On the other hand, the reference temperature of the two office buildings is higher, hence with a larger temperature adjustment range and larger reducible load.
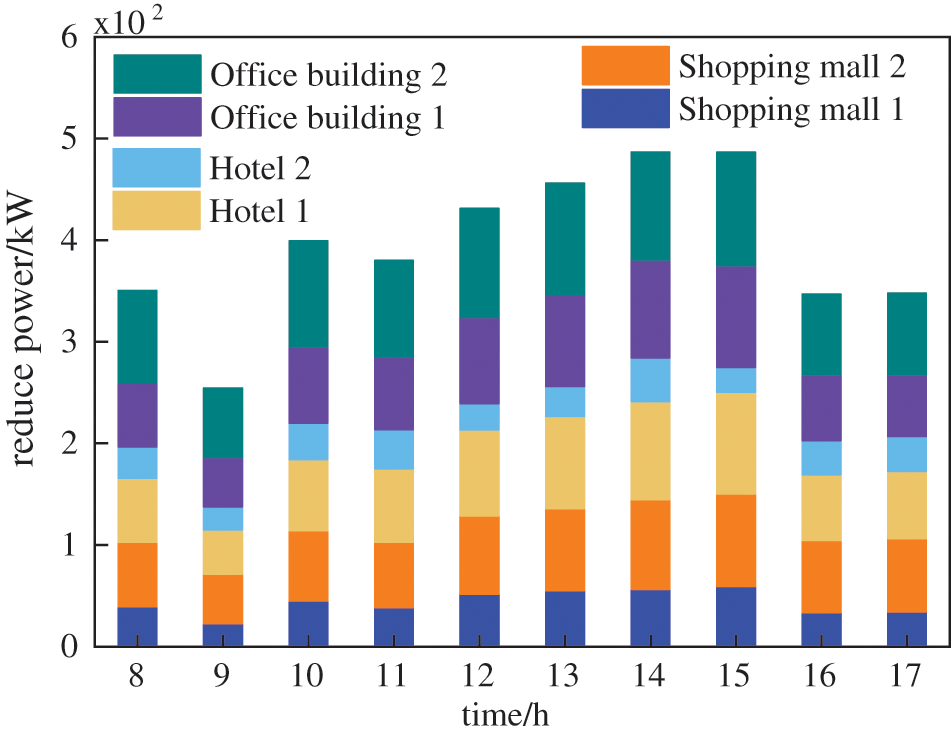
Figure 3: Load reduction results of public buildings
Fig. 4 shows the changes in public building rooms temperature optimized by the flexible regulation strategy proposed in this paper. The predicted average voting index is further used to combine room temperature with comfort [24] and divide the user comfort zone as shown in Fig. 4. It can be seen that after optimization, the room temperature of each building maintains the user comfort zone. And the overall room temperature curve of Office buildings 1 and 2 with higher reference temperature is also higher than that of other public buildings, so as to provide more sufficient load adjustment space.
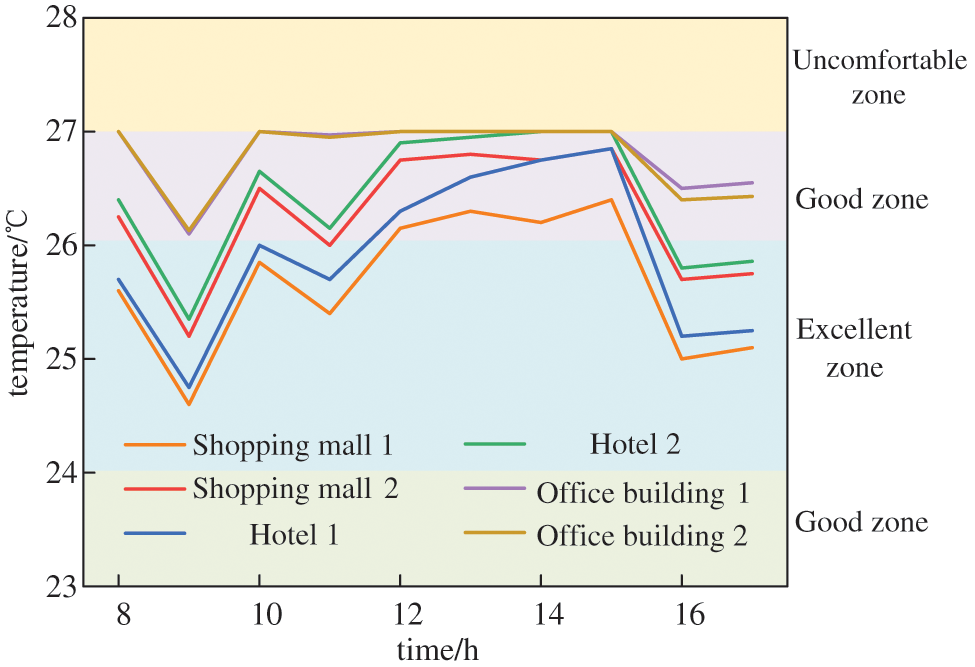
Figure 4: Room temperature regulation results in public buildings
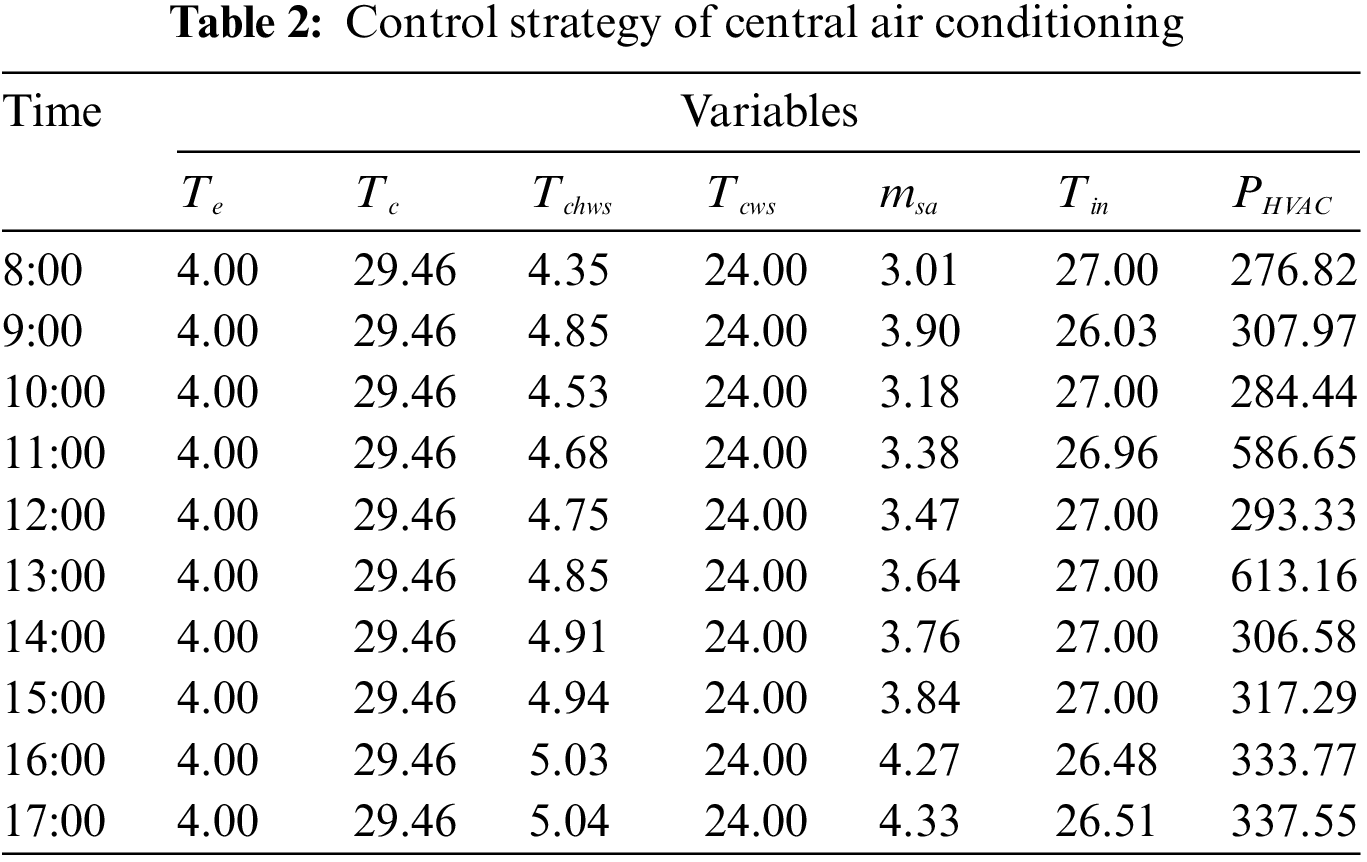
VPPs optimize the overall energy consumption of the air conditioning system by controlling variables, such as cooling water temperature, chilled water temperature, flow speed, and wind speed of the public building air conditioning system, and conducts flexible regulation on the premise of ensuring the user comfort. Taking Hotel 1 as an example, the results of each decision variable of the central air conditioning system of Hotel 1 at different periods are shown in Table 2. As can be seen, when the chilled water temperature is set at about 4.5°C and wind speed is controlled at about 3~4 kg/s, the energy consumption of the Hotel 1 air conditioning system is the lowest.
(2) VPPs market trading results considering public building regulation
To verify the effectiveness of the proposed multi-VPPs Peer-to-Peer energy trading method considering the public building’s controllable potential, the following comparative examples are set. In different scenarios, comparisons of the market trading demand of each VPP are shown in Fig. 5.
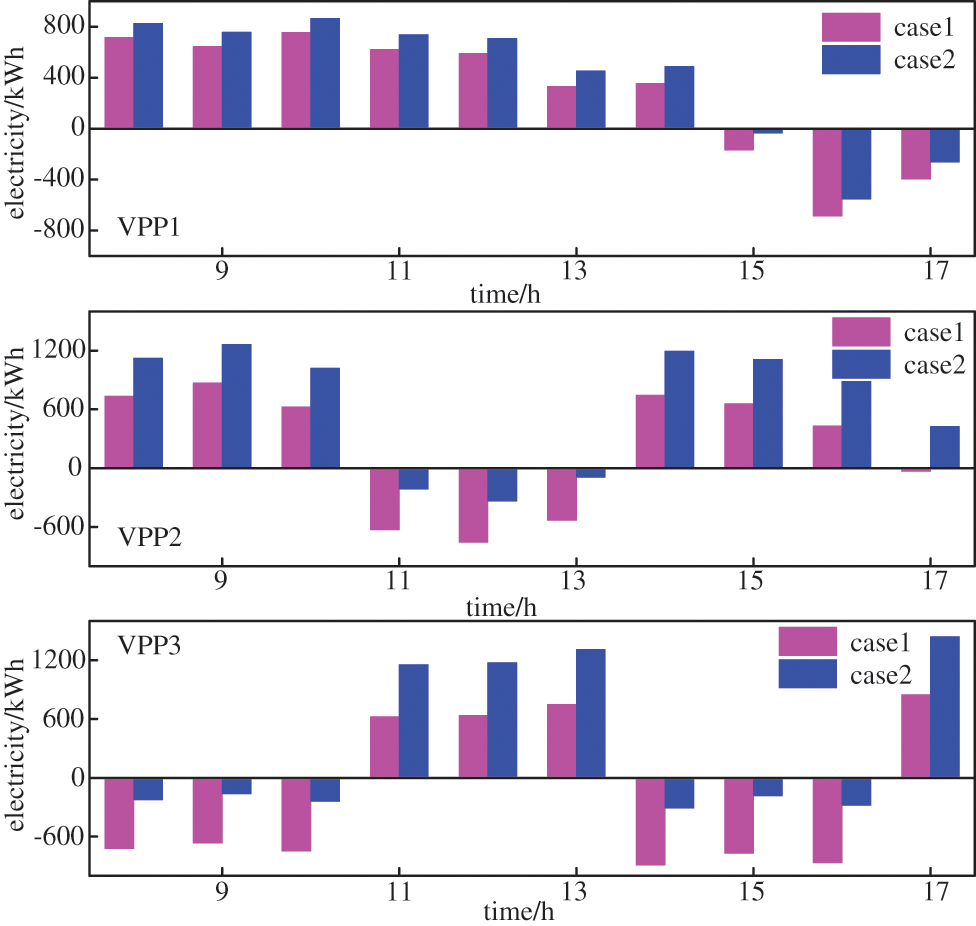
Figure 5: VPP trading requirements in different scenarios
Case 1: The central air conditioning system adopts the constant temperature control strategy without optimizing the air conditioning system;
Case 2: The flexible control strategy proposed in this paper is used to optimize the global central air conditioning load.
As can be seen in Fig. 5, compared with the central air conditioning system with constant temperature control, the flexible control strategy adopted in this paper can greatly improve the VPPs scheduling potential. The VPPs electricity purchase demand is generally reduced and electricity sales are increased. Therefore, VPP’s interaction cost with market operators as well as other VPPs will decrease. Taking t = 9:00 as an example, under the two strategies, the utility function value changes of seller VPP1 with the game strategy are shown in Figs. 6a and 6b, and the utility function value changes of market operators with the game strategy is shown in Figs. 7a and 7b. Therefore, the overall revenue of seller VPP1 in the Case 2 scenario is higher. It is mainly because under this paper’s flexible regulation strategy, the market power level of each VPP has improved and the power sale quantity of seller VPP has increased significantly. Hence, the overall income of seller VPPs also increases.
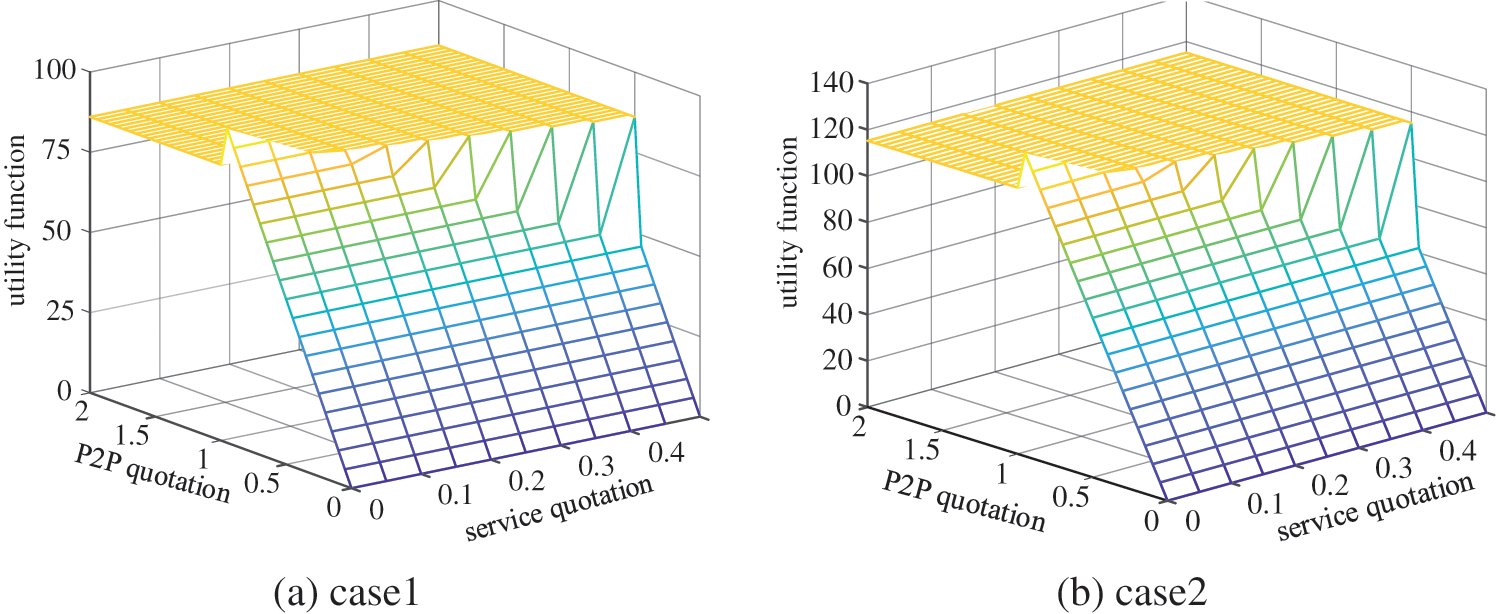
Figure 6: Utility function changes of VPP1 in different scenarios
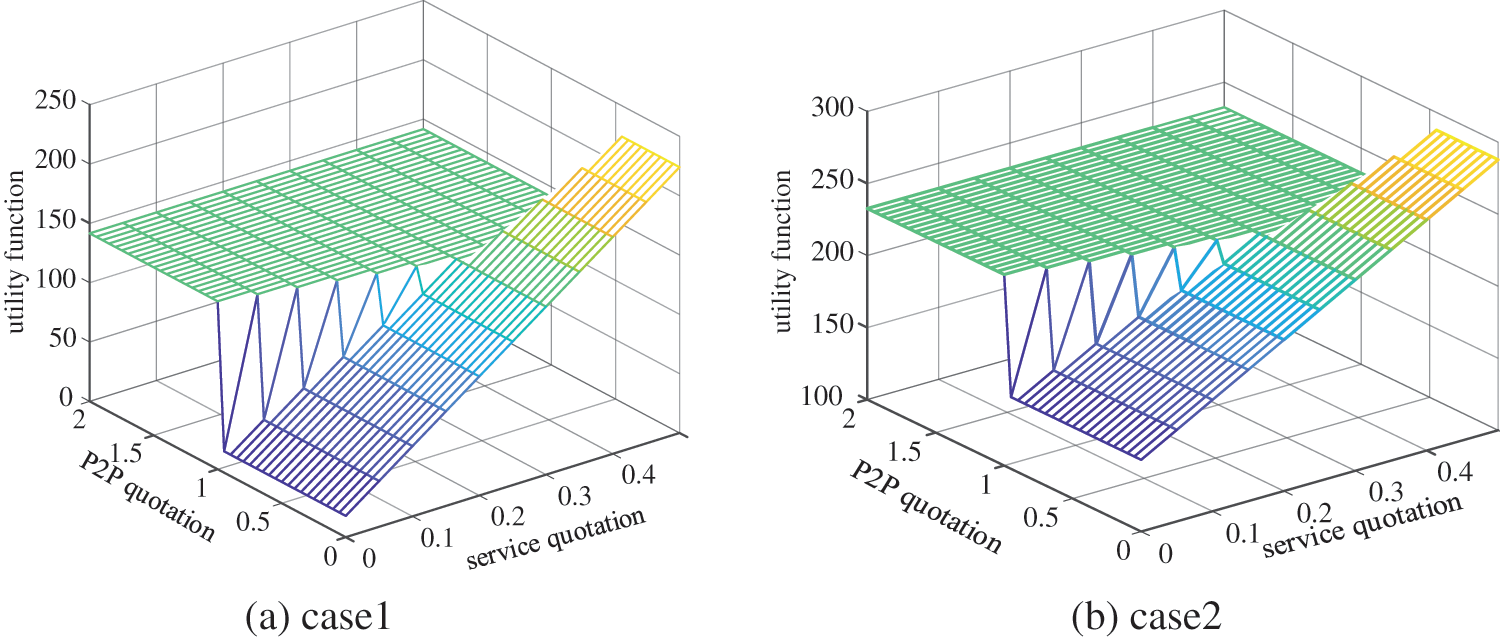
Figure 7: Utility function changes of market operators in different scenarios
Because of flexible regulation of public buildings, the market trading potential of each VPP has also improved and even the exchange of trading roles can be realized, which is demonstrated by the following power trading strategies between VPPs at 12:00, 14:00, and 16:00. The trading strategy is shown in Appendix Fig. D1. As can be seen, at 12:00, because of the large regulation potential of buildings at this time, the market power level of each VPP increases, and the P2P electricity trading quantity between VPPs greatly decreases. At 14:00, after optimization, the market power level of VPP1 greatly increases, buyer VPP changes to seller VPP, the P2P electricity trading quantity between VPP2 and VPP3 increases, and with the market role change, the P2P electricity trading between VPP1 and VPP2 is 0. At 16:00, the controllable potential of VPP1 and VPP2 aggregated buildings reduces whereas the controllable potential of VPP3 aggregated buildings is still large. Therefore, the P2P electricity trading quantity between VPP increases significantly, from 105 to 217.1 kW. As can be seen, it could improve the market competitiveness by accurately evaluating the VPPs market potential before trading, to adopting more active trading strategies in market trading.
(3) Game equilibrium and trading mode analysis
Because of the competitive relationship between seller VPPs and market operators, P2P trading between VPPs does not always occur as disturbed by various influencing factors. Taking the Case 2 scenario at t = 9:00 as an example, the game problem’s Nash equilibrium solutions change with the air conditioning load regulation cost and operator service quotation upper limit, as shown in Figs. 8 and 9.
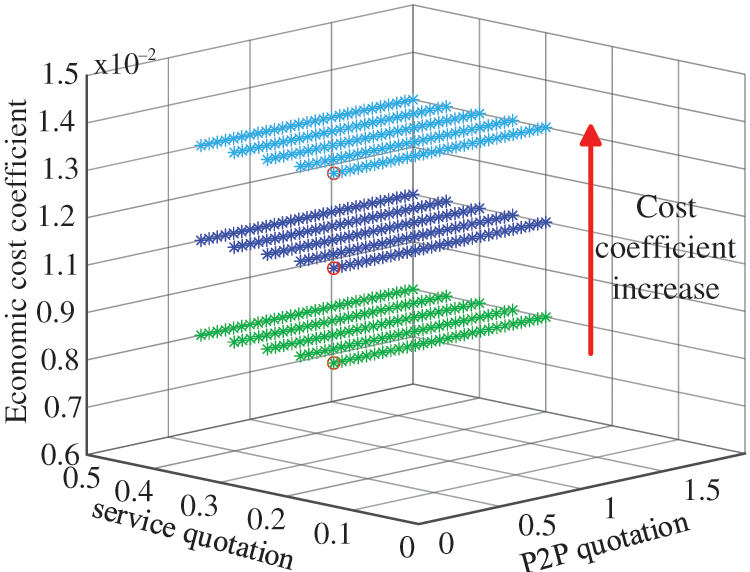
Figure 8: VPP market trading strategy in different scenarios
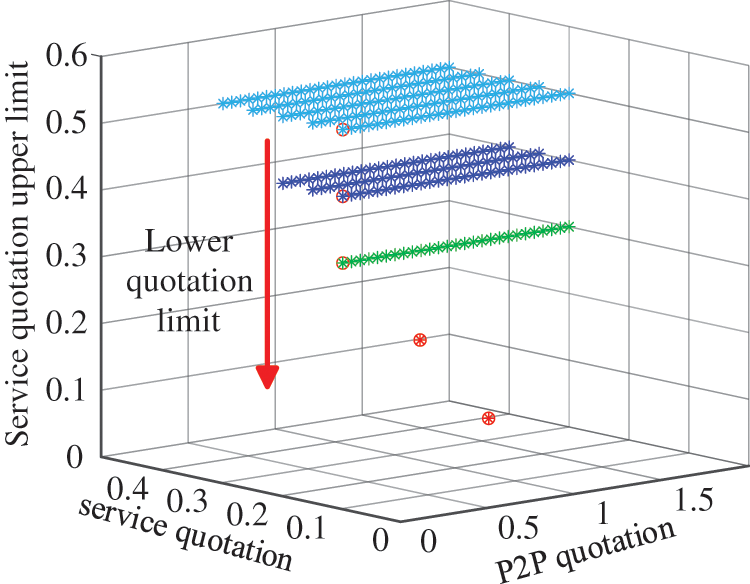
Figure 9: The Nash equilibrium solution when the service quote ceiling is lowered
First, when the air conditioning quantitative cost coefficient increases gradually, it has no impact on the VPPs trading behavior or Nash equilibrium point distribution, and only affects the benefit function of seller VPPs, as shown in Fig. 8. This is mainly because, in the game equilibrium point
Secondly, when the upper limit of market operator service price quotation decreases, it can be seen that the P2P trading behavior between VPPs changes significantly. With the decrease of service price quotation upper limit, when
This paper proposes a multi-VPP Peer-to-Peer energy source that considers the controllable potential of public buildings, aiming at the problems that the energy consumption characteristics of transaction entities cannot be fully considered in the current VPPs market-oriented transaction process, and the game relationship between transaction entities still needs to be further explored. The trading method, after analysis and research, came to the following conclusions:
(1) Considering the flexible control of public buildings in the VPPs’ P2P transaction process, it can significantly improve the market competitiveness of each VPP, promote it to adopt a more active transaction strategy in market transactions, and improve their overall income.
(2) The air conditioning load economic cost coefficient of VPPs and the electricity price in the wholesale market have no substantial impact on the VPP trading mode and Nash equilibrium solution distribution. But the upper limit of operator service quotation will have a relatively large effect on the VPP trading mode. When the service price gradually reduces, P2P trading between VPPs is more likely to occur.
This paper does not consider the network structure of the power system and the power flow of the system. Therefore, the large-scale air-conditioning load participating in the grid regulation model considering the safety and economy of the distribution network needs to be further researched in the future.
Funding Statement: This work was supported by the Technology Project of State Grid Jiangsu Electric Power Co., Ltd., China, under Grant 2021200.
Conflicts of Interest: The authors declare that they have no conflicts of interest to report regarding the present study.
References
1. Nosratabadi, S. M., Hooshmand, R. A., Gholipour, E. (2017). A comprehensive review on microgrid and virtual power plant concepts employed for distributed energy resources scheduling in power systems. Renewable & Sustainable Energy Reviews, 67, 341–363. DOI 10.1016/j.rser.2016.09.025. [Google Scholar] [CrossRef]
2. Naval, N., Yusta, J. M. (2021). Virtual power plant models and electricity markets–A review. Renewable & Sustainable Energy Reviews, 149(13), 1–13. DOI 10.1016/j.rser.2021.111393. [Google Scholar] [CrossRef]
3. Xu, S., Xue, Y., Chang, L. (2021). Review of power system support functions for inverter-based distributed energy resources-standards, control algorithms, and trends. IEEE Open Journal of Power Electronics, 2, 88–105. DOI 10.1109/OJPEL.2021.3056627. [Google Scholar] [CrossRef]
4. Zhou, Y., Wei, Z., Sun, G., Cheung, K. W., Zang, H. et al. (2019). Four-level robust model for a virtual power plant in energy and reserve markets. IET Generation, Transmission & Distribution, 13(11), 2036–2043. DOI 10.1049/iet-gtd.2018.5197. [Google Scholar] [CrossRef]
5. Diana, M. Z., John, G. R. (2017). Opportunities and challenges of mainstreaming distributed energy resources towards the transition to more efficient and resilient energy markets. Renewable and Sustainable Energy Reviews, 157(10), 112018. DOI 10.1016/j.rser.2021.112018. [Google Scholar] [CrossRef]
6. Gong, X. (2021). Energy security through a financial lens: Rethinking geopolitics, strategic investment, and governance in China’s global energy expansion. Energy Research & Social Science, 83, 102341. DOI 10.1016/j.erss.2021.102341. [Google Scholar] [CrossRef]
7. Dai, R., Esmaeilbeigi, R., Charkhgard, H. (2021). The utilization of shared energy storage in energy systems: A comprehensive review. IEEE Transactions on Smart Grid, 12(4), 3163–3174. DOI 10.1109/TSG.2021.3061619. [Google Scholar] [CrossRef]
8. An, L., Duan, J., Chow, M., Duel-Hallen, A. (2019). A distributed and resilient bargaining game for weather-predictive microgrid energy cooperation. IEEE Transactions on Industrial Informatics, 15(8), 4721–4730. DOI 10.1109/TII.2019.2907380. [Google Scholar] [CrossRef]
9. Han, L., Morstyn, T., McCulloch, M. (2021). Scaling up cooperative game theory-based energy management using prosumer clustering. IEEE Transactions on Smart Grid, 12(1), 289–300. DOI 10.1109/TSG.2020.3015088. [Google Scholar] [CrossRef]
10. Malik, S., Duffy, M., Thakur, S., Hayes, B., Breslin, J. (2022). A priority-based approach for Peer-to-Peer energy trading using cooperative game theory in local energy community. International Journal of Electrical Power & Energy Systems, 137(4), 107865. DOI 10.1016/j.ijepes.2021.107865. [Google Scholar] [CrossRef]
11. Vespermann, N., Hamacher, T., Kazempour, J. (2021). Access economy for storage in energy communities. IEEE Transactions on Power Systems, 36(3), 2234–2250. DOI 10.1109/TPWRS.2020.3033999. [Google Scholar] [CrossRef]
12. Chen, L., Liu, N., Li, C., Wang, J. (2021). Peer-to-Peer energy sharing with social attributes: A stochastic leader-follower game approach. IEEE Transactions on Industrial Informatics, 17(4), 2545–2556. DOI 10.1109/TII.2020.2999328. [Google Scholar] [CrossRef]
13. Liu, N., Yu, X., Wang, C., Wang, J. (2017). Energy sharing management for microgrids with PV prosumers: A stackelberg game approach. IEEE Transactions on Industrial Informatics, 13(3), 1088–1098. DOI 10.1109/TII.2017.2654302. [Google Scholar] [CrossRef]
14. Cui, S., Wang, Y., Shi, Y., Xiao, J. (2020). A new and fair peer-to-peer energy sharing framework for energy buildings. IEEE Transactions on Smart Grid, 11(5), 3817–3826. DOI 10.1109/TSG.2020.2986337. [Google Scholar] [CrossRef]
15. Paudel, A., Chaudhari, K., Long, C., Gooi, H. B. (2019). Peer-to-Peer energy trading in a prosumer-based community microgrid: A game-theoretic model. IEEE Transactions on Industrial Electronics, 66(8), 6087–6097. DOI 10.1109/TIE.2018.2874578. [Google Scholar] [CrossRef]
16. Sun, G., Qian, W., Huang, W., Wei, Z., Zang, H. et al. (2019). Optimal dispatch game model for virtual power plant considering security of distribution network. Electric Power Automation Equipment, 39(5), 7–14. DOI 10.16081/j.issn.1006-6047.2019.05.002. [Google Scholar] [CrossRef]
17. Ge, S., Li, J., Liu, H., He, X., Shen, K. (2021). Peer-to-Peer energy trading method for multiple microgrids considering characteristics of smart building. Automation of Electric Power Systems, 45(6), 203–214. DOI 10.7500/AEPS20200330004. [Google Scholar] [CrossRef]
18. Luthander, R., Widen, J., Nilsson, D., Palm, J. (2015). Photovoltaic self-consumption in buildings: A review. Applied Energy, 142(10), 80–94. DOI 10.1016/j.apenergy.2014.12.028. [Google Scholar] [CrossRef]
19. Moradi, J., Shahinzadeh, H., Khandan, A., Moazzami, A. (2017). A profitability investigation into the collaborative operation of wind and underwater compressed air energy storage units in the spot market. Energy, 141(3), 1779–1794. DOI 10.1016/j.energy.2017.11.088. [Google Scholar] [CrossRef]
20. Adhikari, R., Pipattanasomporn, M., Rahman, S. (2020). Heuristic algorithms for aggregated HVAC control via smart thermostats for regulation service. IEEE Transactions on Smart Grid, 11(3), 2023–2032. DOI 10.1109/TSG.2019.2946170. [Google Scholar] [CrossRef]
21. Ranzi, G., Kong, W., Dong, Y., Wang, F. (2018). Coordinated residential energy resource scheduling with vehicle-to-home and high photovoltaic penetrations. IET Renewable Power Generation, 148(6), 1–15. DOI 10.1049/iet-rpg.2017.0485. [Google Scholar] [CrossRef]
22. Wang, H., Hu, S. (2009). Analysis on the applicability of PMV thermal comfort model. Building Science, 25(6). DOI 10.13614/j.cnki.11-1962/tu.2009.06.013. [Google Scholar] [CrossRef]
23. Feng, W., Wei, Z., Sun, G., Zhou, Y., Zang, H. et al. (2020). A conditional value-at-risk-based dispatch approach for the energy management of smart buildings with HVAC systems. Electric Power Systems Research, 188, 106535. DOI 10.1016/j.epsr.2020.106535. [Google Scholar] [CrossRef]
24. Sun, G., Qian, W., Huang, W., Xu, Z., Wei, Z. et al. (2019). Stochastic adaptive robust dispatch for virtual power plants using the binding scenario identification approach. Energies, 12(10), 1918. DOI 10.3390/en12101918. [Google Scholar] [CrossRef]
25. Yao, Y., Chen, J. (2010). Global optimization of a central air-conditioning system using decomposition-coordination method. Energy and Buildings, 42(5), 570–583. DOI 10.1016/j.enbuild.2009.10.027. [Google Scholar] [CrossRef]
Appendix A
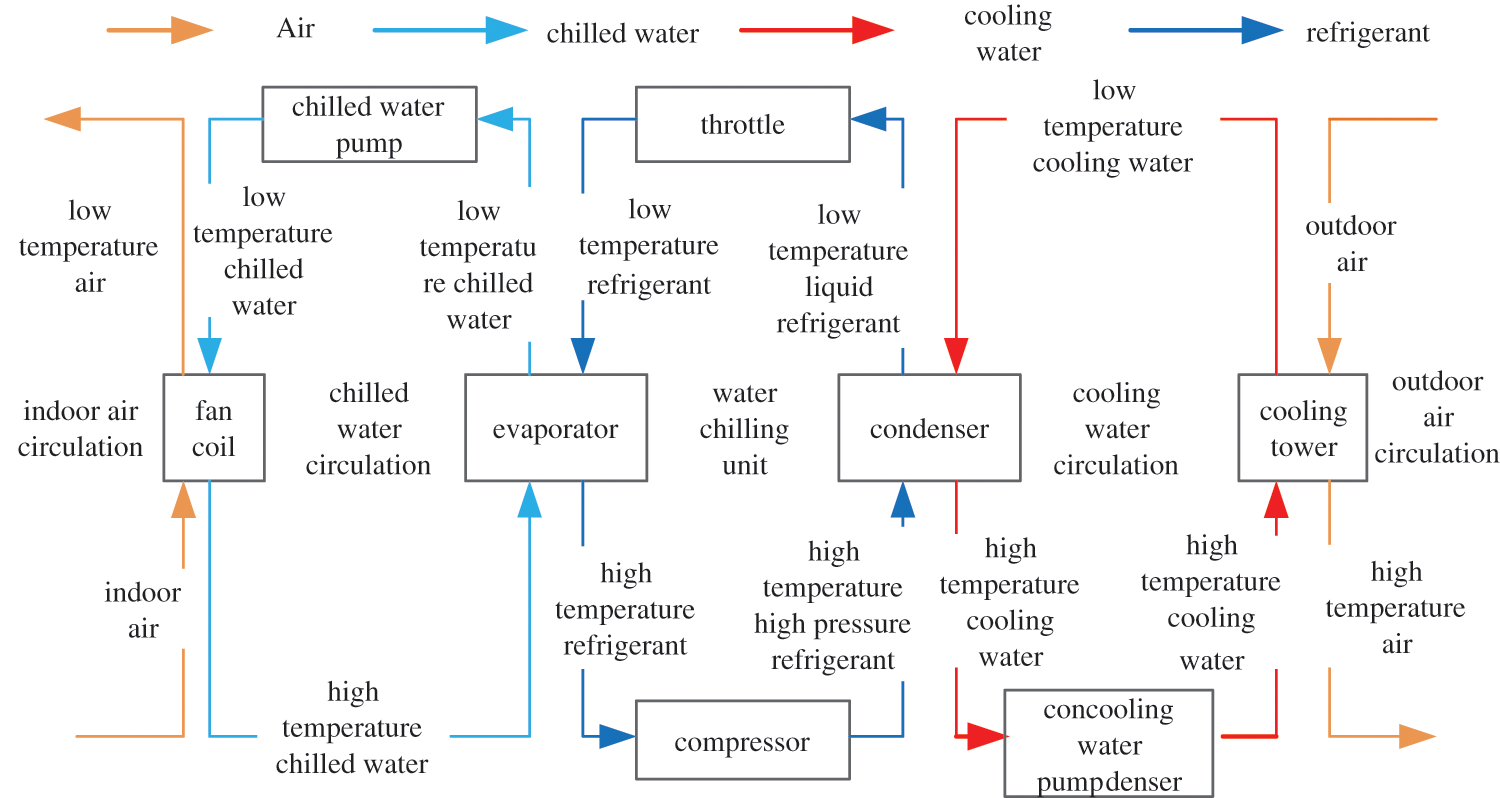
Figure A1: Schematic diagram of the central air-conditioning circulation system
Appendix B
(1) The market operator raises the service quotation
First, assuming the market operator raises the service quotation at the game equilibrium point M0 moment, there is
Through the power balance of all seller/seller VPP, the following is obtained:
Substitute Eq. (B2) into Eq. (B1) to further simplify:
Because
(2) Any seller VPP reduces its P2P quotation
Further, assuming any seller VPP suddenly reduces its P2P trading quotation and deducts the utility function, there is:
Through the VPP power balance, the following is obtained:
Substitute Eq. (B5) into Eq. (B4), extract similar terms and simplify, the following is acquired:
Because
To make
The other two game equilibrium point offset scenarios, such as any seller VPP raising its P2P quotation or market operator reducing its service quotation, still meet the game equilibrium point conditions, specifically proved as follows.
(3) Any seller VPP raises its P2P quotation
When any seller VPP raises its P2P trading quotation,
Therefore, the electricity purchase cost of any buyer VPP from seller VPPl is also higher than that from direct trading with operators. No VPP will choose to trade with seller VPP, that is
Then, there is
(4) The market operator lowers its service quotation
When the market operator lowers its service quotation,
Referring to the simplification process of Eqs. (B4)–(B7), there is:
Therefore,
To sum up, the above four-game strategy offset scenarios will not increase the corresponding utility function value of the game party. Combined with the definition of pure strategy Nash equilibrium, it can be proved that
Appendix C
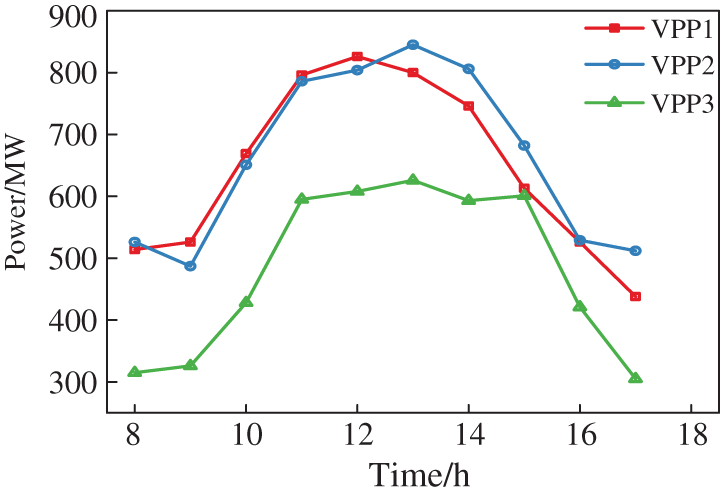
Figure C1: Photovoltaic output of each VPP
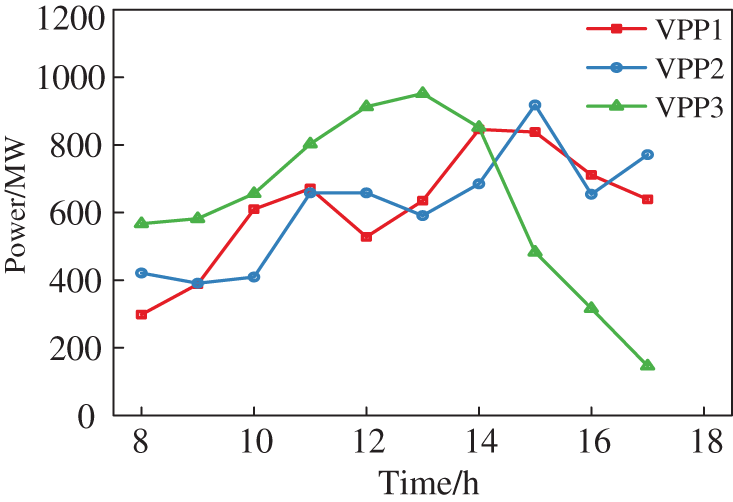
Figure C2: Predicted value of each VPP load
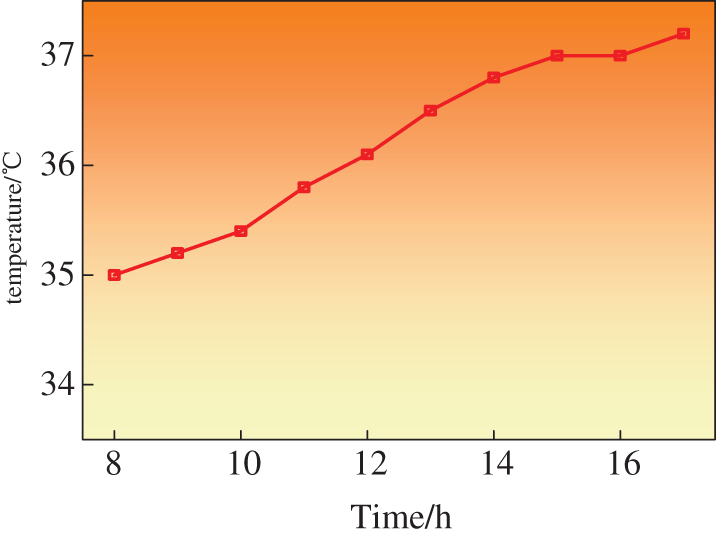
Figure C3: Outdoor temperature curve
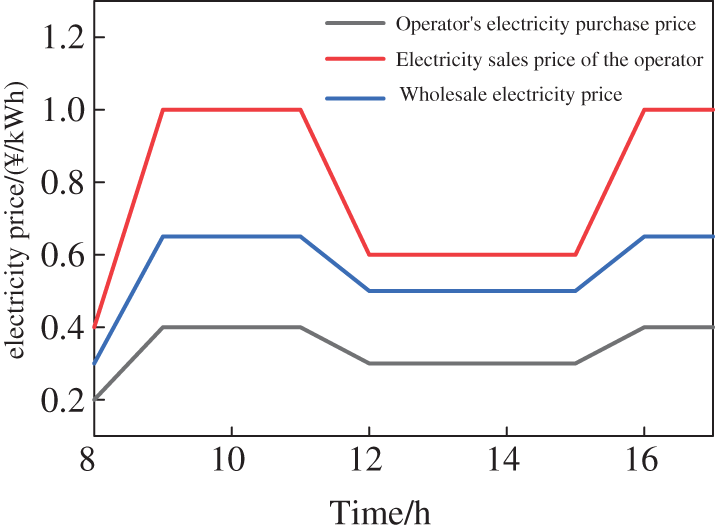
Figure C4: Market trading electricity price
Appendix D
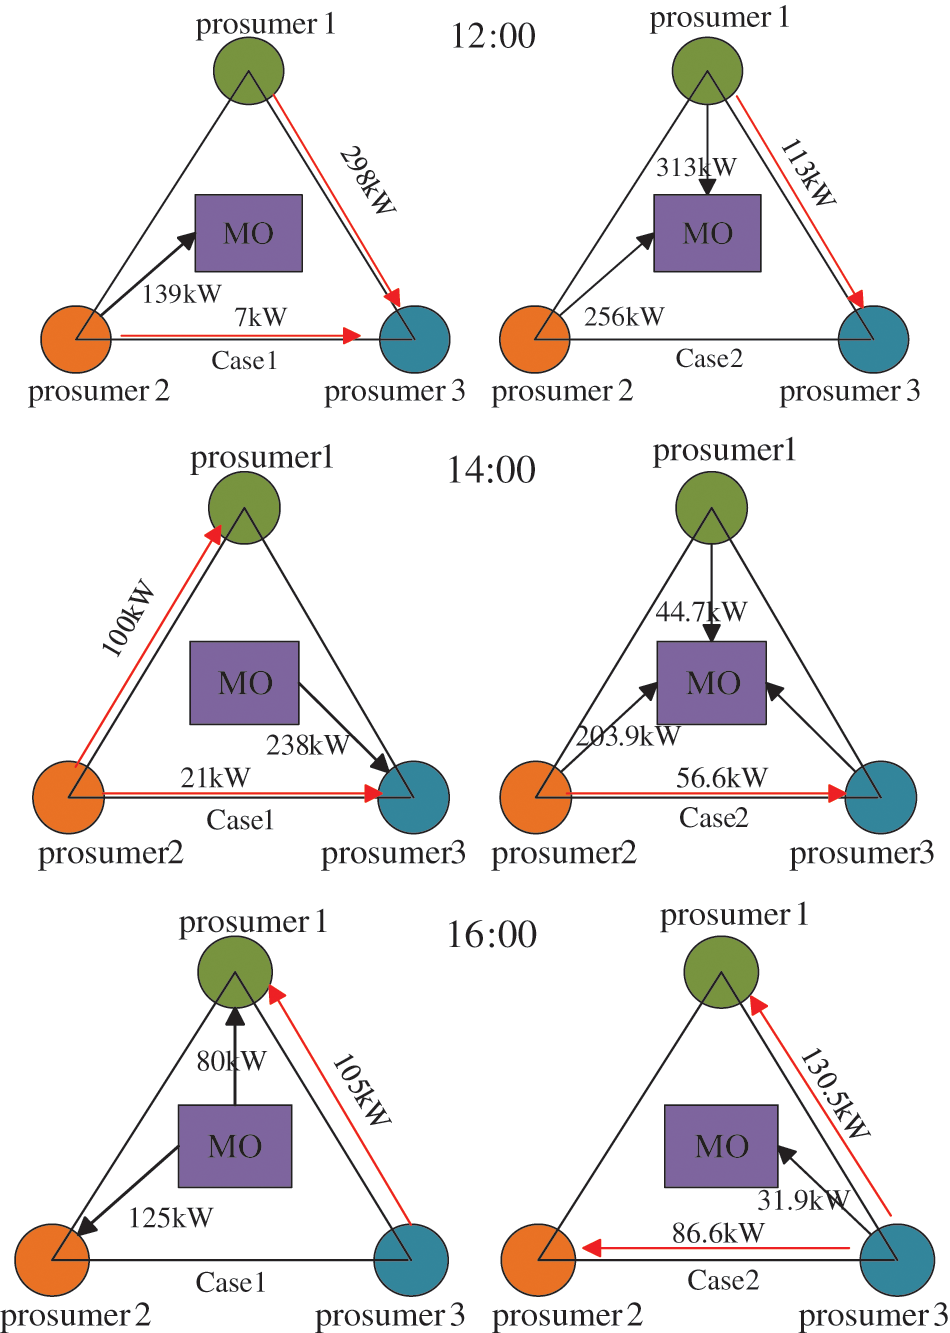
Figure D1: VPP market trading strategy in different scenarios
Cite This Article
 Copyright © 2023 The Author(s). Published by Tech Science Press.
This work is licensed under a Creative Commons Attribution 4.0 International License , which permits unrestricted use, distribution, and reproduction in any medium, provided the original work is properly cited.
 Downloads
 Citation Tools