
 Submit a Paper
 Propose a Special lssue
 Open Access
ARTICLE

A Data Driven Security Correction Method for Power Systems with UPFC
Electric Power Research Institute of State Grid Jiangsu Electric Power Co., Ltd., Nanjing, 211103, China
* Corresponding Author: Ningyu Zhang. Email:
Energy Engineering 2023, 120(6), 1485-1502. https://doi.org/10.32604/ee.2023.022856
Received 29 March 2022; Accepted 07 November 2022; Issue published 03 April 2023
 View Full Text
 Download PDF
Abstract
The access of unified power flow controllers (UPFC) has changed the structure and operation mode of power grids all across the world, and it has brought severe challenges to the traditional real-time calculation of security correction based on traditional models. Considering the limitation of computational efficiency regarding complex, physical models, a data-driven power system security correction method with UPFC is, in this paper, proposed. Based on the complex mapping relationship between the operation state data and the security correction strategy, a two-stage deep neural network (DNN) learning framework is proposed, which divides the offline training task of security correction into two stages: in the first stage, the stacked auto-encoder (SAE) classification model is established, and the node correction state (0/1) output based on the fault information; in the second stage, the DNN learning model is established, and the correction amount of each action node is obtained based on the action nodes output in the previous stage. In this paper, the UPFC demonstration project of Nanjing West Ring Network is taken as a case study to validate the proposed method. The results show that the proposed method can fully meet the real-time security correction time requirements of power grids, and avoid the inherent defects of the traditional model method without an iterative solution and can also provide reasonable security correction strategies for N-1 and N-2 faults.Keywords
The safe operation of power system has always been the focus of power system engineers, for obvious reasons. Accordingly, the security correction control of power system has become one of the important means of ensuring the safe and stable operation of a power system [1–4]. In recent years, with the development and application of the unified power flow controller (UPFC), the system flexibility and safety have been greatly improved [5–6] whereas increase in the operation mode complexity have also brought about challenges to the safety control of power grids.
Specific to the line overload condition after a system fault, the security correction control can improve power flow and eliminate line overload by adjusting the generator output and load shedding accordingly and appropriately. Among them, similar to the flexible AC transmission device [7] that has also been put into operation and has the most comprehensive functions and effects, UPFC can quickly adjust the power flow during security correction, so as to eliminate the line overload and balance the power flow [8–10]. Because of the current sensitivity method [11,12] with the relatively high computational efficiency which ignores the effect of reactive power, the obtained system correction adjustment scheme with UPFC may cause a secondary overload of the bus voltage when eliminating line overload and hence, bring new safety risks to the system, which is are, to be sure, not practically useful. Therefore, the current security correction problem of system with UPFC still needs to adopt the model-based optimization method [13–15], that is, to use the mathematical analysis method to solve the optimization model and obtain corresponding adjustment measures. It has been established in [16] that a security correction model with the minimum adjustment amount and uses the distributed robust optimization method to handle the power system security correction control problem with the uncertainty of wind power output; It has also been revealed in [17] that an optimization model considering the series compensator with the minimum load removal as the objective function. But when applied to the actual large power grid, the increase of optimization variables will significantly decrease the optimization efficiency. To that effect, Zhao et al. [18] proposed a security correction strategy with the least economic cost; A more comprehensive multi-objective optimization model with minimum adjustment cost, minimum social impact and minimum load removal to minimize the economic loss caused by fault was established in [19]. But in actual engineering, decision-makers tend to consider system security quite deeply, and seek to eliminate any system overload at the fastest speed, so as not to cause a chain reaction and endanger the safe operation of the greater system. To this end, Zhu et al. [20] proposed a security correction model for system with UPFC with the minimum adjusting equipment and minimum equipment correction, but some branches fail to optimize the overload due to the complex model solution, which is still not applicable to any fault condition. In summary, the traditional model-based security correction method cannot meet the actual engineering requirements, because: (1) for different line overload conditions, the calculation fluctuation is large with poor timeliness; (2) for some line overload conditions there may be no solution with inherent defects; (3) to ensure the system safety, there are many load shedding actions with poor economic repercussions. Therefore, when considering UPFC integrated systems, it is urgent to develop a security correction method with stable calculations and few if any potential safety hazards, to maximize the power flow regulation capability of UPFC.
Recently, data-driven artificial intelligence methods [21–23] have provided new ideas for solving complex grid problems due to their powerful exploratory learning capabilities. For instance, Liu et al. [24] proposed a data-driven way of thinking about power grid operation, and that literature further analyzes the trend and multitude of challenges in the realm of data-driven, power grid development. In case of [25], a deep learning to security correction was proposed together with a data-model hybrid-driven security correction calculation method; that is to say, a DNN identification model is established to judge the node correction status, and then the model method is used to optimize and calculate the correction amount. The correction efficiency is improved to a certain degree, but a large number of label samples are needed to train the model, and the iterative calculation based up on the model still poses a safety hazard for security correction; furthermore, the calculation time varies significantly with the differences of system scales.
Based on the above considerations, this paper proposes a data-driven security correction method, which can effectively get rid of the dependence upon the current security correction calculations on the model, and solve the difficult problems of extracting features and the excessively long computing time. The security correction method proposed in this paper divides the offline training task into two stages: the SAE binary classification model; which is used to determine the correction state of the system and train the network with the power flow data at the fault time and each node action state in the security correction results, aiming to quickly select the device nodes participating in the action and determine the action node-set. And in the second stage, the DNN learning model of the computing system security correction strategy is established based on the adjustment set. The training is completed by combining each action device classification information and the corresponding correction amount data in the first stage, and the system security correction results are quickly obtained. During the online application, the corresponding security correction strategy is obtained by inputting the system fault information into the established fast security correction model. The Nanjing West ring network UPFC demonstration Project was used as a case study. And the results obtained reveal that the proposed method in this paper greatly improves the security correction computational efficiency, which can effectively solve problems beyond existing methods and can even provide a better correction strategy as well.
In practical engineering, the series and parallel sides of UPFC may be connected to different buses. Therefore, we propose a new topology of UPFC, whose structure is shown in Fig. 1. The new UPFC is connected to the line by equivalent power injection. And its equivalent circuit is shown in Fig. 2.
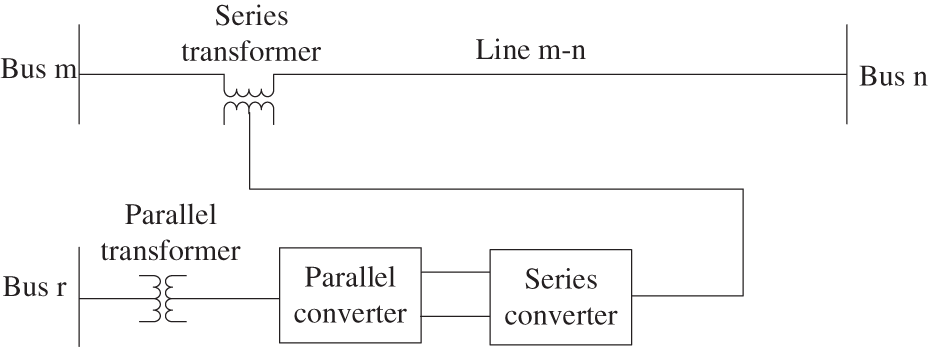
Figure 1: Structure of new UPFC
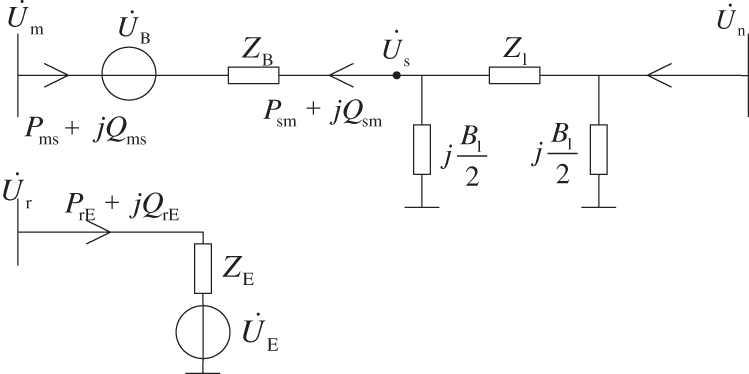
Figure 2: Equivalent circuit diagram of new UPFC
It can be seen from Fig. 2 that the equivalent voltage source voltage at the series and parallel sides of UPFC is
The equivalent power of UPFC is often injected into the model. This model is shown in Fig. 3, which can equate the role of UPFC as the nodal injection power at both ends. The derivation of equivalent injection power is shown in Appendix A.
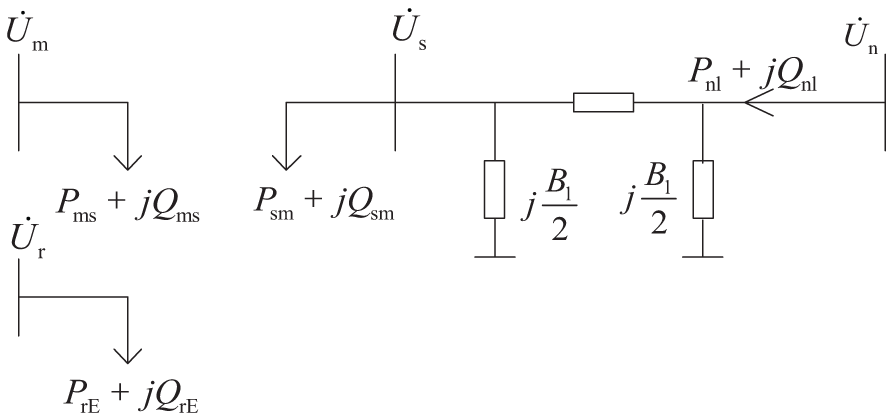
Figure 3: Equivalent power injection model of UPFC
Wherein, the node-terminal voltages of the branch series side where the UPFC is located are
2.2 System Security Correction Model with UPFC
(1) Objective function
The appeal of the power system security correction problem is to calculate the correction amount of the required action nodes based on the determined minimum number of action nodes. Therefore, the security correction physical model is a mixed integer nonlinear programming (MINLP) model with its objective function expressed as:
In Eq. (1),
(2) Constraint conditions
where, “*” represents conjugate;
In Eq. (4) through Eq. (6),
2.3 A Two-Stage Deep Learning Framework
2.3.1 Data-Driven Security Correction Model
The security correction constructed by Eq. (1) through Eq. (6) of a system with UPFC contain the physical information of the power system, including the grid structure topology, branch parameters and corresponding physical laws, etc. However, due to the model’s nonlinearity and non-convexity, the security correction calculation requires multiple iterations, which is all very time-consuming for large-scale systems, and can also cause iteration failures to some branches as the system scale expands. From the data-driven perspective, the security correction computational process can be regarded as a nonlinear projection: the system power flow information at the failure time is used as the input, and the security correction results, such as generator output adjustment and load reduction, are used as the output. The mapping relationship between input and output can be learned offline through historical data or simulated data.
Training deep learning model requires a large number of sample sets. To simulate the calculation of the safety correction strategy under the most out of limit conditions of the system and build a sample set that can reflect the relevant characteristics of the input and output data, this paper randomly adjusts the load on different power flow sections of the Test Bed, sets N-1, N-2 and other fault conditions causing the system to be overloaded. Record the effective out of limit data of each branch (the out of limit meets 1%–30% of the line’s own stability limit) and the power flow data at the time of fault as the input of the deep learning model. Use the method based on physical model described in Chapter 2.2 to optimize and solve various line out of limit conditions, and obtain the correction status and correction amount of each node under corresponding fault as the output of the deep learning model.
Because of the complex mapping relationship between system fault data and security correction strategy data, it is difficult to directly learn the input and output. To relieve the learning pressure of the node correction amount prediction model and improve the learning accuracy, this paper establishes a data-driven fast security correction model, divides the offline training task of security correction into two stages, and designs a two-level input and output layer to separate learning objectives to improve the learning ability of deep learning models at various stages. The model framework is shown in Fig. 4.
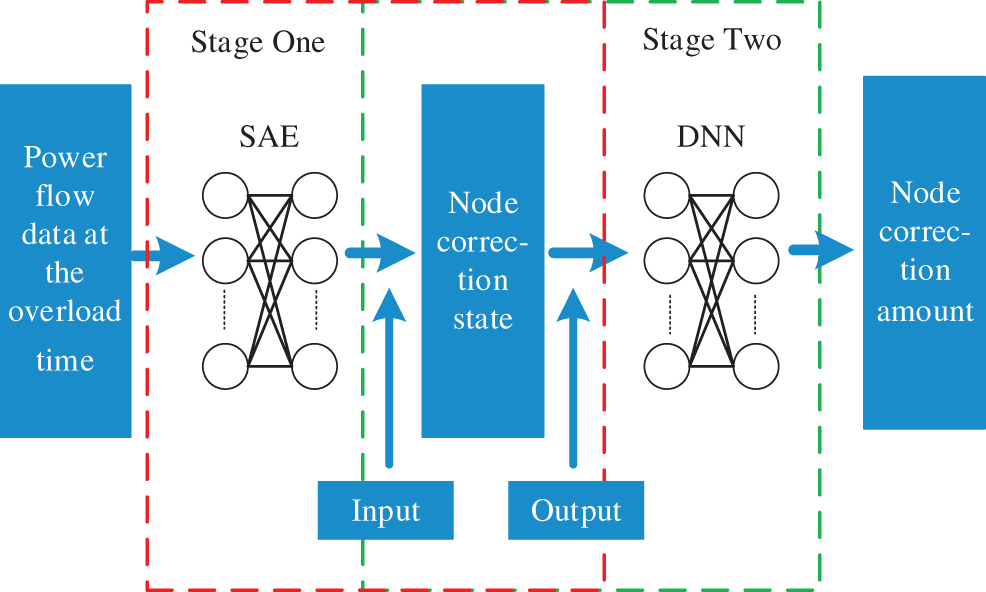
Figure 4: The two-stage deep learning framework
2.3.2 Node Correction State by SAE
The classification model judges the node adjustment status based on deep learning (the output result of the model is “0” for the node not participating in the adjustment, and “1” for the node participating in the adjustment). The power flow information at system overload time is taken as input data X, and the adjustment state of each device at the security correction is used as output data Y to train the classification model based on SAE.
Autoencoder (AE) is an unsupervised learning neural network. Its input and output are unlabeled samples [26] and its purpose is to complete the feature extraction of data. Its structure is divided into an encoder and a decoder. The encoder converts the high-dimensional input sample X into the low-dimensional hidden layer expression H to realize the sample dimensionality reduction. The decoder converts the hidden layer expression into the original samples
The nodes of AE are fully connected, and its encoding and decoding processes are shown in.
where: W and
AE minimizes the loss function by adjusting the network parameters to obtain the optimal abstract representation of input features. In AE, the loss function usually takes the squared error function. For input samples and reconstructed output samples, the squared error loss function is expressed as formula(9):
Multiple AEs are cascaded to build stacked autoencoders (SAE). Greedy layer training is used to take the hidden layer output of the upper level as the input of the next level AE for the hierarchical feature extraction.
SAE is a deep learning algorithm with strong feature extraction capabilities. As shown in Fig. 5, when used for classification or regression problems, the decoder is generally discarded, and the features output by the last-layer encoder are used for classification or regression calculation.
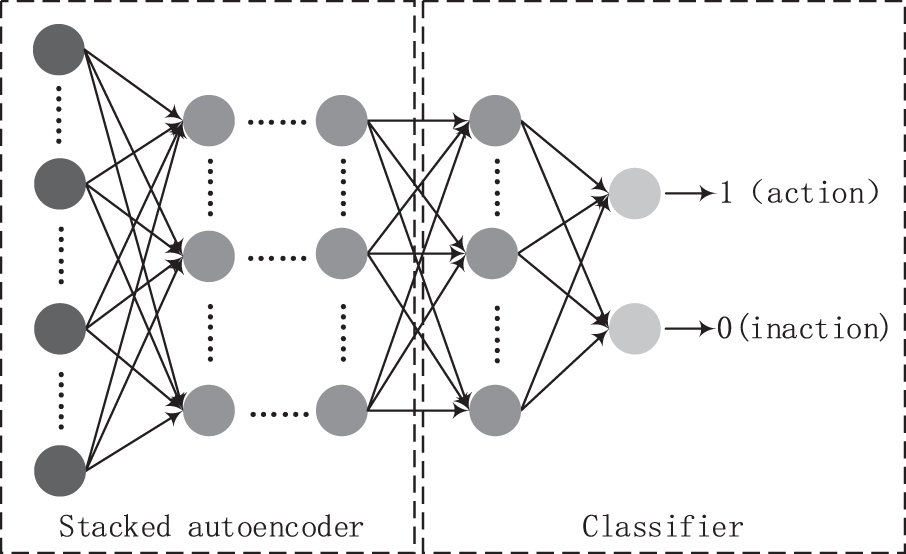
Figure 5: Structure of stacked autoencoder
The node correction state is judged based on the classification ability of the classification model based on SAE and the node without an action state is selected and excluded to determine the action node-set. The power flow information at system overload time is taken as input data, and the adjustment state of each device at the security correction is used as output data to train the classification model based on SAE offline.
2.3.3 Node Correction Amount by DNN
In this paper, DNN regression models are established for each node, that is, the DNN model calculates the correction amount of its corresponding node.
Deep learning (DL) is a new technology in machine learning (ML) algorithm research [27,28]. It aims to establish a deep neural network that simulates the human brain for analysis and learning and extracts effective information from the massive training samples through the network model. DL adopts a feedforward neural network composed of a large number of neurons. Its structure includes an input layer, a hidden layer and an output layer. DL training updates internal parameters and activates functions based on forward propagation and back propagation (BP) [29,30] to explore the complex structure and mapping relationship in the big data set. In the forward propagation stage of the hidden layer, the output of the previous layer is the input of the latter layer, and the computational process is expressed as follows:
where,
Based on the reduced action node-set in the previous stage, the DNN regression model is trained offline with the output results of the first stage SAE binary model, the node power flow information as input data X, while the correction amount of each device at the security correction time is used as the output data Y. Specific to nodes requiring action, the learning ability of the DNN model is used to determine the correction amount. The two-stage deep learning model not only reduces the learning complexity, but also helps to improve learning biases and enhances the DNN regression model computational efficiency and accuracy.
3.1 Algorithm for the Realization of the Two-Stage DL Model
Similar to other machine learning algorithms, this method also includes offline training and online application. The two-stage deep learning model was trained and saved offline. The online application is data-driven. Once there is line overload in the system, the data-driven model receives the fault information for calculation and provides a security correction strategy. The specific process of this method is shown in Fig. 6.
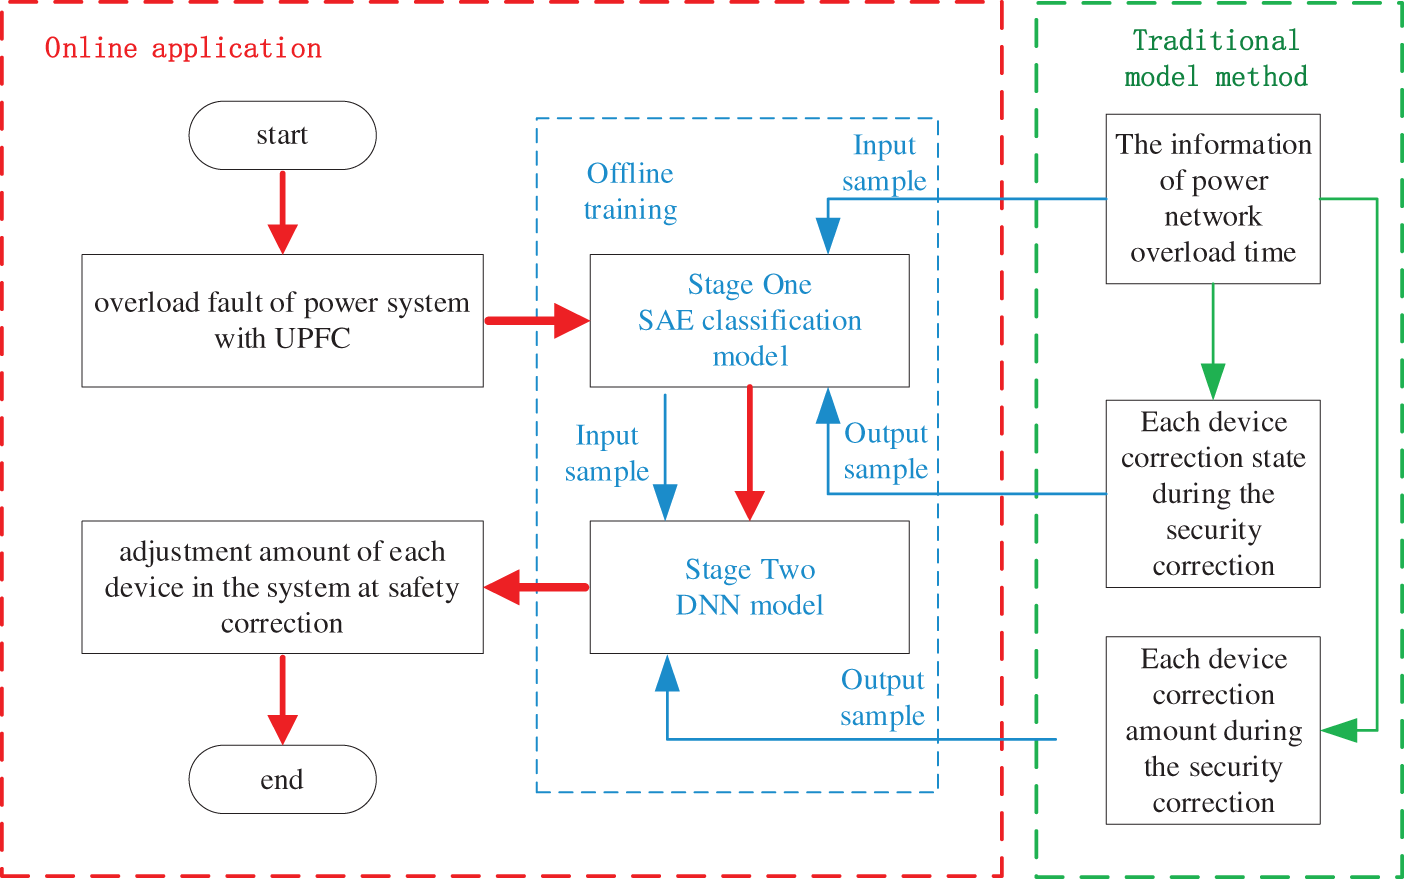
Figure 6: Flow chart of the proposed method
In this section of the paper, the Nanjing 220 kV West Ring Network UPFC Demonstration Project is taken as a Test Bed. To facilitate the analysis, this paper selects the 95 nodes equivalent system of Nanjing West Ring Network UPFC Demonstration Project for the analysis. The Nanjing West Ring Network is mainly powered by two 500 kV substations from the north and south ends, and the power plant units in the area are 1300 MW in total. The system consists of 15 generator nodes, 151 branches (including double circuits), 29 transformers and 11 groups of reactive power compensation devices. The series side of UPFC is connected to the 220 kV Xiaozhuang-Tiebei double circuit, and the parallel side is connected to the 35 kV side of Yanziji substation. The capacity of the three inverters is 60 MVA. The upper and lower limits of
The SAE and DNN models are programmed by Python and built by Keras module using a PC with an Inter Core i5-3470 3.20 GHz CPU processor and 8 GB memory.
To verify the outstanding power flow control ability of UPFC in the system, check the correctness and effectiveness of the proposed data-driven safety correction method, and test its application performance, the proposed method is compared with the current three safety correction methods. Each method is coded as follows:
Method 1: Model-based security correction optimization method of power system without UPFC;
Method 2: Model-based security correction optimization method of power system with UPFC;
Method 3: Fast security correction method of power system with UPFC based on data-model hybrid-driven [25] (the data driven model determines the node adjustment range, and the model driven conducts correction amount optimization calculation based on the range);
Method 4: Method proposed in this paper.
4 Simulation Results and Discussions
4.1 Computational Efficiency Analysis
Since the system overload failure is inevitable, it is of great practical significance to quickly eliminate the overload in the system and maintain stable operations. The percentage of the overload amount
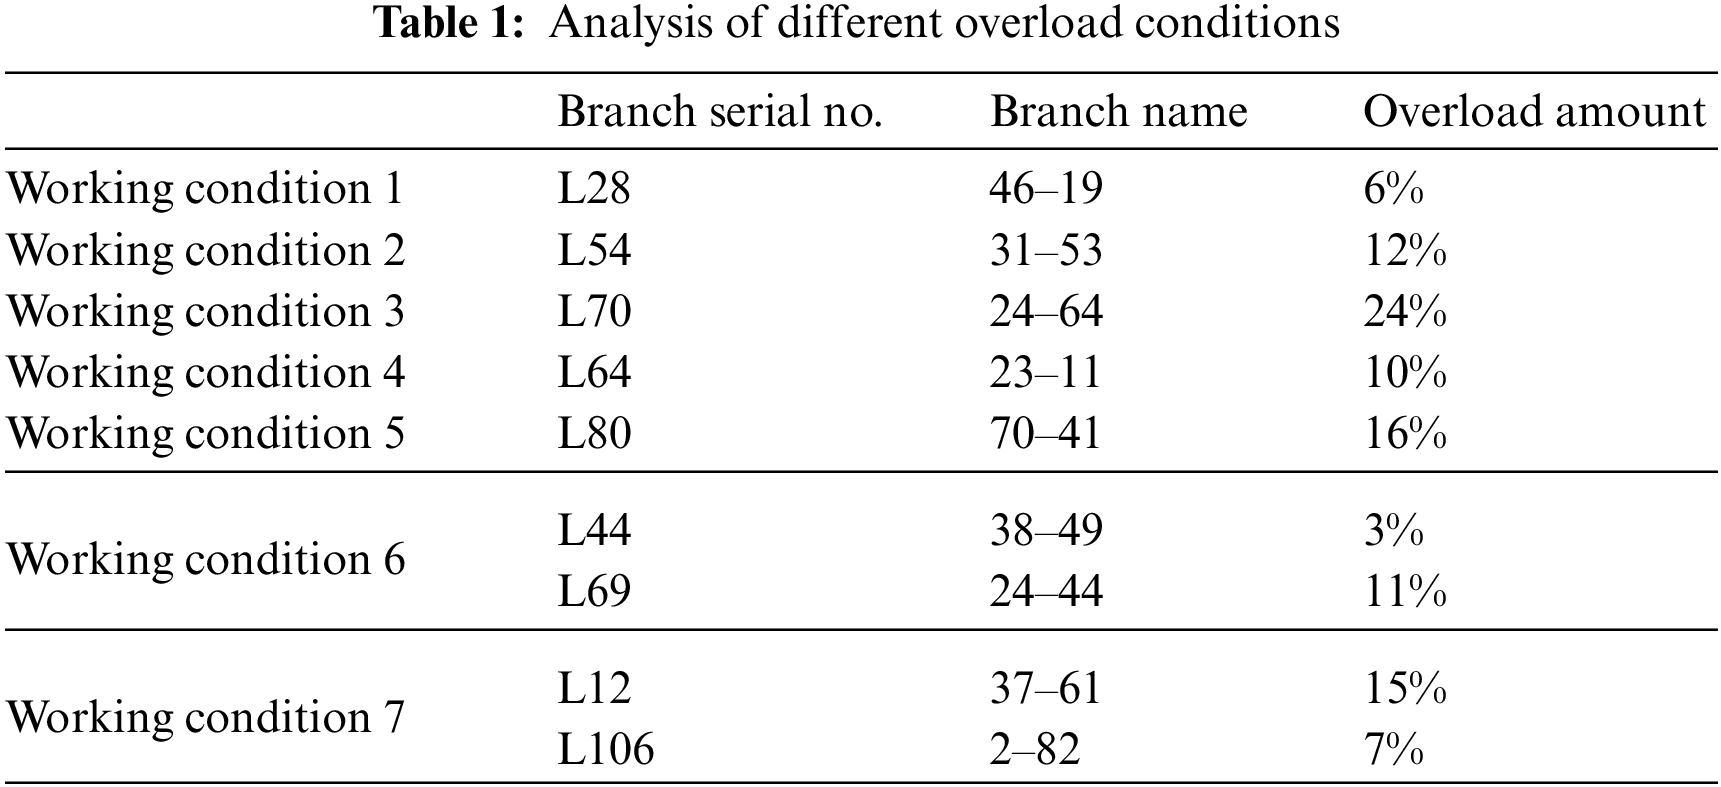
The practicability of the fast security correction strategy proposed in this paper is analyzed in the following different conditions.
In Table 1, working conditions 1–5 are the situations when an overload occurs to a single branch; working conditions 6 and 7 are the situations when an overload of varying degrees occurs to multiple branches. Wherein, when an overload occurs to the branch where working conditions 4 and 5 are located, the traditional model-based optimization calculation method cannot work out the correction result.
In this paper, a data-driven fast security correction model is constructed to solve the problem that current model-based security correction methods have; they have high computational complexity and also easily come across unsolvable problems. Fig. 6 shows the calculation time of different security correction calculation methods under various working conditions.
As can be seen from Fig. 7, the calculation time of the model-based security correction method is relatively long, and increases significantly with the increase of the branch overload degree; comparing the calculation efficiency of M1 and M2 under different working conditions, the stronger control ability of UPFC can improve the system security correction efficiency to a certain extent, but the effect is not very obvious. By introducing the DNN model, the calculation time of M3 is greatly reduced compared with traditional model-based methods. Since its device correction amount calculation still depends on the optimization model, the calculation time still fluctuates under different working conditions. In contrast, the test results of our method show that the M4 curve in Fig. 6 is relatively stable. The difference of fault conditions and even the increase of the system scale mainly affect the network offline training time, and have little effect on the online computing times, which, in its entirety, reflects an advantage in the correction efficiency of the method in this paper. In addition, comparing the results of working conditions 4 and 5, it can be seen that although the traditional model-based method fails to solve them, the deep learning models in M3 and M4 can quickly judge the correction amount of a node under a no-solution working condition through their learning ability. Decision makers can quickly formulate a correction strategy based on this result to make up for the defect of the model no solution; meanwhile, the calculation time of M4 is 5–6 times higher than that of M3, and its computational efficiency is significantly improved compared with current security correction methods.
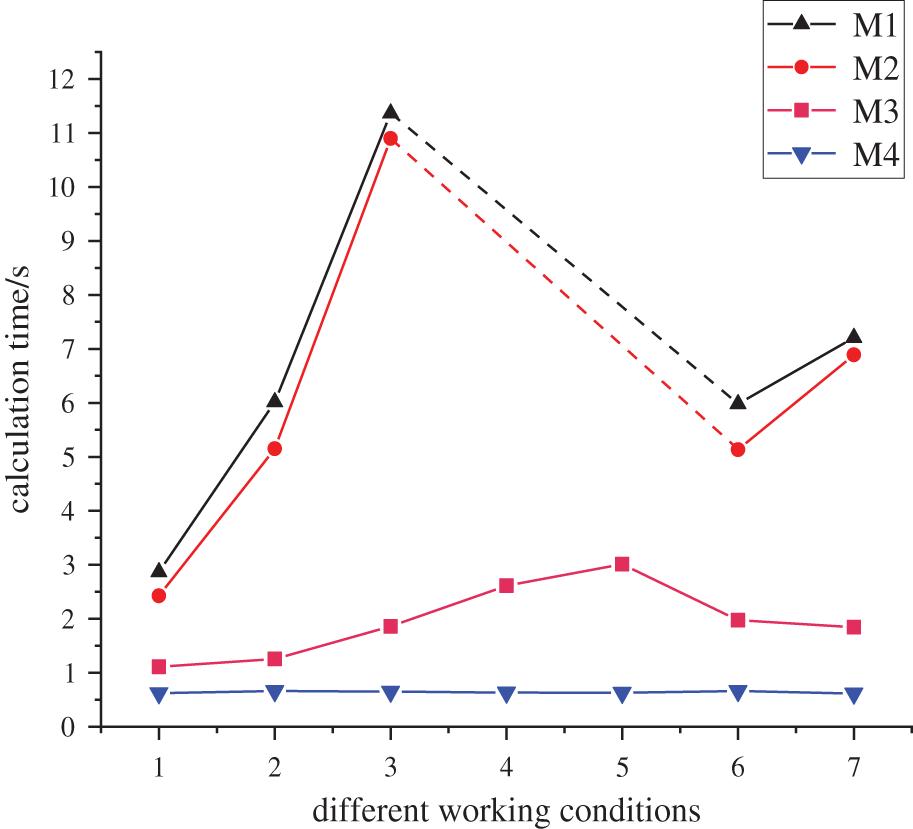
Figure 7: Calculation time of security correction under different algorithms
4.2 Accuracy Test of Node Classification Model
(1) Classification Model Accuracy Evaluation Metrics
In the classification model, the test set accuracy, precision, recall and F1 value are often used to measure the classification model effect. Various evaluation indicators can be calculated by the elements in the confusion matrix shown in Table 2.
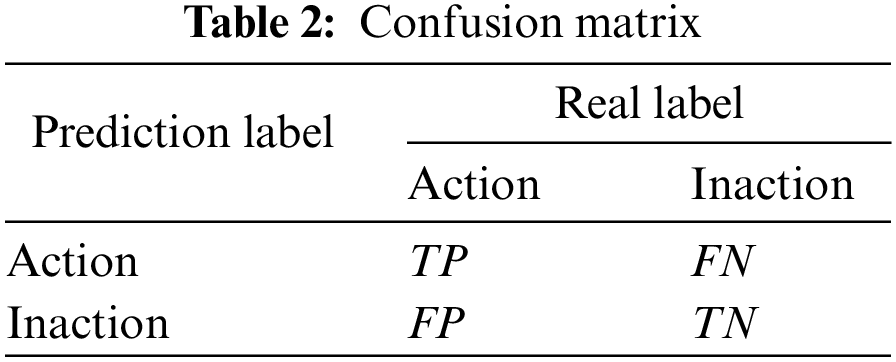
Wherein, TP means the number of samples whose real label is action and prediction label is action; FN means the number of samples whose real label is inaction and prediction label is action; FP means the number of samples whose real label is inaction and prediction label is action; TN means the number of samples whose real label is inaction and prediction label is inaction; accuracy represents the proportion of correctly classified samples to all samples; precision represents the proportion of samples recognized as actions to samples that are actually actions; recall represents the proportion of samples predicted to be actions to samples that are actually actions. P and R represent precision and recall, respectively, and F1 is the harmonic mean of precision and recall. In this paper, accuracy and F1 are used to evaluate the model with the indicator value ranges both as [0–1]. The closer the value is to 1, the better the classification effect of the model is.
(2) SAE classification model performance evaluation
This paper evaluates the SAE-based node action classification model and compares it with the DNN classification model [25]. DNN has 6 layers and sets 4 hidden layers with the number of hidden layer neurons 1024, 512, 512 and 512, respectively. Except the output layer activation function adopts the Sigmoid function, the other layer activation functions use the non-saturated and nonlinear ReLU function. The number of neurons in the SAE hidden layer is 256, 128, 64, 128, and 256; the activation function selects the Sigmoid function and the top-level classifier uses the Softmax regression layer for node adjustment state classification.
From the generated samples, 8000 samples are randomly selected as training set labeled samples, 4000 as test set samples, and 10,000 as unlabeled samples. The classification model training results of some nodes are extracted for verification with the results shown in Table 3.
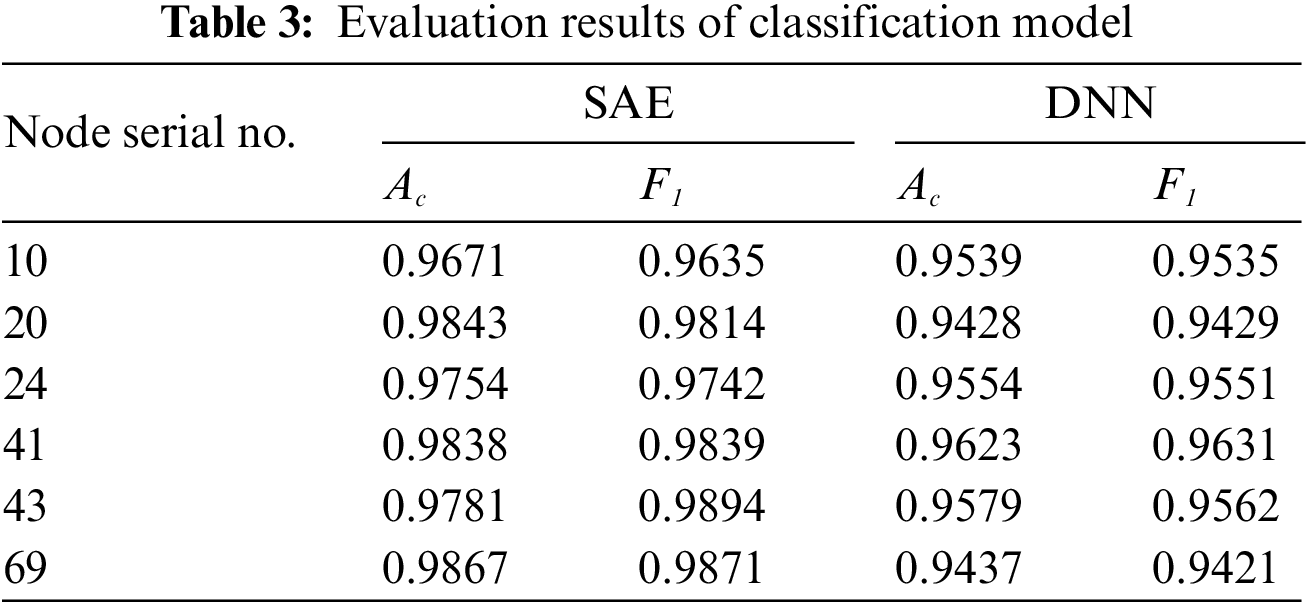
As can be seen from Table 3, the classification results of SAE model are more accurate than the DNN model with a small number of label samples. SAE model is pre-trained through unsupervised training and fine-tuned through supervised training in the second stage. Therefore, the SAE model can automatically extract features to realize data dimension reduction under certain label samples, and solve the problems of difficulty in obtaining labeled samples and smaller numbers of samples in real examples.
4.3 Single Branch Overload Correction Analysis
(1) Analysis of calculation accuracy
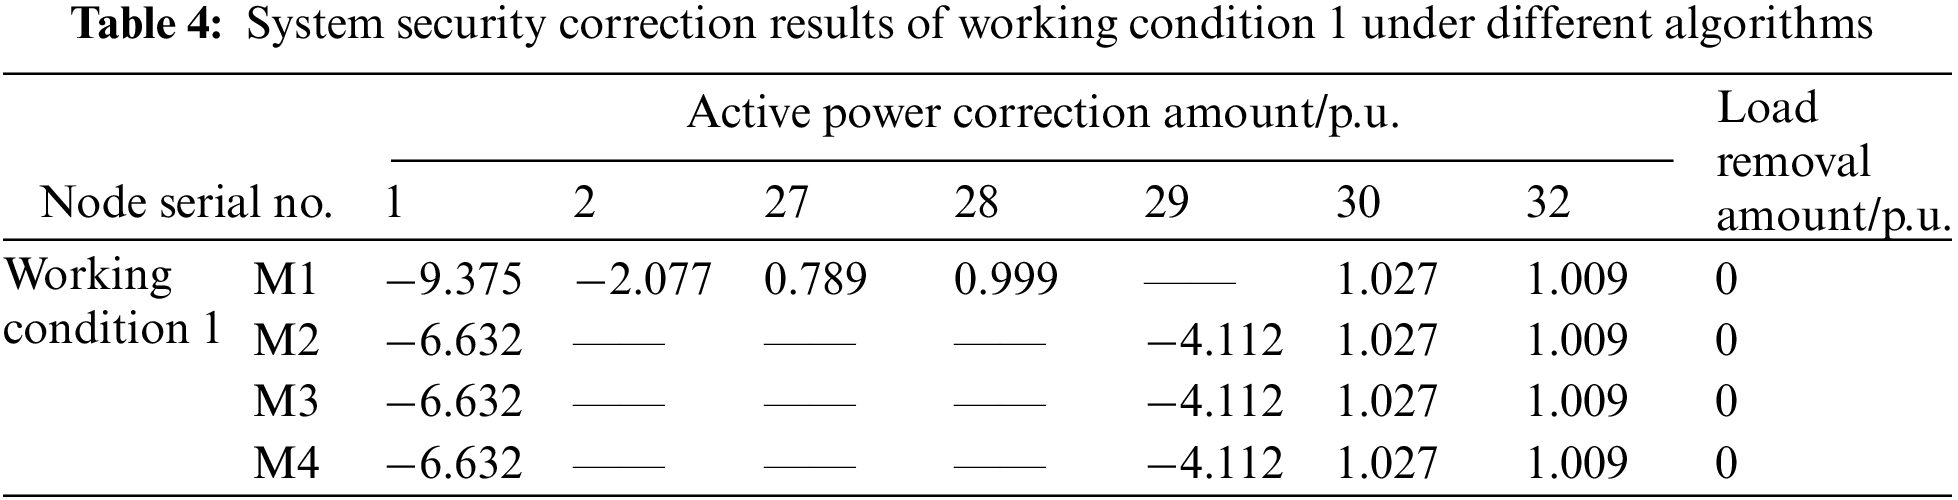
Working conditions 1–3 are situations which an overload of varying degrees appear at random branches. The calculation performance of the method proposed in this paper is tested under different conditions and compared with the three other methods. As can be seen from Table 4, when an overload occurs to a certain line, the action node number of M2 is significantly lower than that of M1, indicating that the participation of the UPFC in regulation can greatly reduce the number of control devices involved and the required correction amount in the correction process; meanwhile, the calculation result of M4 is the same as that of M2 and M3 under this working condition, which further reflects the better accuracy of the data-driven model in this paper.
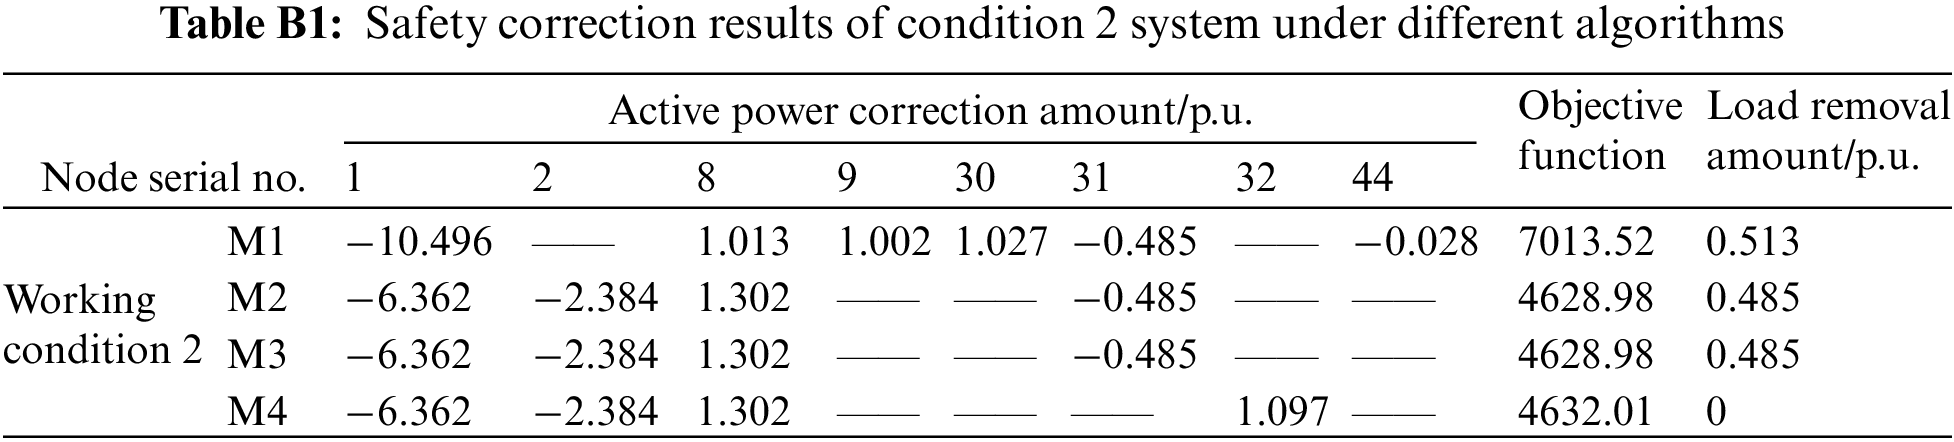
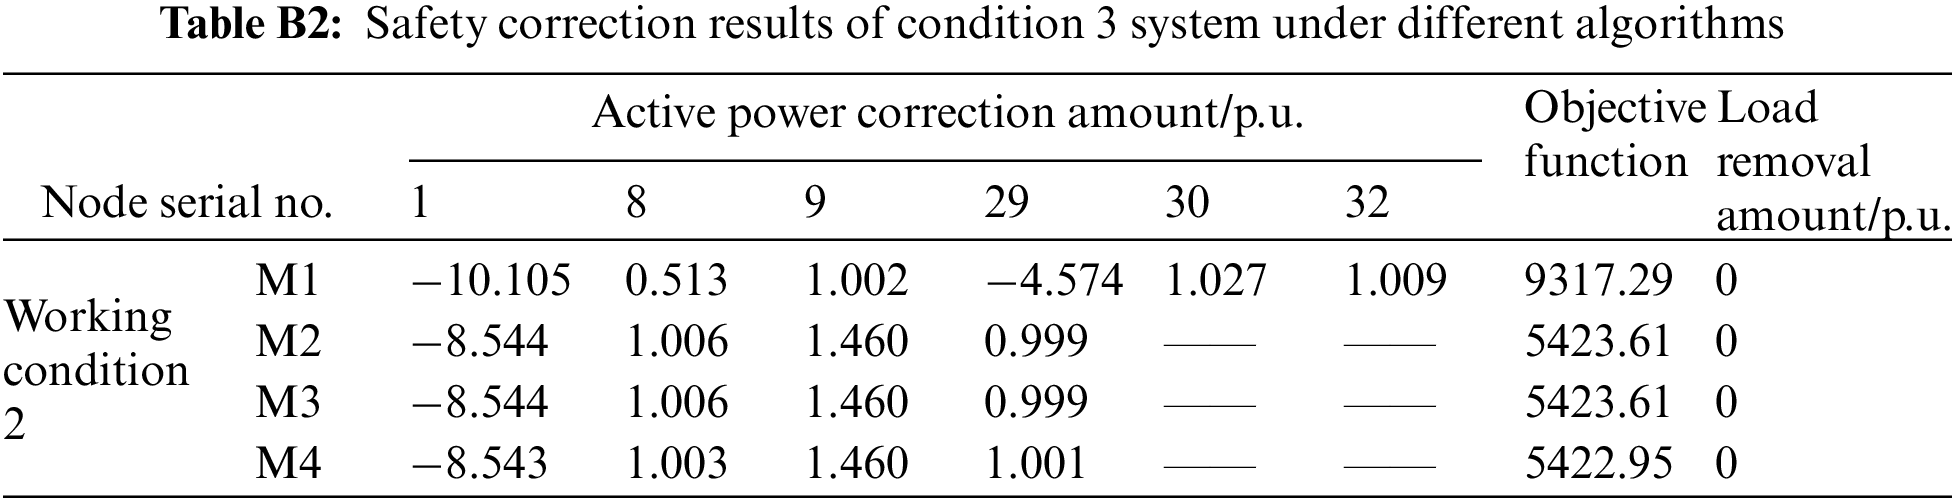
Tables B1 and B2 show the comparison of the security correction results under other working conditions: in Table B2, for the correction strategy offered by M4, the active power correction amount of the generator is slightly different from other methods. By solving the objective function again, 4632.01, the objective function result of M4, is slightly larger than M2’s 4628.98. It shows that although the strategy obtained by M4 is not entirely optimal, it is very close to the optimal solution; comparing the load shedding of different methods at this time, it is not difficult to see that the correction strategy given by M4 only needs to adjust the generator output and effectively avoid the occurrence of load shedding, which is also more in line with the requirement of prioritizing the generator adjustment for security correction and avoiding load shedding; all of this improves the system economic benefits too.
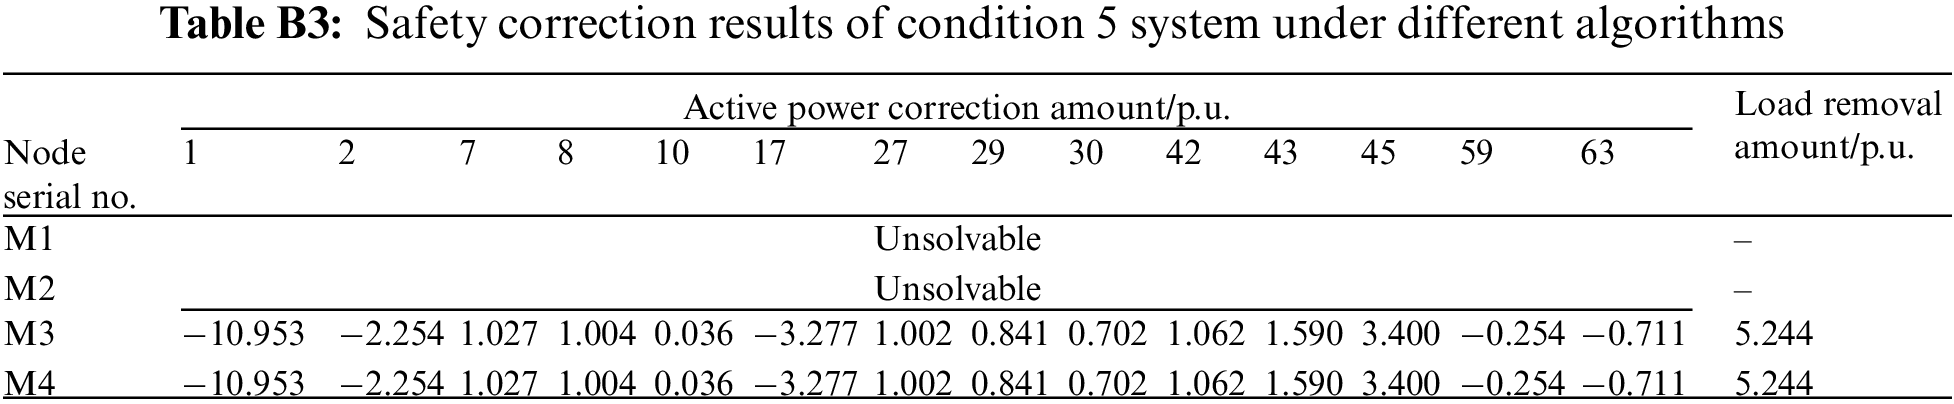
In Table B3, although the calculation result of M4 is slightly different from that of M2, its objective function result of 5422.95 is slightly smaller than that of M2, 5423.61. It can be seen that the action node and correction amount obtained theoretically by the optimization calculation method based on the traditional model cannot guarantee to be the optimal solution as it pertains to certain non-optimal problems. In contrast, the DNN model obtained after a large number of training experiments relies on its outstanding learning ability. The determined node correction amount is even better than the model method.
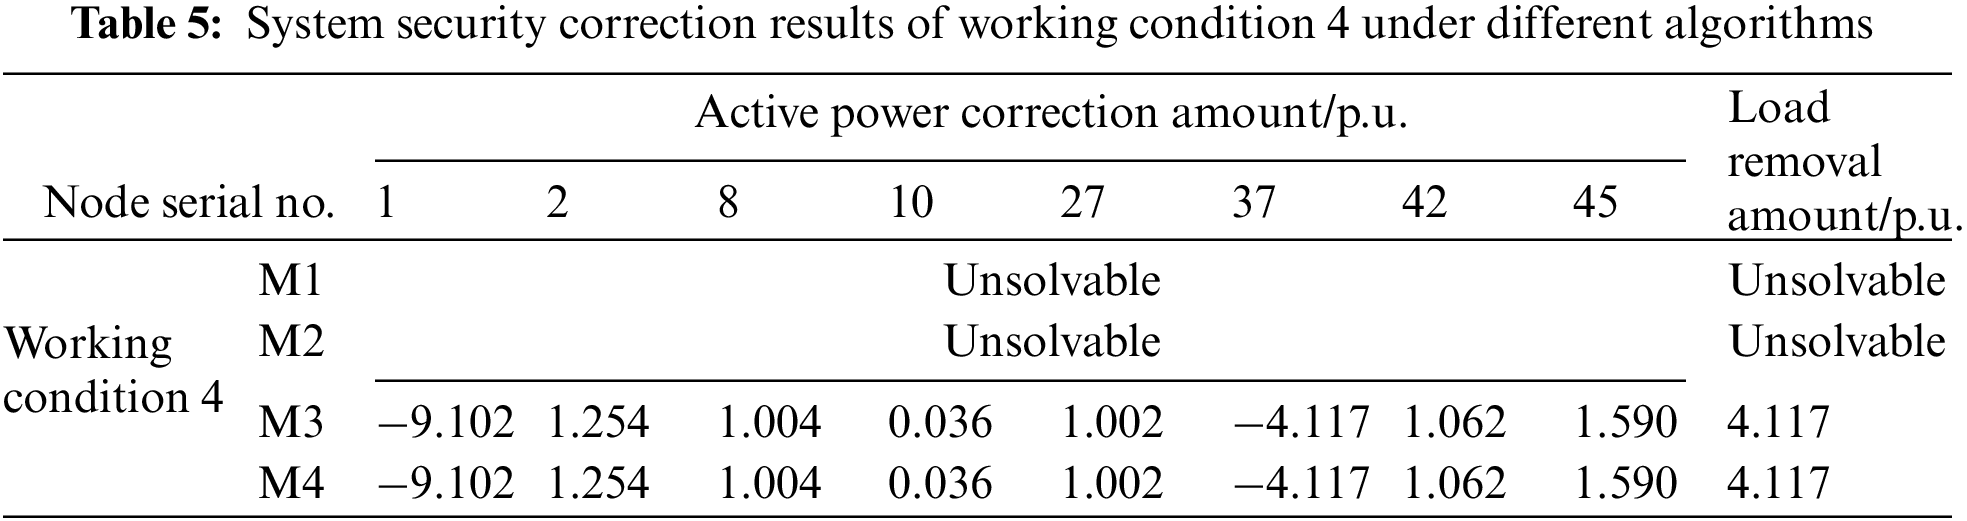
(2) Analysis of unsolvable problems
Tables 5 and B3 show the correction results of working conditions 4 and 5, respectively. When there is a branch overload in working conditions 4 and 5, the mixed integer programming model established by M1 and M2 cannot offer solutions due to the complex iterative calculation or guarantee the safe and stable operation of the system either. In contrast to the calculation results of M3 and M4, the generator output and load node output can be adjusted accordingly to complete the security correction. It further verifies that in the absence of relevant training samples, the deep learning model can learn many adjustment strategies of similar working conditions when training the data of solved working conditions. The deep learning model can judge the unsolved branch overload of similar working conditions and quickly give the correction strategy by learning massive overload data. Although the correction results of M4 and M3 are the same as explained in Chapter 4.1, the calculation speed and stability of M4 are better than that of M3. Based on the above analysis, the method in this paper can not only make up for the unsolved problem inadequacy of traditional model methods, but also greatly improve the solution efficiency of this type of branch, ensure the system safety to a greater extent, and improve the application ability to this type of practical engineering problems.
4.4 Analysis of Multiple Branch Overload Correction
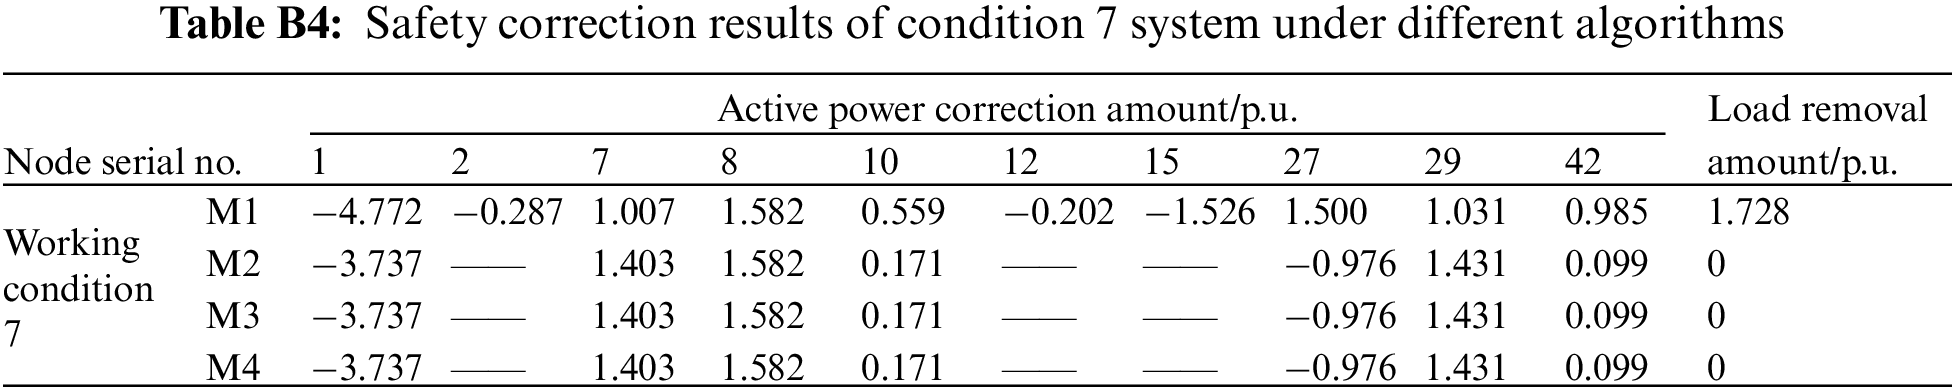
To verify that the method of this paper is also applicable to multiple branch overload situations, this paper sets different load levels (randomly adjust the load to raise the system branch overload), N-1 faults and N-2 faults on the basis of multiple current flow sections, and obtains multiple branch overload samples. Specific to multiple branch overload in working conditions 6 and 7, the calculation results of different correction methods are given in Tables 6 and B4. Comparing the load removal results of M1 and M2 shows that the M2 system can effectively alleviate and even avoid load removal, and improve the system stability and economic benefits because of the addition of UPFC.
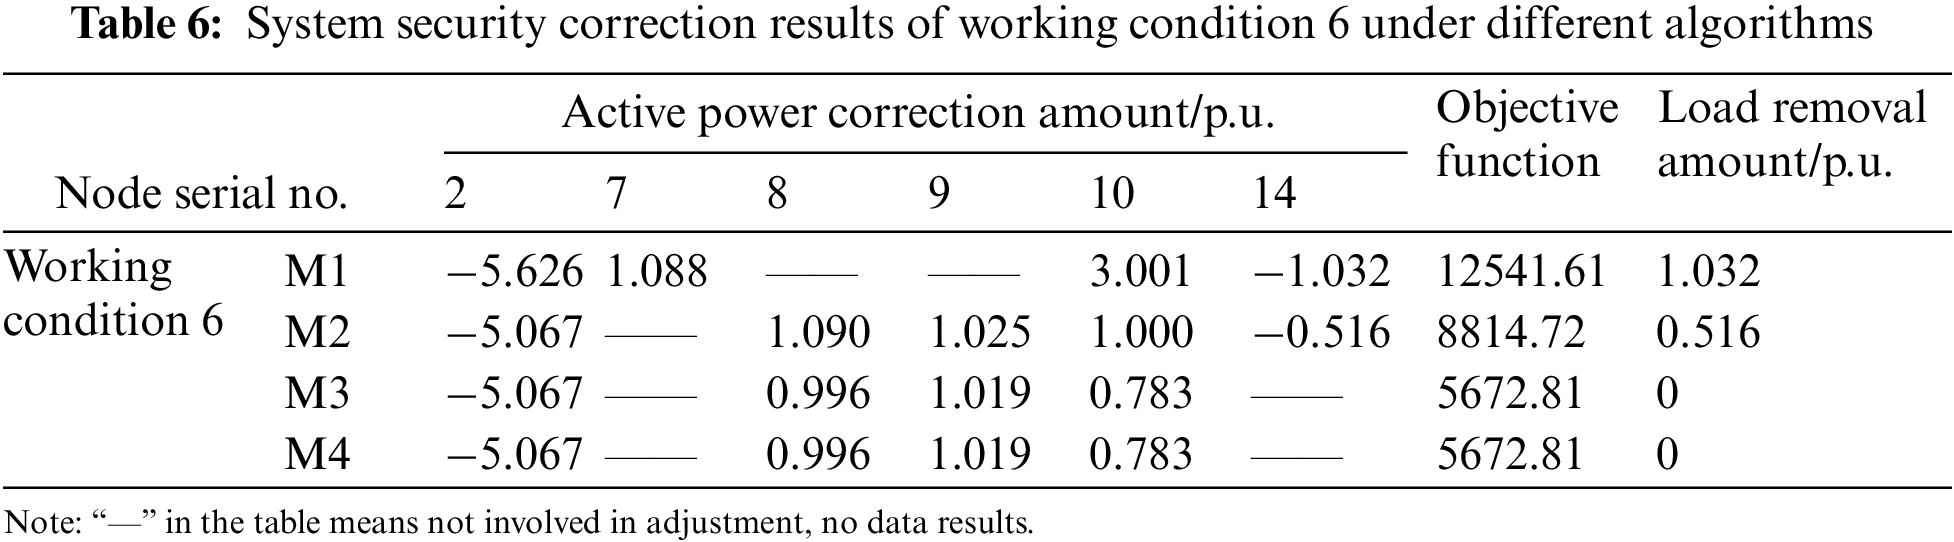
Meanwhile, comparing the objective function of the methods in Table 6, it can be seen that the objective function values of M3 and M4 are the same and lower than M1 and M2. It, furthermore, shows that the method in this paper is more in line with the safety correction requirements than traditional model-based optimization methods, and that the provided correction strategy is also better. In addition, although the correction strategy calculation results of M4 and M3 are the same, as can be seen from the calculation time of working conditions 6 and 7 in Fig. 7, the calculation efficiency of M4 is 3 times higher than M3, and the online application time of M4 almost does not fluctuate with the increase of system faults or system size at all. Therefore, compared with existing safety correction calculation methods, this method not only has accuracy and applicability, which can accurately solve different overload working conditions, but it also has high calculation efficiency. The data-driven fast safety correction method proposed in this paper has great advantages in practical engineering to ensure the stability of large systems.
In this paper, a data-driven security correction method for power systems with a UPFC is proposed, and simulation tests and analysis are carried out based on a practical Test Bed. By comparing with results of current common security correction methods, the correctness and rapidity of the data-driven model are verified. The main conclusions are as follows:
1) From a data-driven perspective, the new method solves the potential safety hazard of model-based methods without an iterative solution. The online calculation of data-driven models is not affected by system scale and fault types, which expands the applicability and practicability of security correction calculations. It has true engineering application value in the process of fault corrections in large system.
2) In view of the complex mapping relationship of sample data, a two-stage deep learning framework is proposed, and a two-level input and output layer is designed to separate the learning objectives, which effectively relieves the learning pressure of the DNN regression model and improves its learning accuracy. The test results show that the data-driven model has high accuracy, stability, and much less calculation time than other previous methods, which meets the system security correction’s requirements for accuracy and rapidity, helps decision makers to quickly formulate correction strategies, and improves system stability.
3) Specific to the remarkably high input feature dimensions of the node adjustment state classification model, a node adjustment state classification model based on SAE is proposed. The test results show that the SAE classification model has better performance under certain label samples. Compared with the DNN model, this model has a powerful automatic feature extraction function, which does not require manual feature extraction and is purely data-driven.
The methods in this paper effectively guarantee the safe and stable operations of systems with UPFC. Therefore, the complexity of the system operation mode, the complexity regarding the migration of data-driven models and deep learning model construction methods to the energy system access to renewable energy, as well as other complex systems under flexible AC transmission devices, should be the aim of subsequent research.
Funding Statement: This work was supported in part by Science and Technology Projects of Electric Power Research Institute of State Grid Jiangsu Electric Power Co., Ltd. (J2021171).
Conflicts of Interest: The authors declare that they have no conflicts of interest to report regarding the present study.
References
1. Gu, X. P., Zhang, S., Wang, T., Xu, Z. H., Su, Y. et al. (2017). Optimization control method of active security correction from the perspective of safety domain. Automation of Electric Power Systems, 41(18), 17–24. [Google Scholar]
2. Qu, Z. C., Gao, L., Lin, B. K., Shi, G. Y. (2019). Power system fault full information diagnosis model based on multi-source data. Power System Protection and Control, 47(22), 59–66. [Google Scholar]
3. Li, M. Y., Fang, L. H., Zhao, Q. C., Zhu, W. C., Wan, X. S. et al. (2017). Review of transmission line switching strategy for power grid security correction. Power System Technology, 41(8), 2506–2513. [Google Scholar]
4. Jiang, Y., Srivastava, A. K. (2014). Data-driven event diagnosis in transmission systems with incomplete and conflicting alarms given sensor malfunctions. IEEE Transactions on Power Delivery, 35(1), 214–225. https://doi.org/10.1109/TPWRD.2019.2947671 [Google Scholar] [CrossRef]
5. State Grid Jiangsu Electric Power Co., Ltd. (2015). Unified power flow controller engineering practice. Beijing: China Electric Power Press. [Google Scholar]
6. Xie, H., Mei, S. W., Xu, Z., Lu, Q., Akihiko, Y. (2001). Nonlinear control of UPFC and improvement of power system stability. Automation of Electric Power Systems, 19, 1–5. [Google Scholar]
7. Kumar, E. N., Dhanasekaran, R. (2014). Optimal power flow with FACTS controller using hybrid PSO. Arabian Journal for Science and Engineering, 39(4), 3137–3146. https://doi.org/10.1007/s13369-013-0943-0 [Google Scholar] [CrossRef]
8. Ju, R. S., Chen, B. X., Qiu, X. G. (2003). Research on UPFC control method. Proceedings of the CSEE, 23(6), 60–65. [Google Scholar]
9. Shayeghi, H., Shayanfar, H. A., Jalilzadeh, S. (2009). A PSO-based unified power flow controller for damping of power system oscillations. Energy Conversion and Management, 50(10), 2583–2592. https://doi.org/10.1016/j.enconman.2009.06.009 [Google Scholar] [CrossRef]
10. Jing, P., Zhou, F., Song, J. Y., Guo, J. B. (2013). Design and simulation of unified power flow controller with modular structure. Power System Technology, 37(2), 356–361. [Google Scholar]
11. Xun, X., Zhang, H. X., Li, C. G., Liu, Y. T., Li, W. (2016). Optimization algorithm of emergency load shedding based on trajectory sensitivity. Automation of Electric Power Systems, 40(18), 143–148. [Google Scholar]
12. Xu, Y., Zhi, J. (2015). Regional emergency control strategy of line overload based on power sensitivity. Transactions of China Electrotechnical Society, 30(15), 60–72. [Google Scholar]
13. Niu, Q. F., Wu, P., Zhang, J., Cheng, H. Z., Zeng, Y. (2020). Collaborative optimization planning method of electro-pneumatic coupling system considering electro-pneumatic conversion. Automation of Electric Power Systems, 44(3), 24–31. [Google Scholar]
14. Zhou, Y., Guo, S., Xu, F., Cui, D., Ge, W. et al. (2020). Multi-time scale optimization scheduling strategy for combined heat and power system based on scenario method. Energies, 13(7), 1599. https://doi.org/10.3390/en13071599 [Google Scholar] [CrossRef]
15. Liao, S. W., Yao, W., Wen, J. Y., Hou, Y. H., Li, D. H. (2016). Two-stage optimization method for grid reconfiguration and load restoration in the later stage of power system restoration. Proceedings of the CSEE, 36(18), 4873–4882. [Google Scholar]
16. Zhang, S., Gu, X. P., Wang, T. (2019). Static security correction control method for wind power system based on distributed robust optimization. Electric Power Automation Equipment, 39(2), 58–64. [Google Scholar]
17. Bi, R. Y., Lin, T., Chen, R. S., Xu, X. L., Ye, J. (2016). The security correction strategy for AC/DC hybrid power system. Transactions of China Electrotechnical Society, 31(9), 50–57. [Google Scholar]
18. Zhao, J. Q., Jiang, X. D., Zhang, B. M. (2005). An online static security correction algorithm based on continuous linear programming. Power System Technology, 29(5), 25–30. [Google Scholar]
19. Reddy, S. (2017). Multi-objective-based congestion management using generation rescheduling and load shedding. IEEE Transactions on Power Systems, 32(2), 852–863. [Google Scholar]
20. Zhu, Z. R., Li, Q., Wei, Z. N., Zhao, J. B., Sun, G. Q. (2019). Power system security correction model with a new-type of unified power flow controller. Automation of Electric Power Systems, 43(2), 58–71. [Google Scholar]
21. Ahmad, A. S., Sumari, A. D. W. (2017). Cognitive artificial intelligence: Brain-inspired intelligent computation in artificial intelligence. Computing Conference, pp. 135–141. London, UK. [Google Scholar]
22. Xu, P., Sun, Y., Zhang, J., Lv, Y. X., Li, B. (2019). Load situation awareness and regulation method based on artificial intelligence agent. Automation of Electric Power Systems, 43(3), 257–268. [Google Scholar]
23. Wang, H., Yang, Y., Liu, B. (2019). GMC: Graph-based multi-view clustering. IEEE Transactions on Knowledge and Data Engineering, 2019, 1. [Google Scholar]
24. Liu, Y. X., Zhang, N., Kang, C. Q. (2018). Review of data-driven power network analysis and optimization. Automation of Electric Power Systems, 42(6), 157–167. [Google Scholar]
25. Sun, G. Q., Zhang, K., Wei, Z. N., Li, Q., Liu, J. K. et al. (2020). Fast security correction of power system with UPFC based on deep learning. Automation of Electric Power Systems, 44(19), 119–127. [Google Scholar]
26. Yuan, F. N., Zhang, L., Shi, J. T., Xia, X., Li, G. (2014). Theories and applications of auto-encoder neural networks: A literature survey. Chinese Journal of Computers, 42(1), 203–230. [Google Scholar]
27. Su, J. S., Zhang, B. F., Xu, X. (2014). Research progress of text classification technology based on machine learning. Journal of Software, 2006(9), 1848–1859. [Google Scholar]
28. Hazelwood, K., Bird, S., Brooks, D., Chintala, S., Diril, U. (2018). Applied machine learning at facebook: A datacenter infrastructure perspective. IEEE International Symposium on High-Performance Computer Architecture, pp. 620–629. Vienna, Austria. [Google Scholar]
29. Liu, Y., Liu, Y., Xu, L. X. (2018). High-performance back propagation neural network algorithm for massive load data classification. Automation of Electric Power Systems, 42(21), 96–103. [Google Scholar]
30. Hussain, A., Al-Jumeily, D., Aljaaf, A., Radi, N. (2018). Backpropagation approach supported by image compression algorithm for the classification of chronic condition diseases. IEEE/ACM Transactions on Computational Biology & Bioinformatics, 1. https://doi.org/10.1109/TCBB.2018.2878556 [Google Scholar] [PubMed] [CrossRef]
Appendix A. Safety correction results of different conditions
The formula derivation of the equivalent injection power model of the new UPFC is shown in formulas (A1)–(A8)
Appendix B. Safety correction results of different conditions
Cite This Article
 Copyright © 2023 The Author(s). Published by Tech Science Press.
This work is licensed under a Creative Commons Attribution 4.0 International License , which permits unrestricted use, distribution, and reproduction in any medium, provided the original work is properly cited.
 Downloads
 Citation Tools