
 Submit a Paper
 Propose a Special lssue
 Open Access
ARTICLE

Analysis and Economic Evaluation of Hourly Operation Strategy Based on MSW Classification and LNG Multi-Generation System
School of Energy and Power Engineering, Shandong University, Jinan, 250061, China
* Corresponding Author: Yuetao Shi. Email:
(This article belongs to the Special Issue: Key Technologies of Renewable Energy Consumption and Optimal Operation under )
Energy Engineering 2023, 120(6), 1325-1352. https://doi.org/10.32604/ee.2023.026142
Received 19 August 2022; Accepted 24 November 2022; Issue published 03 April 2023
 View Full Text
 Download PDF
Abstract
In this study, a model of combined cooling, heating and power system with municipal solid waste (MSW) and liquefied natural gas (LNG) as energy sources was proposed and developed based on the energy demand of a large community, and MSW was classified and utilized. The system operated by determining power by heating load, and measures were taken to reduce operating costs by purchasing and selling LNG, natural gas (NG), cooling, heating, and power. Based on this system model, three operation strategies were proposed based on whether MSW was classified and the length of kitchen waste fermentation time, and each strategy was simulated hourly throughout the year. The results showed that the strategy of MSW classified and centralized fermentation of kitchen waste in summer (i.e., strategy 3) required the least total amount of LNG for the whole year, which was 47701.77 t. In terms of total annual cost expenditure, strategy 3 had the best overall economy, with the lowest total annual expenditure of 2.7730 × 10⁸ RMB at LNG and NG unit prices of 4 and 4.2 RMB/kg, respectively. The lower heating value of biogas produced by fermentation of kitchen waste from MSW being classified was higher than that of MSW before being classified, so the average annual thermal economy of the operating strategy of MSW being classified was better than that of MSW not being classified. Among the strategies in which MSW was classified and utilized, strategy 3 could better meet the load demand of users in the corresponding season, and thus this strategy had better thermal economy than the strategy of year-round fermentation of kitchen waste (i.e., strategy 2). The hourly analysis data showed that the net electrical efficiency of the system varies in the same trend as the cooling, heating and power loads in all seasons, while the relationship between the energy utilization efficiency and load varied from season to season. This study can provide guidance for the practical application of MSW being classified in the system.Graphic Abstract
Keywords
Nomenclature
| e | Elemental composition |
| e′ | The corrected elemental composition |
| M | Moisture |
| a | The percentage of kitchen waste |
| b | The percentage of non-combustible |
| A | Ash |
| R | Thermoelectric ratio |
| H | Heating load |
| E | Power load |
| C | Cooling load |
| COP | Coefficient of performance |
| Q | Heat |
| q | Lower heating value |
| η | Efficiency |
| pro | Total expenditure |
| pr | Unit price |
| ρ | Density |
Superscripts and subscripts
| d | Dry MSW |
| wb | The wet base of MSW |
| kd | The dry base of kitchen waste |
| k | Kitchen waste |
| w | Winter |
| s | Summer |
| ws | Winter and summer |
| ncMSW | Unclassified MSW |
| cMSW | Classified MSW |
| bio | Biogas |
| e | Electrical |
| h | Heating |
| c | Cooling |
| y | Year-round |
| l | Energy utilization |
| 0 | Demand load |
Abbreviations
| MSW | Municipal solid waste |
| LNG | Liquefied natural gas |
| NG | Natural gas |
| FC | Fermentation chamber |
| DE | Dehumidifier |
| EV | Evaporator |
| SH | Superheater |
| DEA | Deaerator |
| PAH | Air preheater |
| CC | Combustion chamber |
| GT | Gas turbine |
| G | Generator |
| HS | Heat consumer |
| VA | Valve |
| CON | Condenser |
| HX | Heat exchanger |
| WB | Waste boiler |
| AB | Absorber |
| EC | Economizer |
| ST | Steam turbine |
| GN | Generator (refrigeration) |
In recent years, with the development of society and the improvement of people’s quality of life, the municipal solid waste (MSW) produced by residents has increased year by year, and the phenomenon of “garbage siege” has become increasingly serious. At present, the main disposal methods for MSW are incineration and landfill, etc., but landfilling MSW not only tends to dissipate and contaminate land resources, but also produces offensive odors that affect some neighboring communities [1]. Compared with landfill, MSW incineration can reduce the amount of MSW and recover the energy in MSW, such as MSW incineration power generation, and many countries have vigorously developed this MSW recovery technology [2]. The composition of MSW is diverse and the main challenge is how to convert MSW into energy/fuel efficiently. Different types of MSW have different chemical compositions, and this can be achieved if MSW is classified according to its chemical composition and then recycled in different ways. For example, kitchen waste is rich in biomass, and the lower heating value of kitchen waste will be greatly improved if it is fermented into biogas. After recycling the MSW produced by community residents in the vicinity, it can then supply electricity, cooling and heating to the community.
MSW has a complex composition and contains certain amount of moisture. If it is pre-dried before combustion, its lower heating value will be increased, which helps to improve the thermal efficiency of the system [3]. When there is flue gas recirculation in MSW fired boilers, energy utilization rate can be improved, and the higher the oxygen content of the combustion, the lower the pollutant emissions [4]. From an environmental life cycle assessment perspective, the utilization efficiency of MSW direct incineration is higher than that of MSW gasification followed by combustion [5]. Several scholars have studied the combination of MSW with other fuels to increase the lower heating value. It has been shown that when MSW is used together with agricultural biomass for co-gasification for power generation, the lower heating value of the syngas will have a maximum value when the two are mixed in the right ratio [6]. Combining MSW with coal can also increase the calorific value of the fuel, and adding 25% MSW to a low ash coal can achieve a similar thermal efficiency of the plant as a high ash coal [7]. In addition to incineration, technologies such as anaerobic fermentation and gasification can also replace the original MSW landfill [2]. MSW anaerobic fermentation is suitable for application in small decentralized energy systems. Gas turbine cycle power generation is less expensive than biogas fuel cell technology. MSW anaerobic fermentation power generation can be combined with electrolyzers to produce hydrogen, where the combination with proton exchange membrane electrolyzers has higher fire efficiency and lower CO2 emissions [8]. Theoretical thermal efficiency of the incineration plant increased from 36.92% to 49.55% by using waste heat from the gas turbine to heat steam, feedwater and air [9]. In previous studies, scholars have explored various methods that can increase the calorific value of MSW, and the effects of various utilization methods on system performance, such as incineration, gasification, and compost fermentation. However, most of them are for direct use of MSW, and there are few studies to classify and treat it before utilization, especially in China, where the concept of domestic waste classification is not deep enough [1], research on the classification and treatment of MSW is not mature enough.
LNG is a transportable and high calorific value fuel that is used in large quantities in small-scale co-generation systems. Studies have shown that the net electrical efficiency of LNG-fueled combined heat and power systems is 35.6% and 36.5% in summer and winter, respectively [10]. In addition to being used as a fuel, the cold energy of LNG can also be fully utilized by multi-generation systems. Liu et al. [11] proposed a system based on solid fuel cell and gas turbine for combined cooling, heating and power generation, and combined with LNG cold energy utilization to investigate the effect of key system parameters such as fuel utilization factor and air-fuel ratio of the integrated system, and the comprehensive energy utilization of the system could reach 79.48%. The comprehensive energy efficiency of a system including a gas turbine cycle and LNG cold energy utilization can reach 79.48%, and the system can also reach near-zero emissions [12]. In addition, the integration of LNG cold energy driven absorption refrigeration cycle with the Rankine cycle can enhance each other. Yang et al. [13] proposed a solid fuel cell-steam injection gas turbine distributed energy system fueled by LNG, which can use LNG cold energy to recover CO2 while generating electricity, while the CO2 recovery system can generate heating and cooling. Esfilar et al. [14] introduced an integrated system including air separation for LNG gasification and a supercritical CO2 power generation unit, where the CO2 power generation unit generates power load only and the net electrical efficiency of the system is 44.7%. Ghersi et al. [15] proposed an electric load-tracking operation strategy for the multi-generation system with better energy, economic and environmental performance compared to other strategies, but concluded for each month’s LNG consumption without hourly conclusions. Chu et al. [16] proposed a regional energy system operation strategy based on time-of-use tariffs that allocates the energy supply system and the energy storage system on a time-by-time basis, but did not analyze the energy system throughout the year.
Currently, there is a very limited number of studies in the open literature on multi-coupling systems coupled with LNG and MSW and the time-by-time strategy of the system. MSW is generated by community residents, while LNG is easy to transport and has a high calorific value, and it may be possible to meet the energy demand of a community if these two energy sources are used reasonably. Based on the different loads required by the community in different seasons, a year-round time-by-time operation strategy is proposed, which can analyze the thermal economy of the system from the perspective of year-round operation and allocate energy rationally, and is of guidance for practical applications.
The work of this study is to propose a multi-generation system based on MSW and LNG for large communities. The system includes MSW drying and fermentation, MSW incineration, gas turbine, heating boiler and lithium bromide absorption refrigeration, which can provide power, cooling and heating for users in the community. Two systems are classified according to whether MSW is classified or not, and different year-round hourly operation strategies are proposed. With the help of simulation software EBSILON Professional and MATLAB, a system model is built based on mass and energy balance equations, and the annual hour-varying working condition simulation of the system is carried out on the basis of proposed system. The annual and hourly thermal economic analysis of each operation strategy in the proposed system is conducted to select an operation strategy with the lowest energy consumption.
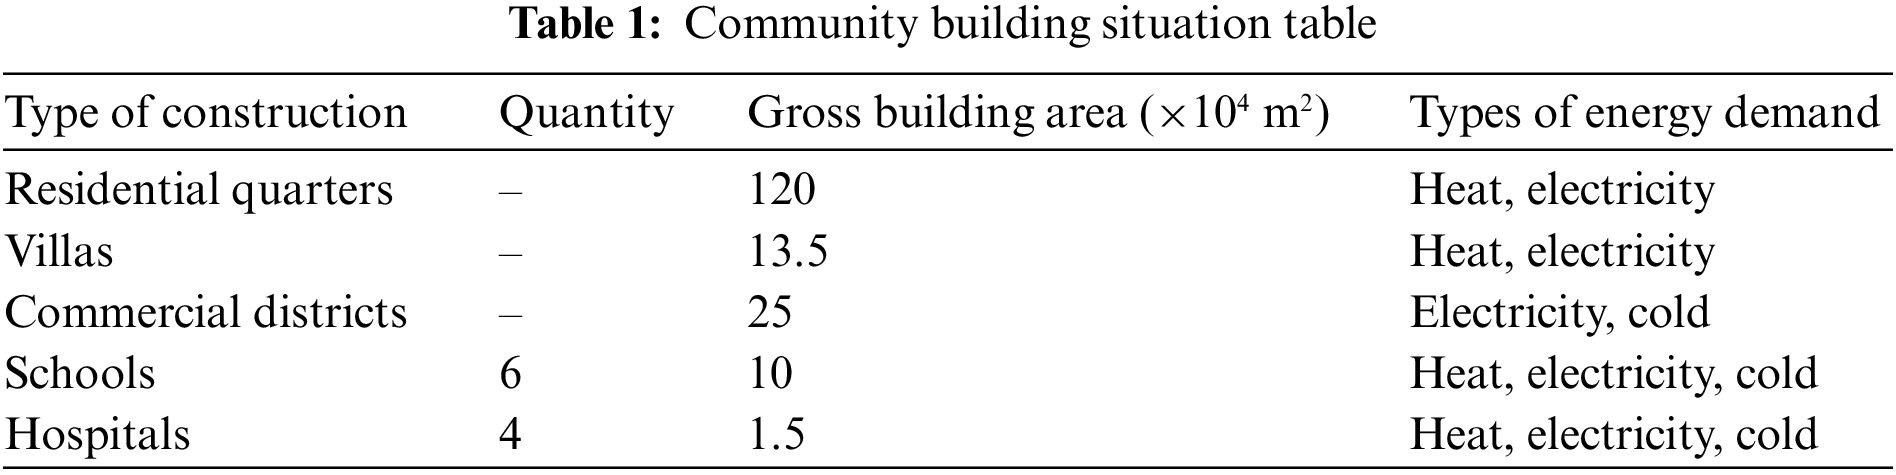
In order to recover MSW from the community and supply cooling, heating and power to the community with energy saving and high efficiency, this paper designs a multi-generation system using MSW and LNG as energy sources, and incorporates MSW classified. In this paper, a community is used as the research object. The community has about 95000 people and various building types, including residential areas, commercial areas, schools, hospitals, etc. The distribution of the community is shown in Fig. 1, and each building area as well as the demand energy types are shown in Table 1. In winter, buildings such as residential quarters, villas, schools and hospitals adopt centralized heating, and buildings in commercial districts adopt air-conditioning heating; in summer, residential quarters and villas adopt air-conditioning cooling, and buildings such as schools, hospitals and commercial districts adopt centralized cooling.

Figure 1: Community distribution map
The historical data of the hourly load of cooling, heating and power of this large community in previous years was used as the demand load of the multi-generation system. The hourly load demand data fluctuates over a wide range over time and the type of supply and load varies by season. Therefore, when the model is built, the representative data of various loads are selected as the design conditions, so that the variable conditions can be simulated more accurately. To ensure that the system can operate properly in each hourly simulation, the maximum and minimum cooling, heating and power loads are used as the system design conditions. Due to the large amount of data on a year-round hourly basis, this paper only shows the 120-h (5-day) load diagram containing the maximum loads of cooling, heating, and power. The hourly loads of cooling, heating and power are shown in Fig. 2, and all three loads show significant periodic fluctuations with time. The maximum hourly power generation load of this large community is 158.65 MW and the minimum power generation load is 0.368 MW; the maximum hourly heating load is 164.87 MW and the minimum heating load is 13.301 MW in winter; the maximum hourly cooling load is 130.46 MW and the minimum cooling load is 4.335 MW in summer.

Figure 2: The hourly load demand diagram of 120 h cooling, heating and power in community
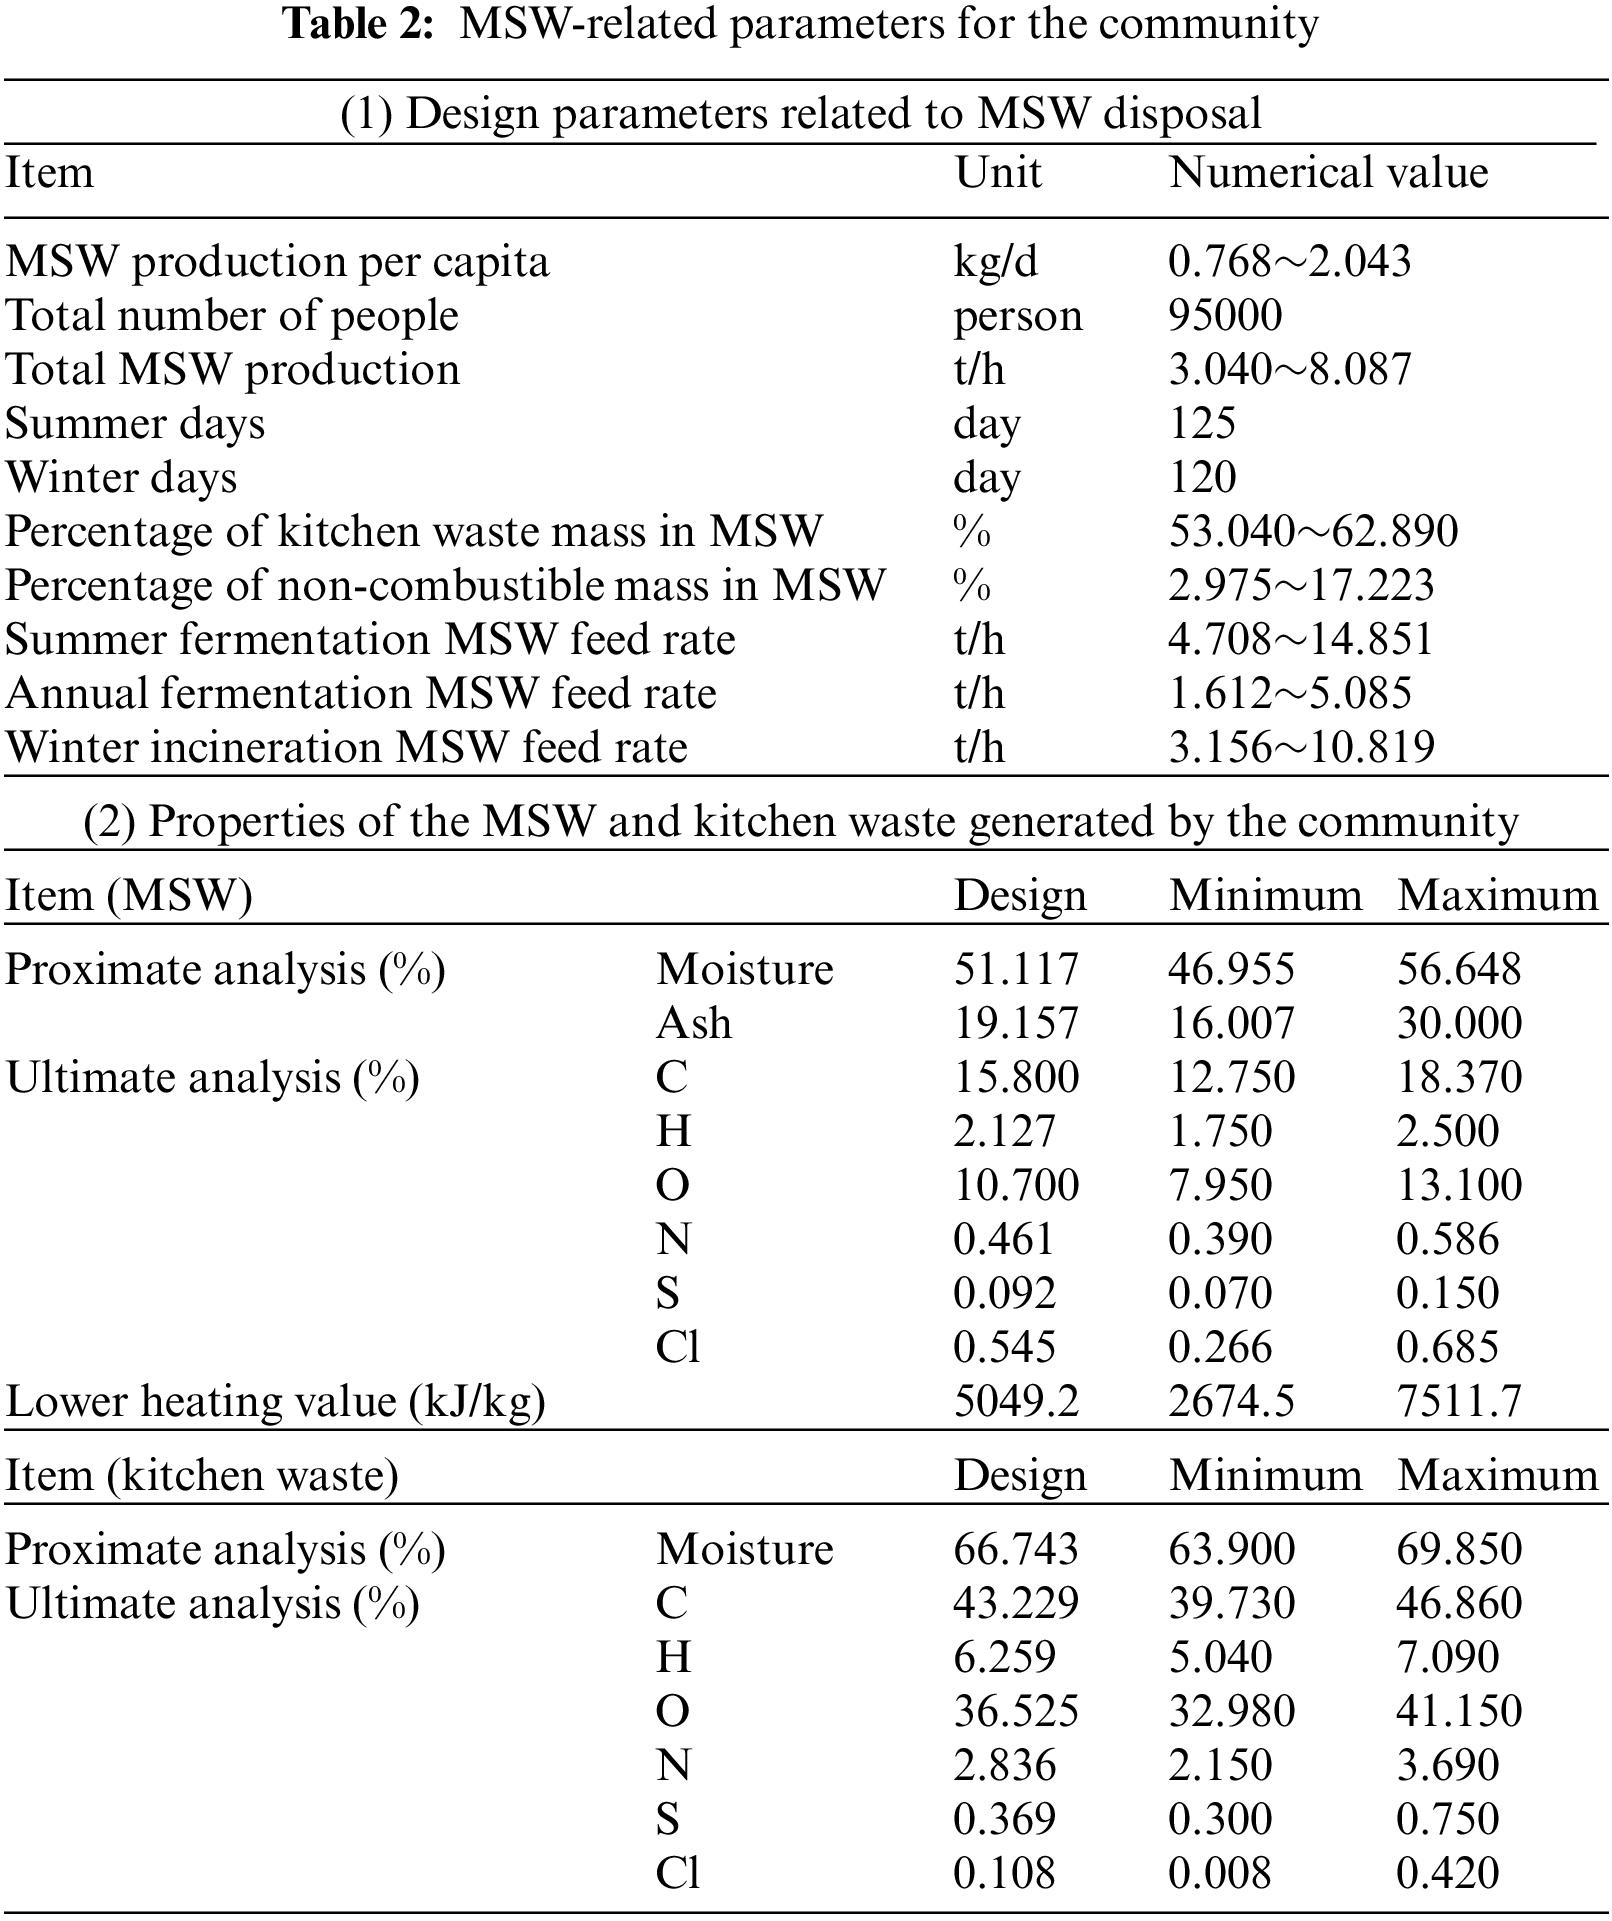
According to the National Bureau of Statistics in 2021 [17], the daily per capita domestic waste production in China is about 0.77~2.04 kg [18–21], and the total MSW production of the community can be derived from the total number of people in the community. The physical and chemical characteristics of MSW in the community location were statistically analyzed, and the local cooling and heating conditions were analyzed, resulting in the MSW related design parameters. Considering that the MSW contains non-combustible materials (such as glass, metal and cinder blocks), this part of the MSW has been removed from the feed MSW. The composition of MSW is complex and influenced by regional, cultural and climatic factors, so the physical and elemental composition of MSW fluctuate greatly. The approximate analysis, elemental analysis and lower heating value of the wet base of MSW and the dry base of kitchen waste generated by the residents of the region can be derived from the statistical data of previous years. The parameters related to the MSW generated by the community are shown in Table 2. MSW and kitchen waste were wet base and dry base, respectively.
3 System and Operation Strategy Proposal
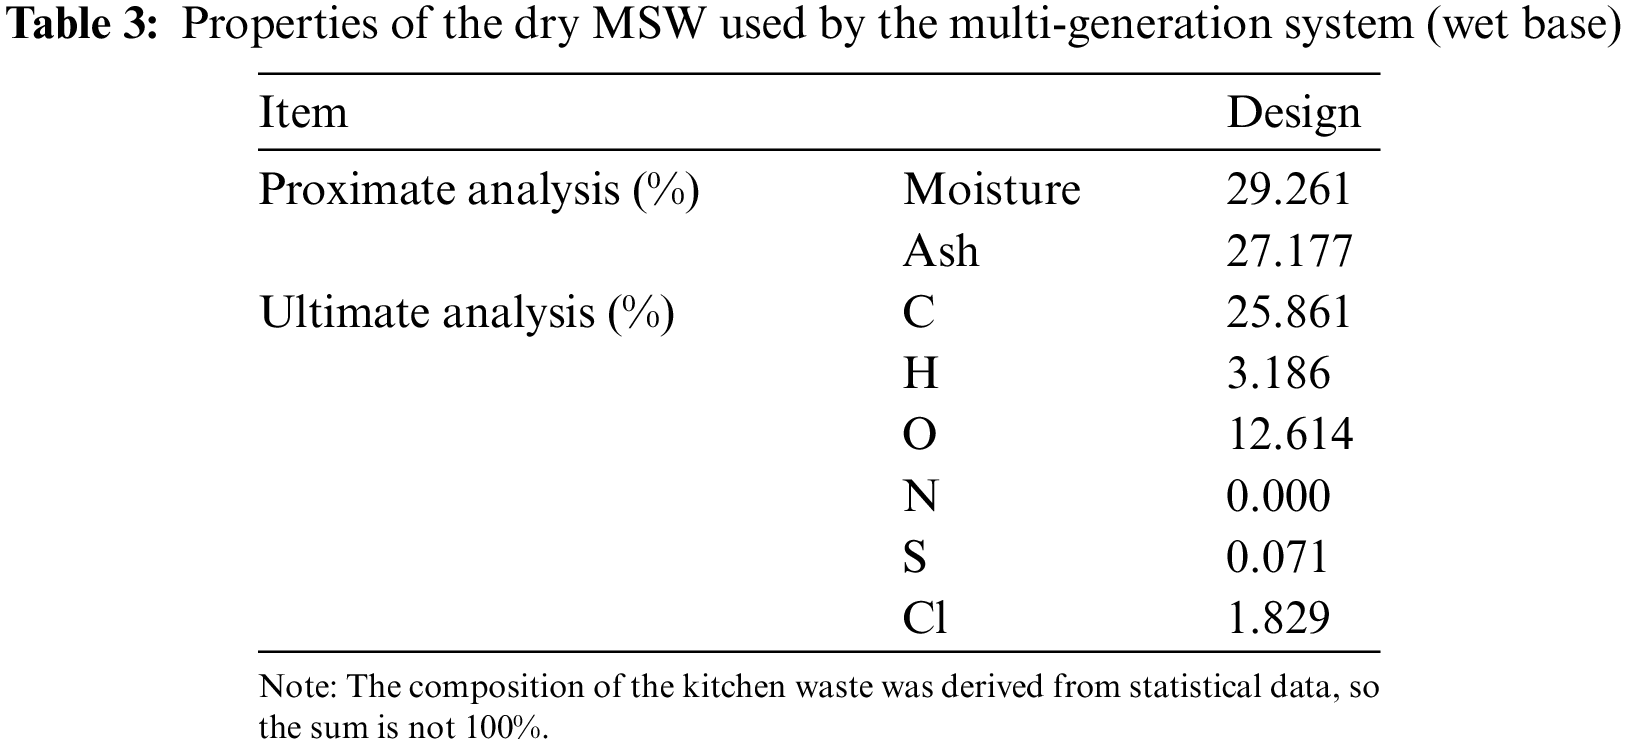
On the basis of Table 2, the proximate and ultimate analysis of the dry MSW remaining after removing kitchen waste and non-combustible MSW such as metal, glass and grey bricks, etc., was calculated. Assuming that the moisture of dry MSW in MSW is consistent, the formulas (1) to (4) were introduced based on quality conservation to calculate the chemical composition of dry MSW. The statistical and calculated values of the dry MSW properties are shown in Table 3.
where ed is the elemental composition of dry MSW, %;
According to the market research, the unit price of electricity on the power plant grid is 0.596 RMB/kWh and the unit price of LNG is 4~8 RMB/kg. According to the literature [22] issued by government, the unit price of residential heating is 0.2 RMB/kWh and the unit price of non-residential residential heating is 0.3 RMB/kWh. If the unit price of cooling is converted to the unit price of heating, the unit price of cooling is the unit price of heating divided by the COP (coefficient of performance). According to the policy document literature [23,24], the unit price of NG is 2.600~4.248 RMB/m3.
Considering the large load demand of the community, it is difficult for the MSW with less production to meet the load demand, this multi-generation system uses the flue gas waste heat boiler obtained from LNG combustion to bear the main load demand, with MSW as a supplement. The system is divided into two types according to MSW being classified and not classified. The system diagram is shown in Fig. 3. The MSW unclassified multi-generation system is introduced first.

Figure 3: Integrated energy system diagram
The MSW unclassified system consists of four main subsystems, namely the MSW disposal subsystem, the turbine subsystem, the gas turbine subsystem and the refrigeration subsystem. In the MSW disposal subsystem, since the water content of unclassified MSW is 51.117%, the MSW flows into the dehumidifier (DE) for heating and drying before it is incinerated in the furnace to increase the calorific value, thus improving the combustion efficiency of the MSW incineration boiler. The incoming air should be preheated to 220°C by three heating components: the first step of preheating the air by steam generated from the DE (i.e., the heat exchange process in component PAH3 in the figure), the second step of preheating the air by steam extraction from the turbine side (i.e., PAH2 in the figure) and finally the third step of preheating the air by the flue gas from the MSW incineration boiler outlet (i.e., PAH1 in the figure). If the temperature of flue gas at the outlet of the MSW incineration boiler (i.e., flue gas at point 11 in the figure) is too low, it will lead to problems such as low-temperature corrosion and ash accumulation in the boiler equipment, so the minimum flue gas temperature here is set at 130°C. It is calculated that the temperature of PAH2 outlet air must be higher than 118.416°C in order to meet the exhaust flue gas temperature higher than 130°C. In order to heat the air in PAH2 to 118.416°C, a portion of the steam between the first and second turbines (i.e., steam at point 4 in the figure) is selected as the air heating heat source.
In the gas turbine subsystem, the system first makes cold energy use of the low temperature LNG through the Brayton cycle to improve the efficiency of the compressor. The cold energy is then transformed into natural gas (NG) at atmospheric pressure and temperature (0.101 MPa/10°C). NG flows into the combustion chamber (CC) and produces high temperature flue gas into the gas turbine (GT) for power generation.
The gas turbine outlet flue gas temperature is still as high as about 530°C, so the waste heat from the high temperature flue gas is utilized by a three-pressure waste heat boiler (WB1, WB2, WB3) as well as a multi-stage coal economizer (EC), superheater (SH) and heat exchanger (HX). The new steam generated by the superheater corresponding to each stage of the waste heat boiler enters the steam pipes in front of ST1, ST2 and ST3, respectively, according to their pressure levels. The flue gas at the exit of the last stage waste heat boiler (WB1) still has a high temperature, so it is used as a low-grade heat source for DE and EC2 in that order. The steam generated by the MSW incineration boiler and the flue gas waste heat boiler together enters the ST to make power. The system adopts back pressure heating in winter, i.e., VA1 is turned off and VA2 is turned on under heating conditions, so that all steam of the unit does not flow into the last stage turbine (ST3), but into the heat consumer (HS), which increases the heating capacity of the unit. The condensate water after heating is pumped into the condenser (CON1). The inlet pressure of the last stage turbine is set to 0.15 MPa.
In the summer cooling condition, the working steam pressure is only 0.01~0.15 MPa. The steam heating single-effect lithium bromide absorption refrigeration unit is used for the cooling unit, which requires the same heat source as the heating condition, and the turbine unit supplies heat to the lithium bromide refrigeration unit by back pressure (i.e., the heat flow corresponding to point 9 in the figure). Each unit has a cooling capacity of 2040 kW, and 64 to 65 refrigeration units can meet the community’s cooling load demand.
The MSW classified multi-generation system is similar to MSW unclassified system, which is mainly different from the utilization mode of MSW. MSW is divided into two categories: kitchen waste and dry waste. The moisture content of dry waste is still as high as 29.261%, which is treated in a similar way to the MSW unclassified system, i.e., first heated and dried in DE and then incinerated in a furnace; The kitchen waste flows into the fermentation chamber (FC) and produces biogas, which is burned in the CC with NG. The kitchen waste is fermented to maintain a temperature of 55°C in the FC, and the required low-grade heat source is also from the flue gas at point 1 in the figure. The fermentation process of kitchen waste needs to maintain the temperature of FC at 55°C, and the low-grade heat source is also from the flue gas at 1 point in the figure.
In this study, the system operates by determining power by heating load throughout the year. That is, priority is given to meeting the total annual thermal load of the research object, thus resulting in a system output of slightly higher cooling and heating loads than the load required by the research object, while the electrical load falls far short of the demand. In order to meet the electrical load demand of the study population and to reduce the expenses of maintaining stable system year-round operation, measures were taken to sell excess heating and cooling loads and purchase power loads. The system uses the cold energy of LNG to improve the compression efficiency of the compressor. After the cold energy is utilized, the LNG is converted into NG, and this process generates excess NG, which is disposed of by commercial sale measures.
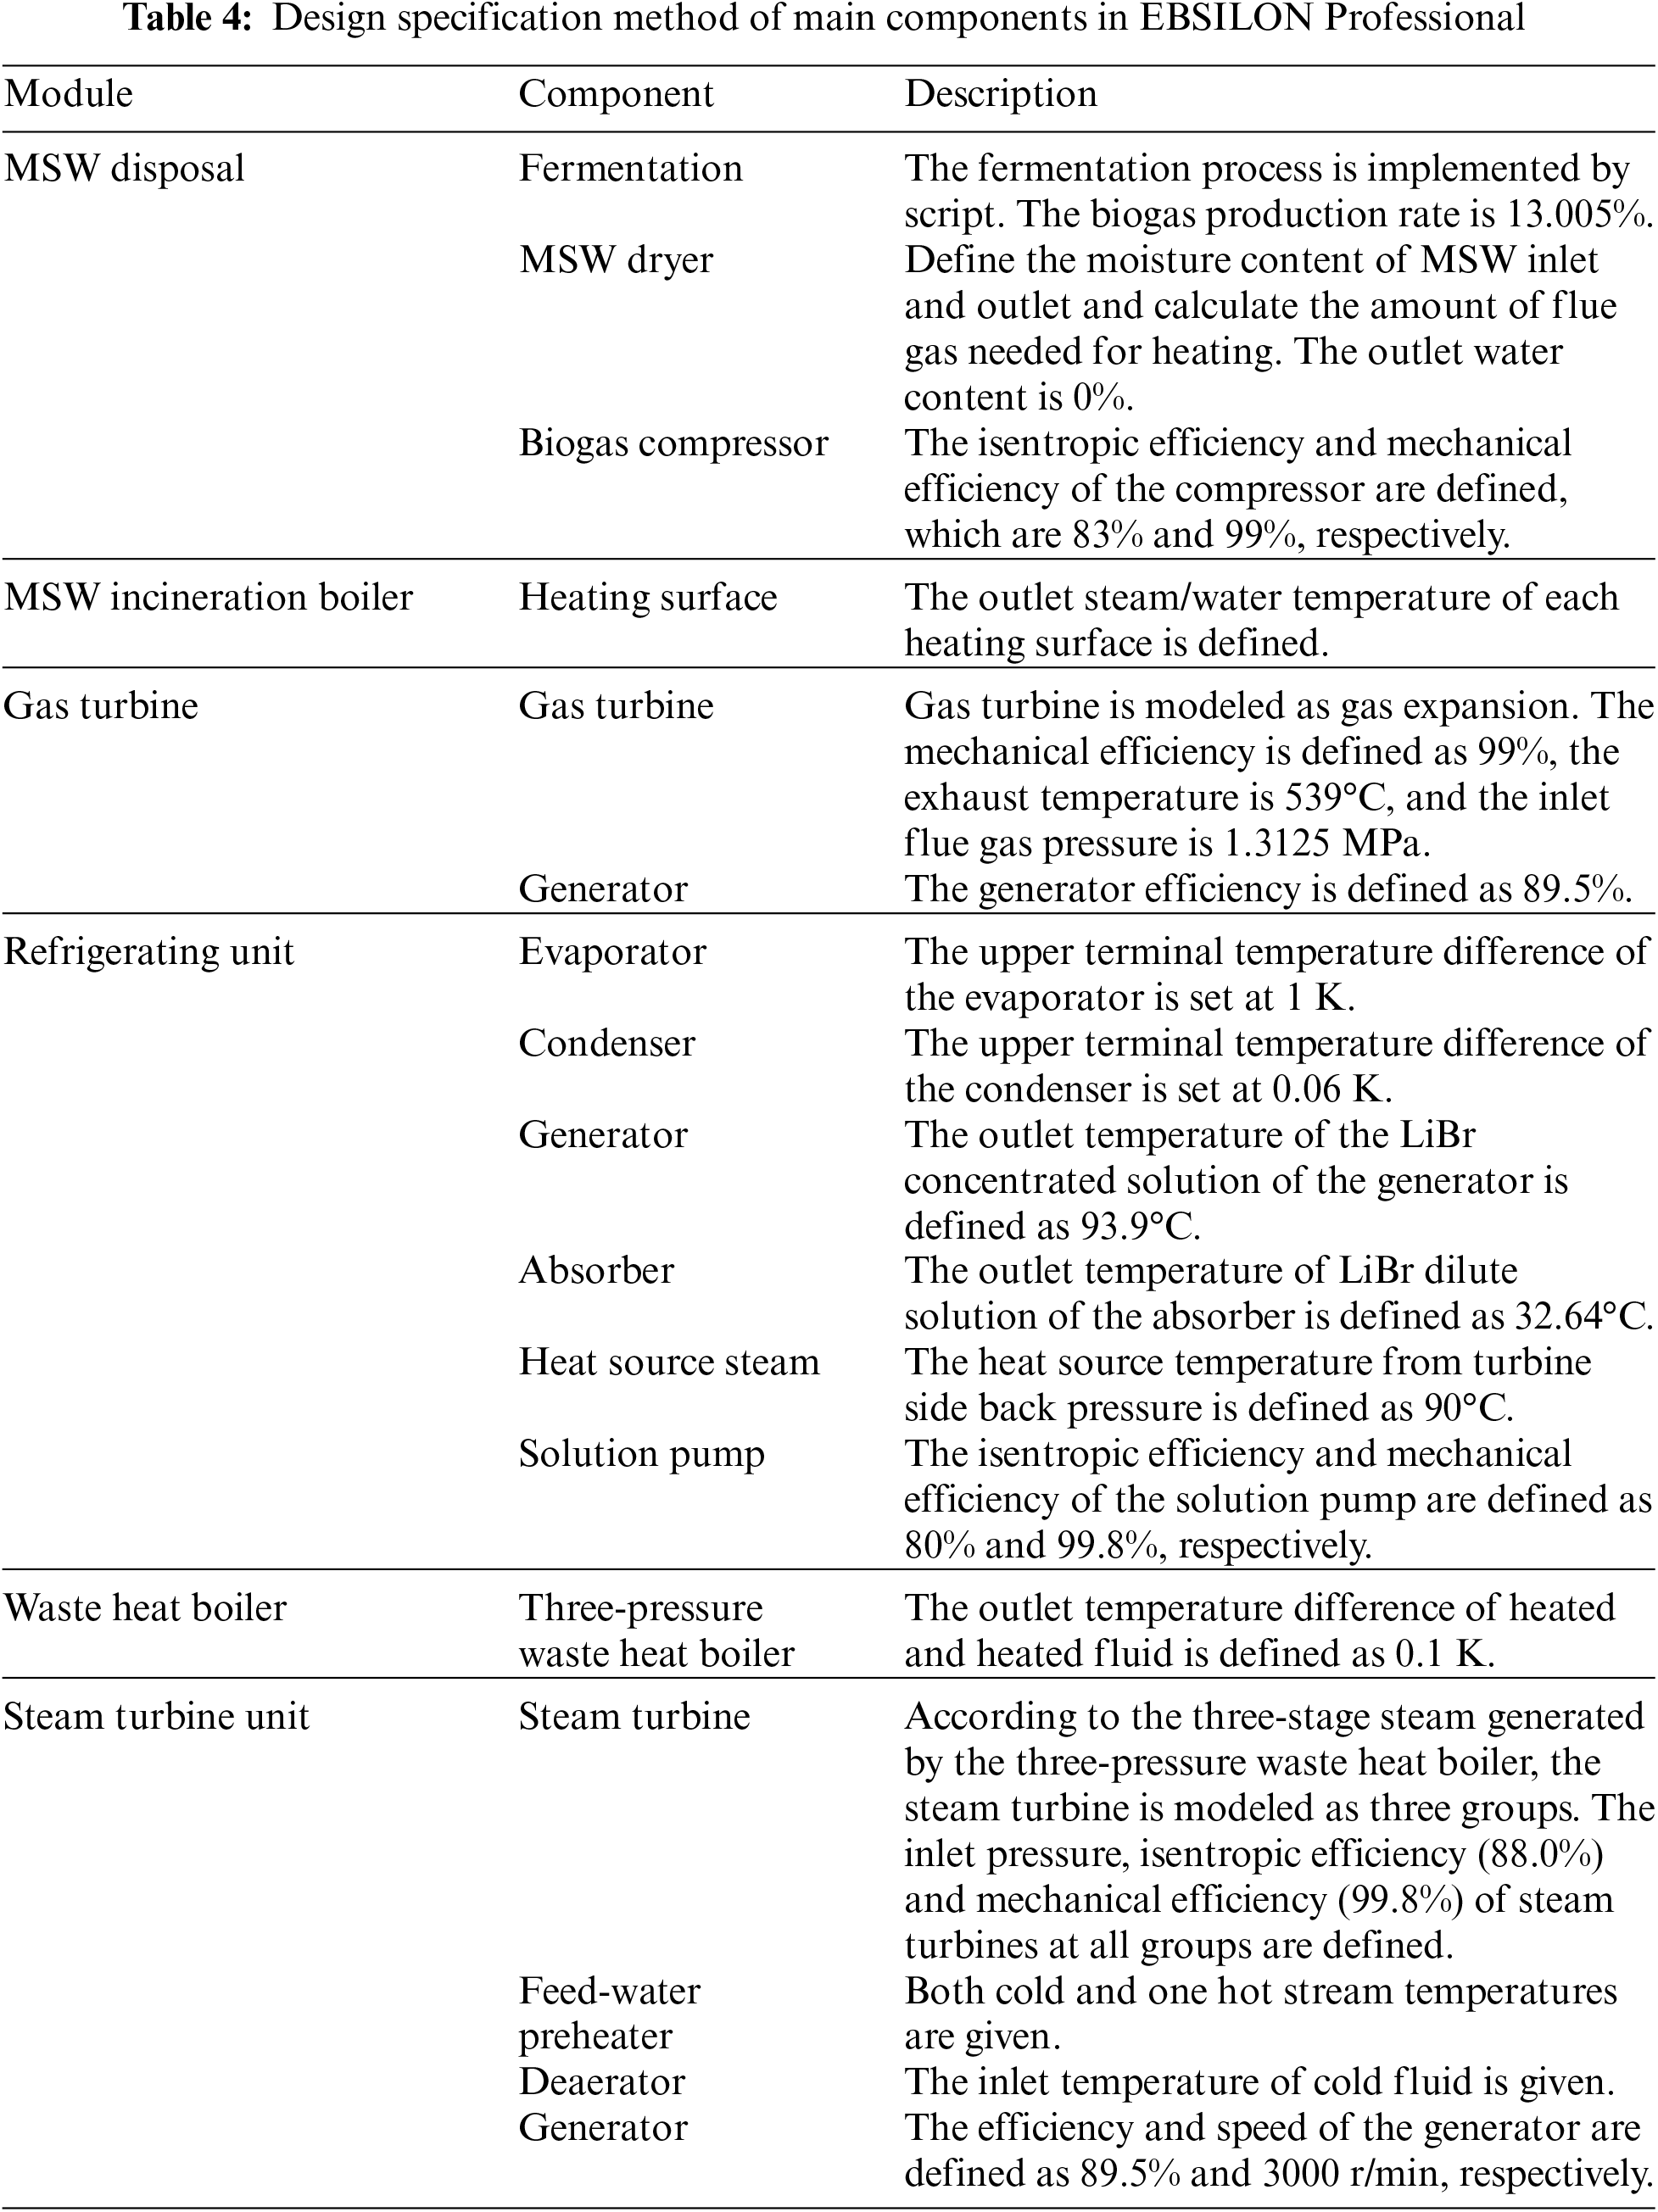
The construction of the MSW and LNG multi-generation system model and year-round hourly simulation runs were done in combination with the power plant simulation software EBSILON Professional and mathematical software MATLAB. The model of the multi-generation system was first built by the software EBSILON Professional, and the design specification method for each component used in the model is shown in Table 4. EBSILON Professional can only simulate the model under a single working condition, and its output load cannot be changed over time, so the software MATLAB can be used to interface with EBSILON Professional. The MATLAB program can be used to change the hourly input parameter values of the multi-generation system model to complete the simulation of multiple operating conditions, so that the hourly LNG mass flow rate required by the community can be calculated and the system can achieve a quasi-static process of 8760 h throughout the year.
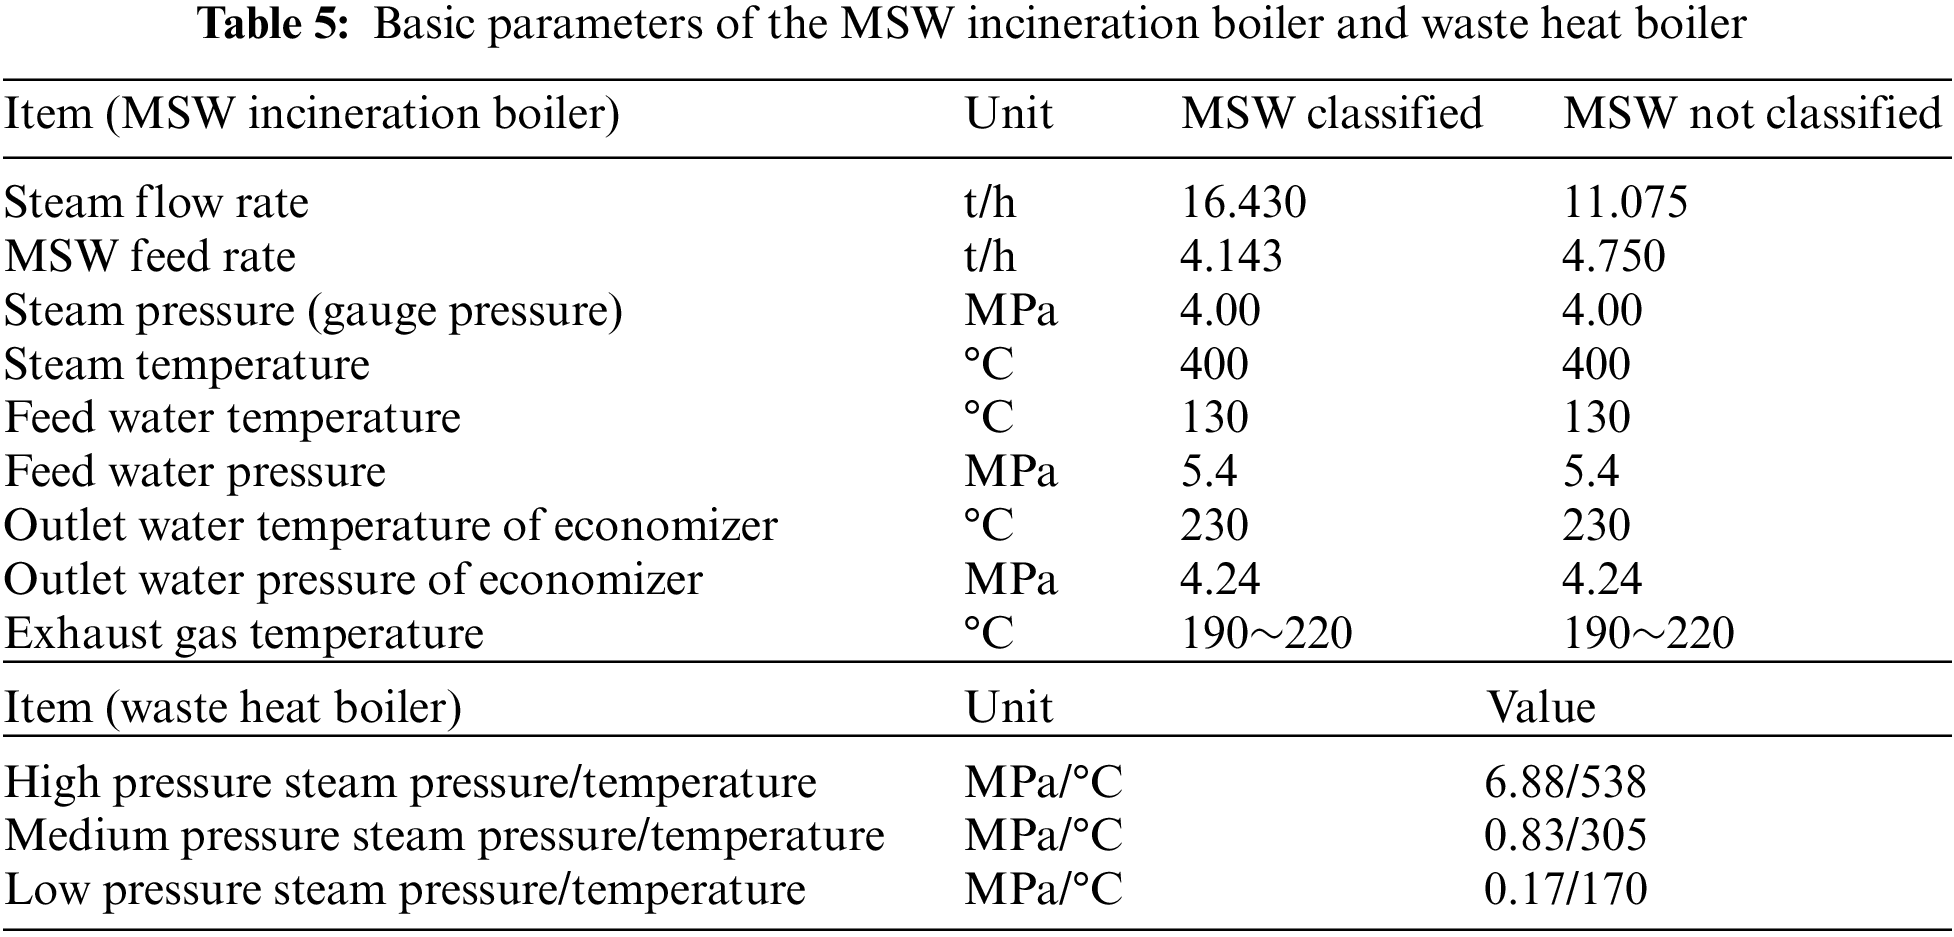
Considering the operational safety of the MSW incineration boiler, the exhaust flue gas temperature should be controlled below 220°C. Compared with the MSW that is not classified, the MSW that is classified has a higher calorific value, so the flue gas temperature is higher. In order to control the exhaust temperature below 220°C, the steam flow rate of the incineration boiler with MSW being classified should be higher than that of MSW not being classified. The steam flow rate of this boiler was designed by selecting a universal and representative composition of feed waste (i.e., the mean value of the fluctuation range of the MSW components mentioned above) and the daily per capita MSW production (1.2 kg/d) of the area where the study was conducted. The waste heat boiler is sized according to the system load demand. The basic parameters of the MSW incineration boiler and the triple-pressure waste heat boiler are shown in Table 5.
The system model includes the following features and assumptions:
1. Complete combustion of all fuels entering the system;
2. 79% of the air is nitrogen and 21% is oxygen;
3. All LNG is converted to NG after cold energy utilization;
4. The LNG and NG components are pure CH4;
5. The hourly working condition of the system is a steady state process;
6. Kinetic energy and potential energy are neglected.
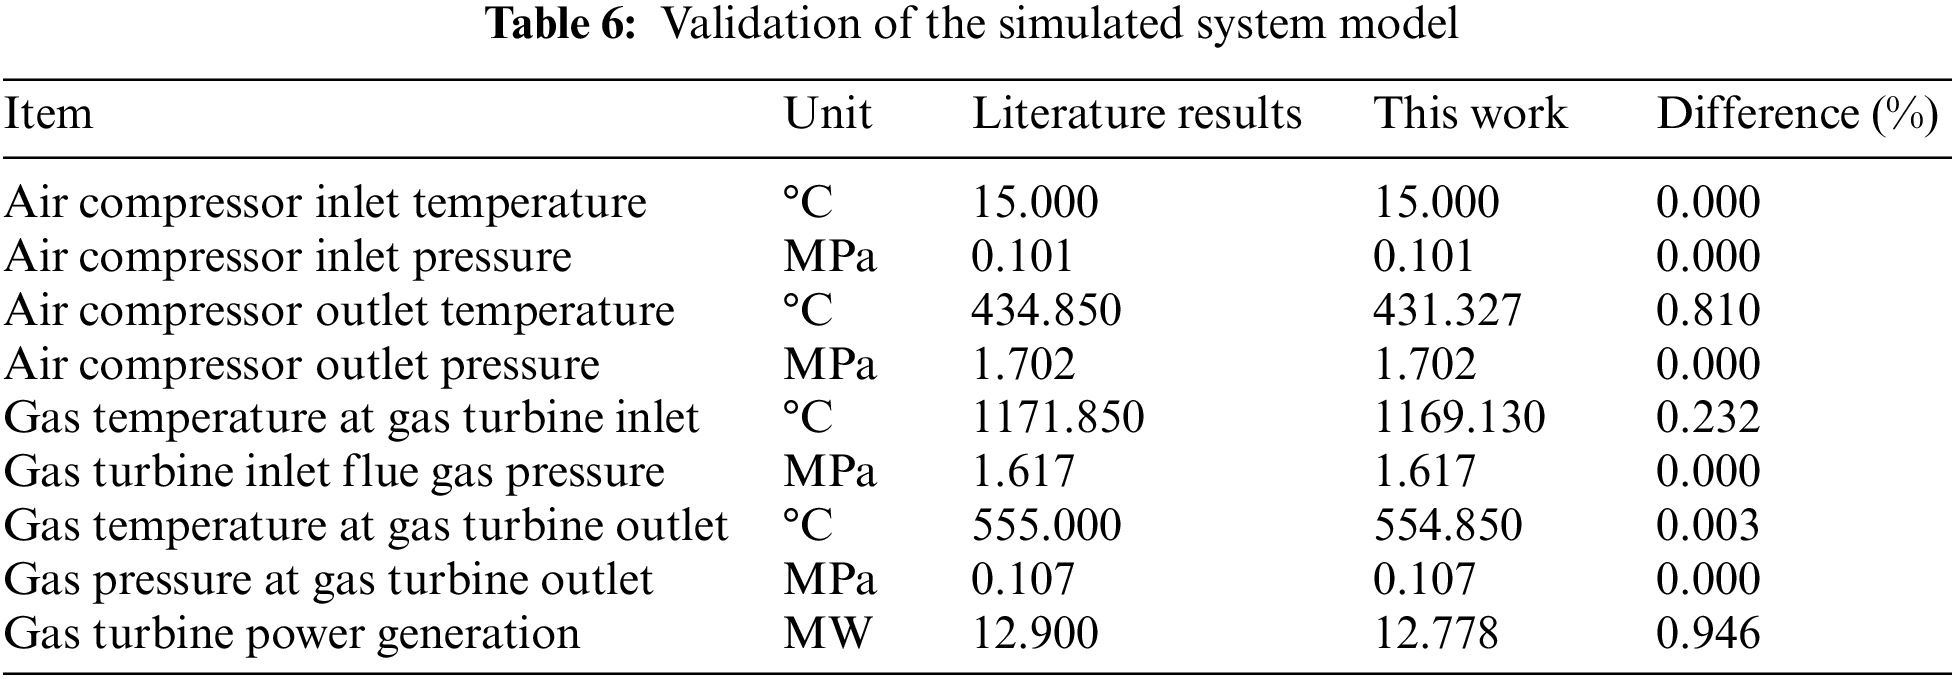
In this paper, a model of a small natural gas/hydrogen gas turbine system designed by Arsalis [25] was chosen to test the accuracy of the system. The inlet and outlet fluid states for the three processes of air compression, LNG combustion in the combustion chamber, and flue gas work in the gas turbine were verified, and the verification results are shown in Table 6. The results of the system in the literature running in the model built in this paper match well with the data in the literature with low errors within 1%. Therefore, it can be assumed that the proposed system is modeled within an acceptable level of accuracy.
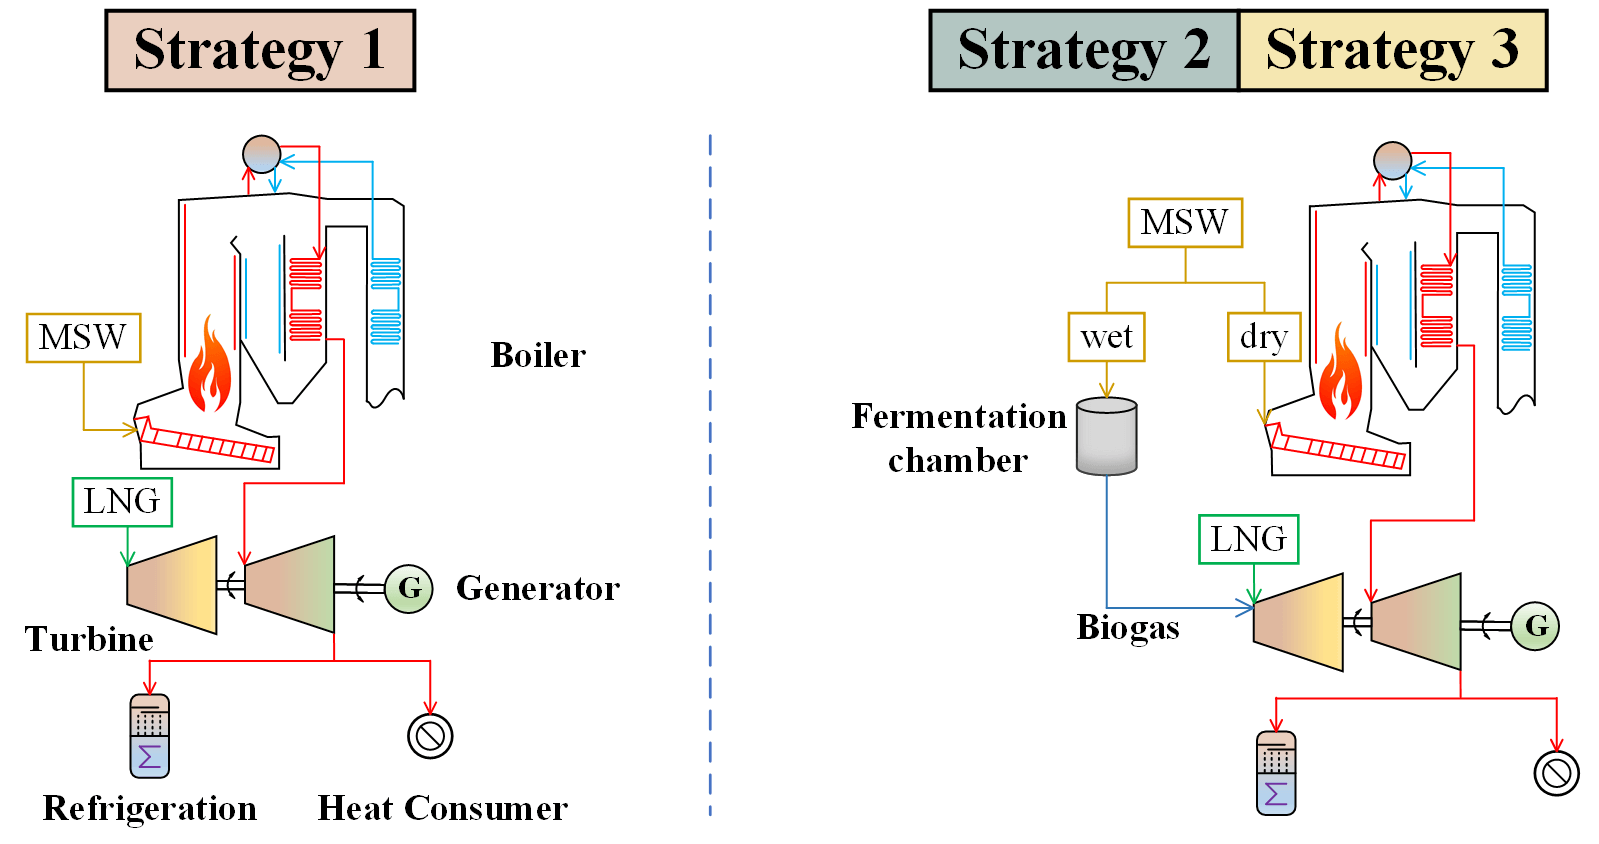
Based on the system established above, three annual hourly operating strategies are proposed based on the MSW treatment measures. The MSW strategies are divided into MSW classified and unclassified. In the unclassified strategy, all MSW is heated and dried and then incinerated, and the feed rate of MSW incineration is constant throughout the year. In the classified strategy, dry MSW is dried and incinerated in the MSW incineration boiler. The kitchen waste is used for fermentation to produce biogas, which is burned in the combustion chamber together with LNG. The dry MSW production is low, so they are all treated by centralized incineration in winter to meet the community heating demand. The system has lower requirements for kitchen waste production and less restrictions on the treatment strategy. Considering the higher power load in summer, a centralized summer fermentation strategy can be implemented for kitchen waste in addition to year-round fermentation treatment.
In summary, the following three operation strategies are proposed:
Strategy 1: MSW is not classified and incinerated throughout the year;
Strategy 2: MSW is classified, dry MSW is incinerated in winter, and kitchen waste is fermented throughout the year;
Strategy 3: MSW is classified, dry MSW is incinerated in winter, and kitchen waste is fermented centrally in summer.
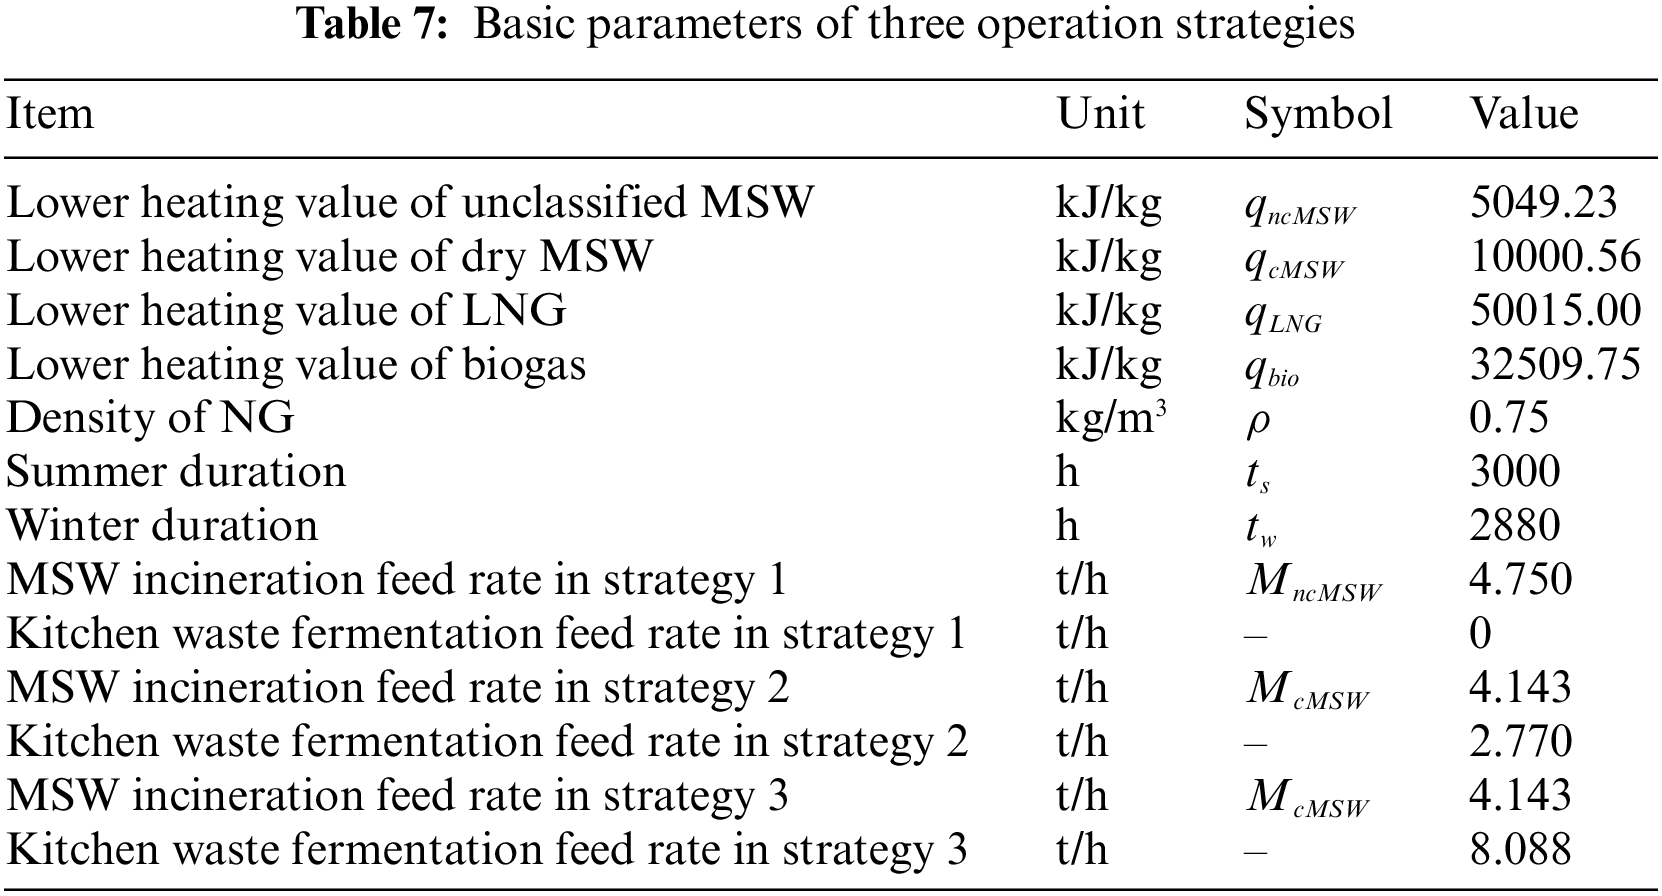
The basic parameters of the above three operation strategies are shown in Table 7.
In order to compare various factors such as energy saving, comprehensive energy utilization and unit output characteristics of the system, the thermoelectric ratio, net electrical efficiency, heating and cooling efficiency and energy utilization efficiency are taken as the thermal economy indicators, and the average value and hourly value of the thermal economy indicators are calculated for the year-round operation of the three strategies, respectively.
The thermoelectric ratio of the system measures the energy efficiency and the combined energy utilization. The average thermoelectric ratio of the system in winter, summer and total for both seasons is calculated by Eqs. (5) to (7), respectively.
where H is the hourly heating load of the system; E is the hourly power generation load of the system; C is the hourly cooling load of the system; and COP is the hourly coefficient of performance.
The equations for calculating the total annual system heat input for strategies 1, 2 and 3 are Eqs. (8) to (10), respectively.
where the units of Q1, Q2 and Q3 are all MW.
The net electrical efficiency, heating efficiency and cooling efficiency of the system reflect the output characteristics of the unit and are calculated using Eqs. (11) to (13) based on the cooling, heating and power loads of the system and the heat required to generate the corresponding loads, respectively.
where the numerator of ηe denotes the total annual power generation load; Qy denotes the total annual system heat input, MW; the numerator of ηh denotes the total winter heating load; Qw denotes the total winter system heat input, MW; the numerator of ηc denotes the total summer cooling load; and Qs denotes the total summer system heat input, MW. Qy, Qw, and Qs can all be calculated by Eqs. (8)–(10) according to their respective corresponding time periods.
The energy sources directly utilized by the MSW incineration boiler and combustion chamber in the multi-generation system are MSW, LNG and biogas, and the energy they contain is calculated by Eqs. (14) to (16), respectively.
where MMSW, MLNG and Mbio denote the mass flow rate of MSW, LNG and biogas, respectively, t/h; the unit of Q is MW.
The energy utilization efficiency reflects the energy use efficiency of the unit, and the calculation equation is as in Eq. (17).
where Qx denotes the heat year-round input to the system, MW, strategies 1, 2 and 3 are Q1, Q2 and Q3, respectively.
The total expenditure for stable operation of the system throughout the year is calculated by Eq. (18).
where pro is the total expenditure, RMB; pr1 is the unit price of LNG, RMB/kg; MLNG is the flow rate of LNG, t/h; pr2 is the unit price of electricity, RMB/kWh; E0 is the hourly demand power load of the research object, MW; pr3 is the unit price of heating, RMB/kWh; H0 is the hourly demand heating load of the research object, MW; C0 is the hourly demand cooling load of the research object, MW; pr4 is the unit price of NG, RMB/m3; MNG is the mass flow rate of NG for commercial sale, t/h.
5.1 LNG Accumulation Consumption
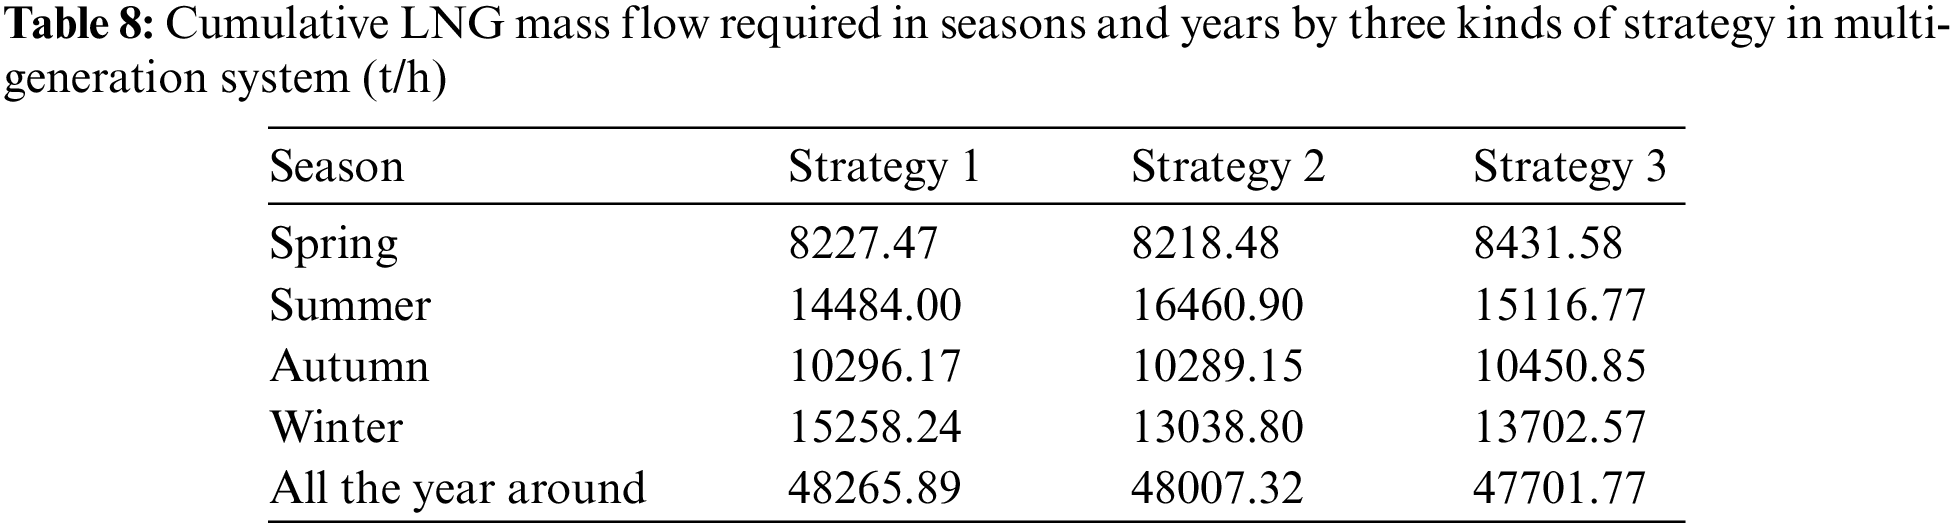
The multi-generation system operates by determining power by heating load based on the hourly cooling, heating, and power demand loads of the community, and the hourly required LNG flow rate of the community was calculated. The three strategies are simulated to operate hourly for 8760 h (i.e., one year) in the proposed multi-generation system, and the cumulative amount of LNG required for each of the three strategies in each season and throughout the year is counted, as shown in Table 8. In spring and autumn, strategy 3 only burns LNG, so total LNG demand is highest. In summer, strategy 3 ferments all kitchen waste and produces a large amount of biogas, so the demand for LNG is less; because the system of strategy 1 is different and it operates by determining power by heating load in the summer, less LNG is required to supply the same amount of heat compared to strategies 2 and 3, but less power is generated and the electrical load is lower than the community demand power, so strategy 1 requires the purchase of more power load for summer operation. In winter, strategies 1 and 3 both incinerate MSW and only strategy 2 ferments and produces biogas, so the demand for LNG is the least. Taken together, strategy 3 requires the least amount of total LNG throughout the year.
The unit prices of commercially sold LNG and NG fluctuate, so the effect of the unit prices of LNG and NG on the total expenditure of system operation was explored. Combining Eq. (17) yields a diagram of the variation of total expenditures for the three strategies of the system at different LNG and NG unit prices, as shown in Fig. 4. In the coordinates of Fig. 4, the total expenditure, NG unit price and LNG unit price for each strategy should form a surface. The total expenditure for system operation is closer for the three strategies when the unit prices of LNG and NG are the same. Therefore, for clear representation, multiple lines are used instead of a surface: the range of unit price of NG is 2.6~4.2 RMB/kg with an interval of 0.2; the range of unit price of LNG is 4~8 RMB/kg with an interval of 0.5.

Figure 4: Total annual operating expenditure of the system
As shown in Fig. 4, overall, the treatment operation strategy of MSW being classified, kitchen waste being fermented centrally in summer, and the rest of the waste being incinerated in winter (i.e., strategy 3) is economically optimal. As the unit price of NG increases and the unit price of LNG decreases, strategy 3 has the best economy, and the superiority of strategy 3 becomes more and more obvious under this trend, with the lowest total annual expenditure of 2.7730 × 10⁸ RMB. Strategy 3 has the best economy when the unit price of LNG is higher than 2.061 times the unit price of NG plus 1.557 RMB.
5.3 Annual Average Thermal Economy Analysis
The average thermoelectric ratios of the system in winter, summer and both seasons under the three strategies are shown in Fig. 5. In winter, the power load demand of users is low and the heating load demand is high, so a higher system thermoelectric ratio can better meet the users’ demand; while in summer, there are more peak periods of electricity consumption, and it is known from Table 1 that the cooling supply in residential areas is electric cooling, and the area of this part of the building type is larger, so a lower thermoelectric ratio in summer will be beneficial to meet the users’ demand. From Fig. 5, it can be concluded that strategies 2 and 3 (i.e., the operation strategies in which MSW is classified) are more in line with customer needs. Analyzed from the point of view of annual operation, the total year-round heating load is certain because the system operates by determining power by heating load, while the heating load of the units in spring and autumn is zero, i.e., the total heating load in winter and summer is a constant value. From Eq. (7), it is clear that the higher the power generation load, the lower the average thermoelectric ratio in winter and summer and the better the thermal economy of the system when it provides the same amount of heat to the community. The same conclusion of better thermal economy of the operation strategy for MSW being classified can be drawn from Fig. 4.

Figure 5: Annual average thermoelectric ratio diagram of three strategies
Based on the operating results, it is possible to calculate the average net power efficiency, energy utilization efficiency for the system operating with the three strategies throughout the year, as well as the average heating and cooling efficiencies for winter operation and summer operation, respectively, and the results are shown in Fig. 6. Strategies 2 and 3 ferment kitchen waste and produce biogas with a higher heating value than MSW that is not classified, effectively regulating the demand for LNG during low load operation of the unit, so both have a higher energy utilization efficiency than strategy 1. The system operates at high power loads more often during summer, and strategy 3 ferments more kitchen waste than strategy 2 during that season, and has a better ability to cope with high power load conditions, so strategy 3 has a higher net power efficiency. The power load is lower in winter time, when a large amount of steam does not flow into the low-pressure cylinder to do work, but flows into the heat consumers and backpressure heating. The difference between the heating loads of the three strategies at the maximum power load operating condition is small, while strategy 3 has a higher heating load than the other two strategies when operating at the minimum power load operation, so strategy 3 has a better heating capacity and higher heating efficiency. During summer, both strategies where MSW is classified have biogas production, which has a much higher heating value compared to the strategy where MSW is not classified, resulting in a higher total heat input to the system during summer and thus a lower cooling efficiency.

Figure 6: Figures of average net power efficiency, heating efficiency and cooling efficiency of the three strategies in each period
5.4 Hourly Thermal Economic Analysis
The output characteristics of the system vary from season to season due to the different types of community customer demand loads in each season. Therefore, it is necessary to analyze the hourly thermal economy of three operation strategies at different seasons. The system is only available for heating and cooling in winter and summer, so the heating and cooling efficiencies are not compared on hourly basis. The system has power load output throughout the year. In addition, the energy utilization efficiency can reflect the comprehensive output characteristics of the system, so the net power efficiency and energy utilization efficiency are selected as parameters for the hourly analysis. Hourly results have been simulated for 8760 h (i.e., one year) for both parameters, and the average values of the parameters for each season have been calculated based on all the data in order to compare the three strategies. Due to the large amount of data, only the 120 h hourly simulation results for typical operation conditions are shown in each figure.
5.4.1 Hourly Thermal Economic Analysis in Winter
The 120 h hourly net power efficiency and energy utilization efficiency for the three strategies in winter operation are shown in Fig. 7, and the data show a clear periodicity with a period of about 24 h. The average net power efficiency and average energy utilization efficiency for strategies 1, 2 and 3 are 55.91%, 54.00% and 53.98%, respectively, and 86.61%, 86.63% and 86.68%, respectively, for the whole winter. As labeled in Fig. 7. The net electrical efficiency of strategies 2 and 3 is lower than that of strategy 1, while the difference in energy utilization efficiency between the three is small, reflecting the excellent heating capacity of the MSW classified system at low loads.

Figure 7: Hourly efficiency of three strategies in winter
With the time change, the temperature will change accordingly, so the community power and heating load in winter will produce peaks and troughs with large fluctuations. The low load operation points of the three strategies in winter were counted, and the values of both the power supply load and the heating load were obtained to have troughs at 0~6 and 12~18 every day, which is the time period where the points marked by red dots in the net electrical efficiency diagram are located. When the system is operated at low load, the MSW incineration boiler’s power generation share rises, the gas turbine does work with low efficiency, and the waste heat boiler efficiency is also relatively low, so the overall power generation efficiency of the unit is low. Therefore, as the load of the unit decreases, the net electricity efficiency of the unit also decreases accordingly.
Fig. 8 shows the trend of system energy utilization efficiency with power load. When the system was operating under low load conditions, the flue gas temperature and mass flow rate generated by the waste heat boiler were not sufficient to dry MSW, and steam drying is required after using flue gas preheating. As the load increases, the flue gas temperature and mass flow rate can meet the demand for MSW drying, and steam is no longer needed to dry MSW. The effect of flue gas drying is better than steam drying, so at the electrical load of 27.113 MW, the primary energy utilization rate increases abruptly and a break point occurs. When the unit is operating at low load conditions, the heating capacity is much larger than the power generation capacity, mainly because the heating provided by the MSW incineration boiler side is relatively large, and the high-grade steam generated from the waste side is back-pressure heated after the secondary turbine, and most of the heat is effectively utilized, with higher heating temperature and less mechanical and heat losses. As the load increases, the percentage of work done on the waste side gradually decreases, the heating temperature decreases, and the mechanical heat loss increase relatively, so the energy utilization efficiency decreases with the increase of the power load before the break point appears. When the unit load reaches a certain degree, the overall energy utilization efficiency of the unit tends to be stable, and when the load is higher than 78.813 MW, the energy utilization efficiency of the unit shows a slowly increasing trend with the increase of load.
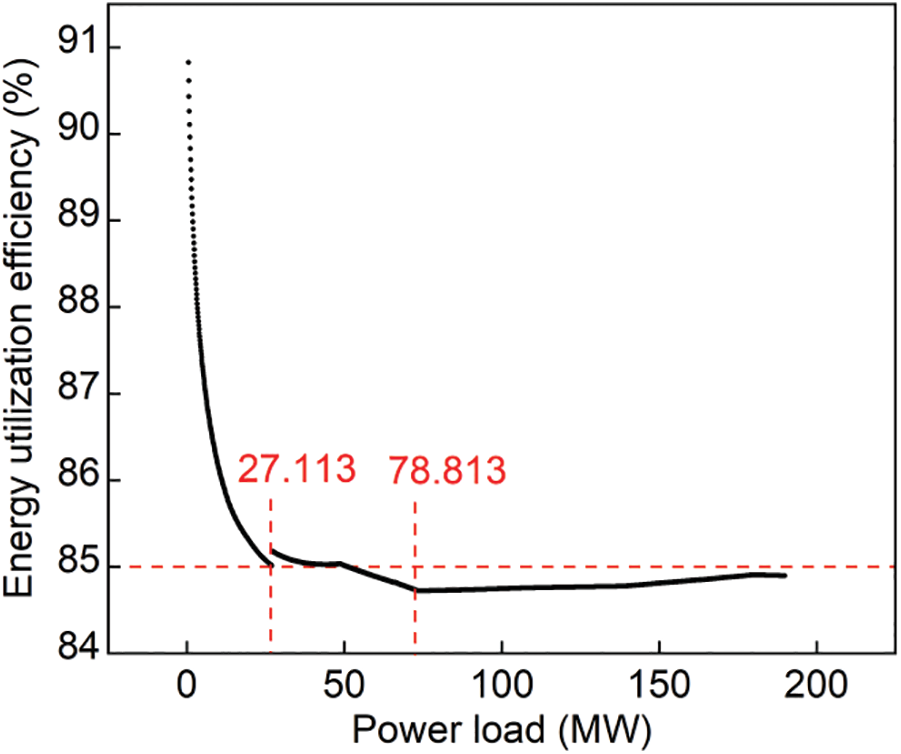
Figure 8: Figure of energy utilization efficiency vs. power load
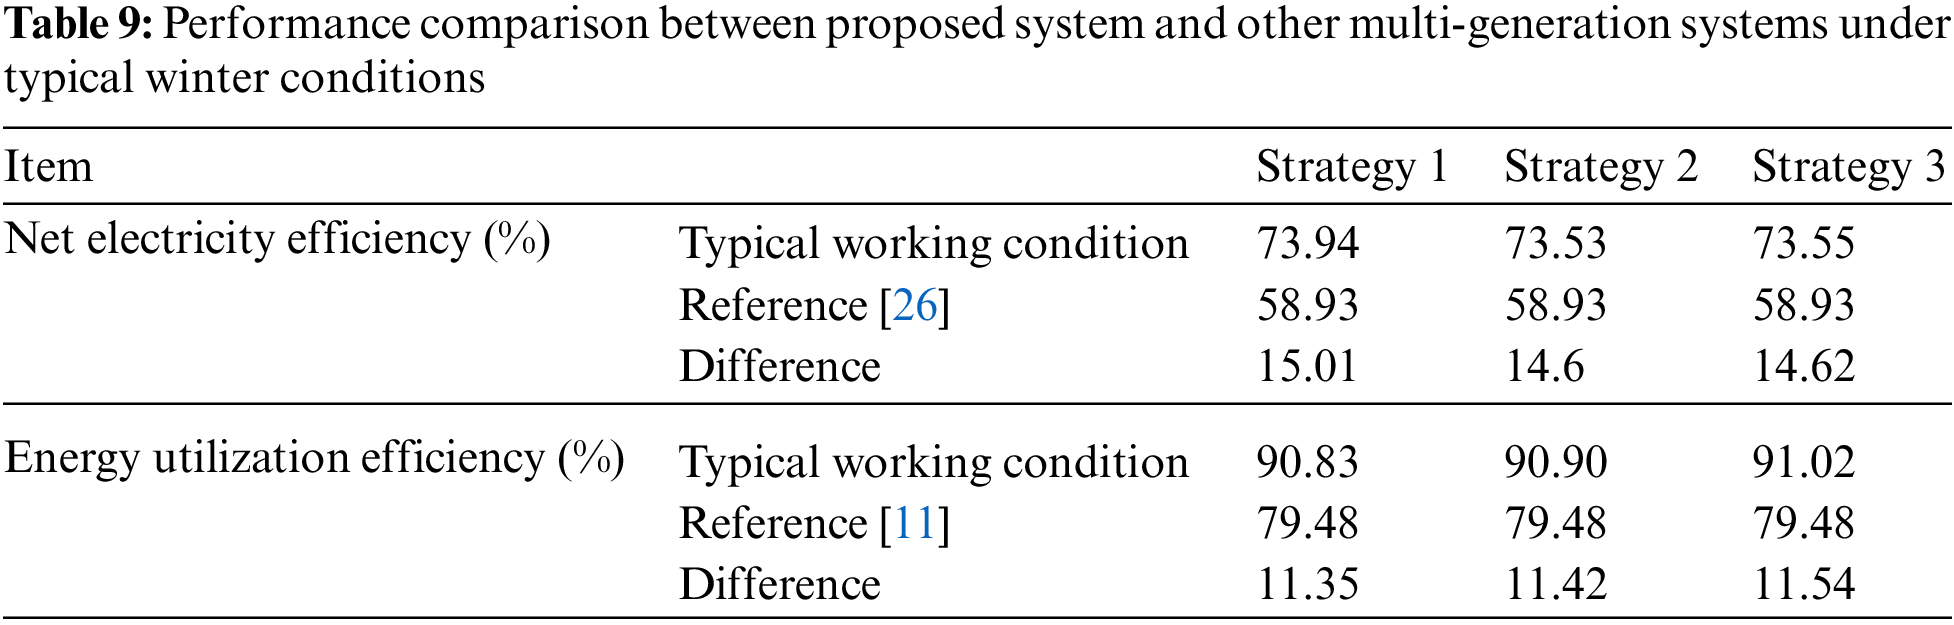
The system operating conditions in winter when the electrical and heating loads are at their maximum are defined as the typical conditions in winter. The net electrical efficiency of the high back-pressure heating process combined heat and power unit was analyzed in the literature [26] and was about 58.93%. The system operating conditions are similar to those in this paper for winter and summer, and the net electrical efficiency calculation method is also similar to this paper. In the literature [11], it is a combined cooling, heating and power system, and the comprehensive energy utilization in the paper is similar to the calculation method of primary energy utilization in this paper, and its value is about 79.48%. The average efficiency calculated in this paper for each season includes all operating conditions, including those where the load is close to 0. The operating conditions are not the same as those in the references, so the thermal economy parameters in the references are compared with those in this paper for typical operating conditions. The comparation of the parameters of the system in this paper and in the reference are shown in Table 9. The net electrical efficiency and energy utilization efficiency of the system based three different strategies are 14.6%–15.01% and 11.35%–11.54% higher than those of other systems when the unit is operated under typical operating conditions.
5.4.2 Hourly Thermal Economic Analysis in Summer
The net power efficiency and energy utilization efficiency for the 120 h hourly operation of the three strategies in summer are shown in Fig. 9, and the data also show a clear cyclicality. The average net power efficiencies for strategies 1, 2 and 3 are 59.61%, 62.62% and 63.15%, respectively, and the average energy utilization efficiency is 71.96%, 73.08% and 73.17%, respectively, throughout summer, as indicated in the figure. The community has a higher power load demand in summer. Strategy 3 also has a higher energy utilization efficiency than the other two strategies while ensuring a higher net power efficiency. The reason is that when the system operates with strategy 3, all kitchen waste is fermented in summer, thus more biogas with high calorific value can be obtained, which can better meet the power and cooling demand of customers under high load conditions. As the temperature changes, so does the community’s demand for cooling load. In colder climates, both the community's power load and cooling load produce peaks, so it is necessary to analyze the hourly efficiency of system operation.

Figure 9: Hourly efficiency of three strategies in summer
Similarly for the system summer low power load statistics, the system low power and cooling load operation conditions are mainly concentrated at 0~4 and 14~18 every day, which is the time period where the interval marked by red dots in the volume chart is located. The peak of the cooling load demand is concentrated at 18~23 o’clock, when the community residents return to their residence and the community cooling load demand increases. The net electrical efficiency varies with load in summer in the same pattern as in winter, i.e., as the load rises, the net electrical efficiency increases. However, the energy utilization efficiency follows the opposite pattern as in winter, which is due to the COP of the lithium bromide absorption refrigeration units used in the system. An increase in the load of the system leads to an increase in the low temperature heat source supplied to the lithium bromide absorption refrigeration unit, and thus the absorber load of the refrigeration unit rises, and the COP increases with the increase in absorber load. As can be seen from Fig. 10, as the load rises, the COP of the refrigeration unit rises accordingly. When the system is operated under low load conditions, the COP is correspondingly low, so the energy utilization efficiency is also correspondingly low.
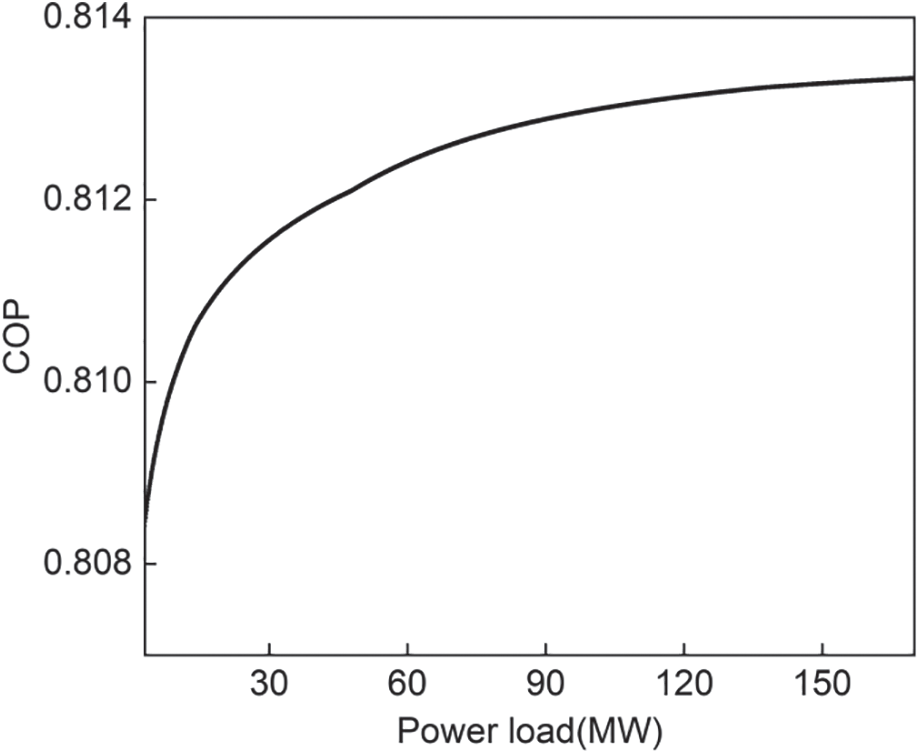
Figure 10: Figure of COP vs. power load
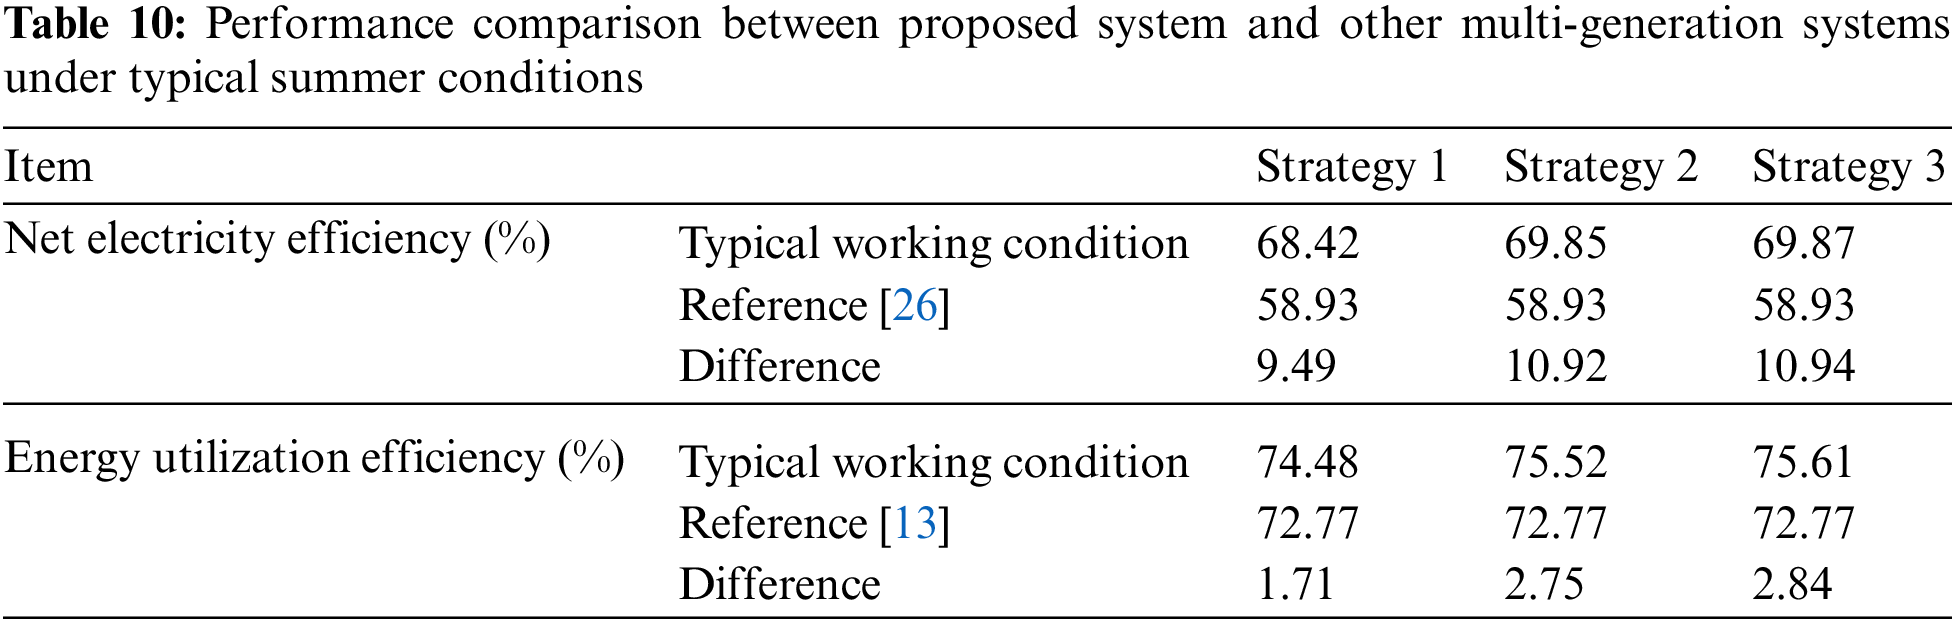
The operating conditions of the system during summer when the power load and the cooling load are maximum are defined as the typical operating conditions in summer. The calculation of the thermal efficiency of the proposed combined cooling, heating and power system in the literature [13] is similar to that of this paper in terms of primary energy efficiency and the type of load for the operating conditions. The typical operation conditions of the system in this paper in summer are compared with other multi-generation systems in terms of thermal economy, as shown in Table 10. The efficiency of the typical conditions of this system is much better than other multi-generation systems, and the net electrical efficiency and energy utilization efficiency of the system operating under the three strategies are 9.49%–10.94% and 1.71%–2.84% higher than those proposed in other literature, respectively, which proves that the system proposed in this paper has a large energy saving potential.
5.4.3 Hourly Thermal Economic Analysis in Spring and Autumn
The community has no heating or cooling load demand in the spring and autumn, and the units operate purely condensing. The community’s power load demand is certain for both seasons, and the energy utilization efficiency and net power efficiency of the system are equal. Fig. 11 shows the hourly efficiency of the system operating with each of the three strategies in the spring and autumn. The average net electric efficiency for strategies 1, 2 and 3 in spring and autumn are 40.16%, 41.71% and 42.36%, respectively, as marked in the figure, and again the highest average efficiency is achieved for strategy 3. The low load time periods of the system during spring and autumn were also counted, roughly distributed in the time interval 0~7 and 11~16, i.e., the time periods where the points marked by red dots in the net electricity efficiency diagram are located; the community electricity load demand increases at 7~8, and the load demand is relatively high in the rest of the time periods. The trend of power load in spring and autumn is different from that in winter and summer due to the use of air conditioning for heating in commercial areas in winter and air conditioning for cooling in residential quarters and villas in summer, i.e., the presence of electric heating and electric cooling in the community. The trend of net electrical efficiency with electrical load in spring and autumn is the same as that in winter and summer, with a correspondingly lower net electrical efficiency when the power load is lower.

Figure 11: Hourly net electricity efficiency of three strategies in spring and autumn
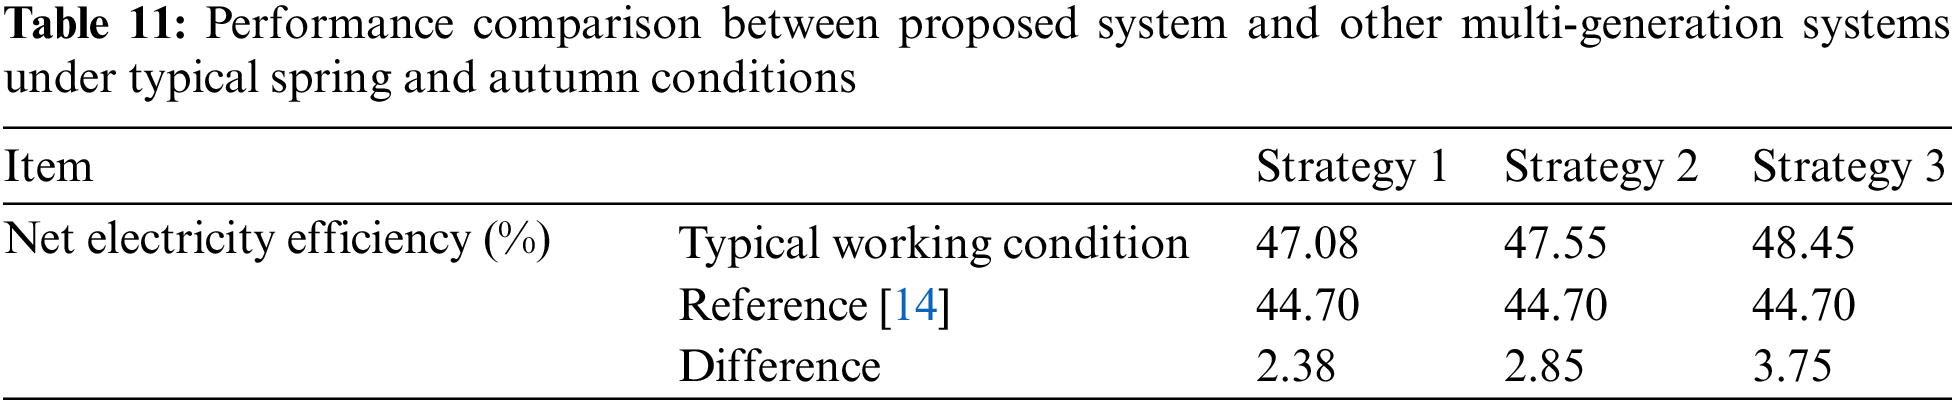
Similar to winter and summer, the operating conditions with the highest power generation load in spring and autumn are typical conditions. As described in the first part of this paper, only the generation load is available in the cycle of literature [14] , which is similar to the operating conditions of the system in spring and autumn in this paper, and the thermal efficiency calculation method in the paper is similar to the electrical efficiency in spring and autumn. The parameters of the proposed multi-generation system operating with three strategies were compared with the system proposed in the literature, as shown in Table 11, and the net power efficiency was improved by 2.38%–3.75%, proving that the power generation capacity of the system in this paper is better than other multi-generation systems.
A model of a combined cooling, heating and power system fueled by MSW and LNG is proposed, and it is classified and utilized based on the constituent components of MSW. The system consists of MSW disposal subsystem, turbine subsystem, gas turbine subsystem and refrigeration subsystem with the capability of supplying power, cooling and heating to a large community. The system model was validated against data from other literature, and the results showed good agreement between the model and the reference data. Three year-round hourly operation strategies are proposed on the basis of the proposed system, and the three strategies are analyzed for year-round and hourly thermal economy. Overall, the strategy of MSW being classified as centralized summer fermentation of kitchen waste (strategy 3) was more economical and thermally efficient. The main conclusions drawn from this work are summarized as follows:
(1) MSW being classified and treated can reduce the LNG demand of the system, mainly due to the high heating value of the biogas produced by kitchen waste fermentation. Strategy 3 has the lowest total annual LNG requirement of 47701.77 t.
(2) In the range of market prices of LNG and NG, overall, the total year-round expenditure of the system operating with strategy 3 is the lowest. The higher the price of NG and the lower the price of LNG, the higher the difference between the total year-round expenditure of strategy 3 and the other two strategies. The lowest total year-round expenditure of strategy 3 is 2.7714 × 10⁸ RMB for LNG market price at 4 RMB/kg and NG market price at 4.2 RMB/kg.
(3) The average thermoelectric ratio for winter and summer seasons for strategies 1 to 3 are 155.95%, 147.73% and 148.61%, respectively, and the MSW classified strategy generates more electricity for the same amount of heat supply. The data of thermoelectric ratio in winter and summer as well as the net electricity, heating and cooling efficiency can also reflect that the MSW classified strategy is more in line with the load demand of customers in each season. Among the strategies in which MSW was classified, strategy 3 had a 0.3% higher energy utilization efficiency than strategy 2, indicating that strategy 3 can use energy more efficiently.
(4) From the hourly data, it is clear that the thermo-economic parameters of the system are more significantly influenced by the load. As the power, cooling and heating loads of the system increase in the corresponding seasons, the percentage of work done by the gas turbine increases, and the net electrical efficiency of each season increases accordingly. However, when the unit operates at low load in winter, most of the heat is effectively utilized, the mechanical and heat losses are less, and the energy utilization efficiency is high. In summer, the higher the load, the higher the energy utilization efficiency, since the COP of the refrigeration unit increases with the load. Comparing the simulation results with other literature on multi-generation systems, the results show that the multi-generation system proposed in this paper has greater thermal efficiency and energy saving potential than other multi-generation systems.
Funding Statement: The authors acknowledge the financial support provided by the Nature Science Foundation of Shandong Province (ZR201709180049) and the Shandong Key Research and Development Program (2019GSF109023).
Conflicts of Interest: The authors declare that they have no conflicts of interest to report regarding the present study.
References
1. Ding, Y., Zhao, J., Liu, J. W., Zhou, J. Z., Cheng, L. et al. (2021). A review of China’s municipal solid waste (MSW) and comparison with international regions: Management and technologies in treatment and resource utilization. Journal of Cleaner Production, 293(10), 126144. https://doi.org/10.1016/j.jclepro.2021.126144 [Google Scholar] [CrossRef]
2. AlQattan, N., Acheampong, M., Jaward, F. M., Ertem, F. C., Vijayakumar, N. et al. (2018). Reviewing the potential of waste-to-energy (WTE) technologies for sustainable development goal (SDG) numbers seven and eleven. Renewable Energy Focus, 27, 97–110. https://doi.org/10.1016/j.ref.2018.09.005 [Google Scholar] [CrossRef]
3. Zhou, X., Zhou, P., Zhao, X. Q., Song, Z. L., Wang, W. L. et al. (2021). Applicability of municipal solid waste incineration (MSWI) system integrated with pre-drying or torrefaction for flue gas waste heat recovery. Energy, 224. https://doi.org/10.1016/j.energy.2021.120157 [Google Scholar] [CrossRef]
4. Vilardi, G., Verdone, N. (2022). Exergy analysis of municipal solid waste incineration processes: The use of O2-enriched air and the oxy-combustion process. Energy, 239, 122147. https://doi.org/10.1016/j.energy.2021.122147 [Google Scholar] [CrossRef]
5. Tang, Y. J., Dong, J., Li, G. N., Zheng, Y. Q., Chi, Y. et al. (2020). Environmental and exergetic life cycle assessment of incineration- and gasification-based waste to energy systems in China. Energy, 205(6), 118002. https://doi.org/10.1016/j.energy.2020.118002 [Google Scholar] [CrossRef]
6. Indrawan, N., Thapa, S., Bhoi, P. R., Huhnke, R. L., Kumar, A. (2018). Electricity power generation from co-gasification of municipal solid wastes and biomass: Generation and emission performance. Energy, 162(3), 764–775. https://doi.org/10.1016/j.energy.2018.07.169 [Google Scholar] [CrossRef]
7. Sahu, P., Prabu, V. (2021). Techno-economic analysis of co-combustion of Indian coals with municipal solid waste in subcritical and supercritical based steam turbine power generating carbon-negative systems. Energy, 233(6), 121053. https://doi.org/10.1016/j.energy.2021.121053 [Google Scholar] [CrossRef]
8. Cao, Y., Dhahad, H. A., Alsharif, S., Sharma, K., El-Shafay, A. S. et al. (2022). Development of a MSW-fueled sustainable co-generation of hydrogen and electricity plant for a better environment comparing PEM and alkaline electrolyzers. Sustainable Cities and Society, 81(5), 103801. https://doi.org/10.1016/j.scs.2022.103801 [Google Scholar] [CrossRef]
9. Chen, H., Li, J., Liu, J., Li, T. Y., Xu, G. et al. (2022). Thermodynamic and economic evaluation of a novel waste-to-energy design incorporating anaerobic digestion and incineration. Energy Conversion and Management, 252(1), 115083. https://doi.org/10.1016/j.enconman.2021.115083 [Google Scholar] [CrossRef]
10. Arsalis, A., Alexandrou, A. (2014). Thermoeconomic modeling and exergy analysis of a decentralized liquefied natural gas-fueled combined-cooling-heating-and-power plant. Journal of Natural Gas Science and Engineering, 21, 209–220. https://doi.org/10.1016/j.jngse.2014.08.009 [Google Scholar] [CrossRef]
11. Liu, Y., Han, J. T., You, H. L. (2019). Performance analysis of a CCHP system based on SOFC/GT/CO2 cycle and ORC with LNG cold energy utilization. International Journal of Hydrogen Energy, 44(56), 29700–29710. https://doi.org/10.1016/j.ijhydene.2019.02.201 [Google Scholar] [CrossRef]
12. Li, Y. Y., Liu, Y. J., Zhang, G. Q., Yang, Y. P. (2020). Thermodynamic analysis of a novel combined cooling and power system utilizing liquefied natural gas (LNG) cryogenic energy and low-temperature waste heat. Energy, 199(25), 117479. https://doi.org/10.1016/j.energy.2020.117479 [Google Scholar] [CrossRef]
13. Yang, X. Y., Zhao, H. B. (2019). Thermodynamic performance study of the SOFC-STIG distributed energy system fueled by LNG with CO2 recovery. Energy, 186(7), 115860. https://doi.org/10.1016/j.energy.2019.115860 [Google Scholar] [CrossRef]
14. Esfilar, R., Mehrpooya, M., Moosavian, S. M. A. (2018). Thermodynamic assessment of an integrated biomass and coal co-gasification, cryogenic air separation unit with power generation cycles based on LNG vaporization. Energy Conversion and Management, 157, 438–451. https://doi.org/10.1016/j.enconman.2017.12.026 [Google Scholar] [CrossRef]
15. Ghersi, D. E., Amoura, M., Loubar, K., Desideri, U., Tazerout, M. (2021). Multi-objective optimization of CCHP system with hybrid chiller under new electric load following operation strategy. Energy, 219, 119574. https://doi.org/10.1016/j.energy.2020.119574 [Google Scholar] [CrossRef]
16. Chu, W. F., He, W., Jiang, Q. Y., Zhang, S., Hu, Z. T. et al. (2021). Optimization of operation strategy for a grid interactive regional energy system. Energy and Buildings, 250(7), 111294. https://doi.org/10.1016/j.enbuild.2021.111294 [Google Scholar] [CrossRef]
17. China statistical yearbook, transport and disposal of municipal solid waste in different regions (2021). http://www.stats.gov.cn/sj/ndsj/2021/indexch.htm. [Google Scholar]
18. Li, M. Y., Zheng, Z. T. (2014). Property change of domestic waste and diversified transition of treatment technologies in Jinan. Environmental Sanitation Engineering, 22(4), 62–64. [Google Scholar]
19. Li, X. D., Lu, S. Y., Xu, X., Yan, J. H., Chi, Y. (2001). Analysis on caloric value of Chinese cities’ municipal solid waste. China Environmental Science, 21(2), 156–160. [Google Scholar]
20. Liu, X., Wang, W., Gao, X., Zhou, Y., Shen, R. (2012). Effect of thermal pretreatment on the physical and chemical properties of municipal biomass waste. Waste Manag., 32(2), 249–255. https://doi.org/10.1016/j.wasman.2011.09.027 [Google Scholar] [PubMed] [CrossRef]
21. Lu, J. W., Zhang, S., Hai, J., Lei, M. (2017). Status and perspectives of municipal solid waste incineration in China: A comparison with developed regions. Waste Manag., 69(9–11), 170–186. https://doi.org/10.1016/j.wasman.2017.04.014 [Google Scholar] [PubMed] [CrossRef]
22. Notice on issues related to heat price measurement of urban central heating (2017). http://www.jinan.gov.cn/art/2017/9/5/art_1812_214606.html [Google Scholar]
23. Notice on adjusting the sale price of non-resident pipeline gas in Jinan (2022). [Google Scholar]
24. Speeding up the transformation of coal-fired boiler in Jinan (2017). [Google Scholar]
25. Thermodynamic modeling and parametric study of a small-scale natural gas/hydrogen-fueled gas turbine system for decentralized applications (2019). Sustainable Energy Technologies and Assessments, 36, 100560. https://doi.org/10.1016/j.seta.2019.100560 [Google Scholar] [CrossRef]
26. Chen, H., Xiao, Y., Xu, G., Xu, J. D., Yao, X. H. et al. (2019). Energy-saving mechanism and parametric analysis of the high back-pressure heating process in a 300 MW coal-fired combined heat and power unit. Applied Thermal Engineering, 149, 829–840. https://doi.org/10.1016/j.applthermaleng.2018.12.001 [Google Scholar] [CrossRef]
Cite This Article
 Copyright © 2023 The Author(s). Published by Tech Science Press.
This work is licensed under a Creative Commons Attribution 4.0 International License , which permits unrestricted use, distribution, and reproduction in any medium, provided the original work is properly cited.
 Downloads
 Citation Tools