
 Submit a Paper
 Propose a Special lssue
 Open Access
ARTICLE
Distribution of Partial Arc Propagation Path on Insulator and Its Discrimination Method
1 School of Electronics and Information, Xi’an Polytechnic University, Xi’an, 710048, China
2 Shanxi Electric Power Limited Company, Electric Power Research Institute State Grid, Xi’an, 710100, China
3 School of Electrical Engineering, Southwest Minzu University, Chengdu, 610041, China
* Corresponding Author: Zhibo Song. Email:
(This article belongs to the Special Issue: Advances in Modern Electric Power and Energy Systems)
Energy Engineering 2023, 120(9), 2097-2113. https://doi.org/10.32604/ee.2023.029115
Received 01 February 2023; Accepted 06 April 2023; Issue published 03 August 2023
 View Full Text
 Download PDF
Abstract
Pollution flashover is one of the major insulation accidents that can occur in modern power systems. If the local arc is not sufficiently elongated by the creepage distance, the flashover performance of the insulator will decrease. The insulator structure and equivalent salt deposition density (ESDD) are the main factors affecting the arc path and length. To investigate the forms of arc paths under different insulator structures and their influence on flashover characteristics, a platform for recording arc paths is established. This study presents a method to identify the pattern and distribution of insulator arc paths based on the effect of initial arc on electric field distribution. The results show that there are two main types of local arc paths between umbrellas—the cling-surface arc and the air-jump arc. Moreover, the air-jump arc includes two types—the bridging arc and the gap arc. With the increase in umbrella spacing and ESDD, the probability of arc propagation along the surface increases. The use of the creepage distance can be improved by changing the creepage coefficient to increase the distance between umbrellas. This method has over 90% accuracy. This study is of great significance for improving insulator structure and reducing pollution flashover accidents.Keywords
The atmosphere contains pollutants that pose a threat to the insulation of electrical systems. Over time, pollutants form an irregular layer on the insulator surface, and in wet weather such as rain or snow, the pollution layer conducts electricity and generates leakage current. The thermal effect of the leakage current makes the pollution layer appear dry. Moreover, the electric field is distorted after the coronal discharge. Finally, an arc discharge occurs on the surface of the insulator, which develops into a flashover [1–4]. Since the reclosing probability of a pollution flashover accident is low, this type of accident greatly hinders power system operation. Unfortunately, there are still many problems in the study of pollution flashovers [2].
At present, the approaches to improving flashover performance mainly include increasing hydrophobicity, creepage distance, or dry arc distance [3,4]. Pollution flashover occurs mainly on the insulator surface, and the insulator structure has a large influence on the arc propagation. Related studies have shown that extending the creepage distance can increase the flashover voltage, but the effect is limited [5,6]. Kimoto et al. and Kawamura et al. conducted pollution flashover tests on post insulators and found that for insulators with a certain shape and average diameter, the flashover voltage was positively correlated with the creepage distance and negatively correlated with the average diameter [7,8]. Matsuoka et al. found that increasing the insulator diameter resulted in a greater creepage distance, which led to a higher flashover voltage [5]. However, increasing the insulator diameter is not favorable for space utilization. Researchers found that setting umbrella ribs on the lower side of the insulator can increase the flashover voltage [9]. However, Faselian et al. found that flashover voltage will be reduced if the insulator rib length is equal [10]. Therefore, when designing the insulator structure, both creepage distance and rib arrangement should be considered. IEC-60815 standard proposes to design the insulator structure based on creepage specific distance [11]. The concept of effective creepage distance was put forward by Merkhlev et al., and the flashover voltage gradient obtained by simple insulators was compared with that of insulators with complex structures [12]. Although the above studies have achieved great practical results, they have not addressed the rationality of the umbrella rib setup and the reduction of the flashover voltage with increasing creepage distance.
The creepage distance can be used as an index to evaluate the flashover characteristics of insulators, but whether the creepage distance under complex structures is effective still needs to be explored. The arc path between the insulator umbrellas is not consistent with the creepage distance, resulting in the insulator creepage distance not being effectively utilized during the flashover. Therefore, the flashover voltage will also be different when conducting multiple tests under the same conditions [13]. The length of the developed arc that clings to the insulator is greater than the length of the arc that jumps through the air. A longer arc requires higher voltage and energy, and when the applied power is insufficient, the arc will be extinguished, thus avoiding the occurrence of pollution flashover [14–16]. The umbrella structure, equivalent salt deposition density (ESDD), temperature, and humidity are factors that affect the randomness of the arc path, with the former two factors having the most influence. To explore the propagation law of the arc path, He and Gorur et al. conducted research on the basis of the partial arc propagation conditions proposed by Wilkins and Guan et al. [17–20]. The arc path on an insulator string has been predicted by simulations and numerical calculations, and the relationship between the flashover performance of an insulator string and the arc path has been tentatively studied. These studies have provided fundamental ideas for research, but there is a lack of research on arc path forms and probability distributions. Furthermore, no analysis of the effective creepage distance for insulator structures using arc path forms has been reported to date. In general, increasing the creepage distance is the most direct way to prevent flashover. However, studies have shown that a considerable part of the creepage distance fails during flashover. This will reduce the flashover voltage, which is not conducive to preventing pollution flashover. According to the arc behavior in the flashover process, it can be concluded that this failure is caused by the arc jumping between the insulator skirts. Although some researchers have studied arc paths of insulator strings, they have not detailed the forms of the arc paths, the reasons behind the development of different arc paths, or methods to avoid flashover voltage reduction due to arc paths.
In this study, the authors design an insulator test model without the umbrella rib structure based on a common suspension glass insulator. The insulator test model can accurately model the insulator structure parameters and is convenient for tuning. An arc path recording test platform is constructed between the umbrellas according to the pollution flashover test criteria. Experimentally, the propagation forms and probability distributions of arc paths for different creepage coefficients are obtained. Based on electric field simulations and numerical calculations in COMSOL, the authors propose a criterion for the form of the arc path between umbrellas. This study can be used as a fundamental theory to assess the validity of the insulator creepage distance.
2 Arc Path Observation Test between Umbrella Skirts
Glass insulators have excellent properties, simple structures, and wide applications. The study of the relationship between the umbrella structure and the arc path forms of glass insulators can be extended to different types of wire insulators. In this study, the experimental model is established with reference to the glass suspension insulator, which can reflect the performance of the suspension insulator to a large extent [10,21,22]. The glass suspension insulator is used as a reference to design an insulator test model to realize the fidelity of the actual insulator structure and to highlight the regularity of the arc propagation path between the umbrellas. The authors consider the effects of the main structural parameters of the insulator, such as the umbrella extension and the umbrella spacing, on the arc path. The hardware and the structure of the umbrella ribs are ignored. Fig. 1 shows a schematic diagram of the insulator test model. The length and width of the upper and lower glass plates are 50 and 20 cm, respectively, to simulate the upper and lower umbrella skirts of the insulator. The vertical glass plate in the middle plays the role of connection and support. The glass is bonded with glass adhesive to prevent partial discharge [23]. Adjusting the height of the vertical glass plate between the umbrellas shifts the umbrella spacing of the insulator test model. The authors set insulator structures with 3-, 5-, 7-, and 10-cm umbrella spacing, and the creepage distance coefficients δCF [21] are 6.33, 4.2, 3.29, and 2.6, respectively. The electrodes at both ends of the test object are made of a 2-mm triangular thin steel sheet, which is close to the surface of the insulator test model. This makes the arc develop more easily and avoids the influence of the electrodes on the arc path.
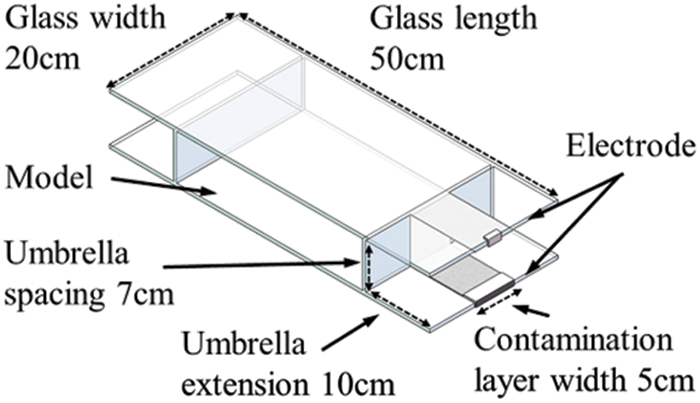
Figure 1: Insulator test model when δCF is 3.29
2.2 Voltage Application and Arc Path Recording Platform
Fig. 2 shows the arc path recording test circuit and main equipment. The transformer is a YWDT-200 kVA/200 kV non-partial discharge test transformer. The voltage regulator is a TYDZ-200 oil-immersed self-cooling column type, with rated capacity of 200 kVA and output of 0–420 V. The rated voltage of the voltage divider is 200 kV, the voltage divider ratio is 988:1, and the partial discharge at 200 kV is lower than 3 pC. The high-voltage end of the voltage divider is connected to the high-voltage electrode of the insulator test model, and the voltage of the transformer is controlled by the voltage regulator. The transformer and the voltage divider are fixedly connected by a high-power resistor. The voltage application platform equipment and wiring meet the IEC-60507 standard [24]. The high-speed camera recording system is used to continuously record the arc propagation path between umbrellas. The high-speed camera model is AMETEK-PhantomVEO, and the shooting speed is 1000 fps. An uninterruptible power supply is used to supply power to the high-speed camera to avoid the hazard of ground potential rise.
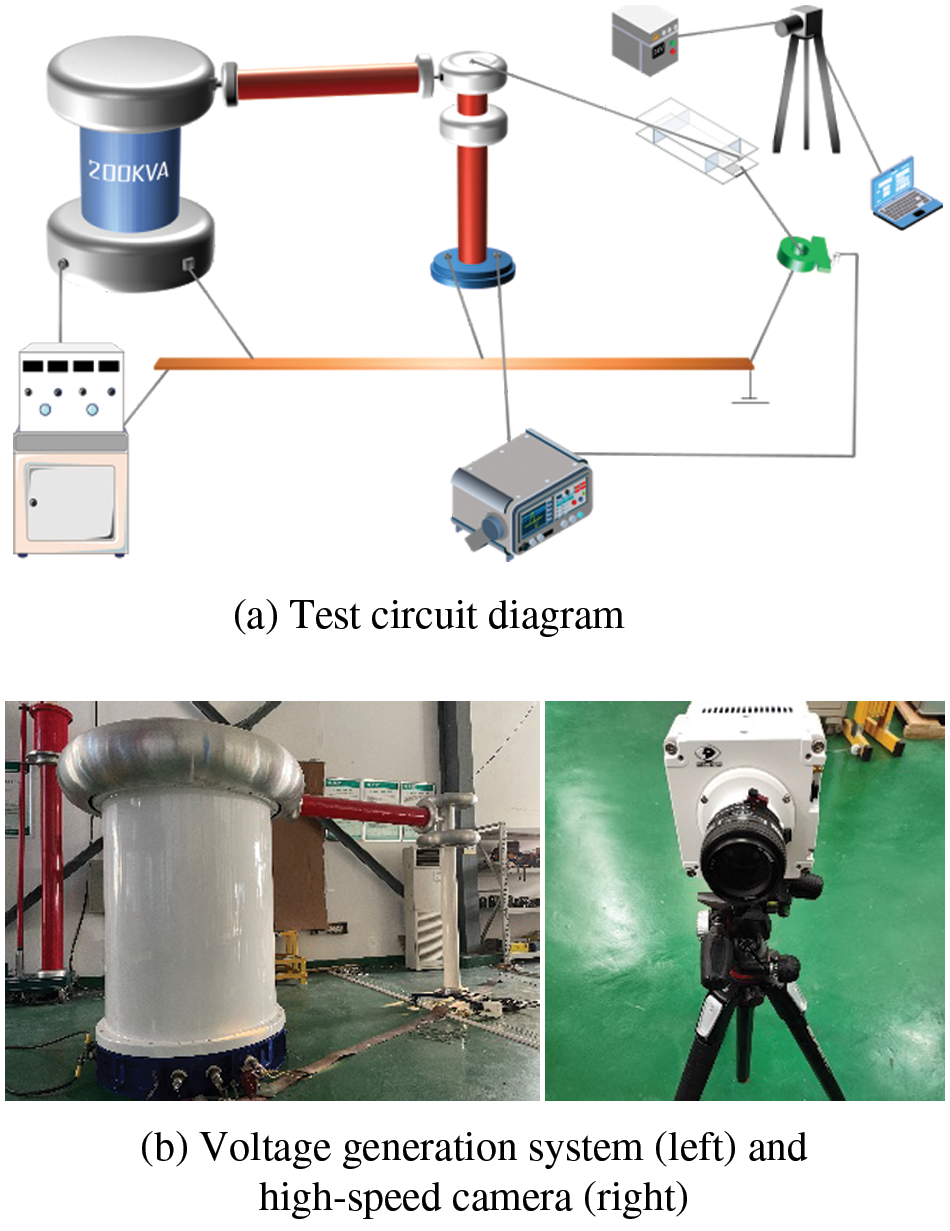
Figure 2: Test circuit and main equipment
The pollutants (NaCl and Kaolin) are weighed by a precision electronic balance, and deionized water is used as a solvent to produce the pollutant solution [24]. The pollutant solution is uniformly applied to the narrow band region specified by the glass to simulate a pollution layer. Then the insulator test model is dried naturally for 6–8 h. The ESDD is set to 0.01, 0.1, and 0.2 mg/cm2, respectively, and the ash density is set at 1 mg/cm2 uniformly.
As shown in Fig. 1, the pollution layer is set as a narrow band to reduce the transverse extension of the arc between the umbrellas and make the arc develop along the direction of the creepage distance of the insulator. The narrow band width of the pollution layer is 5 cm, including the lower surface of the upper umbrella skirt, the surface of the vertical glass, and the upper surface of the lower umbrella skirt.
The insulator test model is a single model with short flashover time, and there will be no excessive propagation of arc. The narrow band design of the pollution layer avoids the effect of repeated discharges on the arc path. The authors adopt the quantitative spraying method to dampen the pollution layer [23]. This method offers convenient operation and can avoid the influence of repeated discharge on the arc path, resulting in small dispersion. The speed of the voltage rise can affect the partial discharge outside the main arc column, resulting in inaccurate arc paths. To prevent the experimental processes from influencing the results, the voltage rise rate is set to 2 kV/s in this study [21].
3 Arc Path Form and Probability Analysis between Umbrellas
3.1 Analysis of the Propagation Path of Partial Arc
The form of the arc propagation path between the umbrellas is related to the structure of the insulator, so it is necessary to focus on the propagation state of the arcs on the surface of the umbrella skirt and in the space between the umbrellas. The arc propagates to the flashover in different paths. The arc propagation speed at different locations is diverse because of the pinch force of leakage current, the thermal buoyancy caused by temperature difference, and the diffusion of charged particles [25,26]. A low voltage makes the initial arc develop slowly. A reasonable insulator structure makes it possible for the arc to fully develop into a flashover along the surface, and ensures the creepage distance is effectively utilized. However, arc jumping between the sheds will short out most of the insulator structure used to increase the creepage distance, so flashover will be more likely to occur. The main arc path forms are as follows:
(1) Cling-surface arc
The voltage is low and the arc propagation speed is slow at the beginning of the experiment. Thus, the arc stays close to the insulator surface. When the applied voltage and time reach a certain level, the propagation speed of the arc will rapidly increase. Fig. 3 shows the arc propagation image. The length of this arc during flashover can be extended by increasing the creepage distance.
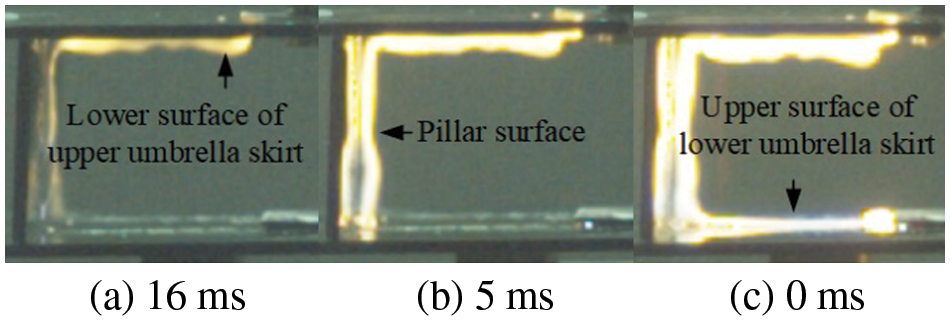
Figure 3: Propagation of cling-surface arc. The labels of (a), (b), and (c) are the time intervals from the flashover
(2) Air-jump arc
If the creepage distance is not effectively utilized during the flashover process, air arcing will occur. The arc length is short and the propagation speed is very fast. There are two subtypes of the air-jump arc.
(a) Air bridging arc
The air bridging arc develops along the lower surface of the upper umbrella skirt for a period of time, and then transfers to the air for propagation. An air bridging arc that develops on the surface is slower, whereas one that develops in the air is faster. The arc connects the upper and lower umbrella skirts of the insulator, which are stabilized in the air like a bridge. The internal space of the umbrella skirt loses its function as the creepage distance, and the overall creepage distance will be shortened, as shown in Fig. 4. After the high-voltage end of the arc is generated, it develops along the lower surface of the upper umbrella skirt and then propagates into the air.
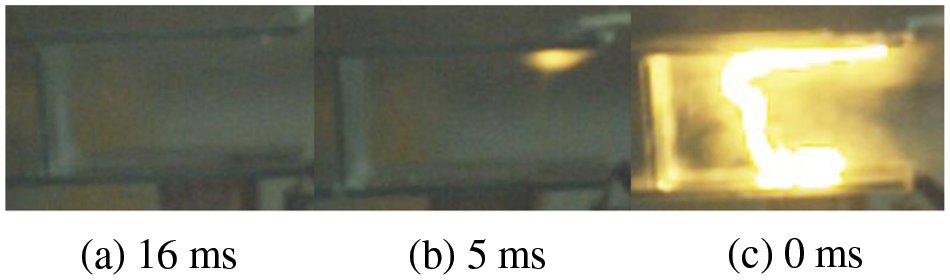
Figure 4: Propagation of air bridging arc
(b) Air gap arc
An air gap arc short-circuits the upper and lower umbrella skirts by bridging. Even though the applied voltage has reached the estimated flashover voltage, the arc still penetrates the air between the upper and lower umbrellas, forming a discharge channel. As shown in Fig. 5, the arc is connected in the gap space of the umbrella skirt. The internal creepage distance of the insulator completely fails due to the bridge of the arc. The arc develops rapidly in the air, and the flashover is completed within 1–2 ms.
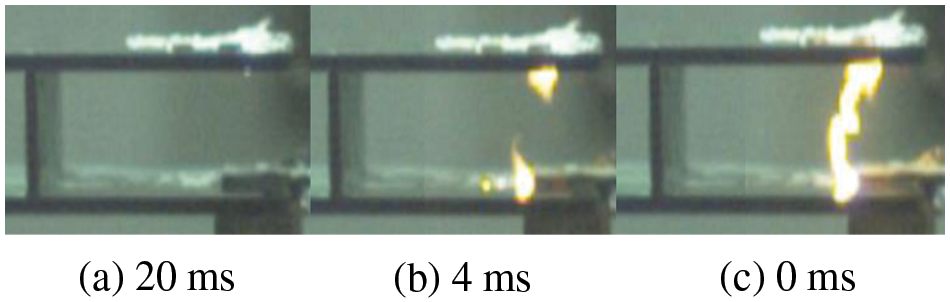
Figure 5: Propagation of air gap arc
The above test results are obtained with an ESDD of 0.1 mg/cm2 and a creepage distance coefficient of 4.2. The path forms corresponding to other ESDDs and structures are similar, but the probability distributions are different.
3.2 Discussion on Arc Extension Conditions
Electric fields and energy are the main conditions for maintaining arc propagation. In Fig. 6, when the difference between the arc root potential φr and the arc root front potential φxf or φyf is greater than the breakdown voltage at this gap, the arc may develop forward. If the arc develops in a certain direction and its energy is higher than the dissipated energy, the arc can maintain its propagation. However, when the arc satisfies the above two conditions, the final propagation path is still a probabilistic problem. The test process is carried out by continuously increasing the applied voltage, and the above two conditions are met. The arc formed under AC voltage is always accompanied by the phenomena of “arc zero break” and “arc extinction” in the AC cycle. There are two types of electric arc: the arc continues in place after extinction or develops again after extinction. The test model used is small, and the front end of the arc root is filled with charged particles when the arc is extinguished, which does not affect the path form of the arc.
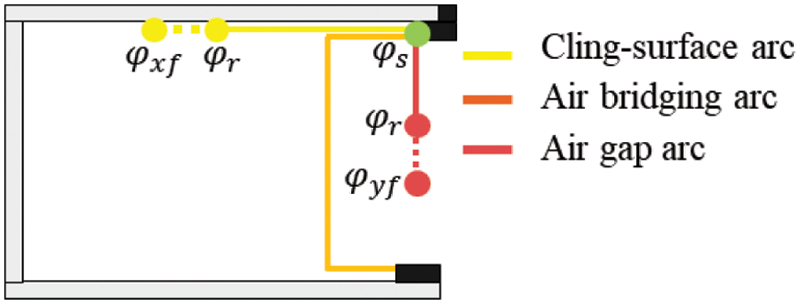
Figure 6: Arc extension condition and path classification
3.3 Arc Path Mesh Generation Method
The zigzag bending of the arc column is not conducive to the study of the overall path when the arc is observed at the centimeter level. Since each test time is short, the arc radius has little change relative to the arc length. Moreover, the pollution layer is set as a long strip and narrow band to avoid the transverse displacement of the arc. Therefore, the arc image is divided into grids, ignoring details and focusing on the overall arc path. It can be considered that the arc develops on the vertical two-dimensional plane between the umbrellas, and the arc is meshed.
The image model is based on the actual model’s umbrella extension and umbrella spacing. The arc curve is extracted using the background difference principle in MATLAB, which differentiates between the background image without arc and the foreground image with arc to obtain the frontal contour of the arc (red line). Since there is noise near the main arc in the binary image, it is necessary to improve the arc profile by corrosion and expansion [27]. Fig. 7 shows the process of obtaining the arc contour.
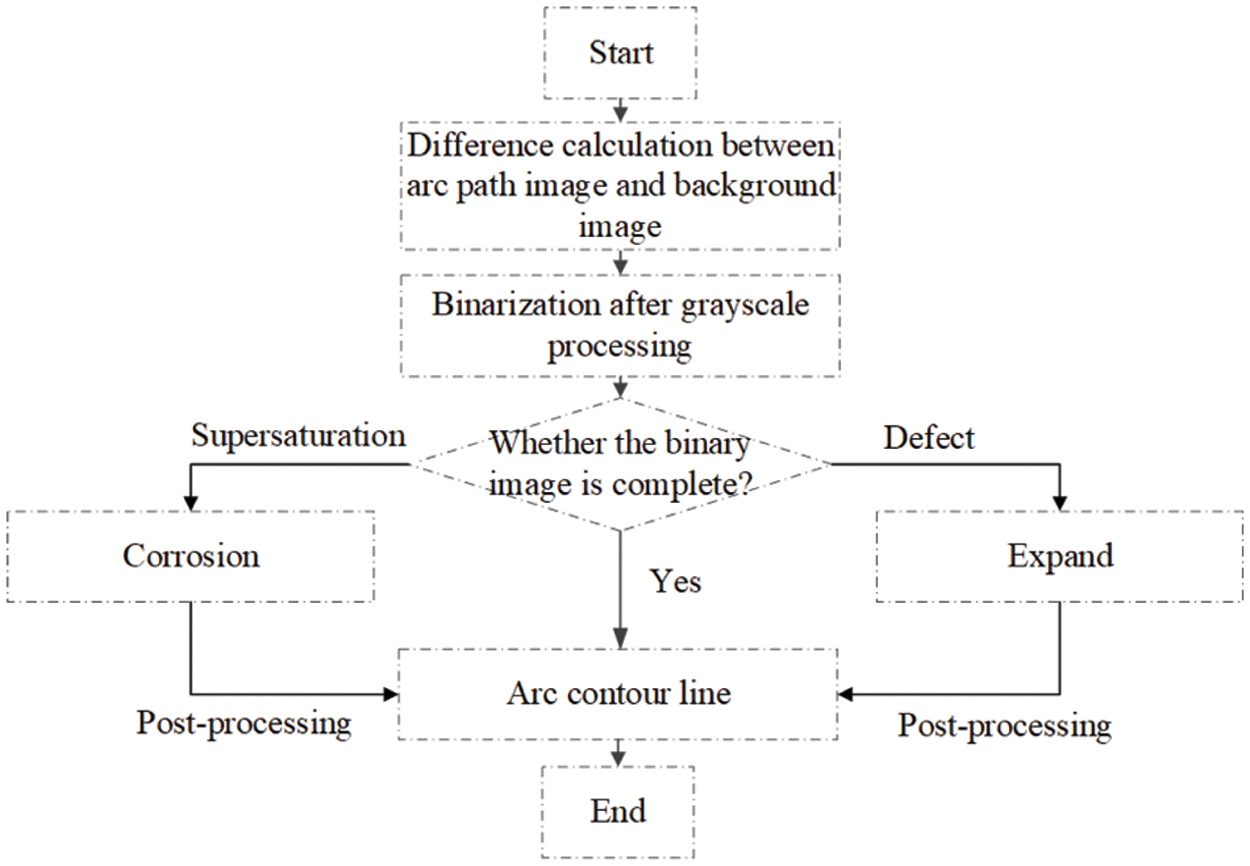
Figure 7: Arc path image conversion process
As shown in Fig. 8a, the processed image is a binary image with only the arc contour. It is convenient to solve the position of the center line of the circular arc using a coordinate image. The outer contour line of the arc is manually adjusted to the upper and lower contour line, and the center line of the two lines is taken as the center curve of the arc column (green line). As shown in Fig. 8b, the obtained arc center curve image is grid divided using Adobe Photoshop, and the sizes of the grid and pixel are 256:1. When the area enclosed between the central curve of the arc column and one of the edge lines of the grid is minimal, the microsegment arc is determined to be attached to this edge line of the grid (black line). In this way, the volume of the arc is neglected, and the central curve of the arc column (green line) is obtained. Finally, the arc paths are easy to observe.
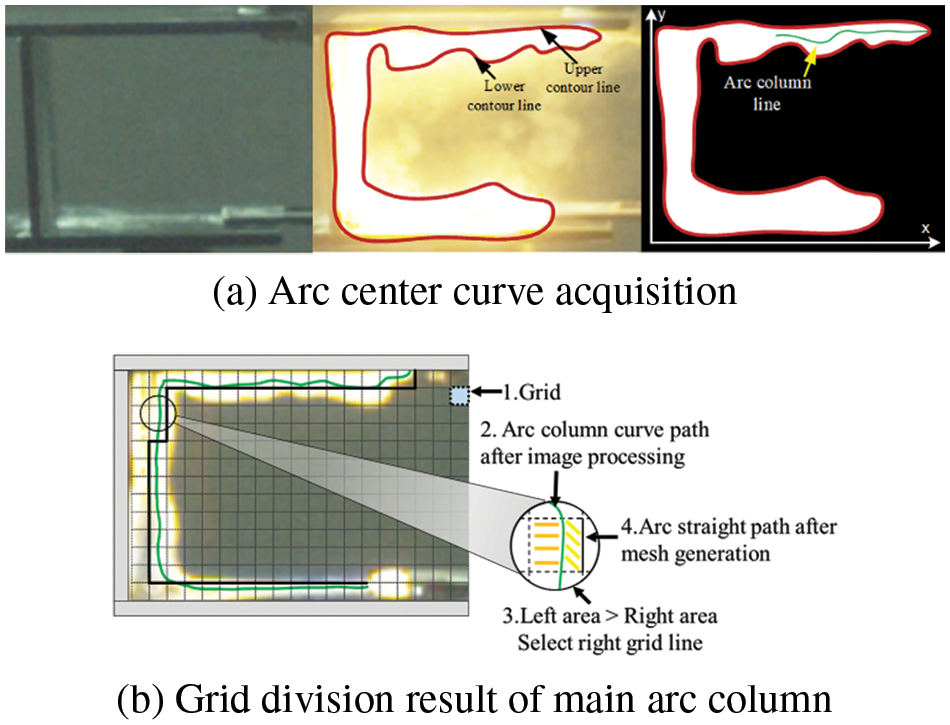
Figure 8: Arc mesh generation process
3.4 Probability Distribution of Arc Path between Umbrellas
3.4.1 Influence of ESDD on Probability Distribution of Arc Path Form
Fig. 9 is the statistical diagram of the arc path when the creepage coefficient δCF is 3.29 under different salt densities. Salt densities of 0.02 and 0.05 mg/cm2 are added according to the original setting. As can be seen from the path summary diagram, the transmission of the arc between insulators without umbrella ribs conforms to the defined form of the arc path in Section 2.1. These arc paths are dominated by two groups of states, namely cling-surface arcs and air-jump arcs.
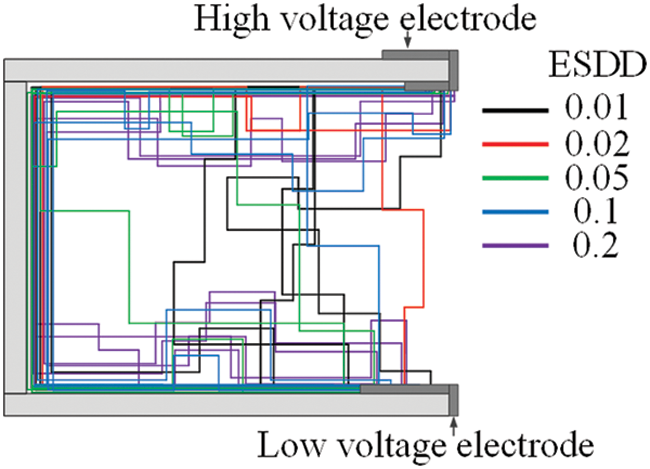
Figure 9: Path distribution of arc flashover under umbrella spacing of 7 cm (δCF = 3.29)
Fig. 10 shows the probability distribution of the cling-surface arc and the air-jump arc between the umbrellas under different creepage coefficients. The test data are obtained by repeating ten valid tests under the same conditions. When the creepage coefficient is constant, the higher the ESDD, the higher the probability of cling-surface arcs forming. The smaller the ESDD, the lower the resistivity of the dirty layer, and the greater the chance of the thermal effect of the leakage current being insufficient, so it is difficult for a dry zone to be generated. Even if a dry zone is generated, the electric field concentration near the dry zone is small, so surface arcs are unlikely to develop. At the same time, the creepage distance along the surface is larger than the gap distance of the umbrella skirt, so the arc is more likely to develop in the air after the voltage is increased. However, when the ESDD increases, the voltage gradient at the surface creepage distance decreases, as does the gap voltage gradient between the umbrella skirts, making it difficult for air breakdown to occur. The higher the ESDD, the higher the leakage current and the faster the dry strip formation rate. Additionally, the concentrated electric field near the dry strip is more likely to cause partial discharges that promote arc development along the surface [27]. This change can be found in a variety of structures with different creepage coefficients, and the phenomenon becomes more pronounced as the creepage coefficient decreases.
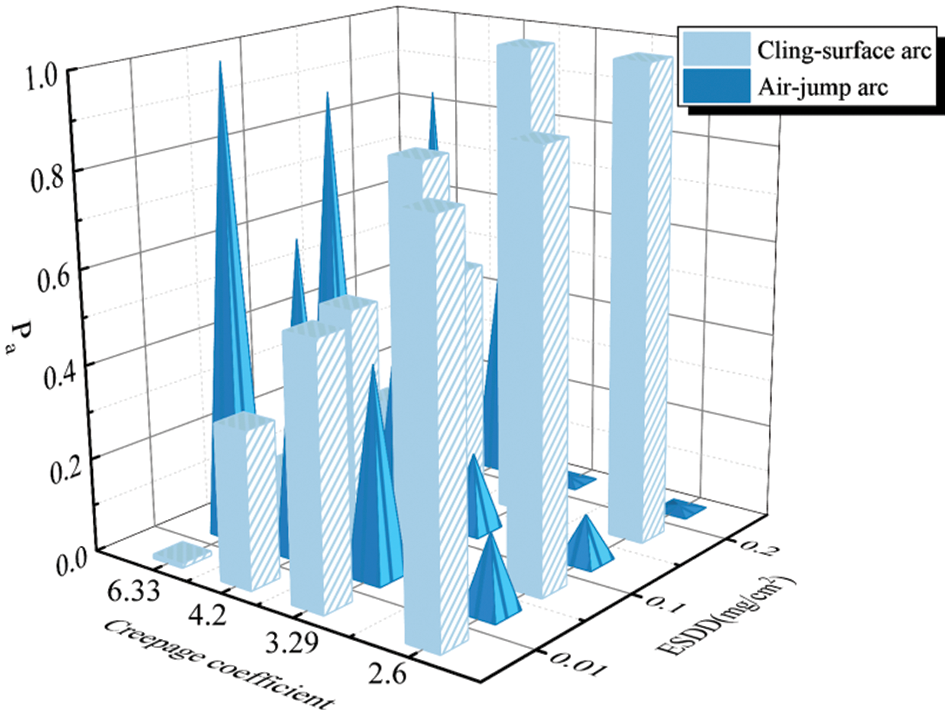
Figure 10: Arc path probability distribution under different conditions. The X-axis is the creepage coefficient, the Y-axis is the equivalent salt density, and the Z-axis is Pa, the probability of two arc forms appearing in the experiment
3.4.2 Probability Distribution of Arc Path under Different Umbrella Structures
As can be seen from the comparison of the X and Z axes in Fig. 10, the umbrella structure plays a significant role in affecting the probability distribution of arc paths. As can be seen from the summary of arc paths in Fig. 11, the number of air-jump arcs of the insulator structure with the umbrella distance of 3 cm (δCF = 6.33) is much larger than that of the insulator structure with the umbrella distance of 7 cm (δCF = 3.29). With the increase in umbrella spacing, the creepage distance coefficient decreases gradually, and the probability a cling-surface arc increases. The voltage change per unit length in the linear direction between the two electrodes under the small umbrella spacing is much greater than the voltage change per unit length along the plane direction. According to the previous discussion, the arc depends on the breakdown and extension of the electric field at the arc root, and the larger the voltage difference in a certain direction, the greater the probability of the arc propagation. Consequently, the probability of an air-jump arc is high at small umbrella spacing. As the umbrella spacing increases, the electric field distribution between umbrellas gradually becomes uniform, and the probability of the cling-surface arc gradually increases. The authors summarize the arc path forms under insulators of different structures so as to intuitively analyze the distribution law of the path forms. As shown in Fig. 12, the probability of the air-jump arc decreases from more than 90% to approximately 10% with the increase in umbrella spacing.
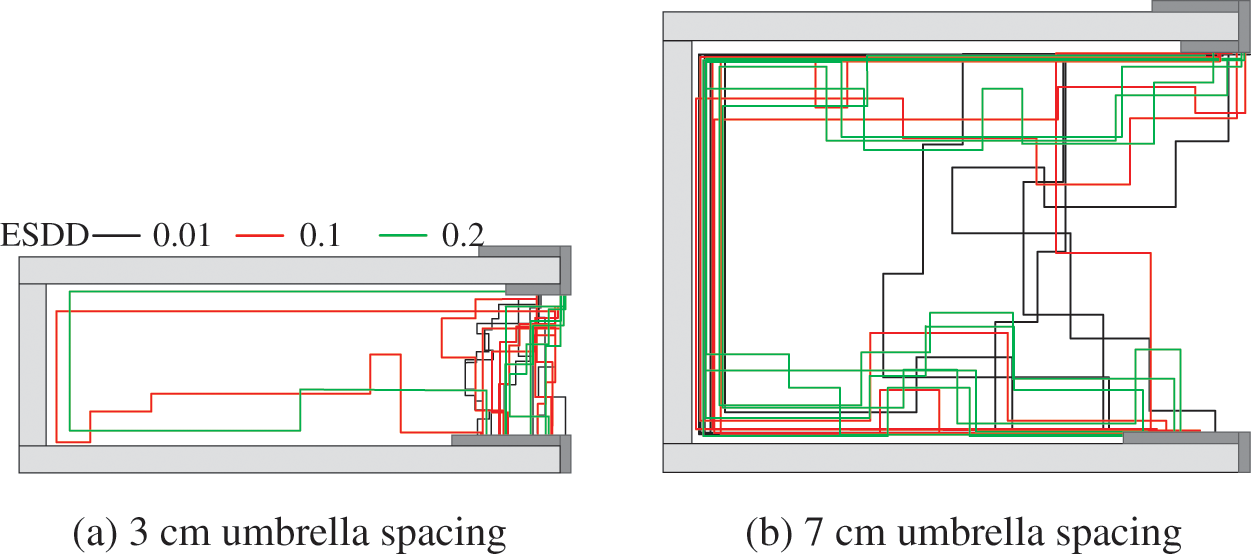
Figure 11: Comparison of arc paths when the umbrella spacing is 3 and 7 cm
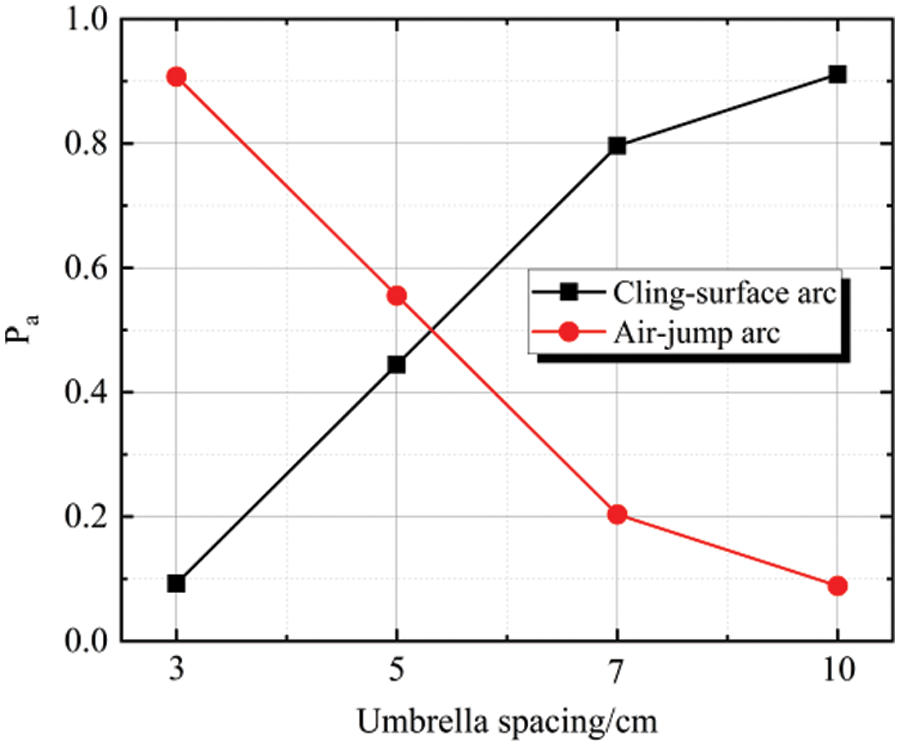
Figure 12: Variation of arc path probability with umbrella spacing
4 Criterion of Arc Propagation Path Form between Umbrellas
4.1 Mechanism of Judging the Form of Subsequent Arc Path by Initial Arc Behavior
The analysis of the arc path morphology shows that the air-jump arcs are relatively concentrated in the linearly connected region between the two electrodes. The propagation of arc in this area is diversified, but when the initial arc develops in the air for long enough, there will be no possibility of arc along the surface, and when the initial arc develops to a certain extent along the surface, the air-jump arc will not appear. This phenomenon is concentrated near the high-voltage end and can be considered as an effect of the behavior at the beginning of the arc.
In the early stage of arc propagation, the length and current are relatively small. According to Obenaus’s calculation theory [28], the voltage drop of the arc is far less than that of the external power supply. The distortion between the external electric field and the arc electric field makes the electric field before the arc root complicated. At the initial stage, the arc develops in a certain direction, causing the electric field distortion in front of the arc root to increase. The existence of the arc increases the electric field in front of the arc root. The arc extension depends mainly on the electric field breakdown of the head gap, and, hence, the propagation direction of the initial arc affects the path form of the subsequent propagation of the arc. When the electric field is increased in a certain direction, the difference of the applied potential at the unit gap distance increases, and the breakdown probability at the microsegment increases. In other words, in the initial discharge stage, the longer the arc develops in any direction on the surface or in the air, the greater the possibility that the subsequent arc continues to develop in that direction.
The change of electric field after arcing is studied by finite element simulation. The quasi-static electric field is selected for the physical field, and the model between umbrellas is constructed according to the actual size. Pollution content has an effect on the probability distribution of the path, but it has no effect on the form of the arc path during flashover. Therefore, only the common wet and dry pollution layers are considered in the simulation, and their relative permittivity values are 35 and 2.8, respectively. The parameters of the model are set according to the materials of the glass insulator. The umbrella skirts and pillars are tempered glass, the electric pole is iron, and the rest positions are air. When the arc voltage drop is considered, the current field is added and the conductivity is calculated [29]. The applied voltage condition is set to a value that meets the arc extension condition.
4.2 Influence of Initial Arc and Judgment Coefficient of Arc Path Form
As shown in Fig. 13, the electric field distribution between insulator umbrellas without arc is more uniform, but the electric field in the Y direction between the two electrodes is greater than that in the X direction. At the same gap distance, the larger the electric field in a certain direction and the higher the voltage gradient, the more likely it is that the arc will develop in that direction. Thus, the smaller the umbrella spacing in Fig. 10, the higher the probability of air-jump arcs between the umbrella skirts.
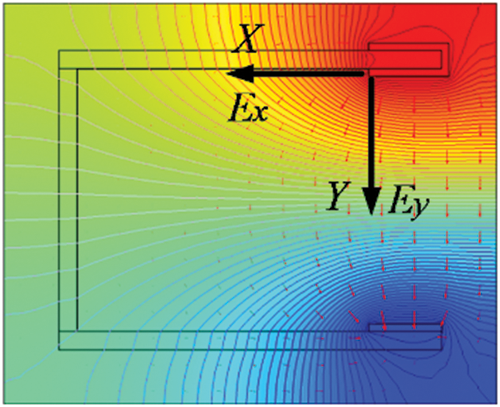
Figure 13: Potential distribution and electric field direction between umbrellas
It can also be seen from formula (1) that the greater the electric field intensity, the greater the potential difference of the unit gap distance, and the greater the possibility of gap breakdown. It can be inferred that the propagation of the subsequent arc in the Y direction is easier than that in the X direction.
The arc has a low voltage and a large electric field strength in front of the arc root, which induces the arc to continue to develop. When the initial arc develops along the X direction, the electric field intensity in the X direction increases. Hence, the subsequent arc can more easily develop gradually along the surface. When the initial arc develops in the Y direction, the electric field intensity in the Y direction increases. This leads to flashover of the subsequent arc in the form of air jump. Clearly, the propagation of an initial arc in a certain direction affects the form of the path of subsequent arcs. Therefore, the subsequent propagation path of the arc is judged by the behavior of the arc near the high-voltage end, that is, the length of the initial arc in a certain direction. To explore how long the arc path form can be directly determined in the initial stage, the judgment coefficient ζ of arc path form based on electric field distribution is introduced, which is defined by formula (2).
ζ is obtained from the ratio of the potential difference under the same length gap in the X direction and the Y direction. It represents the extent to which the change of the potential in the X or Y direction affects the development of the initial arc to a certain length. There is a limit value for ζ, so a threshold value can be used instead. This means that when the initial arc develops more than a certain length in a certain direction, the path form of subsequent arcs will be affected by changing the electric field. At this point, the propagation path of the subsequent arc can be determined directly rather than probabilistically. The determination of the threshold requires the consideration of the breakdown voltage of the gap. Since the breakdown voltage along the surface is approximately half of the breakdown voltage of the air at the same length, the coefficient threshold for the propagation of the arc in the X direction is set as 1, and the coefficient threshold for the propagation of the arc in the Y direction is set as 0.5 [21,27,30,31].
Fig. 14 shows the effect on the electric field when the arc develops in different directions during the initial stage of generation via finite element simulations according to the above definition of the coefficients. In Fig. 14, as the initial arc develops along the X direction, the longer the length, the denser the electric field in front of the arc and the more pronounced the potential drop. The potential difference per unit length in the X direction is larger than that in the Y direction. In consequence, ζ increases. The larger the umbrella spacing, the smaller the arc length required when ζ reaches the threshold value of 1. When the initial arc develops for a small length in the X direction, its subsequent propagation path is along the surface. The initial arc extends in the Y direction, and ζ decreases gradually. This is because, as the initial arc develops in the Y direction, the electric field in that direction becomes superimposed and the potential drop increases at unit gap distance. At this moment, the probability of the subsequent arc being an air-jump arc is higher. When the initial arc propagation length causes ζ to be 0.5, then the subsequent arc will be an air-jump arc. The increased umbrella spacing makes it more difficult to reach the threshold of 0.5 due to the influence of the initial arc on the potential in the Y direction.
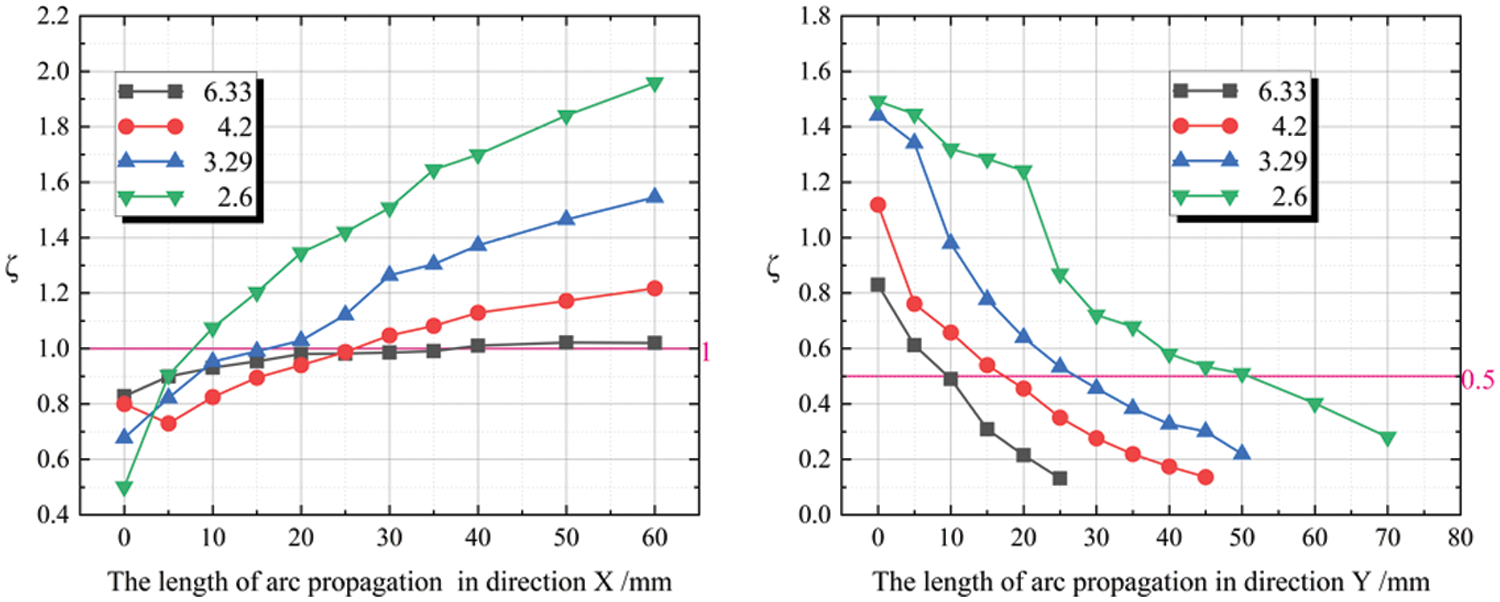
Figure 14: Influence of initial arc propagation length on coefficient ζ
4.3 Application of Arc Flashover Path Judgment between Umbrellas
As can be seen from the above analysis, the propagation of the initial arc can distort the electric field in front of the arc root and facilitate the arc to develop in this direction. In other words, during the initial development of an arc, if the length exceeds a certain value, the path of the subsequent arc can be predicted.
4.3.1 Definition of Judgment Range
Taking the initial arc length corresponding to ζ reaching the threshold as the judgment area, the flashover path form can be judged more intuitively according to the arc propagation length image. This method can also be extended to other insulator models. Formulas (3) and (4) are the initial arc lengths required for breaking the ζ threshold:
where Lxarc represents the length of the initial arc along the X direction when ζ is threshold 1; Lyarc represents the length of the initial arc along the Y direction when ζ is 0.5; Lc and Lg are umbrella extension and umbrella spacing, respectively; and the scale factor η represents the proportional relationship between initial arc length and insulator structure, which can be extended to other insulator models. As shown in Fig. 15, the purple lines represent Lyarc and Lg, and the blue lines represent Lxarc and Lc.
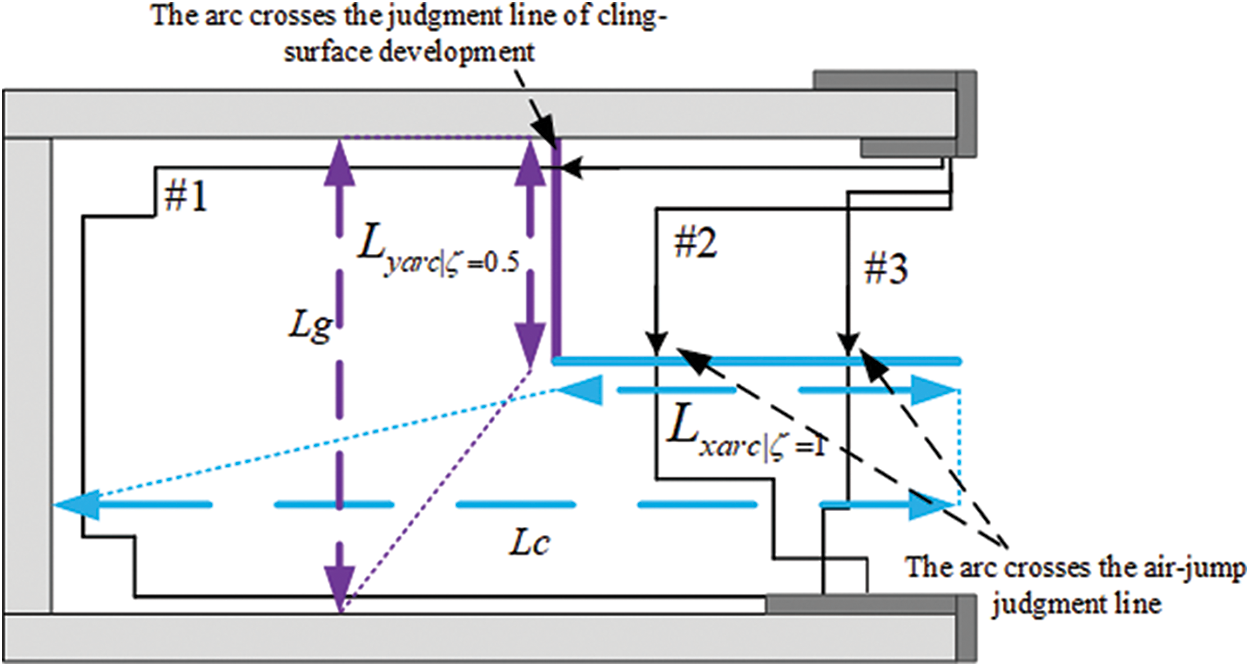
Figure 15: Verification of judgment range of partial arc between umbrellas
4.3.2 Judgment Method of Arc Path Form between Umbrellas
The scale relationship between the initial arc length and the insulator umbrella structure can be obtained from the above calculations. The scale relationship obtained from the solution is drawn in the plane image of insulator constructed according to the actual size of 1:1, which can be used as the region to judge the subsequent arc path. Fig. 15 shows the schematic diagram of arc path judgment. Starting from the head of the high-voltage end, a judgment area composed of
The umbrella extension and umbrella spacing of different umbrella structure insulators are different, but the factor η can be extended to different insulators. Fig. 16 shows the change of the scale factor η with the creepage distance coefficient of the insulator according to the above solution. As the creepage coefficient decreases, η1 and η2 show the opposite trend. Converting these two values to a judgment region shows that the region is shortened horizontally and lengthened vertically. The region enclosed by the purple and blue lines in Fig. 17 is the judgment region. This means that as the creepage coefficient decreases, the arc needs to develop for longer in the Y-direction before the bridge can occur, which greatly improves the flashover phenomenon.
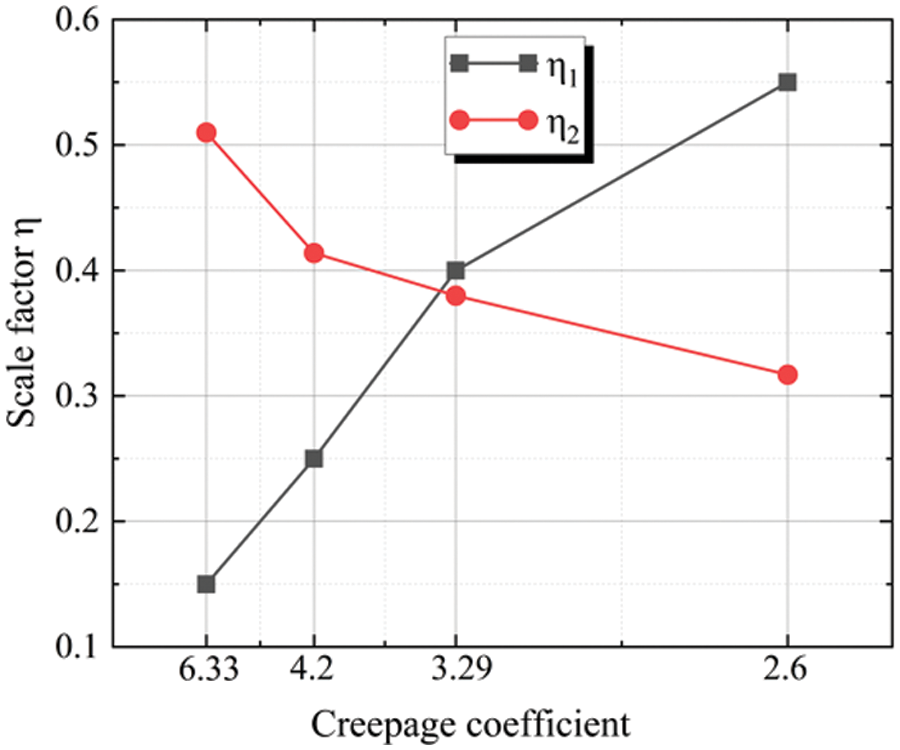
Figure 16: Change of scale factor η with creepage distance coefficient
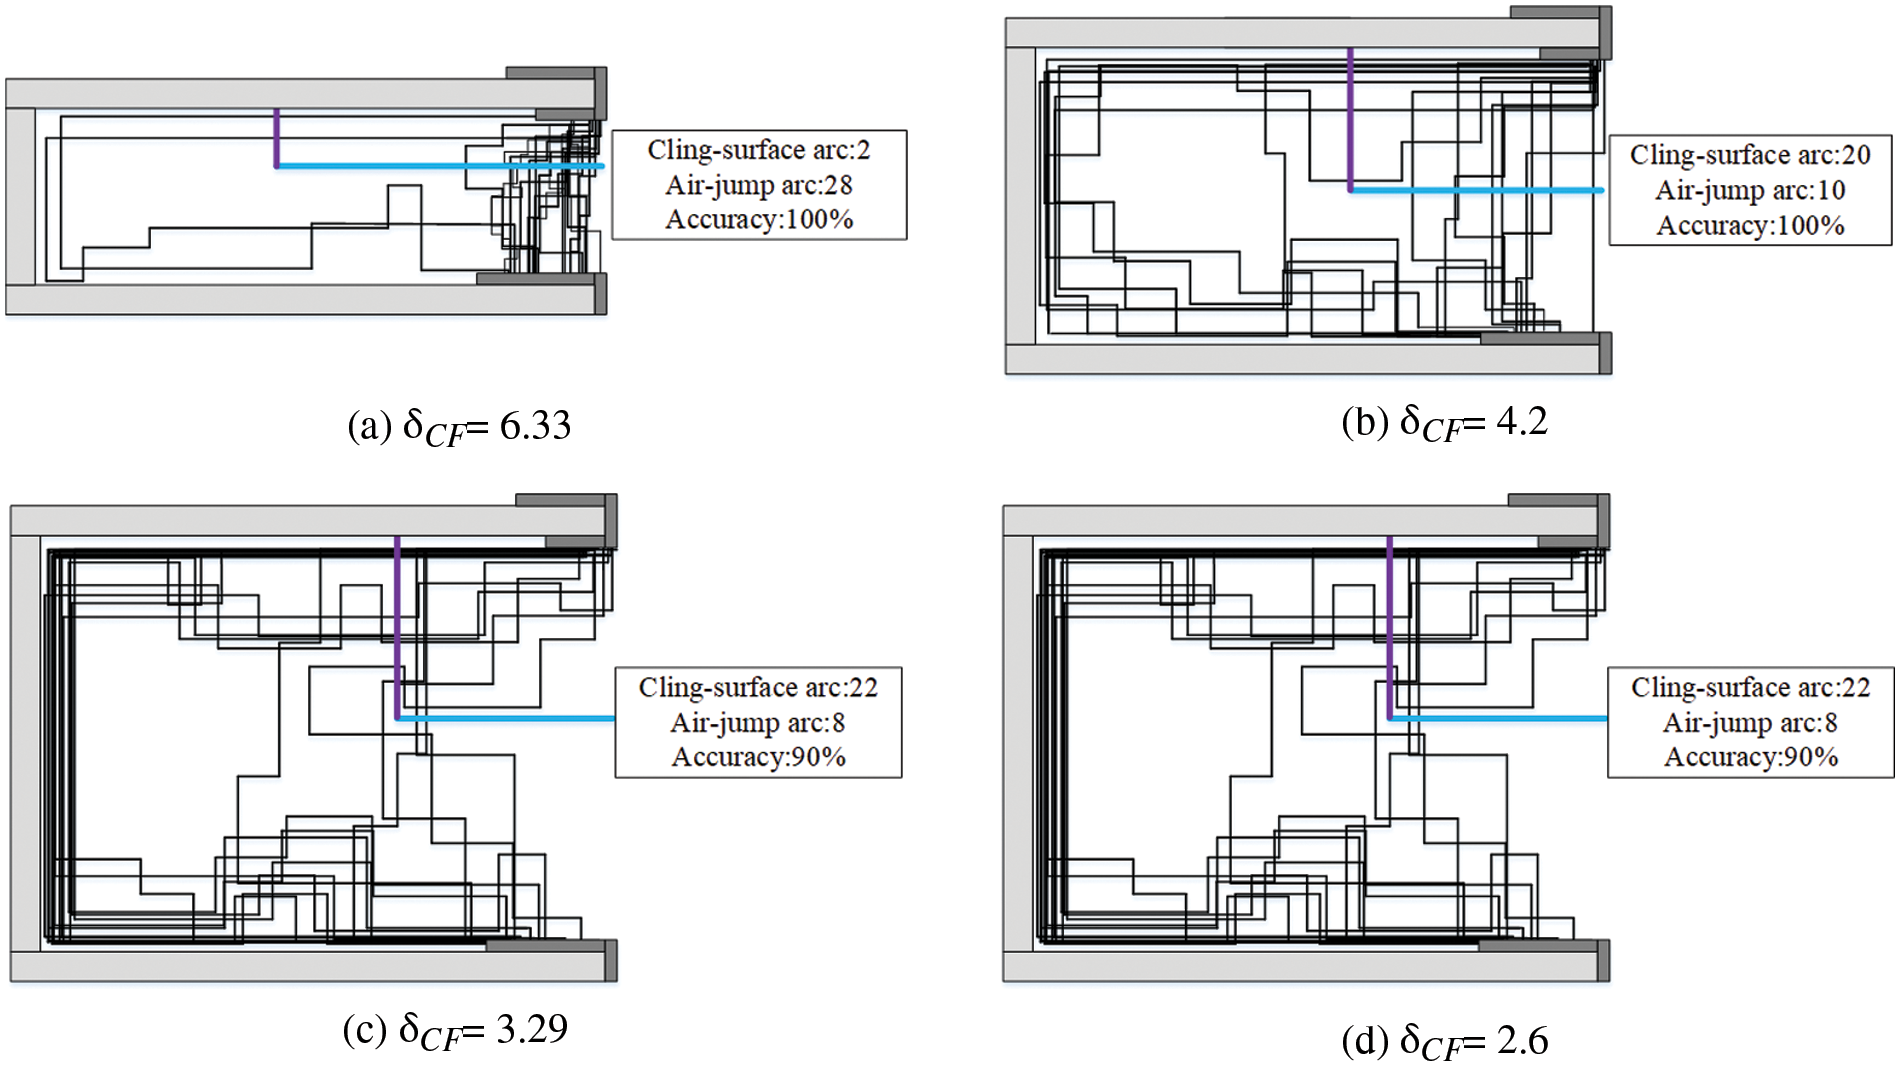
Figure 17: Verification of judgment range of partial arc between umbrellas
To test the feasibility of the method proposed in this paper, the judgment area obtained is verified with the arc path obtained from the actual test. Fig. 17 shows the summary of partial arc paths under different insulator creepage factors. When the creepage distance coefficient is large, the umbrella spacing is small, and the arc is more likely to jump in the air. With the decrease in the creepage coefficient, the difficulty of arc development in the air increases, and the flashover accident decreases. At the initial stage, the arc can jump into the flashover by a short distance in the Y direction, which will make the internal creepage distance of the insulator ineffective. However, this situation changes when the creepage coefficient decreases to 3.29. The calculation of the judgment area under different insulator umbrella structures can predict the behavior of the arc under these structures and estimate the probability of different arc path forms occurring.
The method of determining arc path forms presented in this study is applied to insulators without umbrella ribs. Data are obtained from 10 repeated tests under each condition. It can be seen from Fig. 17 that the accuracy of the judgment method applied to different umbrella structure insulators is 100%, 100%, 90%, and 93.3%, respectively. The accuracy of arc path form judgment under different structures is above 90%, so the judgment method is effective. The proposed judgment method can be applied to insulators of different structures. It is found that the insulator has strong effectiveness when the creepage distance coefficient is small. For an insulator in online operation, the structural parameters of the insulator can be understood by querying the insulator type, which allows the arc behavior and path probability of the insulator to be judged and estimated in the case of a flashover. A reasonable insulator structure can make full use of the creepage distance to increase the arc length and enhance the external conditions for flashover. This can reduce the occurrence of pollution flashover accidents and reduce losses.
In this study, the authors develop a test model based on real insulator models and investigate the morphology and probability distribution of arc paths in insulators with different umbrella structures by tuning the umbrella distance. The electric field changes after arc generation, affecting the development of subsequent arcs. Combining electric field and numerical calculation in multi-physical field simulation, a method to judge arc paths based on initial arc behavior is proposed. The conclusions are as follows:
(1) The path forms of the arcs between the insulator umbrellas are mainly divided into cling-surface arcs and air-jump arcs, where the air-jump arc is further divided into air bridging arc and air gap arc. Air-jump arcs lead to the failure of the insulator creepage distance and, thus, reduce the flashover property of insulators.
(2) The probabilities of arc path forms between insulator umbrellas are different for different structures. Under the influence of the voltage gradient between the air and the surface, the probability of air-jump arcs is higher. ESDD affects the arc development path by affecting voltage gradients and dry band generation. The smaller the ESDD, the higher the probability of air-jump arcs.
(3) The accuracy of the proposed method for determining the arc path of an insulator at different creepage coefficients is over 90%. The arc behavior and probability distribution of insulator flashover can be judged and estimated based on the extension and distance of the insulator umbrella. The proposed method can guide the production and design of insulator structures.
Funding Statement: This work was supported by the National Natural Science Foundation of China (52007138) and Chengdu Technology Innovation R&D Project (2022-YF05-00971-SN).
Author Contributions: The authors confirm contribution to the paper as follows: study conception and design: H.Y. and Z.S.; data collection: Z.S., Y.R., and J.M.; analysis and interpretation of results: Z.S., W.S., and Y.L.; draft manuscript preparation: H.Y. and Z.S. All of the authors reviewed the results and approved the final version of the manuscript.
Availability of Data and Materials: The data provided in this article can be used as a reference for research.
Conflicts of Interest: The authors declare that they have no conflicts of interest to report regarding the present study.
References
1. Zhang, Z., Jiang, X., Sun, C., Hu, J., Yuan, J. (2009). DC pollution flashover model and its validation of polluted insulator strings. Transactions of China Electrotechnical Society, 24(4), 36–41. [Google Scholar]
2. Wang, S., Wang, J., Zhou, L., Chen, L., Zhao, L. (2022). Research on flashover voltage prediction of catenary insulator based on CaSO4 pollution with different mass fraction. Energy Engineering, 119(1), 219–236. [Google Scholar]
3. Wu, W., Wu, G., Zhang, Q., Zhang, Y. (2011). Characteristics of application and operation on 1000 kV UHVAC insulators. High Voltage Engineering, 37(1), 15–20. [Google Scholar]
4. Qiu, D. (2015). Study of the field distribution of composite insulator in icing and contamination conditions. Insulators and Surge Arresters, 1, 26–30. [Google Scholar]
5. Matsuoka, R., Ito, S., Sakanishi, K., Naito, K. (1991). Flashover on contaminated insulators with different diameters. IEEE Transactions on Electrical Insulation, 26(6), 1140–1146. [Google Scholar]
6. Isaka, K., Yokoi, Y., Naito, K., Matsuoka, R., Sakanishi, K. et al. (1988). An investigation of DC contamination flashover phenomena of suspension insulators. Second International Conference on Properties and Applications of Properties and Applications of Dielectric Materials, pp. 20–24. Beijing, China. [Google Scholar]
7. Kimoto, I., Fujimura, T., Naito, K. (1973). Performance of insulators for direct current transmisson line under polluted condition. IEEE Transactions on Power Apparatus and Systems, PAS-92(3), 943–949. [Google Scholar]
8. Kawamura, T., Seta, T., Tanabe, S. (1988). Performance of large bushing shells for EHV transmission system under polluted conditions. CIGRE Session Paper, 33(3), 311–316. [Google Scholar]
9. Cheng, T. C., Nour, H. I. M. (1989). A study on the profile of HVDC insulators-mathematical modeling and design considerations. IEEE Transactions on Electrical Insulation, 24(1), 113–117. [Google Scholar]
10. Faselian, M., Wu, C. Y., Cheng, T. C. (1989). A study on the profile of HVDC insulators: DC flashover performance. IEEE Transactions on Electrical Insulation, 24(1), 119–125. [Google Scholar]
11. IEC 60815 (2008). Selection and dimensioning of high-voltage insulators intended for use in polluted conditions. Geneva, Switzerkand: International Electrotechnical Commission. [Google Scholar]
12. Melhelev, Д, Solomonic (1980). Insulation of lines and substations in polluted areas. Beijing, China: Power Industry Press. [Google Scholar]
13. Sundararajan, R., Gorur, R. (1994). Effect of insulator profiles on DC flashover voltage under polluted conditions. A study using a dynamic arc model. IEEE Transactions on Dielectrics and Electrical Insulation, 1(1), 124–132. [Google Scholar]
14. Rizk, F. A. M. (1981). Mathematical models for pollution flashover. Electra, 78, 71–103. [Google Scholar]
15. Alston, L. L., Zoledziowski, S. (1963). Growth of discharges on polluted insulation. Proceedings of the Institution of Electrical Engineers, 110(7), 1260–1265. [Google Scholar]
16. Rizk, F. A. M., Rezazada, A. Q. (1997). Modeling of altitude effects on AC flashover of polluted high voltage insulators. IEEE Transactions on Power Delivery, 12(2), 810–822. [Google Scholar]
17. He, J. (2016). Insulator flashover probability investigation based on numerical electric field calculation and random walk theory (Ph.D. Thesis). Arizona State University, Phoenix. [Google Scholar]
18. He, J., Zhang, C., He, K. (2020). Investigation of arc trajectory characteristics of composite insulators based on multifield coupling analysis. IEEE Access, 8, 6130–6139. [Google Scholar]
19. Wilkins, R. (1969). Flashover voltage of high-voltage insulators with uniform surface-pollution films. Proceedings of the Institution of Electrical Engineers, 116(3), 457–465. [Google Scholar]
20. Guan, Z., Zhang, R. (1988). Estimation of flashover voltage of polluted insulators. Proceedings of the CSEE, 2, 3–13. [Google Scholar]
21. Li, Y. (2014). AC partial arc and flashover characteristics of contaminated insulator strings under saturation humidity condition (Ph.D. Thesis). Xi’an Jiaotong University, China. [Google Scholar]
22. Li, J. (2013). Study of the mechanism of arc propagation over a polluted insulation surface and the time-varying model (Ph.D. Thesis). Tsinghua University, Beijing, China. [Google Scholar]
23. Li, Y., Yang, H., Zhang, Q., Zhou, J., Yu, X. (2014). Modeling of AC arc discharge on insulators in consideration of arc characteristic differences between partial arcs on top and bottom wet-polluted dielectric surfaces. Proceedings of the CSEE, 34(30), 5442–5450. [Google Scholar]
24. IEC 60507 (2013). Artificial pollution tests on high-voltage ceramic and glass insulators to be used on A.C. systems. Geneva, Switzerkand: International Electrotechnical Commission. [Google Scholar]
25. Wu, J., Wang, Y., Wang, J. (1997). Study on electron diffusion process and arc radius of vacuum arc. High Voltage Apparatus, 3, 8–11+21. [Google Scholar]
26. Jolly, D. C. (1972). Contamination flashover, part I: Theoretical aspects. IEEE Transactions on Power Apparatus and Systems, 6, 2437–2442. [Google Scholar]
27. Tian, Y. (2014). Application of decreasing noise gray image by corrosion and expansion algorithm. Journal of Beijing Institute of Graphic Communication, 22(4), 63–65. [Google Scholar]
28. Obenaus, F. (1958). Fremdschichtueberschlag und Kriechweglaenge. Disch Elektrotechnik, 12(4), 135–136. [Google Scholar]
29. Dong, H. (2011). Study on contamination and electric field characteristics of cantilever composite insulator in high pollution environment (Ph.D. Thesis). Lanzhou Jiaotong University, China. [Google Scholar]
30. Yang, H. (2016). Study on the flashover process over the wet contaminated surface under AC high voltage (Ph.D. Thesis). Xi’an Jiaotong University, China. [Google Scholar]
31. Huang, X., Cao, W. (2017). Review of the disaster mechanism of transmission lines. Journal of Xi’an Polytechnic University, 31(5), 589–605. [Google Scholar]
Cite This Article
 Copyright © 2023 The Author(s). Published by Tech Science Press.
This work is licensed under a Creative Commons Attribution 4.0 International License , which permits unrestricted use, distribution, and reproduction in any medium, provided the original work is properly cited.
 Downloads
 Citation Tools