
 Submit a Paper
 Propose a Special lssue
 Open Access
ARTICLE
Simulation Method and Feature Analysis of Shutdown Pressure Evolution During Multi-Cluster Fracturing Stimulation
1 Shale Gas Exploration and Development Department, CNPC Chuanqing Drilling Engineering Co., Ltd., Chengdu, 610051, China
2 College of Energy, Chengdu University of Technology, Chengdu, 610059, China
* Corresponding Author: Lijun Liu. Email:
(This article belongs to the Special Issue: Hydraulic Fracturing Theory and Application for Geo-energy Development)
Energy Engineering 2024, 121(1), 111-123. https://doi.org/10.32604/ee.2023.041010
Received 07 April 2023; Accepted 07 July 2023; Issue published 27 December 2023
 View Full Text
 Download PDF
Abstract
Multistage multi-cluster hydraulic fracturing has enabled the economic exploitation of shale reservoirs, but the interpretation of hydraulic fracture parameters is challenging. The pressure signals after pump shutdown are influenced by hydraulic fractures, which can reflect the geometric features of hydraulic fracture. The shutdown pressure can be used to interpret the hydraulic fracture parameters in a real-time and cost-effective manner. In this paper, a mathematical model for shutdown pressure evolution is developed considering the effects of wellbore friction, perforation friction and fluid loss in fractures. An efficient numerical simulation method is established by using the method of characteristics. Based on this method, the impacts of fracture half-length, fracture height, opened cluster and perforation number, and filtration coefficient on the evolution of shutdown pressure are analyzed. The results indicate that a larger fracture half-length may hasten the decay of shutdown pressure, while a larger fracture height can slow down the decay of shutdown pressure. A smaller number of opened clusters and perforations can significantly increase the perforation friction and decrease the overall level of shutdown pressure. A larger filtration coefficient may accelerate the fluid filtration in the fracture and hasten the drop of the shutdown pressure. The simulation method of shutdown pressure, as well as the analysis results, has important implications for the interpretation of hydraulic fracture parameters.Keywords
Nomenclature
| H | Hydraulic head |
| Q | Flow rate |
| A | Cross-sectional area of the wellbore |
| θ | Angle between the wellbore and the horizontal direction |
| a | Pressure wave velocity inside the wellbore |
| D | Wellbore diameter |
| f | Frictional coefficient along the wellbore |
| Qini | Flow rate in the wellbore at the initial time |
| Hini | Pressure head at the wellhead at the initial time |
| ΔH | Pressure head loss along the wellbore segment |
| Pw | Bottom hole pressure |
| Pf | Pressure in the hydraulic fracture |
| ρ | Fluid density |
| Qw | Flow rate at the bottom of the well |
| Np | Number of opened perforations |
| d | Perforation diameter |
| CD | Flow coefficient |
| Nf | Number of opened clusters |
| hf | Height of the hydraulic fracture |
| lf | Half-length of the hydraulic fracture |
| wf | Width of the hydraulic fracture |
| Qleak | Fluid loss rate in the hydraulic fracture |
| σmin | Minimum horizontal principal stress |
| ν | Poisson’s ratio of the formation rock |
| G | Shear modulus of the formation rock |
| CL | Fluid loss coefficient in the hydraulic fracture |
| tf | Time since the start of hydraulic fracturing |
Shale oil and gas resources have attracted widespread attention from countries around the world due to their considerable reserves and development potential. However, shale reservoirs are characterized by the low porosity and ultra-low permeability [1], and typically require the use of horizontal well and hydraulic fracturing technology to achieve economic development [2,3]. In recent years, with the rapid development of hydraulic fracturing technology, a series of techniques such as multi-cluster fracturing and temporary plugging fracturing have been developed [4–7]. Although the progress of fracturing technology has promoted the production of shale hydrocarbons, there is still a lack of real-time and effective methods to characterize hydraulic fracture parameters [8,9], which to some extent limits the optimization of fracturing design and technological innovation.
Currently, there are two main techniques for characterizing hydraulic fractures: direct observation and indirect observation. Direct observation techniques include microseismic observation [10,11], fiber-optic temperature/strain observation [12,13], and downhole imaging observation [14]. Among them, microseismic observation can only provide probable locations of rock shearing activity, and the accuracy of determining hydraulic fracture size is not high enough. It is mostly used to estimate the volume of hydraulic fracture treatment. The latter two observation methods have high accuracy and can provide accurate fracture parameter information. However, the operations are commonly complex and costly. Indirect observation techniques include well testing analysis, production analysis, and hydraulic fracture pump shutdown pressure analysis. The first two methods require interpretation of fracture parameters using backflow [15], well testing, or production data [16,17], which cannot provide real-time guidance for hydraulic fracturing design. Hydraulic fracture pump shutdown pressure refers to the pressure signal observed on the ground after the fluid is stopped pumping during hydraulic fracturing, and the ground pressure oscillates due to the inertia of the fluid. After the sudden pump shutoff, a pressure pulse generates and moves from the wellhead down through the wellbore. Then it interacts with the hydraulic fractures and well bottom, and is reflected up the wellbore. The pressure oscillates periodically until energy is drained from the pulse. As this pressure signal is affected by the hydraulic fracture, its characteristics reflect the geometric information of the hydraulic fracture [18]. Holzhausen et al. [19] first used pump shutdown pressure for fracture diagnostic through the method of hydraulic impedance testing. The hydraulic fractures are analogous to an electrical circuit, and the fracture dimensions are evaluated with a lumped resistance-capacitance model. Mondal [20] and Carey et al. [21] extended this approach for interpretation of multiple hydraulic fractures in horizontal well, in which the effect of multiple fractures is lumped into a single equivalent fracture. Because shutdown pressure is easy to obtain and has good real-time performance, shutdown pressure analysis during hydraulic fracturing is a highly promising means of analyzing and interpreting hydraulic fracture parameters. In order to explore the characteristics of shutdown pressure signals under different fracture parameters, previous studies have proposed several models and simulation methods [22–24]. However, some simplifications and assumptions have been introduced in the modeling process, and there is a lack of intuitive physical explanation.
In this paper, a mathematical model and simulation method for the evolution of shutdown pressure during multi-stage hydraulic fracturing is established. The effects of wellbore friction, perforation friction, and fracture fluid loss are fully taken into account in the model. Then based on the simulation method, the characteristics of shutdown pressure under different key fracture parameters are analyzed, which can provide theoretical and technical support for interpreting fracture parameters during hydraulic fracturing in unconventional reservoirs.
In this section, the mathematical models for the shutdown pressure evolution during hydraulic fracturing are developed, and the numerical simulation method is proposed based on the method of characteristics.
2.1 Mathematical Model for Shutdown Pressure Evolution
Taking into account the elasticity of the wellbore and compressibility of the liquid, a continuity equation and a motion equation for the fluid inside the wellbore are established to characterize the pressure propagation process inside the wellbore. The specific expressions are as follows:
where H represents hydraulic head, m; Q represents flow rate, m3/s; A represents the cross-sectional area of the wellbore, m2; θ represents the angle between the wellbore and the horizontal direction; a represents the pressure wave velocity inside the wellbore; D represents the wellbore diameter, m; f represents the frictional coefficient along the wellbore.
At the initial moment of pump shutdown during hydraulic fracturing, the initial conditions can be determined based on the initial distribution of the pressure head and flow rate in wellbore. At the beginning of shut-in, the wellbore is assumed to be in a steady-state flow, with the same flow rate at all locations. The initial pressure at wellhead can be monitored and obtained, and the pressure distribution in the wellbore can be calculated based on the formula for wellbore frictional loss along the wellbore [25]. The initial condition expression for pump shutdown can be established by combining these factors as follows:
where the superscript 0 indicates the initial time; the subscript 1 indicates the wellhead position; Qini is the flow rate in the wellbore at the initial time, m3/s; Hini is the pressure head at the wellhead at the initial time, m; ΔH is the pressure head loss along the wellbore segment, m.
In addition, in order to model and solve the pump shutdown process during hydraulic fracturing, it is necessary to constrain the boundary conditions at the wellhead and bottom of the well. For the wellhead boundary condition, if the wellhead valve is suddenly completely closed during the pumping process, it will cause a large impact on the wellhead fracturing equipment, possibly causing damage to the equipment. To avoid damage to equipment caused by sudden pump shutdown, the pump is usually stopped in a stepwise manner by gradually reducing the pumping rate from the fracturing rate and staying for a period of time at each stage of flow rate until the pump is completely stopped. Therefore, the flow rate at the wellhead will change over time, which can be expressed as follows:
For the bottom hole boundary condition, when the pressure wave caused by pump shutdown propagates to the wellbore bottom, it will enter the hydraulic fractures through perforations. When the pressure wave passes through perforations, additional fluid pressure loss will occur due to the sudden narrowing of the aperture and the high roughness of the perforation hole. In addition, pressure inside the hydraulic fracture is commonly higher than the fluid pressure in the formation. The fluid in the hydraulic fracture will enter the formation with the aid of pressure difference, causing fluid loss and pressure decrease in the wellbore. For simplicity, it is assumed that the geometry of generated hydraulic fractures is identical in one fracturing stage, and at most one fracture can be generated but multiple perforations can be opened for one cluster. Therefore, combining effects of perforation friction loss and fluid loss in the hydraulic fracture (Fig. 1), the expressions for the bottom hole boundary condition can be expressed as follows [26]:
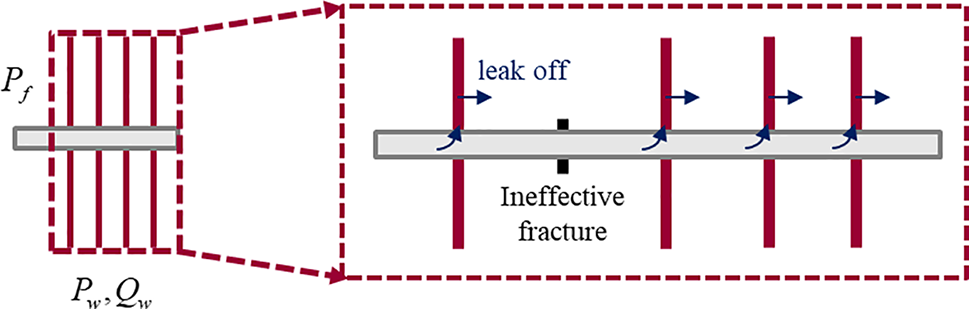
Figure 1: Schematic of hydraulic fractures for the bottom hole boundary condition
where Pw is the bottom hole pressure, Pa; Pf is the pressure in the hydraulic fracture, Pa; ρ is the fluid density, kg/m3; Qw is the flow rate at the bottom of the well, m3/s; Np is the number of opened perforations; d is the perforation diameter, m; CD is the flow coefficient; Nf is the number of opened clusters; hf is the height of the hydraulic fracture, m; lf is the half-length of the hydraulic fracture, m; wf is the width of the hydraulic fracture, m; Qleak is the fluid loss rate in the hydraulic fracture, m3/s. The width of the hydraulic fracture is related to the fluid pressure and the height of the fracture, which can be calculated by the following equation [27]:
where σmin is the minimum horizontal principal stress, Pa; ν is the Poisson’s ratio of the formation rock; G is the shear modulus of the formation rock, Pa. The fluid loss in the hydraulic fracture can be calculated by the following equation [28,29]:
where CL is the fluid loss coefficient in the hydraulic fracture, m/s0.5; tf is the time since the start of hydraulic fracturing, s. In prior models, hydraulic fractures were analogous to an electrical circuit system and the physical properties of fracture were lumped into a few electrical parameters, which to some extent lost their intuitiveness. Our proposed model provides an improved description of the physics downhole by introducing more fracture geometrical parameters that directly link the fracture geometry to the pump shutdown pressure signal. This improves the physical intuitiveness but also increases the uncertainty for the pump shutdown pressure analysis.
The method of characteristic is used to solve the pressure evolution model during hydraulic fracturing pump shutdown. By introducing two characteristic values ±g/a and combining the continuity equation and the motion equation, two sets of ordinary differential equations can be obtained as follows:
The pressure head and flow rate of each wellbore node at different times can be derived by dividing the wellbore into segments and using the finite difference method for numerical discretization. The solution formulas are as follows:
where the coefficients are calculated as follows:
The above equations give the basic numerical schemes for evolution of shutdown pressure on wellbore nodes except the nodes of wellhead and well bottom. The pressure on the nodes of wellhead and well bottom can be determined with the boundary conditions (i.e., Eqs. (7) and (8)).
3 Analysis of Pump Shutdown Pressure Characteristics
The present study aims to investigate the impact of various fracture parameters on the pump shutdown pressure response and provide insights for interpreting fracture geometry. To achieve this, we conduct simulations of the pump shutdown pressure response under differing fracture half-lengths, fracture heights, numbers of opened clusters and perforations, and leak-off coefficients. Table 1 displays the basic parameters employed in the simulations, adopted from a multi-cluster fractured shale gas reservoir located in southwest China. The outcomes of the sensitivity analysis can be utilized to optimize hydraulic fracturing designs and operations, thereby enhancing productivity and improving the efficiency of oil and gas recovery.
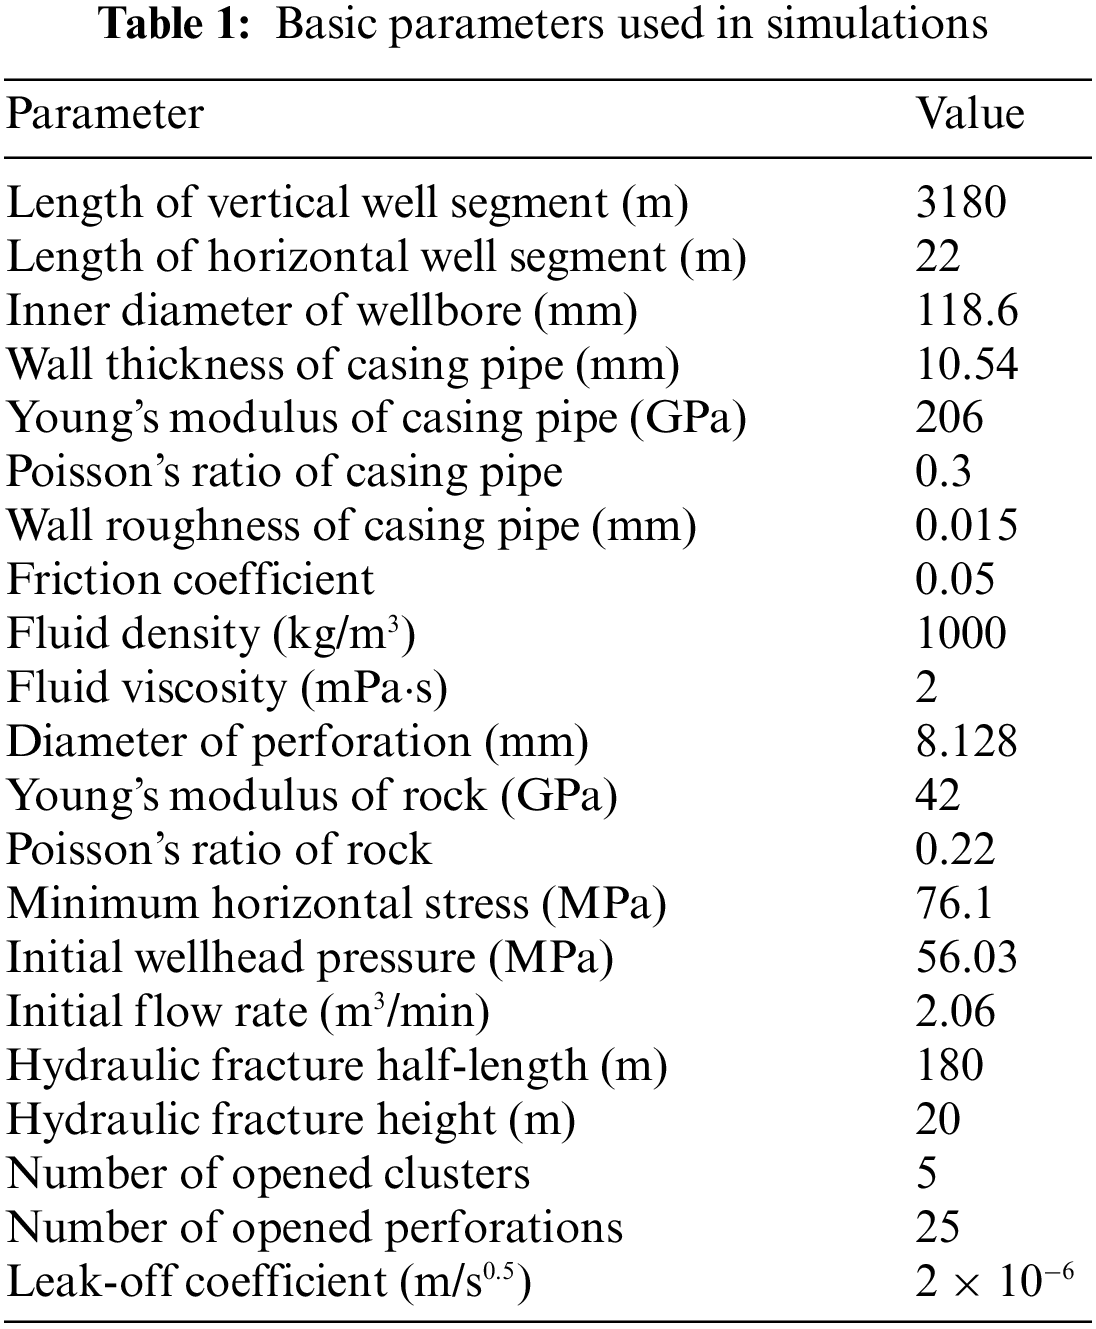
3.1 Effect of Fracture Half-Length
This subsection explores the impact of fracture half-length on the features of shutdown pressure evolution. Four fracture half-lengths of 80, 130, 180, and 230 m were simulated, and the corresponding shutdown pressures were computed, as shown in Fig. 2. First, the features of shutdown pressure evolution under the basic parameters are analyzed. The shutdown pressure exhibits an oscillatory decay pattern, with a high initial level and amplitude of pressure drop, followed by a gradual decrease in both pressure and oscillation magnitude. This pattern is attributed to the interplay of various factors, such as wellbore-perforation friction, fracture aperture variation, and filtration. Moreover, based on the results under different fracture half-lengths (Fig. 2), it is observed that the fracture half-length mainly influences the decay rate of shutdown pressure. Specifically, a larger fracture half-length leads to a faster decay of shutdown pressure as it increases the filtration area within the fracture, causing a progressive release of pressure from the wellbore to the formation.
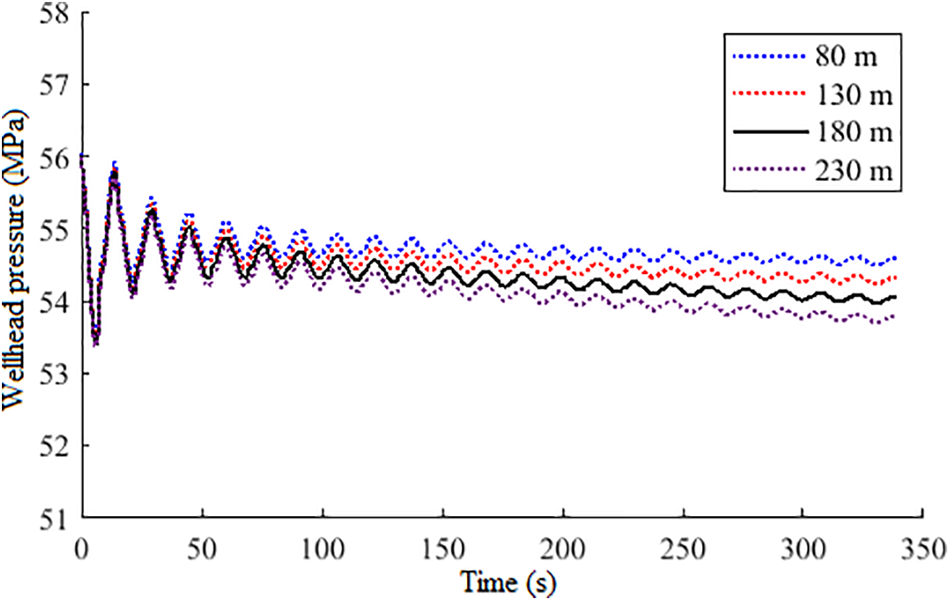
Figure 2: Pressure evolution after pump shutdown under different fracture half-length
In this subsection, the impact of fracture height on the characteristics of shutdown pressure evolution is analyzed. Fig. 3 presents the simulation results of shutdown pressure under different fracture heights of 10, 20, 30, and 40 m. The effect of fracture height on the evolution of shutdown pressure is significantly different from that of fracture length. Specifically, as fracture height increases, the decay rate of shutdown pressure slows down. Although the increase of fracture height promotes the filtration area inside the fracture, it also significantly affects the compressibility of the fracture. As shown in Eq. (9), a larger fracture height corresponds to a larger allowed range of fracture aperture change with pressure, indicating a better elastic storage capacity of the fracture. Thus, when the fracture height is relatively small, the elastic storage capacity of the fracture is poor. The fluid charging and releasing within the fracture cause significant energy loss, resulting in a faster pressure decay. Conversely, when the fracture height is relatively large, the fracture space is more prone to deformation, and the aperture can vary significantly. The energy loss from fluid charging and releasing is smaller, leading to a slower decay rate of pressure.
Figure 3: Pressure evolution after pump shutdown under different fracture height
3.3 Effect of Opened Fracture Clusters and Perforation Numbers
During multi-cluster hydraulic fracturing, 2 to 8 clusters are usually designed in each fracturing stage, with 7 to 24 perforations per cluster. However, the competition among different clusters may lead to some perforations not being opened during the fracturing process, resulting in a discrepancy between the opened cluster/perforation numbers and the designed values. Because of the correlation constraint between the number of opened clusters and perforations, they are jointly analyzed in this study. The shutdown pressure evolution is simulated with the number of opened clusters varying from 2 to 5, assuming that 5 perforations are opened in each cluster. The simulation results are shown in Fig. 4. The number of opened clusters and perforations mainly affects the overall level of pump shutdown pressure. The fewer clusters and perforations opened, the lower the overall pump shutdown pressure. This can be explained by Eq. (7), where the decrease of opened perforations at the same flow rate significantly increases the perforation frictional loss, resulting in a significant decrease in the level of pump shutdown pressure.
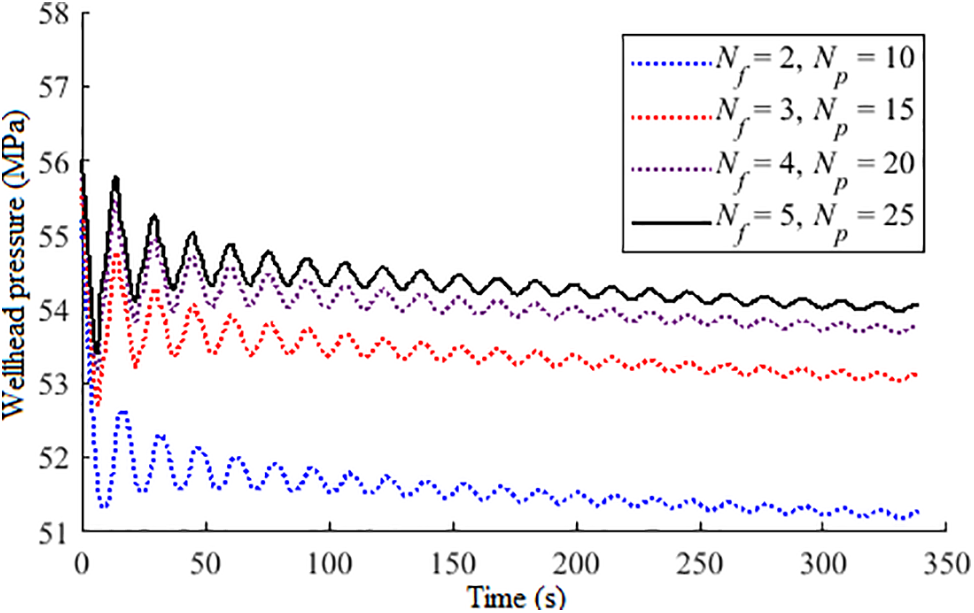
Figure 4: Pressure evolution after pump shutdown under different number of opened cluster and perforation
3.4 Effect of Leak-Off Coefficient
During the process of hydraulic fracturing pumping and shut-in, the fluid leak-off in the fracture has an important influence on the pressure dynamic evolution. As the fluid in the fracture gradually filters into the formation, there will be a certain degree of pressure dissipation in the wellbore. Simulation analysis was conducted by taking the leak-off coefficient as 2 × 10⁻⁷, 2 × 10⁻⁶, and 1 × 10⁻⁵ m/s0.5, respectively. The simulation results are shown in Fig. 5. The leak-off coefficient affects the decay rate of pump shutdown pressure. The larger the leak-off coefficient, the easier the pressure in the wellbore will dissipate into the formation, and the faster the pump shut-in pressure will decline.
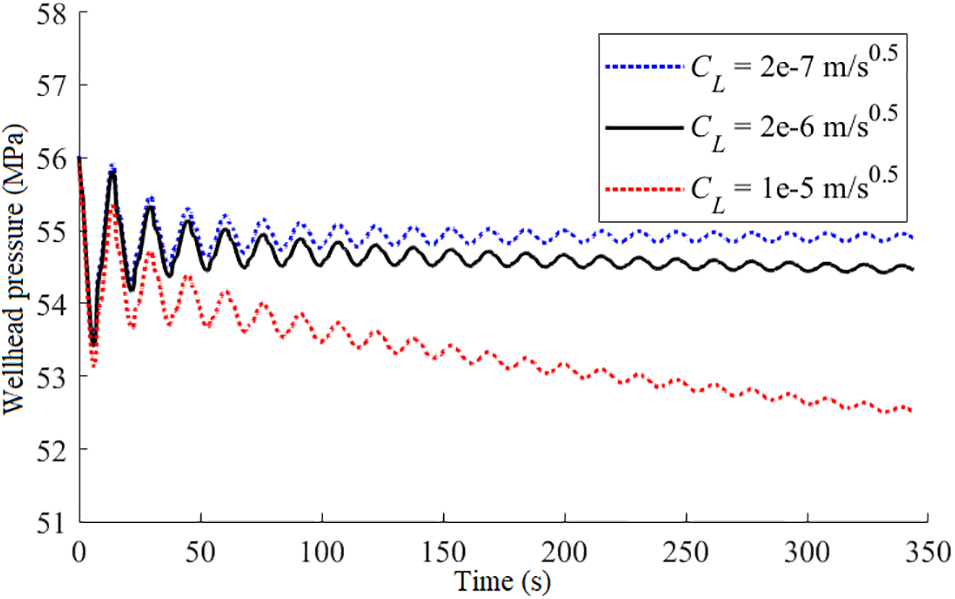
Figure 5: Pressure evolution after pump shutdown under different leak-off coefficient
3.5 Effect of Horizontal Wellbore Length
During multi-stage hydraulic fracturing, the effective horizontal wellbore length is different for different fracturing stages due to the application of bridge plugging or packer. Therefore, it is necessary to investigate the response of pump shutdown pressure under different horizontal wellbore length. Simulation analysis was conducted under different horizontal wellbore length of 1, 2 and 3 km, respectively. The simulation results are shown in Fig. 6. It is obvious that the period of the oscillating shutdown pressure is greatly affected by the horizontal wellbore length. The period of the pump shutdown pressure increases with the length of horizontal wellbore increasing, because longer horizontal wellbore prolongs the time for the pressure wave traveling from well bottom to the wellhead.
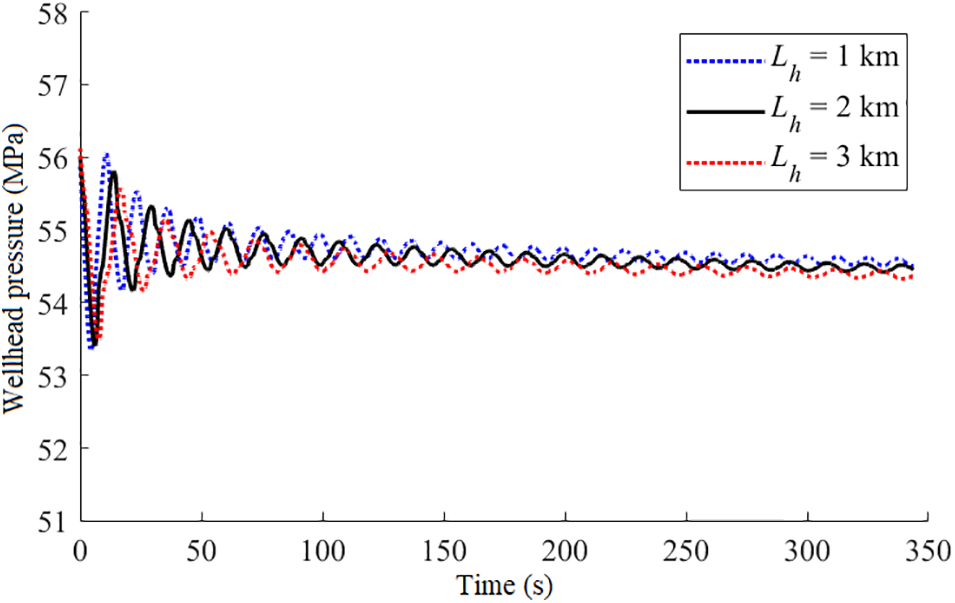
Figure 6: Pressure evolution after pump shutdown under different horizontal wellbore length
4 Fracture Interpretation in a Field Case
To verify the applicability of the simulation method in practice, the pump shutdown pressure of one fracturing stage of a shale gas reservoir is analyzed for interpretation of hydraulic fracture geometry. The basic parameter is illustrated in Table 1. The pump pressure and flow rate during hydraulic fracturing are shown in Fig. 7, from which the pump shutdown pressure is extracted. For this fracturing stage, 7 clusters are designed, with 8 perforations for each cluster. Then the effective hydraulic fracture parameters, including fracture half-length, fracture height, number of opened clusters, and number of opened perforations, can be interpretated by fitting the measured pump shutdown pressure as shown in Fig. 7b. Fig. 8 shows the simulation result of pump shutdown pressure fitting to the measured data, which exhibits good agreement. The corresponding interpreted fracture parameters are as follows: the fracture half-length is 190 m, the fracture height is 22 m, the number of opened clusters is 6, and the number of opened perforations is 30. The results are compared with those interpreted by the micro-seismic data. The fracture half-length is 176.3 m, and the fracture height is 25.7 m in the micro-seismic interpretation. The errors between the pump shutdown pressure interpretation and micro-seismic interpretation are 7.2% and 16.8% for fracture half-length and fracture height, respectively. The good consistency between the two results verifies to some extent our model for pump shutdown pressure calculation.
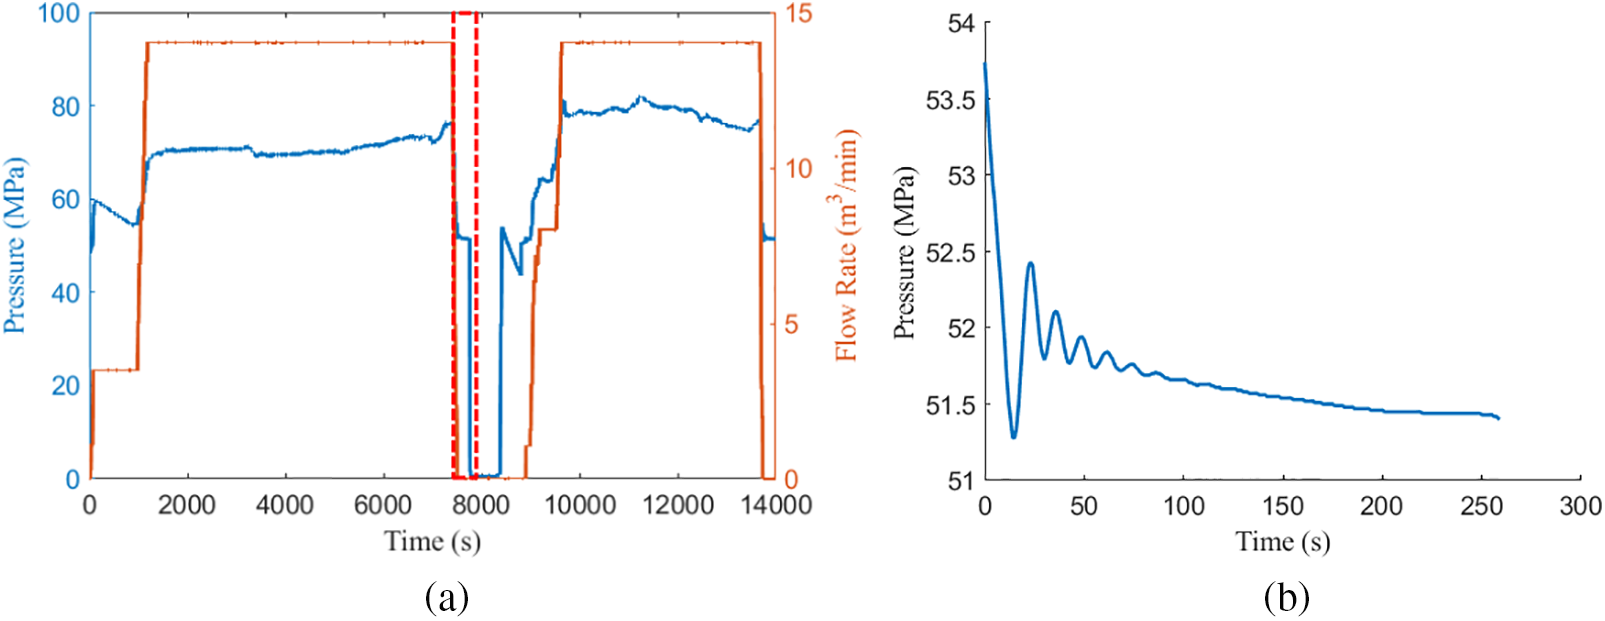
Figure 7: Profiles of (a) pump pressure and flow rate during hydraulic fracturing and (b) extracted pump shutdown pressure
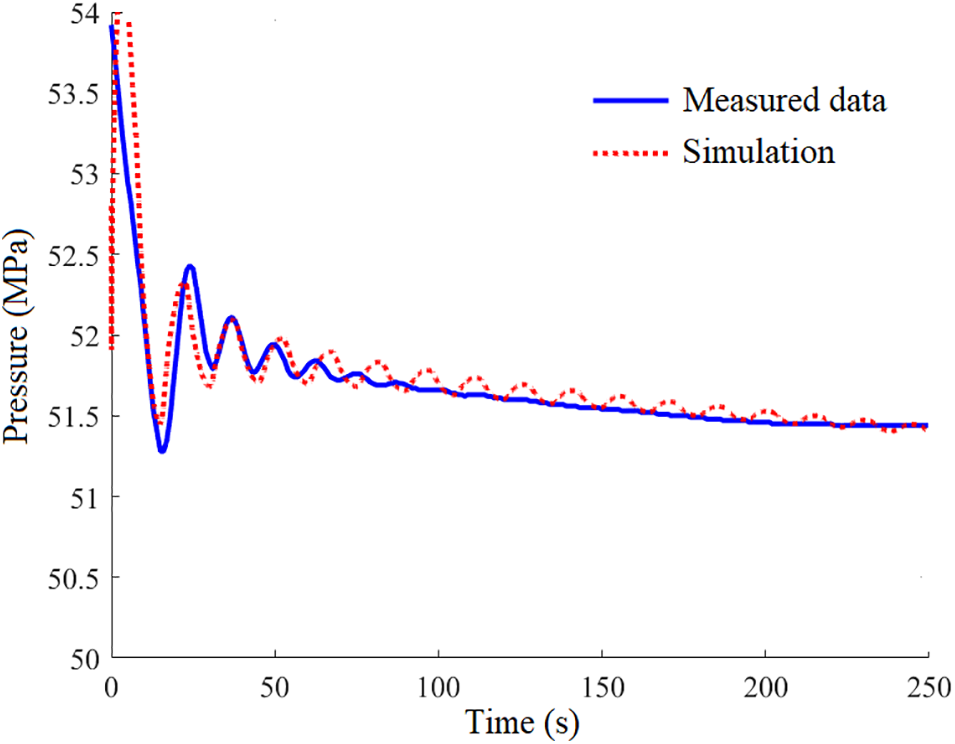
Figure 8: Comparison between simulation result and measured pump shutdown pressure
In this study, the mathematical model and simulation method for shutdown pressure evolution are proposed. The effects of wellbore friction, perforation friction and fluid loss in fractures are fully considered in the model, which can provide an accurate characterization of shutdown pressure response during hydraulic fracturing. The impacts of fracture half-length, fracture height, opened cluster and perforation number, and filtration coefficient on the evolution of shutdown pressure are thoroughly analyzed. A field case study is conducted to interpret the fracture parameters by fitting the measured pump shutdown pressure, which verifies the applicability of the simulation method in practice. The following conclusions are drawn:
1. The increase of fracture half-length can increase the filtration area, which accordingly accelerates the decline rate of the pump shutdown pressure.
2. The increase in fracture height can increase the elastic storage capacity of the fracture, reduce the energy loss of the shut-in pressure, and slow down the rate of pressure decline.
3. Reducing the number of opened clusters of perforations will increase the frictional losses of the perforations, leading to a significant decrease in the shut-in pressure level.
4. Increasing the leak-off coefficient will accelerate the loss of pressure in the wellbore and the rate of shut-in pressure decline.
The study illustrates that the pump shutdown pressure can provide a real-time and efficient approach for the interpretation and diagnosis of hydraulic fractures. The effects of hydraulic fracture properties on pump shutdown pressure characteristics are thoroughly investigated. The quantitative relationship between the fracture parameters and pump shutdown pressure characteristics can be determined in the further research to promote the pump shutdown pressure analysis as an efficient hydraulic fracture diagnostic tool. Moreover, there is uncertainty by using pump shutdown pressure as a hydraulic fracturing diagnostic approach. The inversion method and uncertainty analysis can be further introduced to provide an accurate and comprehensive evaluation of hydraulic fractures by using pump shutdown pressure.
Acknowledgement: None.
Funding Statement: The work is supported by the Sub-Project of “Research on Key Technologies and Equipment of Reservoir Stimulation” of China National Petroleum Corporation Post–14th Five-Year Plan Forward-Looking Major Science and Technology Project “Research on New Technology of Monitoring and Diagnosis of Horizontal Well Hydraulic Fracture Network Distribution Pattern” (2021DJ4502).
Author Contributions: The authors confirm contribution to the paper as follows: study conception and design: Huaiyin He, Lijun Liu; data collection: Longqing Zou, Huan Wen; analysis and interpretation of results: Yanchao Li, Yixuan Wang, Bei Chang, Junxiang Li; draft manuscript preparation: Huaiyin He, Longqing Zou, Lijun Liu. All authors reviewed the results and approved the final version of the manuscript.
Availability of Data and Materials: The datasets used or analyzed during the current study are available from the corresponding author on reasonable request.
Conflicts of Interest: The authors declare that they have no conflicts of interest to report regarding the present study.
References
1. Yao, J., Sun, H., Huang, Z., Zhang, L., Zeng, Q. et al. (2013). Key mechanical problems in the developmentof shale gas reservoirs. SCIENTIA SINICA Physica, Mechanica & Astronomica, 43, 1527–1547. [Google Scholar]
2. Li, M. (2014). Fracturing technology of shale oil and gas reservoirs abroad. Inner Mongolia Petrochemical Industry, 40(3), 101–104. [Google Scholar]
3. Liu, X., Zhang, Y., Zhong, X., Wang, S., Wang, H. (2014). Fracturing techniques by the horizontal wells in USA typical shale oil reservoirs. Petroleum Geology and Oilfield Development in Daqing, 33(6), 160–164. [Google Scholar]
4. Feng, F., Lei, Y., Hu, C., Han, X., Huang, R. (2017). Analysis on breakdown pressure of perforation clusters in horizontal well staged multi-cluster fracturing. Natural Gas and Oil, 35(3), 85–91. [Google Scholar]
5. Li, Y., Zhang, Q., Shen, J., Xu, Y., He, F. et al. (2022). Volumetric stimulation technology of long-section multi-cluster temporary plugging in shale gas reservoirs. Natural Gas Industry, 42(2), 143–150. [Google Scholar]
6. Lei, Q., Weng, D., Xiong, S., Liu, H., Guan, B. et al. (2021). Progress and development directions of shale oil reservoir stimulation technology of China National Petroleum Corporation. Petroleum Exploration and Development, 48(5), 1035–1042. [Google Scholar]
7. Xia, H. (2020). The research and field testing of dual temporary plugging fracturing technology for shale gas wells. Petroleum Drilling Techniques, 48(3), 90–96. [Google Scholar]
8. Guo, J., Zhao, Z., Lu, Q., Yin, C., Chen, C. (2021). Research progress in key mechanical theories of deep shale network fracturing. Natural Gas Industry, 41(1), 102–117. [Google Scholar]
9. Xu, Y., Lei, Q., Chen, M., Wu, Q., Yang, N. et al. (2018). Progress and development of volume stimulation techniques. Petroleum Exploration and Development, 45(5), 874–887. [Google Scholar]
10. Chen, H., Tang, Y., Niu, F., Yin, C., Wu, F. (2016). Rencent advances in microseismic monitoring and implications for hydraulic fracturing mapping. Petroleum Science Bulletin, 1(2), 198–208. [Google Scholar]
11. Liu, X. (2016). The application of downhole microseismic monitoring technology in shale gas “well factory” hydraulic fracturing. Petroleum Drilling Techniques, 44(4), 102–107. [Google Scholar]
12. Liu, Y., Wu, K., Jin, G., Moridis, G. (2020). Rock deformation and strain-rate characterization during hydraulic fracturing treatments: Insights for interpretation of low-frequency distributed acoustic-sensing signals. SPE Journal, 25(5), 2251–2264. [Google Scholar]
13. Chen, M., Guo, T., Xu, Y., Qu, Z., Zhang, S. et al. (2022). Evolution mechanism of optical fiber strain induced by multi-fracture growth during fracturing in horizontal wells. Petroleum Exploration and Development, 49(1), 183–193. [Google Scholar]
14. Zang, C., Jiang, H., Shi, S., Li, J., Zou, Y. et al. (2022). An analysis of the uniformity of multi-fracture initiation based on downhole video imaging technology: A case study of Mahu tight conglomerate in Junggar Basin, NW China. Petroleum Exploration and Development, 49(2), 394–402. [Google Scholar]
15. Liu, Y., Leung, J. Y., Chalaturnyk, R. J., Virues, C. J. (2019). New insights on mechanisms controlling fracturing-fluid distribution and their effects on well performance in shale-gas reservoirs. SPE Production & Operations, 34(3), 564–585. [Google Scholar]
16. Liu, L., Fan, W., Sun, X., Huang, Z., Yao, J. et al. (2023). Gas condensate well productivity in fractured vuggy carbonate reservoirs: A numerical modeling study. Geoenergy Science and Engineering, 225, 211694. [Google Scholar]
17. Liu, L., Liu, Y., Yao, J., Huang, Z. (2020). Efficient coupled multiphase-flow and geomechanics modeling of well performance and stress evolution in shale-gas reservoirs considering dynamic fracture properties. SPE Journal, 25(3), 1523–1542. [Google Scholar]
18. Zhou, T., Su, J., Li, F., Liu, G., Liao, R. (2019). An approach to estimate hydraulic fracture parameters with the pressure falloff data of main treatment. Natural Gas Geoscience, 30(11), 1646–1654. [Google Scholar]
19. Holzhausen, G. R., Gooch, R. P. (1985). Impedance of hydraulic fractures: Its measurement and use for estimating fracture closure pressure and dimensions. SPE/DOE Low Permeability Gas Reservoirs Symposium, Denver, Colorado, USA. [Google Scholar]
20. Mondal, S. (2010). Pressure transients in wellbores: Water hammer effects and implications (Ph.D. Thesis). The University of Texas at Austin, USA. [Google Scholar]
21. Carey, M. A., Mondal, S., Sharma, M. M. (2015). Analysis of water hammer signatures for fracture diagnostics. Annual Technical Conference and Exhibition, Houston, Texas, USA. [Google Scholar]
22. Ma, X., Zhou, F., Andrade, J. A., Gosavi, S., Burch, D. (2019). Evaluation of water hammer analysis as diagnostic tool for hydraulic fracturing. Proceedings of the Unconventional Resources Technology Conference, Denver, Colorado, USA. [Google Scholar]
23. Qiu, Y., Hu, X., Zhou, F., Li, Z., Li, Y. et al. (2022). Water hammer response characteristics of wellbore-fracture system: Multi-dimensional analysis in time, frequency and quefrency domain. Journal of Petroleum Science and Engineering, 213, 110425. [Google Scholar]
24. Dung, N., David, C., Tom, D., Jon, S., Nico, R. et al. (2021). Practical applications of water hammer analysis from hydraulic fracturing treatments. Proceedings of the SPE Hydraulic Fracturing Technology Conference and Exhibition, Virtual. [Google Scholar]
25. Brown, G. O. (2003). The history of the Darcy-Weisbach equation for pipe flow resistance. In: Rogers, J., Fredrich, A. (Eds.Environmental and water resources history, pp. 34–43. USA: ASCE Press. [Google Scholar]
26. Massaras, L. V., Dragomir, A., Chiriac, D. (2007). Enhanced fracture entry friction analysis of the rate step-down test. Proceedings of the SPE Hydraulic Fracturing Technology Conference, Texas, USA. [Google Scholar]
27. Paige, R., Murray, L., Roberts, J. (1995). Field application of hydraulic impedance testing for fracture measurement. SPE Production & Facilities, 10(1), 7–12. [Google Scholar]
28. Li, J., Wu, K. (2022). An efficient model for hydraulic fracture height growth considering the effect of bedding layers in unconventional shale formations. SPE Journal, 27(6), 3740–3756. [Google Scholar]
29. Li, J., Liu, Y., Wu, K. (2022). A new higher order displacement discontinuity method based on the joint element for analysis of close-spacing planar fractures. SPE Journal, 27(2), 1123–1139. [Google Scholar]
Cite This Article
 Copyright © 2024 The Author(s). Published by Tech Science Press.
This work is licensed under a Creative Commons Attribution 4.0 International License , which permits unrestricted use, distribution, and reproduction in any medium, provided the original work is properly cited.
 Downloads
 Citation Tools