
 Submit a Paper
 Propose a Special lssue
 Open Access
ARTICLE
Productivity Prediction Model of Perforated Horizontal Well Based on Permeability Calculation in Near-Well High Permeability Reservoir Area
1 College of the Earth Science, Yangtze University, Wuhan, 430100, China
2 PetroChina Changqing Oilfield Fifth Oil Production Plant, Xi’an, 710201, China
3 Sinopec Jianghan Oilfield Information Center, Wuhan, 430100, China
* Corresponding Author: Shuangshuang Zhang. Email:
Energy Engineering 2024, 121(1), 59-75. https://doi.org/10.32604/ee.2023.041709
Received 03 May 2023; Accepted 02 August 2023; Issue published 27 December 2023
 View Full Text
 Download PDF
Abstract
To improve the productivity of oil wells, perforation technology is usually used to improve the productivity of horizontal wells in oilfield exploitation. After the perforation operation, the perforation channel around the wellbore will form a near-well high-permeability reservoir area with the penetration depth as the radius, that is, the formation has different permeability characteristics with the perforation depth as the dividing line. Generally, the permeability is measured by the permeability tester, but this approach has a high workload and limited application. In this paper, according to the reservoir characteristics of perforated horizontal wells, the reservoir is divided into two areas: the original reservoir area and the near-well high permeability reservoir area. Based on the theory of seepage mechanics and the formula of open hole productivity, the permeability calculation formula of near-well high permeability reservoir area with perforation parameters is deduced. According to the principle of seepage continuity, the seepage is regarded as the synthesis of two directions: the horizontal plane elliptic seepage field and the vertical plane radial seepage field, and the oil well productivity prediction model of the perforated horizontal well is established by partition. The model comparison demonstrates that the model is reasonable and feasible. To calculate and analyze the effect of oil well production and the law of influencing factors, actual production data of the oilfield are substituted into the oil well productivity formula. It can effectively guide the technical process design and effect prediction of perforated horizontal wells.Keywords
Designation
| Original formation permeability, μm2 | |
| Permeability of perforation zone, μm2 | |
| Supply boundary radius, m | |
| Wellbore radius, m | |
| Perforation radius, m | |
| Wellbore radius converted by perforation completion, m | |
| Wellbore radius converted by perforation completion, m | |
| Circular isobaric radius, m | |
| Perforation length (perforation depth), m | |
| Perforation density, hole/m | |
| Borehole well production, m3/d | |
| Bottom hole flowing pressure, MPa | |
| Boundary pressure, MPa | |
| Formation thickness, m | |
| Formation crude oil viscosity, mPa•s | |
| Crude oil conversion coefficient, underground/ground tons | |
| Perforation phase angle | |
| Horizontal elliptical seepage field long semi-axis of horizontal well, m | |
| Horizontal elliptical seepage field short half axis of horizontal well, m | |
| Horizontal section length of perforated horizontal well, m | |
| Perforated horizontal well productivity, m3/d | |
| Boundary pressure of horizontal well near wellbore area, MPa | |
| Circular isobaric boundary pressure, MPa | |
| Boundary pressure of outer edge of near-well high permeability reservoir area, MPa |
During the advancement of oil and gas fields, perforation completion frequently serves to boost output in horizontal wells. Numerous refinements in the perforation process have been accomplished over time, enhancing the fluid passage’s efficiency between the production stratum and wellbore while reducing harm to the production layer. Researchers employed a preliminary electrolytic simulation model to examine the influence of factors such as perforation length, radius, and phase angle on the productivity of wells [1,2]. The perforation may be long enough for the productivity of the perforated well to surpass that of the open hole well, according to the findings. An experiment using electrolysis equipment led to the development of the empirical equation for perforation flow efficiency.
Researchers have suggested finite difference and finite element numerical methods to get the analytical expression of perforation productivity. Hong employed the finite difference approach to acquire productivity data, concluding that the effect of perforation shape, length, and orientation on formation varies [3]. Bell et al. discovered using the finite difference method that the permeability of the compacted region surrounding the perforated hole is between 10% and −20% of the original formation [4]. McLeod et al. presented the skin of the fracture area and damage area based on simplifying the geometric perforation model and determined the productivity formula of perforated wells [5,6]. With the enhancement of computing facilities function, to assess the productivity of perforated wellbore, Roostaei et al. employed the particular finite difference algorithm for a near wellbore grid, which can readily represent various perforation configurations [7,8]. Based on a finite difference model, Zhang et al. investigated the variables affecting the permeability distribution surrounding perforated tunnels [9]. Koltz et al. were the first to assess perforation productivity with compacted zones using the finite element approach [10]. To analyze the perforation capacity with compaction zones, damaged zones surrounding wellbores, and varied phase angles between neighboring perforations, Locke et al. initially utilized a three-dimensional (3-D) model [11,12], this approach can imitate the perforation geometry more precisely. In the compacted zone surrounding the hole, McLeod et al. utilized the idea of radial turbulence and developed a straightforward model for gauging productivity [5]. Elsanoose et al. overcame the finite difference model’s drawbacks by using hybrid and local mesh refining [13].
A semi-analytical model was built by Karakas et al. [14], who also proposed an empirical equation for calculating the perforation skin. He also analyzed the all-encompassing effect of formation contamination and perforation processes on the overall productivity of a well. The productivity of perforated wells under Darcy flow may be predicted using the semi-analytical model put forward by Hagoort [15]. Researchers analyzed the influence of perforation parameters based on semi-analytical models, including contaminated areas and crushed areas [16–21].
Scholars have put a lot of effort into developing a productivity prediction model for perforated horizontal wells. The seepage field and pressure drop distribution of horizontal wells were established by Borisov et al., along with several productivity forecast methods for horizontal wells [22,23]. The Joshi model is the most widely utilized among them. It primarily uses current field theory to simplify a three-dimensional seepage problem in horizontal wells to two interconnected two-dimensional seepage problems. The horizontal well productivity calculation model is generated by assuming that the oil discharge body of the horizontal well is an ellipsoid with the two ends of the horizontal section as the focus. Sognesand et al. developed a model for single-phase flow to address the issue of unequal inflow profiles in perforated horizontal wellbores [24]. A selected perforation method was chosen based on the impact of perforation compaction and others, however, the end model output was decreased. Su et al., through their experimental findings, have classified the pressure drop phenomena in horizontal wellbores into four distinct categories: pressure drop caused by friction against the tube wall, acceleration-induced pressure drop, pressure drop due to hole roughness, and pressure drop resulting from fluid mixing [25].
A coupling model of reservoir seepage and pipe flow in a wellbore was developed by Ouyang et al. [26]. The models of radial flow, axial flow, and semi-circular radiation flow were created by Li et al. using the finite element method after studying the two-dimensional analytical solution model of ideal flow [27]. Wu et al. suggested a productivity calculation method for horizontal perforated wells in low permeability reservoirs based on the three-radial flow model [16]. Liu et al. described how to create a transient calculation model for single-phase flow in horizontal wells from the perspectives of reservoir seepage, horizontal wellbore flow (using one flow as an example), and coupling model of two flows [28]. Bi et al. developed a three-dimensional unsteady productivity prediction model for horizontal wells using the finite volume approach [29]. This model may be utilized to forecast horizontal well pressure and production distribution in anisotropic reservoirs. The release impact of productivity has significant requirements on perforation parameters and reservoir parameters data during the perforated horizontal well completion process. Through a wide range of tests and techniques, researchers have explored productivity, skin factor, and seepage law. The choice of perforation technique and the productivity release are both influenced by various perforation parameters in distinct ways.
The model described in this paper is an oil well productivity prediction model based on the permeability calculation of near-well high permeability reservoir area. This refers to a method not incorporated in any of the existing models. The permeability in the model calculation was previously assessed by the permeability tester, however, this approach has a high workload and limited application.
During the perforation process, the perforating bullet will leave a perforation channel in the near-well reservoir area. The perforation channel will generate a near-well high-permeability reservoir area with the penetration depth as the radius around the wellbore, forming different permeability reservoir characteristics with the perforation depth as the dividing line. This paper constructs the permeability calculation formula of a perforated horizontal well near a well high permeability reservoir area using fluid mechanics theory and open hole productivity formula. The capacity prediction model is constructed in partition using the theories of disturbed elliptical flow and radial flow. The comparison of models validates the research’s methodology, proving it to be both rational and applicable. It is concluded that the oil well productivity formula can not only significantly reduce working time and calculation error, but also adeptly steers the technical process design and outcome forecasting for perforated horizontal wells. Moreover, it bolsters economic advantages for oilfield development.
Near-well stimulation measures are commonly applied to enhance oil well productivity when oilfields are exploited. Typically, the perforation stimulation technique is utilized to improve horizontal well production. The perforating bullet will create a perforation channel in the near-well reservoir region during the perforation process, and the channel will surround the wellbore in a radius of penetration depth to create a near-well high-permeability reservoir area.
The main content of this chapter is: that the reservoir is divided into two regions based on the reservoir characteristics of perforated horizontal wells: the original reservoir area and the near-well high permeability reservoir area. (1) After building a mathematical geometric model, a formula is used to determine the wellbore radius

Figure 1: Research method flow diagram
To begin, some assumptions must be made when constructing the steady-state flow productivity formula: the perforated well is an ideal horizontal well, and the formation is a single-layer and constant-thickness column; the fluid within the reservoir exhibits single-phase, incompressible flow characteristics, primarily in the form of laminar flow; and the supply radius is much larger than the sum of wellbore radius and perforation depth [14,21,30].
The pore distribution map presented in Fig. 2 is constructed in three-dimensional space. Fig. 2a indicates that the improved near-well high permeability reservoir area is within the range of perforation depth, but the original reservoir area is outside the range of perforation depth. The profile of the horizontal section of the wellbore is shown in Fig. 2b, and the reservoir model with differed permeability is produced by taking the perforation depth as the dividing line. That is, the reservoir of a perforated horizontal well is divided into two regions: one is the original reservoir region, and the other is the near-well high permeability reservoir region.
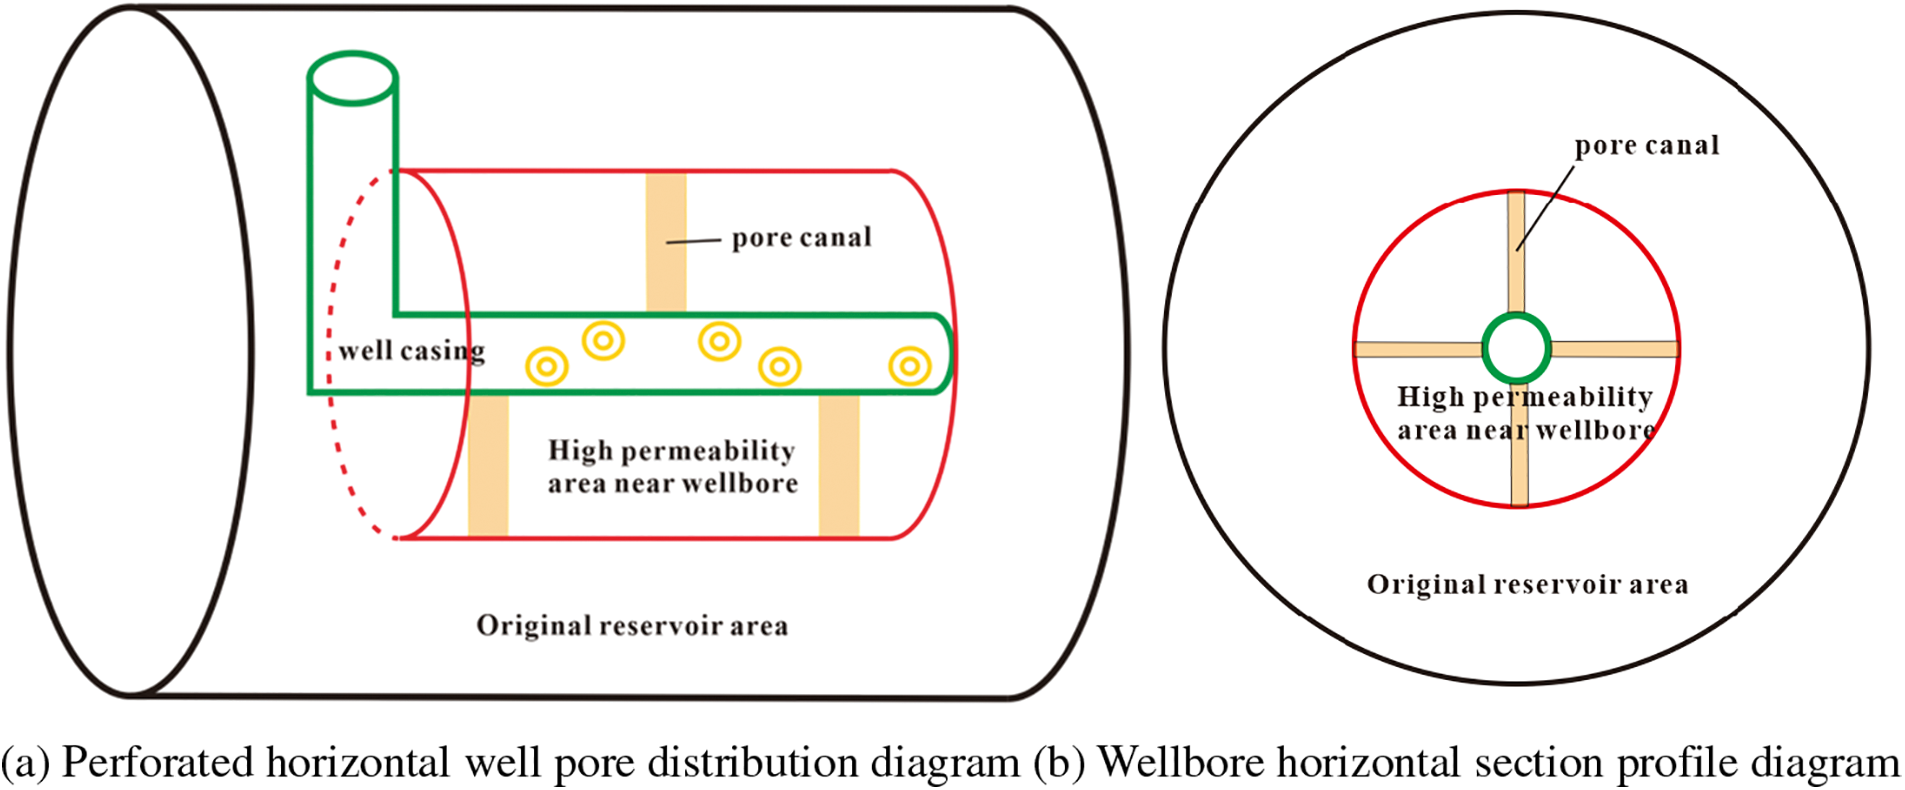
Figure 2: Schematic diagram of reservoir physical model
2.1 Permeability Calculation Formula of Perforation Zone
The perforation channel is considered to be a regular cylinder [14,30,31], and the wellbore is likewise assumed to be a normal cylinder, as illustrated in Fig. 3. The open area of the open-hole completion (well diameter

Figure 3: Wellbore-perforated hole geometric model diagram
1. The open area of open hole completion is regarded as the open area of the perforation completion foundation, and the upper bottom area of the perforation hole is regarded as the open area of the perforation completion foundation. The equation can be obtained:
The wellbore radius
The formation permeability in the perforation zone differs from the initial formation permeability as a result of the action of perforation. The formation may be separated into an original formation region and a high permeability area near the well perforation, with permeabilities of
2. The open area of open hole completion is regarded as the whole open area of perforation completion, and the whole open area of perforation completion is regarded as the sum of the side area of the perforation hole and the bottom area of the perforation hole. The equation can be obtained:
The wellbore radius
Substitute
From Eqs. (2), (3), (5), and (6), we have:
2.2 Perforated Horizontal Well Productivity Model
Based on Joshi model [23], the seepage field of the fluid around the horizontal well is equivalently decomposed in the process of formulating the productivity equation for perforated horizontal wells presented in this paper, and the three-dimensional flow mode is transformed into a two-dimensional flow model, yielding two continuous seepage fields-horizontal plane elliptic seepage field and vertical plane radial seepage field, as illustrated in Fig. 4. Calculating the flow rates in two planes separately results in the productivity of perforated horizontal wells.

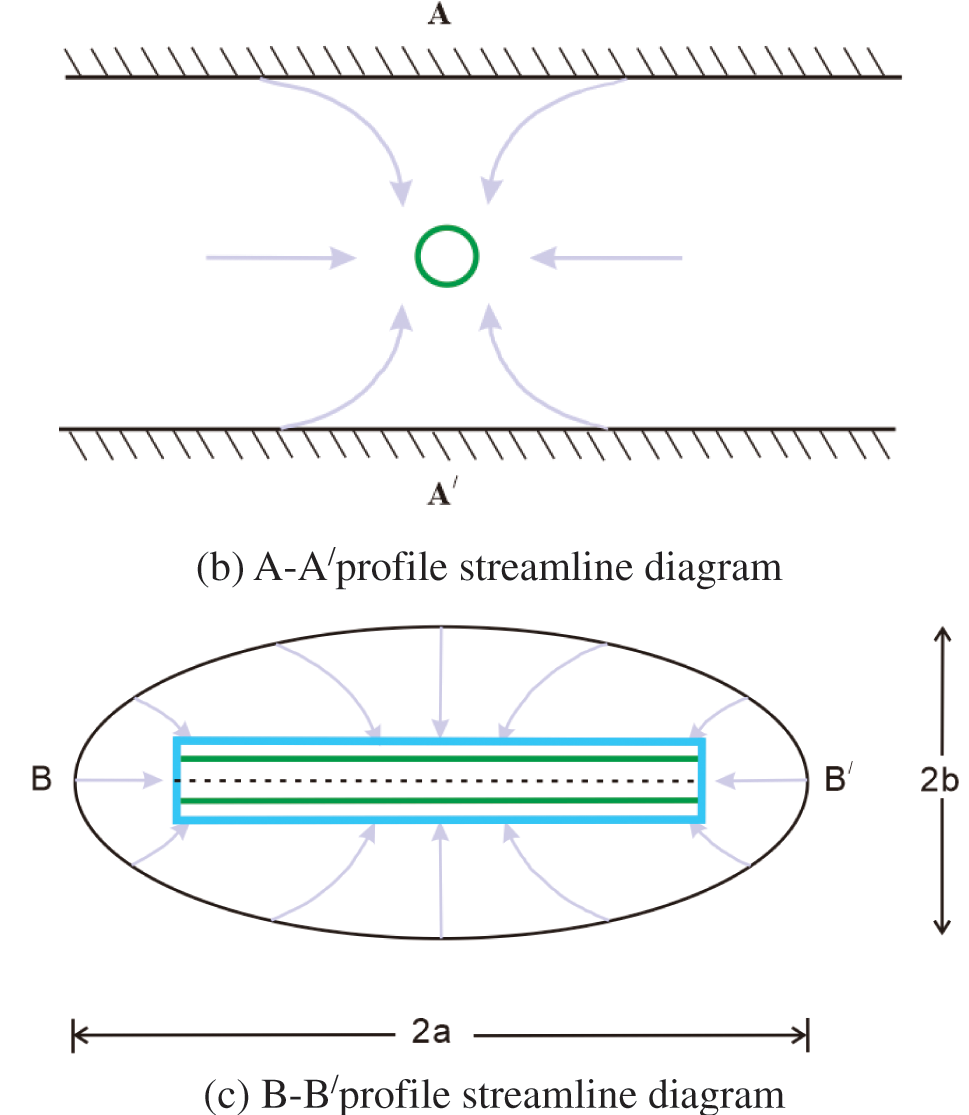
Figure 4: Horizontal well flow geometry diagram
1. Calculation of flow in horizontal elliptical seepage field
On the horizontal plane, the fluid surrounding the well flows in an elliptical flow from the reservoir supply edge to the near-wellbore area of the horizontal well, Fig. 4c. The horizontal well’s near-wellbore region is depicted in Fig. 4c as a light blue rectangle. The pressure boundary is expressed as
The meaning expressed in Fig. 5 is that the elliptic flow can be converted into a plane radial flow, which is convenient for the expression of the productivity formula. The elliptical area exists in the
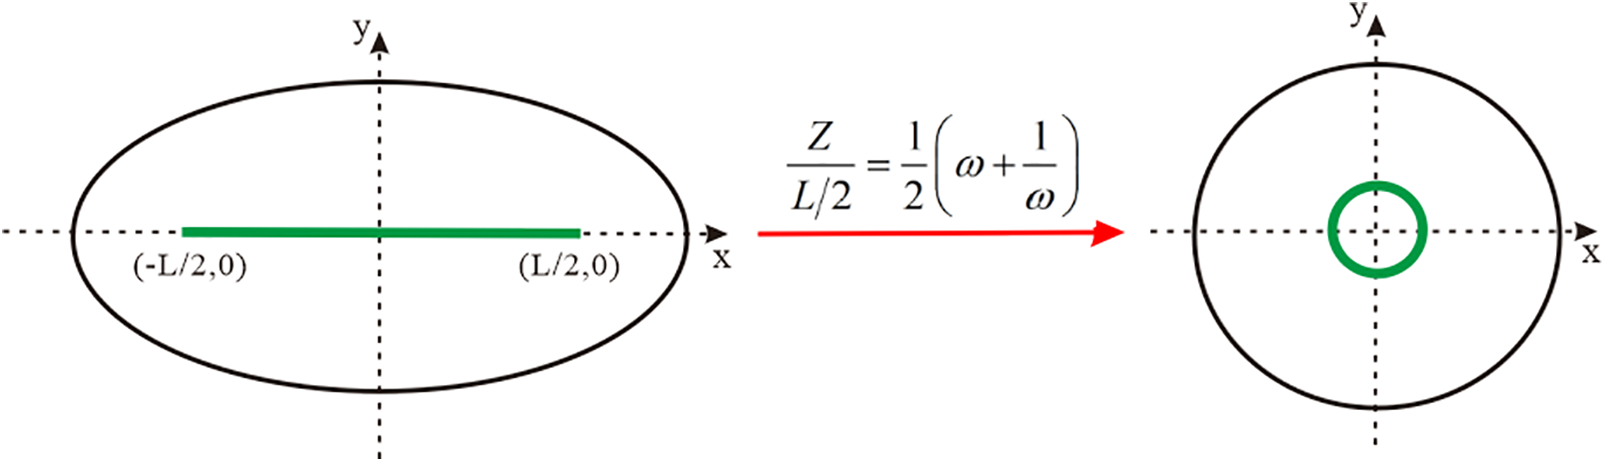
Figure 5: Horizontal elliptic seepage field transformation diagram of perforated horizontal well
According to the property of the ellipse:
The horizontal in-plane productivity formula of perforated horizontal wells can be expressed as:
2. Calculation of flow in vertical radial seepage field
On the vertical section, there is a seepage field flowing from the near wellbore area to the bottom of the horizontal well, as shown in Fig. 4b. Fig. 6 also shows the seepage field of the fluid flowing to the bottom of the well on the vertical section, but the fluid flow form is subdivided into three parts, which is helpful for the expression of the productivity formula:
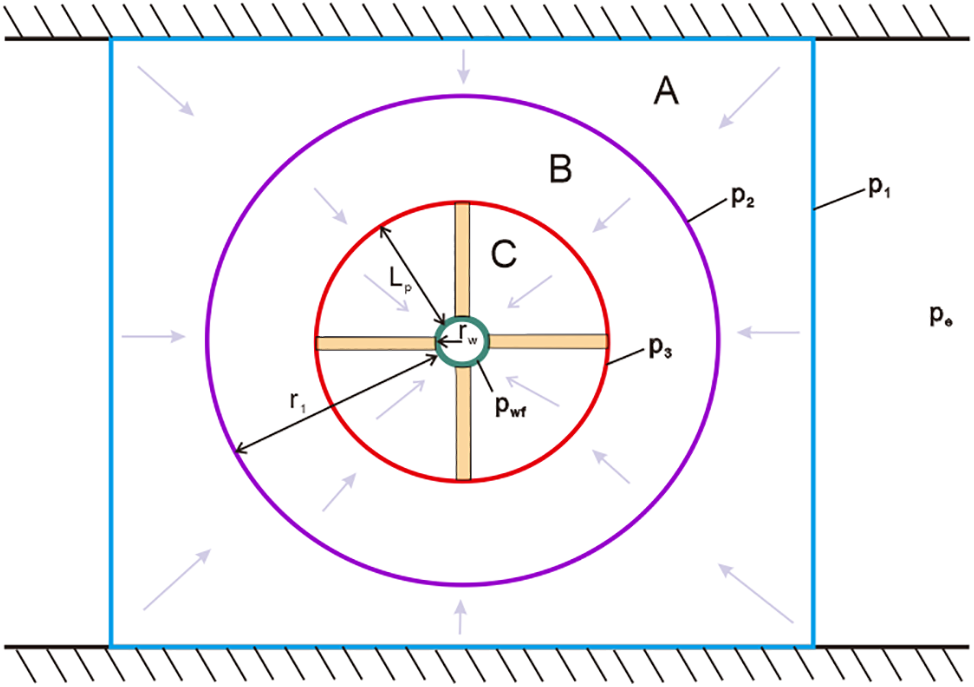
Figure 6: Perforated horizontal well vertical seepage field diagram
In Area A, which is a horizontal well near the well area, the fluid flows from the nearby well area to the circular isobaric border. The light blue rectangular line is near the well boundary, and its length and width are the oil layer thickness
At this time, when flowing from the near well area to the circular isobaric boundary, the productivity formula may be written as follows:
Block B is the transition zone from the near well area to the perforation high permeability reservoir area. The fluid flows from the circular isobaric boundary to the outer edge of the near-well high-permeability reservoir area. The red circle line represents the outer boundary of the near-well high-permeability reservoir area. Its radius is determined by the perforation depth
The productivity equation may now be written as follows when flowing from the circular isobaric boundary to the region of the near-well high-permeability reservoir:
In region C, which is a high permeability reservoir area of perforated horizontal wells, the fluid travels from the outside border of the near-well high permeability reservoir region to the bottom hole. The wellbore is represented by the green circle, and the wellbore pressure is
Currently, the flow from the near-well high-permeability reservoir area to the bottom hole, and the productivity formula may be represented as follows:
The seepage equation of the perforated horizontal well may be determined by adding the flow formula of the horizontal elliptical seepage field to the flow formula of the vertical radial seepage field:
The flow rates from the supply boundary to the near-wellbore area, the near-wellbore area to the circular isobaric boundary, the circular isobaric boundary to the outer edge of the near-wellbore high-permeability reservoir area, and the near-wellbore high-permeability reservoir area to the wellbore are all equal according to the principle of fluid seepage continuity. Perforated horizontal well productivity equation can be changed into:
where:
Models developed by Karakas et al. [14] and McLeod et al. [5] show strong representativeness in perforated well productivity calculation models. These two models are reliable and accurate for calculating actual productivity. The Joshi [23] model is true and dependable for actual calculation results in the horizontal well productivity calculation model. As a result, we compare the proposed model’s errors for calculating productivity to those of the Joshi, Karakas, and McLeod models. We substitute the basic parameters from Table 1 into each model.

From the curve of pressure difference and productivity change in Fig. 7, it can be seen that the calculation results of the model in this paper are more consistent with the Karakas model and the McLeod model, and the error is very small. There is a gap in the curve distribution of the Joshi model, and the error is large. Table 2 shows the productivity and error values of the four models when the pressure difference is 6, 12, 18 MPa.
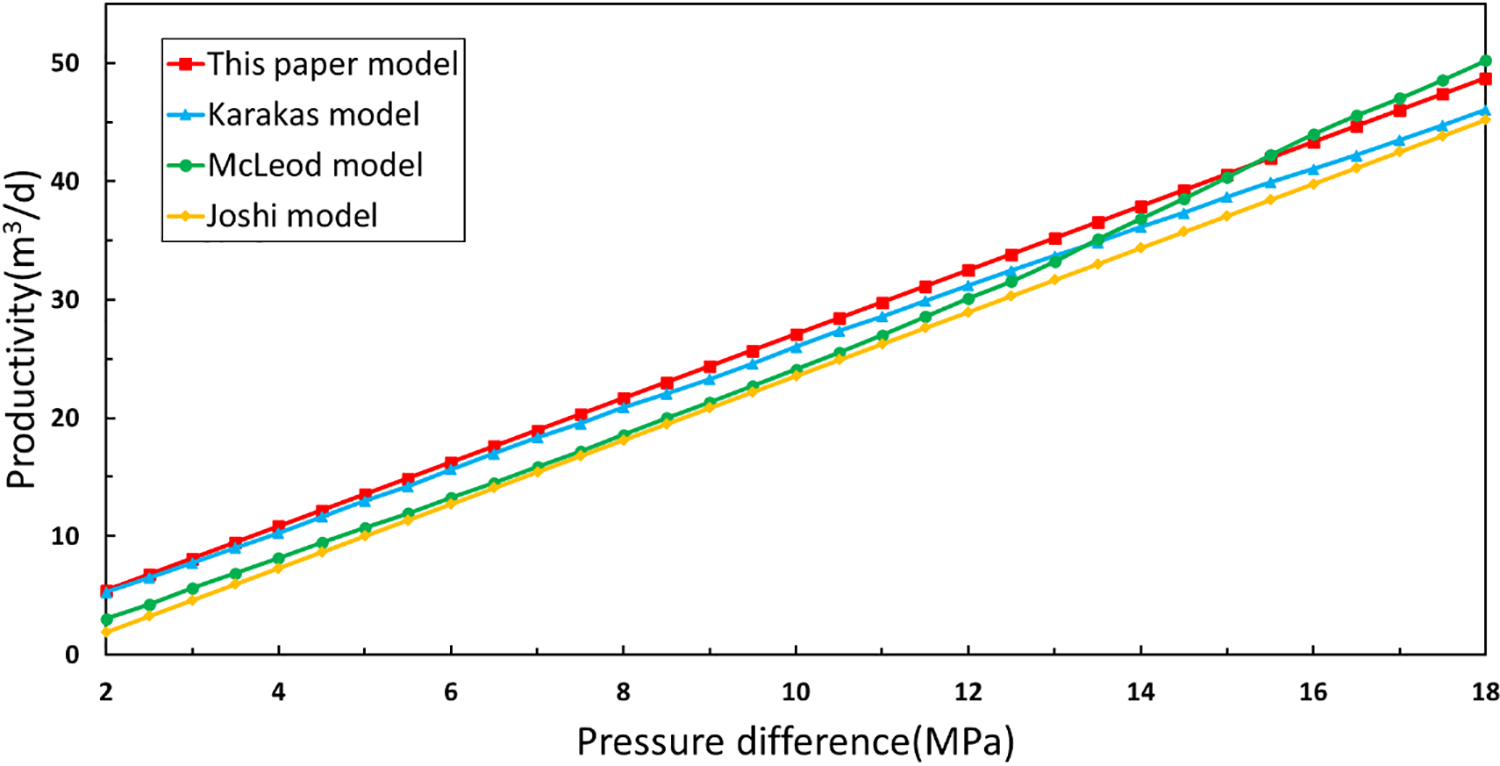
Figure 7: Pressure difference-productivity change curves calculated based on four different models

The average error between the model in this paper and the Joshi model is 15.76%, and the error value is high. This is because the Joshi model is a horizontal well production calculation formula that does not include perforation parameters. If the Joshi model is still employed after the horizontal well has been perforated, the calculation result will be lesser. However, both the Karakas and McLeod models are used to predict the productivity of perforated wells, and the average error of productivity calculation between this model and the Karakas and McLeod models is 4.68% and 9.1%, respectively. This indirectly demonstrates the reasonableness and feasibility of the presented model. Therefore, the model can be used to calculate the productivity of perforated horizontal wells.
The field data of an oil well are substituted into the model for calculation to verify its reliability and practicability. The detailed well parameters are shown in Table 3. Table 4 displays the well’s calculated and actual production for the test segment. The difference between the production capacity calculated by the model and the actual test capacity is 3.26%, and the error is very small. This suggests that the model may be used for the investigation of injection hole parameters and reservoir capacity calculations for well completion.


The curve of the productivity and perforation parameters of the perforated well is produced by providing the perforation parameters, using the model calculation Eq. (14), and the sensitivity analysis is completed. It is assumed that the perforation density is 8–40 holes/m, the perforation depth is 0.15–1.05 m, the perforation radius is 3–21 mm, and the perforation wellbore radius is 0.108 m.
When the perforation density is 16 holes/m under the condition of other formation parameters, Fig. 8 displays the change curve of the influence of hole depth-radius on the productivity of perforated wells. The two maps may be compared to show that the hole depth is more sensitive to productivity than the perforation radius. The perforation depth is a significant factor impacting production, as is seen in Fig. 8a. With deeper perforations, perforated wells become more productive. However, when the hole depth increases to a certain value, the production capacity will not increase too much by increasing the hole depth. As illustrated in Fig. 8b, the releasing impact of various pore size values on perforation productivity is not immediately apparent when the hole depth is less than 45 cm. When the hole depth exceeds 45 cm, productivity steadily rises with increasing perforation radius once the hole depth takes a certain value. However, the distribution of the curve shows that as the hole radius increases, the rate of productivity growth eventually decreases. The rationale for this is that, based on field construction experience, a big aperture will reduce casing strength and shorten casing service life. Therefore, an appropriate radius may be chosen throughout the building process. The hole radius of the projectile used in field construction has a small range of variation at the moment. Because the explosive quantity and energy of the perforating projectile are constant, there is a tendency for it to trade a smaller hole radius (around 10 mm) in favor of a deeper hole.
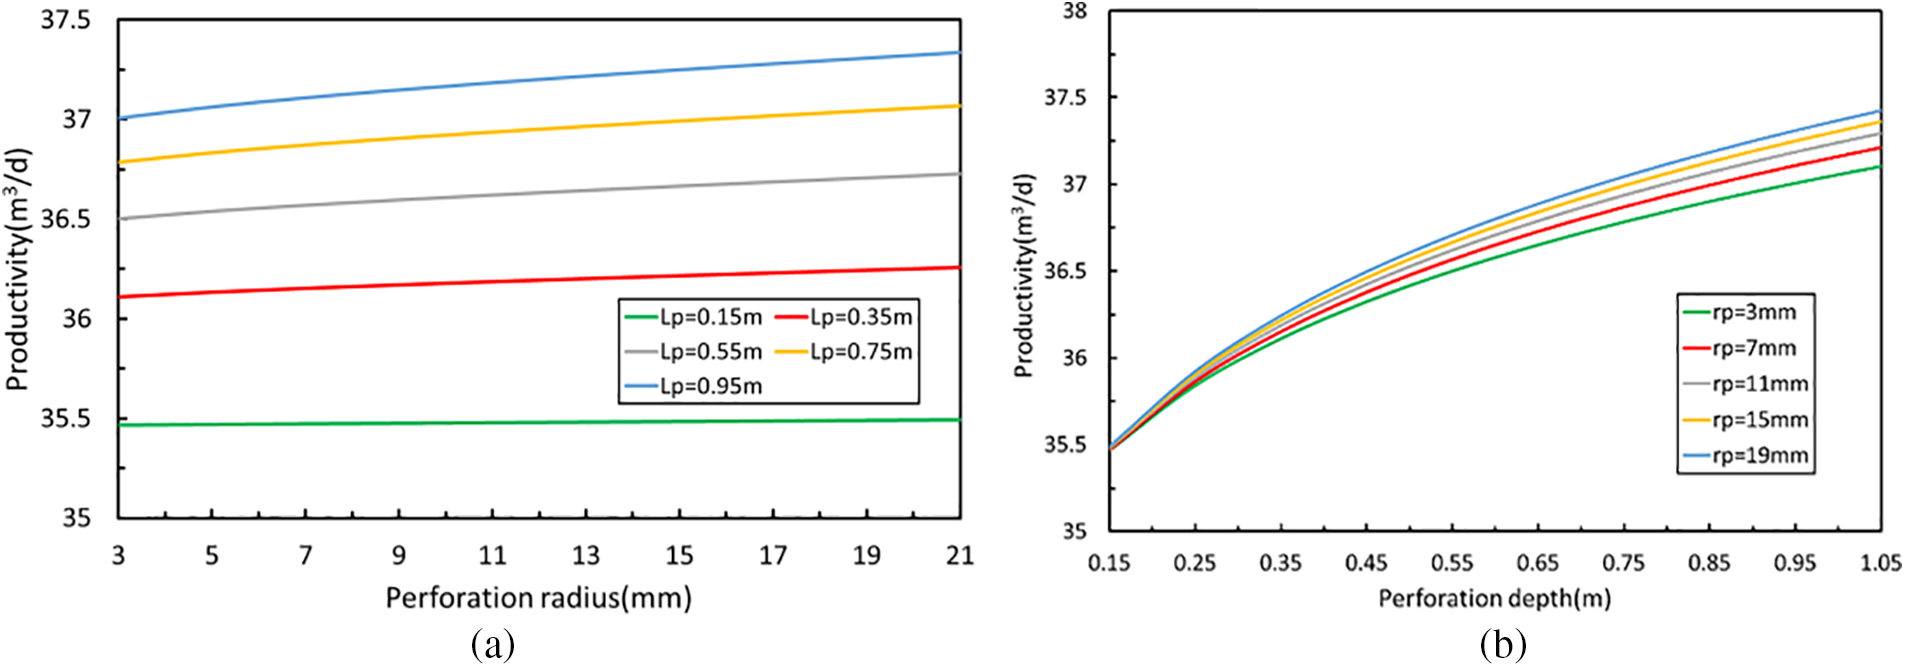
Figure 8: The change diagram of the influence of perforation depth-radius on productivity
When the perforation radius is 9 mm under the condition of other formation parameters, Fig. 9 displays the change curve of the influence of hole depth density on the productivity of perforated wells. The capacity of perforated wells is enhanced as the depth and density of the holes expand, however, it is clear from a comparison of the two maps that hole depth is more sensitive to productivity than hole density. When the perforation depth is limited, increasing the hole density can enhance the productivity release effect. As can be observed, a significant parameter affecting the production ratio is the hole density. Yet, the hole density cannot be raised indefinitely. Several factors must be taken into account: hole density is too large to cause casing damage; the hole density is too large and the perforation cost is high; too large hole density will complicate the construction work. A means to choose an optimal hole density should be based on the conditions of oil and gas wells and other perforation factors during perforation construction. Combined with the choice of hole depth, the perforation technique with a large penetration depth performs better than the method with a large hole density, in oil and gas wells with drilling or workover and perforation damage.
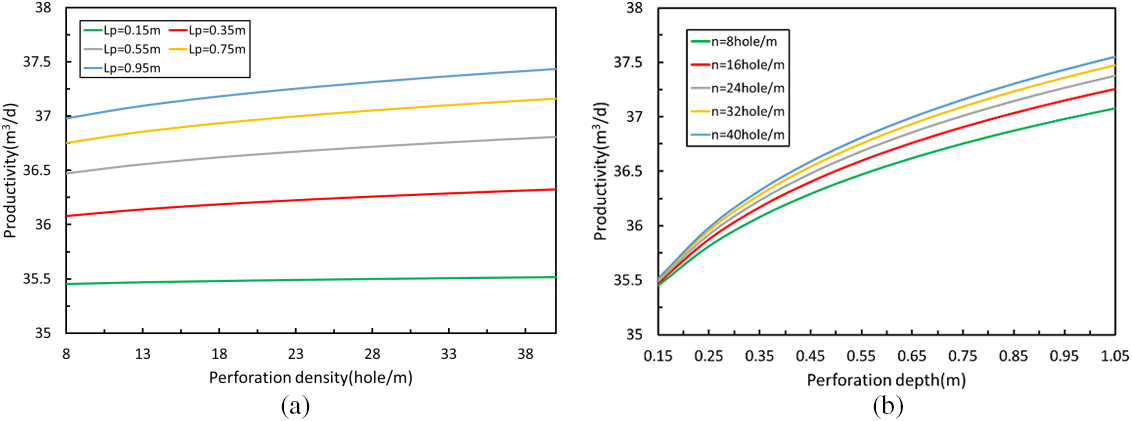
Figure 9: The change diagram of the influence of perforation depth-density on productivity
Whenever the perforation depth is 0.75 m under the condition of other formation parameters, Fig. 10 displays the graph of the fluctuation of the influence of pore radius density on the productivity of perforated wells. As pore radius and density grow, perforated well productivity also rises, although as can be seen from a comparison of the curve inclination angles in the two maps, pore density is more sensitive to productivity than pore radius. Fig. 10a demonstrates that the productivity growth when the hole density is less than 24 holes/m is much slower than when the hole density is larger than 24 holes/m. Fig. 10b shows that when the aperture is less than 20 mm, the capacity growth is much smaller than when the aperture is higher than 20 mm. In contrast to field construction, a big perforation radius will reduce the casing strength and shorten its service life. The hole radius is frequently constrained when the process is selected. At this point, increasing the hole density will improve the perforation effect.
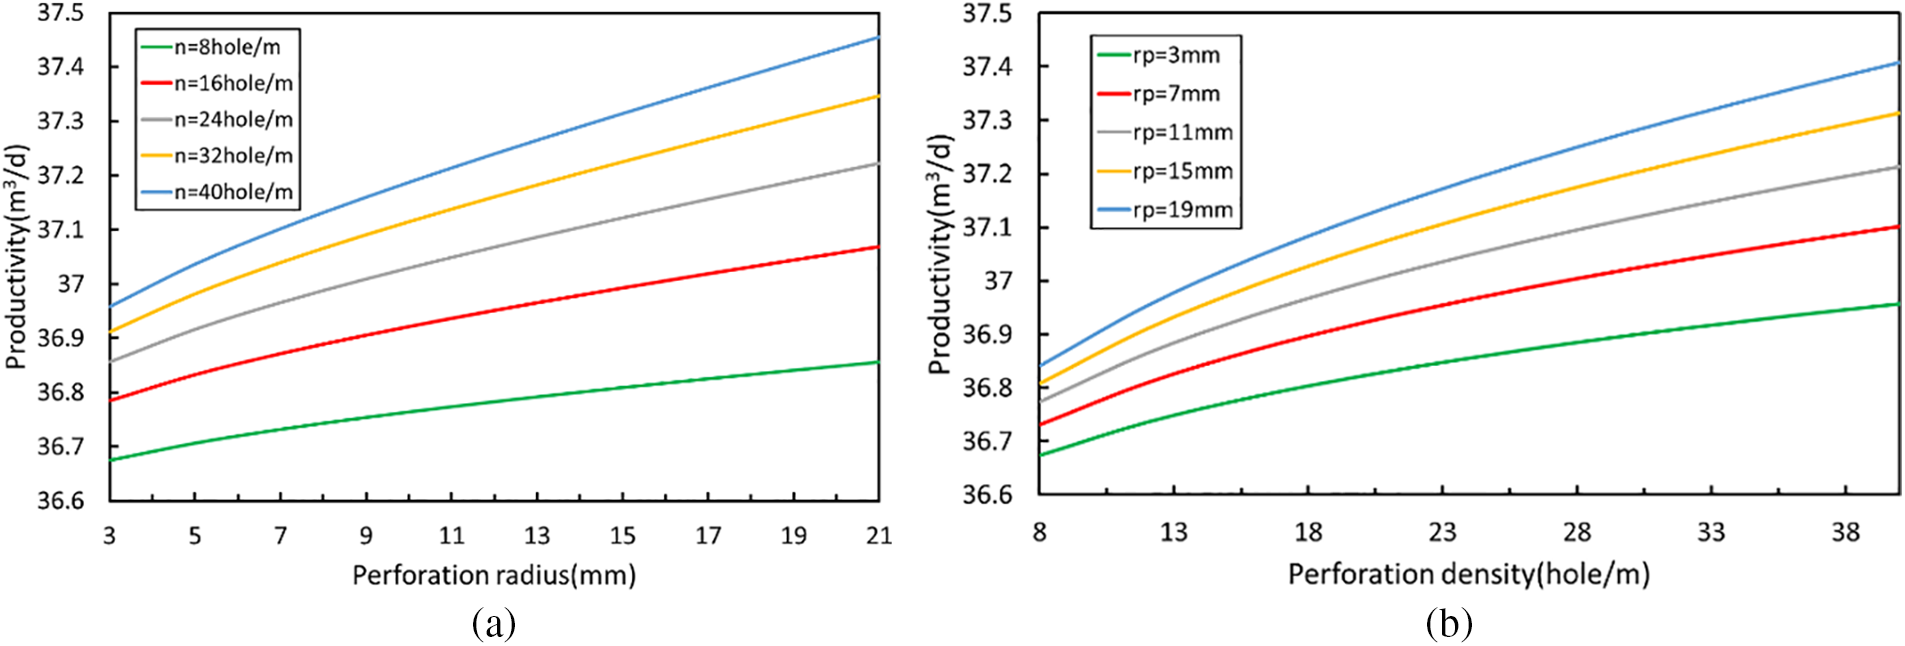
Figure 10: The change diagram of the influence of perforation radius-density on productivity
In summary, the whole depth of penetration is a crucial element impacting productivity, and the relationship with productivity varies depending on the circumstances. The productivity of perforated oil wells is somewhat influenced by the depth, density, and radius of the holes. Hole depth has the greatest impact, followed by hole density and pore size. The sensitivity analysis of perforation parameters on productivity has led to the conclusion that, when selecting a perforation technique, greater perforation parameters have a higher productivity release impact. Nevertheless, considering that the excessive perforation parameters will lead to the damage of casing strength and shorten the service life, a perforation method with a pore radius of around 10 mm and a pore density of 24–40 holes/m.
The reservoir is separated into two parts in this research based on the reservoir characteristics of perforated wells: the original reservoir area and the near-well high permeability reservoir area. The following findings have been reached:
1. Based on the principle of seepage mechanics, the calculation formula of the permeability of the perforated near-well high permeability reservoir area with parameters such as hole depth, hole density, and pore radius, is derived in this paper by constructing the mathematical geometric model and using the open hole completion productivity formula.
2. In this paper, according to the principle of seepage continuity, the seepage of a perforated horizontal well is regarded as the synthesis of two directions: the elliptic seepage field in the horizontal plane and the radial seepage field in the vertical plane, and the productivity formula of the perforated horizontal well is established by partition. According to the model calculation and comparison, the average error between this model and the Karakas model is 4.68%, and the average error between this model and the McLeod model is 9.1%, which indirectly shows the model’s rationality and applicability.
3. According to the findings of a productivity sensitivity analysis of perforated horizontal wells, the hole depth, hole density, and hole radius, all contribute to influencing the productivity of perforated oil wells. The biggest effect is exerted by hole depth, followed by hole density and hole radius. To minimize casing strength loss due to too big an aperture, perforation depth and density should be prioritized in process technology selection.
4. Based on the oil well productivity formula derived in this paper, a systematic perforation parameter optimization method is formed by studying the constraint relationship between perforation parameters, which can efficiently steer the technical design and predict the outcome of perforated horizontal wells.
Acknowledgement: The authors deeply appreciate the backing provided by Yangtze University for this research. They also wish to extend their gratitude to Professor Guo Kangliang for his insightful interpretation of the study’s findings.
Funding Statement: The authors received no specific funding for this study.
Author Contributions: The authors confirm their contribution to the paper as follows: study conception and design: Shuangshuang Zhang, Kangliang Guo, data collection: Xinchen Gao, Jinfeng Zhang; analysis and interpretation of results: Shuangshuang Zhang, Kangliang Guo, Haoran Yang; draft manuscript preparation: Shuangshuang Zhang, Xing Han. All authors reviewed the results and approved the final version of the manuscript.
Availability of Data and Materials: The raw data supporting the conclusions of this article will be made available by the authors, without undue reservation.
Conflicts of Interest: The authors declare that they have no conflicts of interest to report regarding the present study.
References
1. Muskat, M. (1943). The effect of casing perforations on well productivity. Transactions of the AIME, 151(1), 175–187. [Google Scholar]
2. McDowell, J. M., Muskat, M. (1950). The effect on well productivity of formation penetration beyond perforated casing. Journal of Petroleum Technology, 2(11), 309–312. [Google Scholar]
3. Hong, K. C. (1975). Productivity of perforated completions in formations with or without damage. Journal of Petroleum Technology, 27(8), 1027–1038. [Google Scholar]
4. Bell, W. T., Brieger, E. F., Harrigan Jr, J. W. (1972). Laboratory flow characteristics of gun perforations. Journal of Petroleum Technology, 24(9), 1095–1103. [Google Scholar]
5. McLeod Jr, Harry, O. (1983). The effect of perforating conditions on well performance. Journal of Petroleum Technology, 35(1), 31–39. [Google Scholar]
6. Abobaker, E. E., Elsanoose, A., Khan, F., Rahman, M. A., Aborig, A. (2022). A new assessment of perforation skin factor for vertical perforated wells in near-wellbore region. Journal of Petroleum Exploration and Production Technology, 12, 117–133. [Google Scholar]
7. Roostaei, M., Soroush, M., Mohammadtabar, F., Mohammadtabar, M. (2021). Design for reliability: Experimental and numerical simulation of cased and perforated completions with standalone screen. SPE Drilling & Completion, 36(3), 680–706. [Google Scholar]
8. Dogulu, Y. S. (1998). Modeling of well productivity in perforated completions. SPE Eastern Regional Meeting, SPE-51048-MS. Pennsylvania, USA. [Google Scholar]
9. Zhang, Z., Guo, J., Liang, H., Liu, Y. (2021). Numerical simulation of skin factors for perforated wells with crushed zone and drilling-fluid damage in tight gas reservoirs. Journal of Natural Gas Science and Engineering, 90, 103907. [Google Scholar]
10. Klotz, J. A., Krueger, R. F., Pye, D. S. (1974). Effect of perforation damage on well productivity. Journal of Petroleum Technology, 26(11), 1303–1314. [Google Scholar]
11. Locke, S. (1981). An advanced method for predicting the productivity ratio of a perforated well. Journal of Petroleum Technology, 33(12), 2481–2488. [Google Scholar]
12. Sadrnejad, S. A., Ghasemzadeh, H., Khodaei Ardabili, A. (2018). A finite element model for simulating flow around a well with helically symmetric perforations. Journal of Engineering Geology, 12, 159. [Google Scholar]
13. Elsanoose, A., Abobaker, E., Khan, F., Rahman, A., Aborig, A. (2021). Investigation of multiphase flow in porous media around perforation tunnel near wellbore region, experimental and numerical study. ASME 2021 40th International Conference on Ocean, Offshore and Arctic Engineering, vol. 10, V010T11A040. [Google Scholar]
14. Karakas, M., Tarlq, S. M. (1991). Semianalytical productivity models for perforated completions. SPE Production Engineering, 6(1), 73–82. [Google Scholar]
15. Hagoort, J. (2007). An analytical model for predicting the productivity of perforated wells. Journal of Petroleum Science and Engineering, 56(4), 199–218. [Google Scholar]
16. Wu, M., Zhu, J., Li, L., Li, P. (2020). Calculation of perforated vertical and horizontal well productivity in low-permeability reservoirs. SPE Drilling & Completion, 35(2), 218–236. [Google Scholar]
17. Zhao, J., Chen, X., Li, Y., Fu, B., Xu, W. (2017). Numerical simulation of multi-stage fracturing and optimization of perforation in a horizontal well. Petroleum Exploration and Development, 44(1), 119–126. [Google Scholar]
18. Mohammed, H. S., Khazal, E. A., Sultan, H. S. (2020). Studying the effect of perforation parameters on vertical well performance. Basrah Journal for Engineering Sciences, 20(2), 84–59. [Google Scholar]
19. Mohammed, H. S., Sultan, H. S., Khazal, E. A. (2022). Simulation of a perforated vertical wellbore with near wall porous media effect. Journal of Petroleum Research and Studies, 12(1), 85–104. [Google Scholar]
20. Grove, B., Grader, A., Derzhi, N. (2019). Perforation damage, cleanup, and inflow performance: Advances in diagnostics and characterization. SPE Middle East Oil and Gas Show and Conference, D041S039R002. Pennsylvania, USA. [Google Scholar]
21. Abobaker, E., Elsanoose, A., Khan, F. (2021). Comparison of crushed-zone skin factor for cased and perforated wells calculated with and without including a tip-crushed zone effect. Geofluids, 2021(2), 1–13. [Google Scholar]
22. Borisov, J. P. (1984). Oil production using horizontal and multiple deviation wells. Bartlesville: The R&D Translation Company. [Google Scholar]
23. Joshi, S. D. (1988). Augmentation of well productivity with slant and horizontal wells. Journal of Petroleum Technology, 40(6), 729–739. [Google Scholar]
24. Sognesand, S., Skotner, P., Hauge, J. (1994). Use of partial perforations in Oseberg horizontal wells. SPE Annual Technical Conference and Exhibition, SPE-28569-MS. Anaheim, CA, USA. [Google Scholar]
25. Su, Z., Gudmundsson, J. S. (1994). Pressure drop in perforated pipes: Experiments and analysis. SPE Asia Pacific Oil and Gas Conference, SPE-28800. Adelaide, Australia. [Google Scholar]
26. Ouyang, W., Yang, D., Sun, H. (2020). Transient pressure analysis in partially perforated vertical wells. Proceedings of the International Field Exploration and Development Conference, pp. 873–891. Chengdu, China. [Google Scholar]
27. Li, H., Tan, Y., Jiang, B. (2018). A semi-analytical model for predicting inflow profile of horizontal wells in bottom-water gas reservoir. Journal of Petroleum Science and Engineering, 160, 351–362. [Google Scholar]
28. Liu, P., Wang, Q., Luo, Y. (2022). Study on a new transient productivity model of horizontal well coupled with seepage and wellbore flow. Processes, 9(12), 2257. [Google Scholar]
29. Bi, G., Cui, Y., Wu, J. (2022). Unsteady Productivity prediction for three-dimensional horizontal well in anisotropic reservoir. Geofluid, 2022, 2697311. [Google Scholar]
30. Abobaker, E., Elsanoose, A., Khan, F., Rahman, M. A., Aborig, A. (2021). A new evaluation of skin factor in inclined wells with anisotropic permeability. Energies, 14(17), 5585. [Google Scholar]
31. Satti, R. P., Bale, D. S., Zuklic, S. N., Koliha, N., Crouse, B. (2017). Digital rock simulation: A novel approach for accurate characterization of perforation tunnel damage. SPE Western Regional Meeting, D041S015R003. Pennsylvania, USA. [Google Scholar]
Cite This Article
 Copyright © 2024 The Author(s). Published by Tech Science Press.
This work is licensed under a Creative Commons Attribution 4.0 International License , which permits unrestricted use, distribution, and reproduction in any medium, provided the original work is properly cited.
 Downloads
 Citation Tools