
 Submit a Paper
 Propose a Special lssue
 Open Access
ARTICLE

Multi-Time Scale Operation and Simulation Strategy of the Park Based on Model Predictive Control
Grid Center, State Grid Shanxi Electric Power Company Electric Power Science Research Institute, Taiyuan, 030000, China
* Corresponding Author: Jun Zhao. Email:
Energy Engineering 2024, 121(3), 747-767. https://doi.org/10.32604/ee.2023.042806
Received 13 June 2023; Accepted 08 September 2023; Issue published 27 February 2024
 View Full Text
 Download PDF
Abstract
Due to the impact of source-load prediction power errors and uncertainties, the actual operation of the park will have a wide range of fluctuations compared with the expected state, resulting in its inability to achieve the expected economy. This paper constructs an operating simulation model of the park power grid operation considering demand response and proposes a multi-time scale operating simulation method that combines day-ahead optimization and model predictive control (MPC). In the day-ahead stage, an operating simulation plan that comprehensively considers the user’s side comfort and operating costs is proposed with a long-term time scale of 15 min. In order to cope with power fluctuations of photovoltaic, wind turbine and conventional load, MPC is used to track and roll correct the day-ahead operating simulation plan in the intra-day stage to meet the actual operating operation status of the park. Finally, the validity and economy of the operating simulation strategy are verified through the analysis of arithmetic examples.Keywords
Nomenclature
| MPC | Model predictive control |
| PV | Photovoltaic |
| EV | Electric vehicles |
| IEO | Integrated energy operator |
| HVACR | Heating ventilation and air conditioning, refrigeration |
| PMV | Predicted mean vote |
| SOC | State of charge |
The penetration of wind power and photovoltaic as efficient and clean energy sources has been rising in recent years [1], with the attendant problem that the total amount of scenery uncertainty in the system has become larger. As an important form of access to the grid for wind power and photovoltaics, the large number of uncertainties in the park grid poses a huge challenge to its economic operation. How to guarantee the economic operation of the park and diminish the impact of scenery uncertainty and prediction errors has become the focus of research [2–5]. In reference [2], a two-stage stochastic robust optimization model for a multi-energy microgrid was proposed to reduce the cost of a two-stage microgrid under the worst new energy output scenario to deal with the uncertainty of renewable energy output and the low economy caused by the single form of traditional microgrid supply. In reference [3], a microgrid game model was proposed to take into account the uncertainty of wind and light, and the influence of volatility on microgrid optimization is quantitatively and qualitatively analyzed. The results show that the established model improves the absorption rate of scenic power, mobilizes the enthusiasm of the energy storage units, and considers the economy and risk of microgrid operation. Reference [4] considered the impact of the uncertainty of market frequency modulation demand and wind and photovoltaic output on the operational strategy formulation of the energy storage system and generates the set of frequency modulation demand and scenery uncertainty scenarios with time-series correlation based on the scenario stochastic discretization method. Reference [5] considered the uncertainty of scenery output and constructs a robust optimization model with the two-stage distribution of scenery output prediction error fuzzy set based on Wasserstein distance so that the virtual power plant adjusts the flexible resources to achieve the minimum operation cost when the scenery output prediction error satisfies the worst distribution within the fuzzy set. Reference [6] proposed an interval optimization scheduling method for the integrated energy system of the park considering multiple uncertainties and uses the interval theory to model the uncertainty of the output of distributed power sources. However, the above paper only considers day-ahead scheduling simulation.
Multi-time scale simulation can reduce the impact of scenery uncertainty and forecast errors. In reference [7], a coordinated optimization and control strategy of source-grid-load-storage of a distribution network based on Fisher time division was proposed, and a multi-time scale “source-grid-load-storage” coordinated optimization architecture was constructed, including three stages of day-ahead optimization, intra-day rolling and second-level monitoring. In reference [8], a multi-time scale scheduling strategy for combined electric and thermal systems was proposed to reduce the impact of wind power prediction errors and improve the wind power consumption capacity of the system. Reference [9] proposed a multi-time scale consumption method of distributed energy in active distribution networks that takes into account uncertainty and improves the consumption level of distributed energy in active distribution networks through the cooperation of different time scales. Reference [10] established a three-stage optimization model of “day ahead-intra-day rolling-real-time adjustment” to optimize unit output step by step. However, the above papers do not use the MPC method and lack an understanding of its advanced nature.
MPC is a model-based finite-time domain closed-loop optimal control method [11–13], which does not require high system accuracy and can rectify the simulation plan points in real-time by short-time predicted values with feedback correction. Usually, indicators such as power balance, component characteristics, economy, and tracking are mostly selected in the intra-day phase for rolling simulation to meet the actual operating conditions [14–21]. In reference [18], MPC was used to track and modify the active output schedule to obtain smooth output of controllable units. Reference [19] proposed a two-stage optimal dispatching strategy for an integrated urban energy system considering uncertainty and interactive power. In the intra-day phase, MPC is used to optimize the scheduling strategy of the system on a rolling basis based on the prediction results of new energy generation and load. The results of the algorithm show that the scheduling strategy can reduce the impact of the short-time drastic fluctuations of the interactive power on the safety and economy of the system operation. Based on the MPC theory, a new method of coordinated multi-time scale scheduling of active power of wind power clusters was proposed in reference [20]. In the intra-day stage, the MPC technique is used to achieve finite-time rolling optimization and real-time feedback correction of the active power of wind power clusters. Reference [21] proposed an optimal dispatching method for wind-light-storage-storage multi-energy complementary coordination considering the uncertainty of renewable energy sources. In the real-time correction phase, the MPC method is used to precisely control the electrochemical energy storage output and weaken the influence of scenery prediction errors. The above study only considers the demand of the simulated power side in the intra-day simulation stage, without considering the demand response of the user side at the same time, and the simulation is relatively single.
Based on this, this paper proposes a multi-time scale simulation method for the park’s grid with day-ahead optimization and intra-day MPC rolling optimization, which can solve the problem that the day-ahead simulation plan fails to consider the customer demand response when the actual operating state of the park’s grid fluctuates widely, and the simulation plan cannot be revised during the day. Firstly, in the day-ahead simulation stage, an optimization model is established to solve the day-ahead simulation plan with the objective of minimizing the operation cost throughout the day, taking into account the customer-side demand response and the cost of distributed power supply. Then, in the intra-day simulation stage, the MPC is used to track and correct the intra-day simulation plan in real time with the objective of minimizing the deviation between the intra-day simulation and the intra-day simulation plan. Finally, an arithmetic analysis is performed to verify the superiority of the proposed strategy.
Other sections of this paper are organized as follows. The structure and load classification of the park are introduced in Section 2. Section 3 presents the power supply and load modeling of the park. The day-ahead simulation strategy of the park is established in Section 4, and the intra-day simulation strategy of the park is established in Section 5. Section 6 provides illustrative examples and analysis. Conclusions are given in Section 7.
The distributed units in the park constructed in this paper are divided into two parts: the power side and the load side. The power side includes distributed power sources such as PV systems, wind turbines, energy storage systems, fuel cells, micro gas turbines, and so on. The load side is divided into conventional, adjustable and EV loads through demand response. The park is connected to the distribution network through a contact line for power transmission.
On the power side, the distributed power sources are essential for ensuring a stable and reliable supply of electricity. Wind turbines harness the power of the wind to generate electricity, while the photovoltaic system converts sunlight into electrical energy. These decentralized power sources not only provide a renewable and clean source of energy but also contribute to the overall power generation capacity of the park. An energy storage system, on the other hand, stores excess energy produced by the system and releases it when demand arises. They help ensure a continuous and uninterrupted power supply, reducing the reliance on the grid and improving the overall energy efficiency of the park.
On the load side, power loads are the specific electrical loads within the park, such as lighting systems, HVACR systems and other electrical devices that require a significant amount of power to operate. The electric vehicles (EV) loads refer to electric vehicles within the park that require charging.
The structure of the power and load sides is depicted in Fig. 1, illustrating the interplay between the distributed power sources and the various types of loads. The two, distributed generation and load, complement each other in terms of multiple energy sources and coordinate their operation, which has a significant impact on the optimization and scheduling of the park’s day-ahead and intra-day operations.
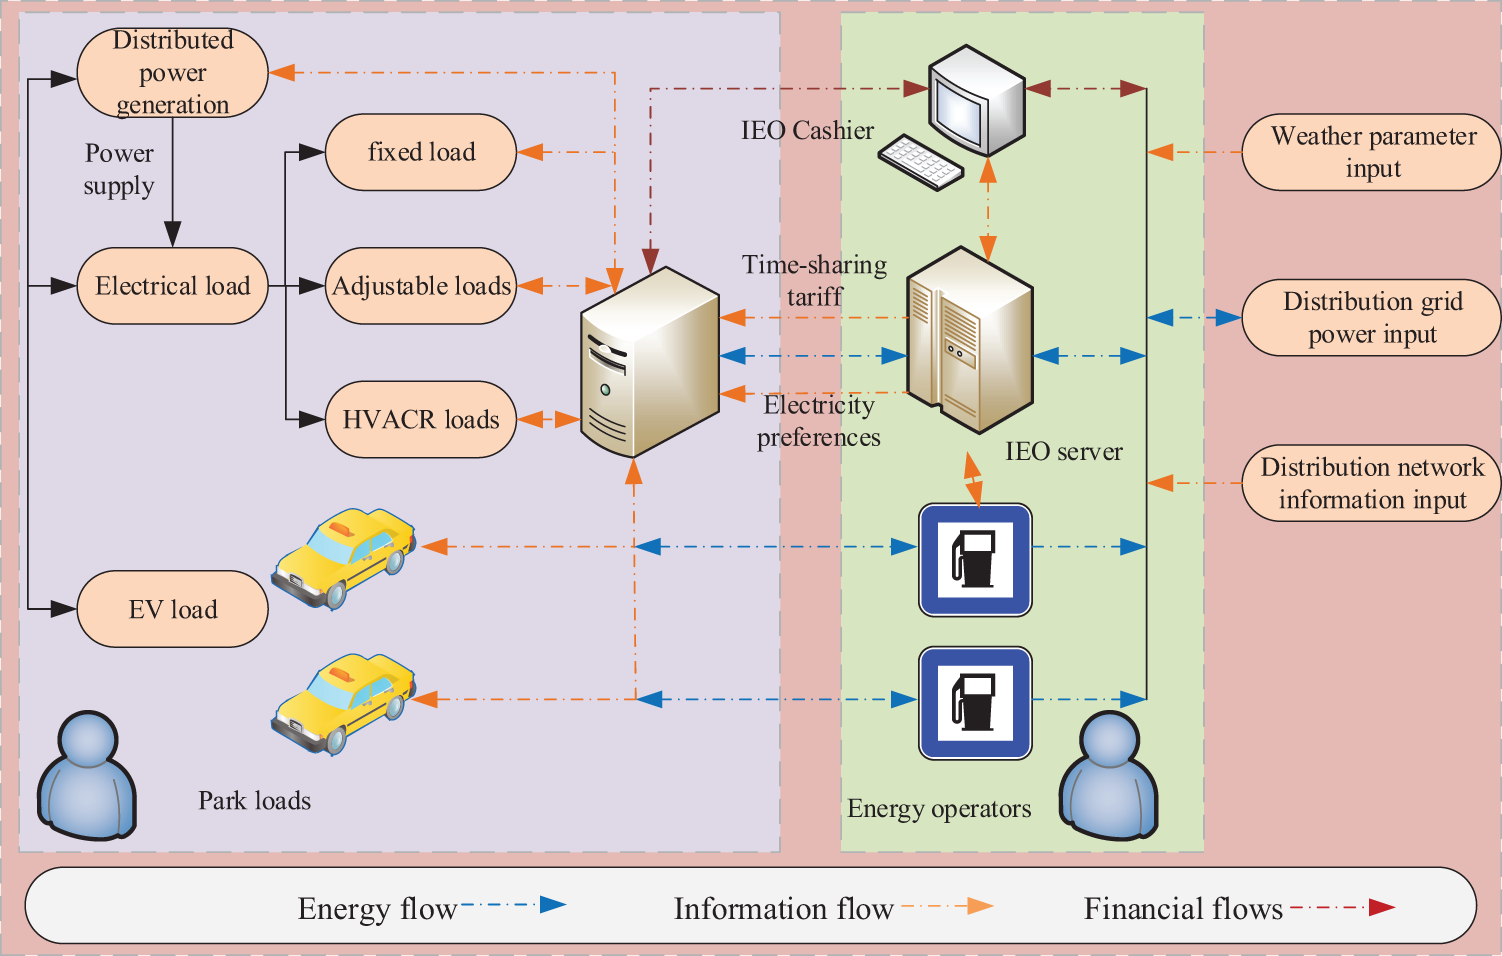
Figure 1: Basic structure diagram of the park
The park studied in this paper is managed by an integrated energy operator (IEO), which is responsible for the maintenance of the electrical equipment of all the residents in the park and manages the loads according to the distribution network time-of-use tariff and other information. For adjustable or dispatchable loads, such as EVs, the electricity demand can be reduced during peak load periods, thus reducing the cost of electricity consumption.
The residents of the park sign a contract with IEO to give IEO certain load control rights during the peak load of the grid and participate in energy interaction through demand response to reduce electricity expenses without affecting the electricity demand.
Under the management of MGO, the whole park can realize the complementary and coordinated operation of each unit, optimize the overall economic cost of the park, and realize the function of economy and energy saving.
2.2 Load Type and Classification
Due to the significant difference between day and night loads in the park, under the condition of time-of-day tariff, the refined load classification can cut the peaks and fill the valleys, reduce the power supply pressure of the power grid during the peak period, as well as reduce the cost of electricity consumption in the park and better control the electricity consumption behavior of the park load. According to the customer’s demand for load and the difference in load characteristics, the load in the park is divided into regular load, adjustable load and EV load.
(1) Conventional load: Once involved in simulation, it will greatly affect the customer’s electricity experience, such as lighting system and public electricity consumption. In order to satisfy the basic electricity demand of residents, this paper does not perform simulations for conventional loads.
(2) Adjustable load: With the rapid development of the economy and the continuous improvement of science and technology, heating ventilation and air conditioning, refrigeration (HVACR) system has made a great degree of progress and has been more and more widely used in building design. HVACR is mainly composed of three sub-systems: heating system, ventilation system and air conditioning system. In the simulation, the user power can be adjusted, including the HVACR system, etc. Adjustable load is one of the main scheduling objects of the simulation strategy. Due to the strong correlation between HVACR load and user comfort, HVACR in adjustable load will be considered as a separate load.
(3) EV load: Located in the parking lot of the park, the charging power can be controlled by an intelligent switch under the condition of ensuring the normal travel demand of residents.
In addition to the above three types of loads, this paper is equipped with a distributed power system inside the park, which includes distributed power sources such as photovoltaic, wind turbine, micro gas turbine, fuel cell and energy storage devices such as lithium battery. HVACR loads play a vital role in contributing to the peak loads in the power grid, particularly during the summer and winter peak periods in the park. In fact, in certain areas, the share of HVACR loads has exceeded 40% [22]. The magnitude of these loads has a direct impact on user satisfaction, and therefore, scheduling should prioritize HVACR loads while taking into account the users’ perceived satisfaction. Consequently, this study emphasizes the consideration of HVACR loads as the primary control objective.
3.1.1 Temperature Controlled Load Model
Since the use time of HVAC and HVACR is strongly correlated with the thermal comfort of the residents, the operation should be simulated within the user’s physical comfort temperature range, and the HVACR load start/stop status is automatically controlled by IEMS in this paper.
The HVACR load operates in two modes, cooling and heating, and its load power magnitude is related to the set temperature, the weather temperature of the day, and the model is shown below:
where,
User comfort is determined by the thermal comfort evaluation index equation proposed by Franger, the Predicted Mean Vote (PMV) index [23], which on behalf of most people in the same environment of hot and cold feeling, considering the relationship between the PMV index and indoor temperature of users for HVACR load as shown in the following equation:
PMV indicator values of −3 to +3, respectively, indicating cold, cool, slightly cool, heat neutral, slightly warm, warm and hot seven results, when the PMV value is 0, indicating that the temperature at this time is the most comfortable temperature for the human body, at this time is 26°C [23]. Considering the PMV index formula is more complex, for simple calculation, set 26°C as the HVACR load to provide users with the highest comfortable temperature.
As for EV load, it is divided into two categories: one is normal charging EV load, which is classified as regular load, and the second is adjustable charging power EV load, which is dispatchable EV. Due to the unique travel needs of EV load, its distribution has strong uncertainty. The travel time and daily driving mileage of the EV load in the park are simulated using the Monte Carlo method, and the user’s travel information is obtained through daily driving mileage. It is assumed that the EVs in the park are parked in the parking lot with charging piles, IEO controls the charging and discharging behaviors, and certain economic benefits can be obtained.
The upper and lower limits of its dispatchable power are predicted based on the relevant data of the dispatchable EV, and the maximum and minimum values of the load of the dispatchable EV at the next moment are predicted based on the actual load of the dispatchable EV at moment
where,
3.2 Distributed Generation Modeling
3.2.1 Wind Turbine and Photovoltaic
New energy power generation mainly considers photovoltaic power generation and wind turbine power generation, this paper mainly considers the power fluctuation of new energy power generation. Therefore, the power of wind turbines and photovoltaic power generation mainly considers its predicted power, and its power is fully consumed. Wind turbine and photovoltaic model reference [22].
Lithium batteries are used in energy storage units, and the operation and maintenance costs are shown in the following equation:
where,
Lithium batteries are used in the energy storage unit, and the operating and maintenance costs of lithium batteries are shown as follows [17]:
where,
4 Day-Ahead Simulation Strategy of the Park
4.1 Day-Ahead Objective Function
This paper takes 15 min as the time scale, divides a day into 96 periods, comprehensively considers the operation and maintenance cost of each unit in the micro-network of the park, the purchase and sale price cost of the micro-network of the park, and the objective function to obtain the lowest integrated cost is shown below:
where,
To ensure safe and stable operation of the park microgrid, each distributed power source needs to meet the following constraints:
(1) Microgrid power balance constraint
where,
(2) Power constraints of controllable distributed power supply
The upper and lower limits of the controllable distributed power supply are shown in Eq. (13).
where,
The climbing constraint of the controllable distributed power supply is shown in Eq. (14).
where,
(3) Energy storage unit power constraints
where,
(4) EV load constraint
where,
5 Intra-Day Simulation Strategy of the Park
Because the actual operating state of the microgrid in the park is bound to have some deviation from the simulation plan of the day before, the daily need to revise the simulation plan can ensure the stability of the microgrid in the park and achieve the expected economy. As a closed-loop control method with good tracking and anti-interference ability, MPC has the advantages of low requirement on system accuracy and real-time correction of simulation plan through short-term predicted value and feedback correction [25]. Therefore, the simulation plan is tracked in real-time and run ahead of the day using MPC, which consists of three parts: prediction model, rolling optimization and feedback correction.
5.1.1 Intra-Day Objective Function
The prediction model can predict the state of the future system based on the current moment state, which is composed of state quantity, control quantity and output quantity, as shown in Eqs. (17) and (18). Where,
In order to cope with the power fluctuations of wind power, photovoltaic power and electric load in the intra-day phase, to ensure that the park contact line power and customer HVACR load power track the day-ahead power while ensuring that each distributed power source and demand response load control regulation increment is as tiny as possible, the objective function is as in Eq. (19).
where,
In the intra-day scheduling stage, it is necessary to satisfy the constraints for each unit operation, where the primary guarantee is the power balance constraint at each moment so that the load and output power of each unit in the park can be dynamically balanced, as shown in Eq. (21).
where,
The flow of the simulation strategy in this paper is shown in Fig. 2, and the simulation strategy is divided into two stages: day-ahead optimization and intra-day rolling optimization. In the day-ahead optimization phase, the park microgrid is optimized according to the predicted power of wind turbine, PV and conventional load, as well as the power demand of the demand response load of the park, with the objective of the lowest day-ahead economic cost, to obtain the day-ahead simulation plan; in the intra-day phase, the simulation is carried out based on the short-term prediction data of wind turbine, PV and conventional load every 15 min, with Eq. (19) as the objective function. This 15 min simulation result is obtained, and this step is cycled until the 96th time period to complete the intra-day rolling optimization.
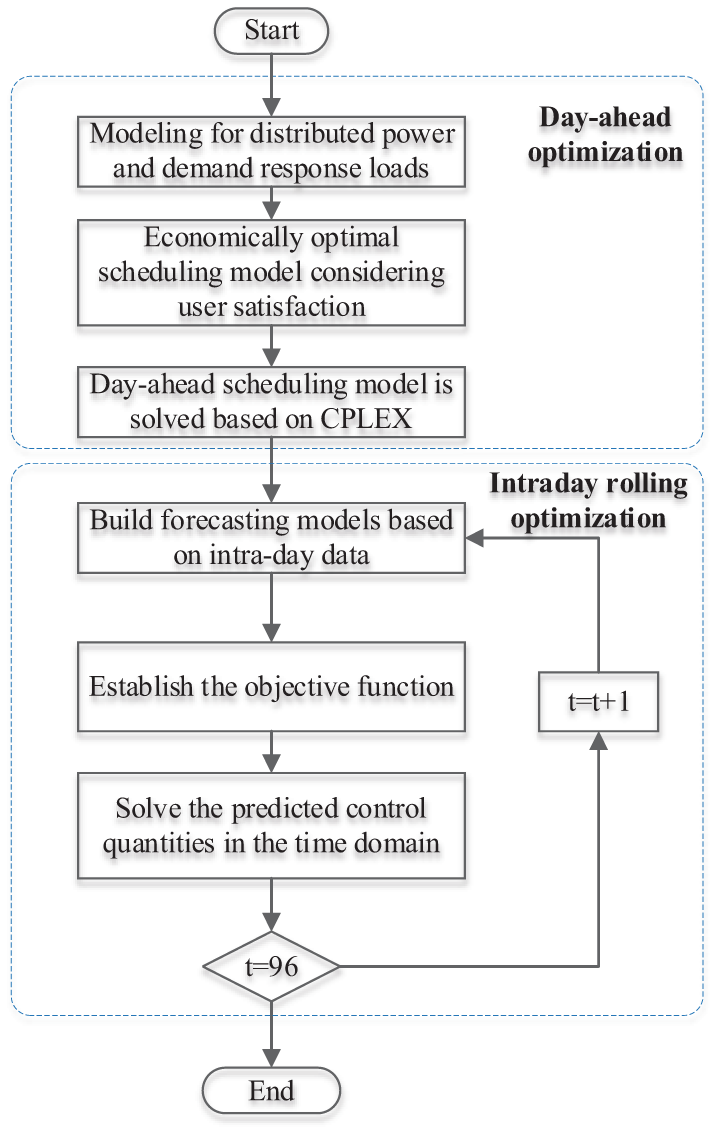
Figure 2: Multi-time scale simulation flowchart
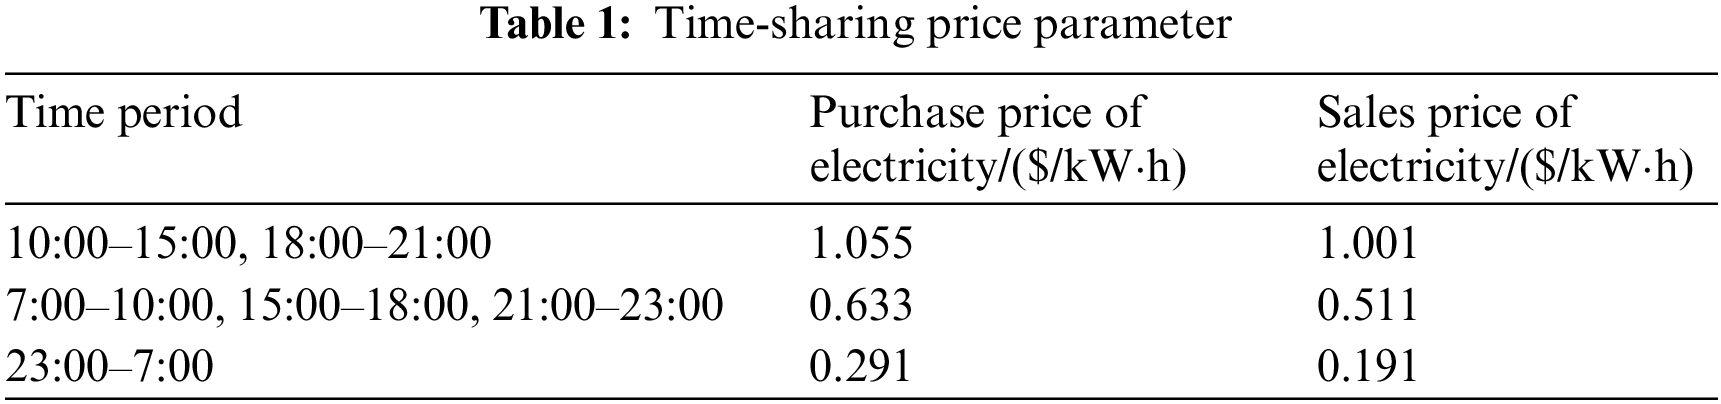
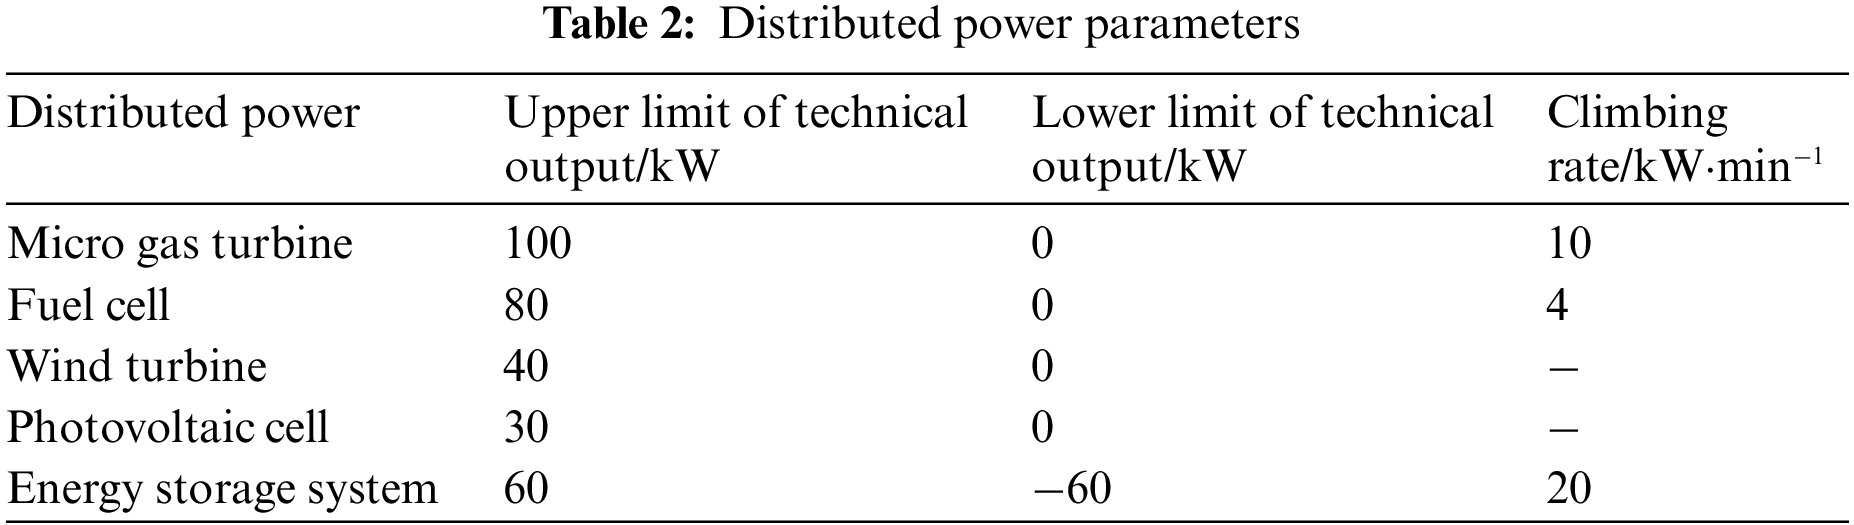
In this paper, we analyze the example of a real demonstration microgrid system [17], which includes wind turbines, PV systems, micro gas turbines, fuel cells, and energy storage systems, and the load side includes conventional load, HVACR load, and EV load. The parameters of the time-sharing price are shown in Table 1. The parameters of each distributed power supply in the system are shown in Table 2.
According to the functional requirements specifications for power prediction systems that have been developed [26,27], the short-term prediction error of wind power should be less than 20% and the prediction error of photovoltaic power should be less than 25%, and the relevant standards for load prediction have not been specified. In order to facilitate the comparison test, the middle value of the source-load output power fluctuation range is set to 20%, and 10% is floated up and down to set the comparison experiment to compare the effectiveness and economy of the simulation strategy in this paper under different conditions. Figs. 3–5 represent the predicted power and the actual intra-day power of wind turbine, PV power and conventional load, respectively.
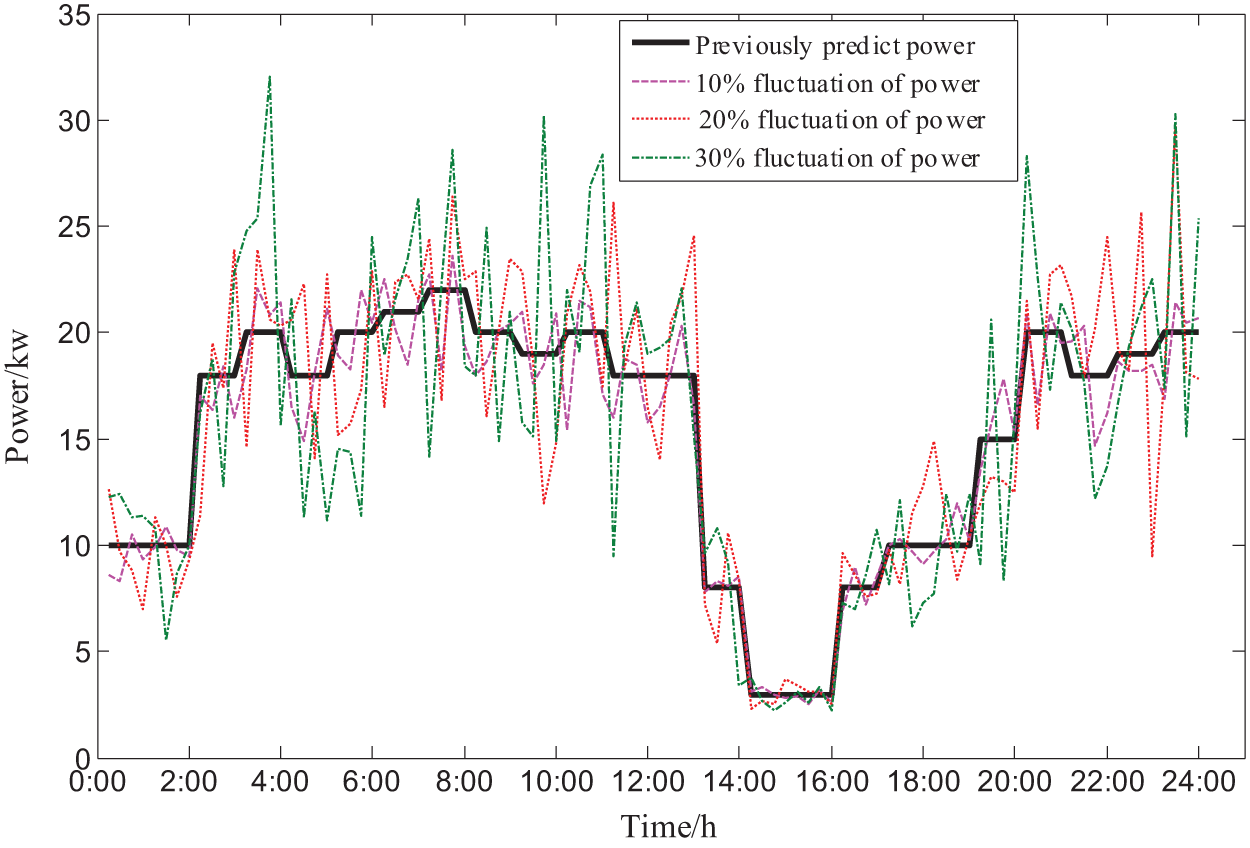
Figure 3: Daily predicted power and actual power of the wind turbine
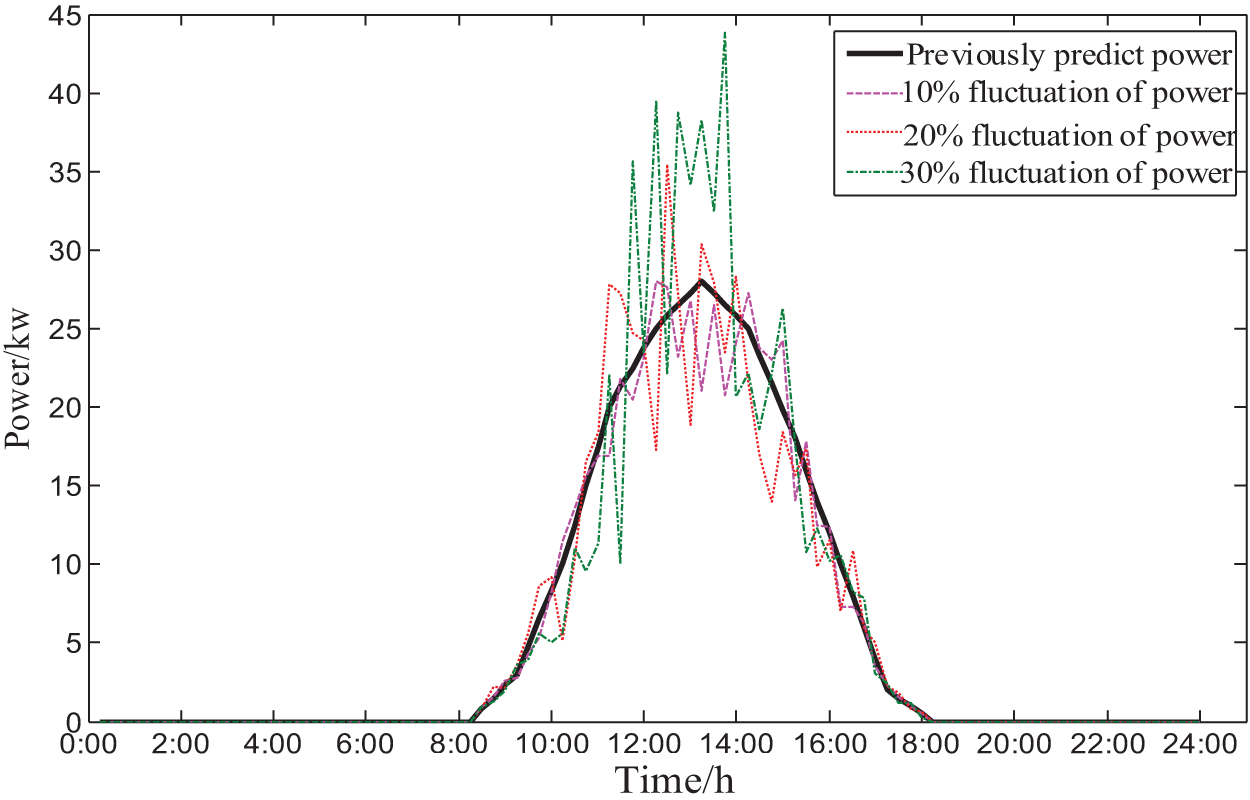
Figure 4: Photovoltaic day-ahead predicted power and day-ahead actual power
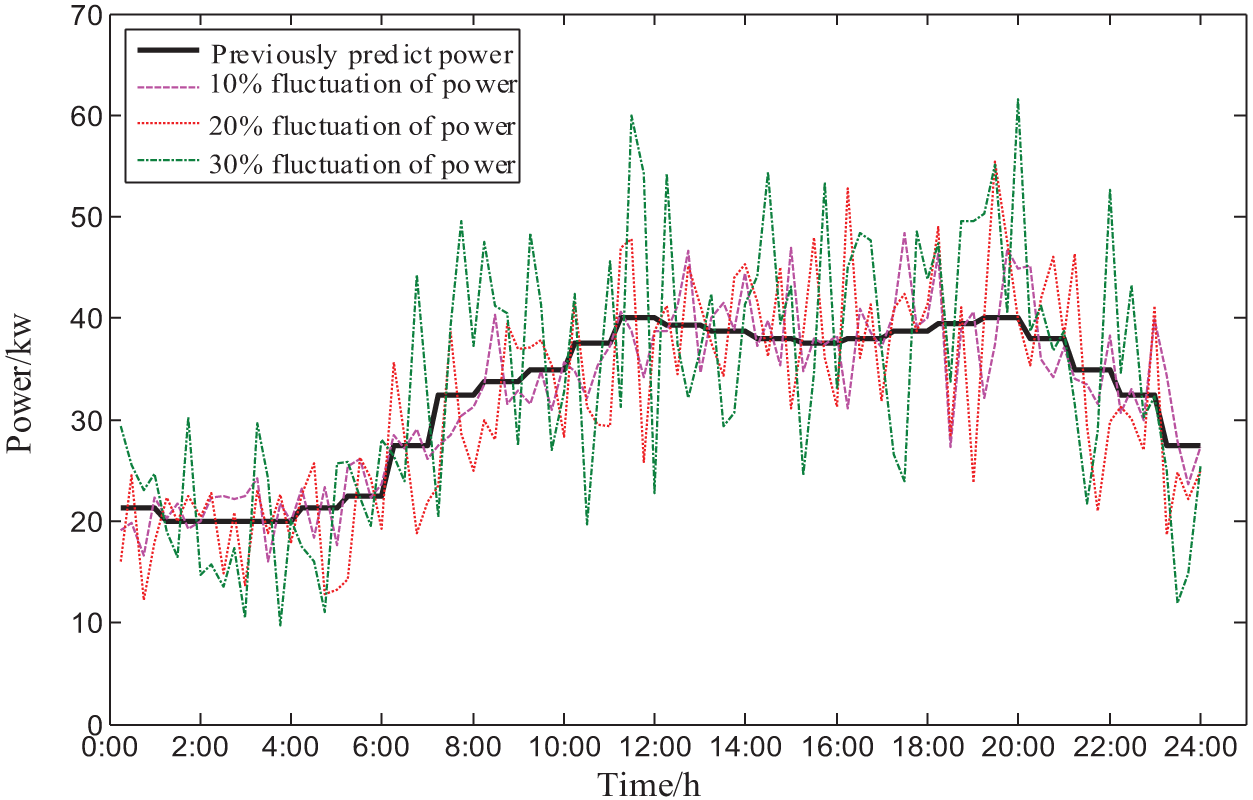
Figure 5: Daily predicted power and actual power within the day
6.2 The Result of Day-Ahead Optimization
The simulation results of dispatchable EVs are shown in Fig. 6. In Fig. 6, the maximum charging power and the minimum charging power respectively indicate that the dispatchable EV meets the maximum and minimum power demands of EV users at every moment. In the day-ahead stage, it can be seen from the day-ahead charging power curve that the EV can be scheduled to charge at the maximum charging power at 0:00–9:00 and 21:00–24:00, when the park load is small and the distributed power supply idle power is large. Charge at the minimum power from 9:00–17:00 and 18:00–21:00, when the park load is large, the EV can be dispatched to reduce the charging power. In summary, the schedulable EV basically realizes the role of peak load and valley filling in the day-ahead simulation stage.
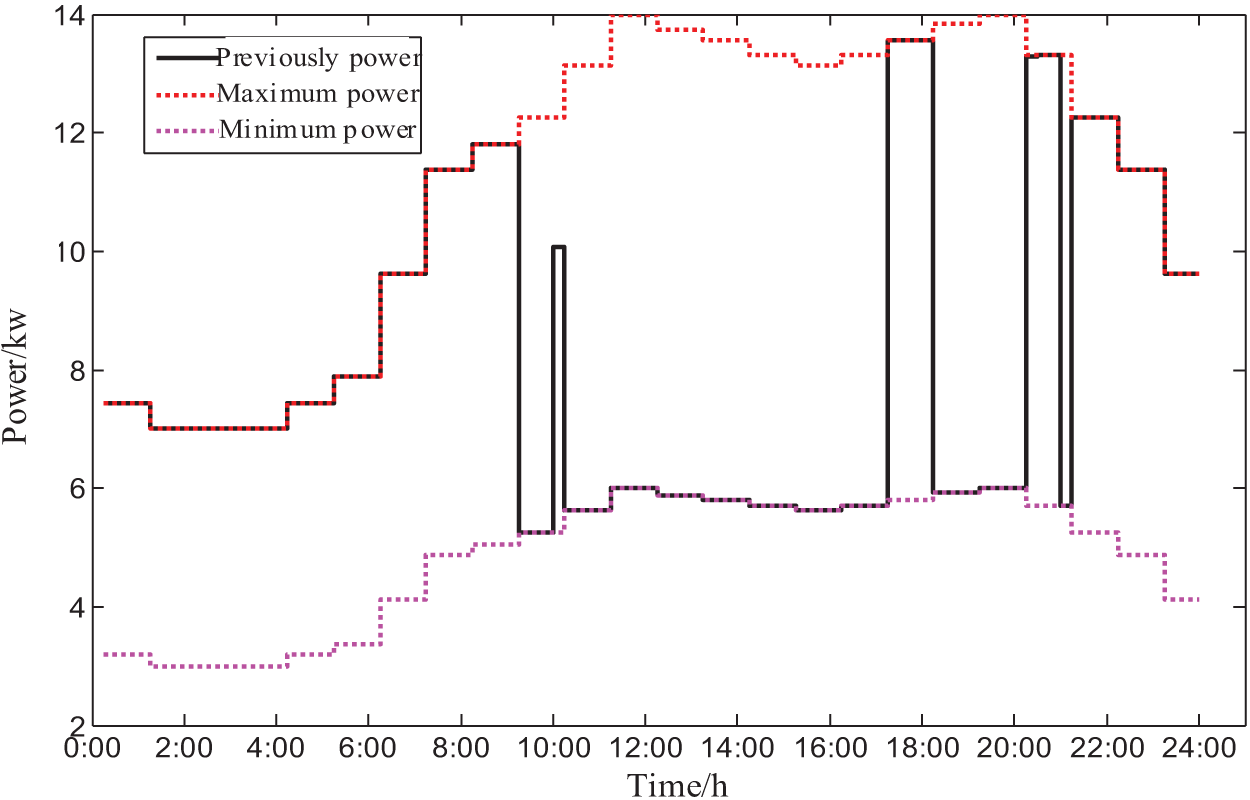
Figure 6: Dispatchable EV power
The HVACR load operating power and temperature are shown in Fig. 7. Under the condition of the predicted temperature, the demand of 26°C can be basically met by the users under the consideration of user satisfaction in the day-ahead stage, and only at the highest temperature moment from 14:00 to 16:00, the temperature of the HVACR load does not reach 26°C under the consideration of cost factor.
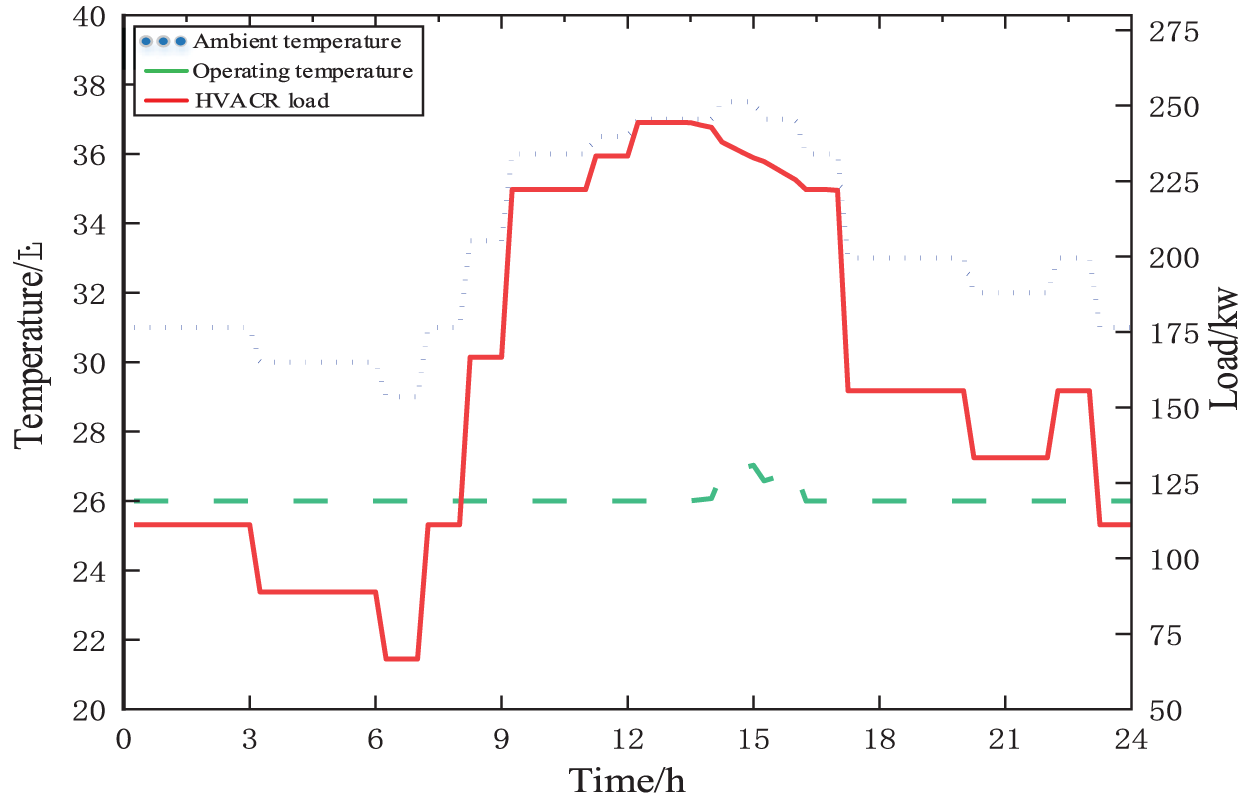
Figure 7: HVACR load power and temperature
The optimized power before the distributed power supply and lithium battery day is shown in Fig. 8. The micro gas turbine and fuel cell operate at rated power during 9:00–21:00 when the load is high and bear the main load power in the park due to their lower cost, and operate at low power during the trough; compared with the two, the micro gas turbine costs less, so the bear the main load power in the park.
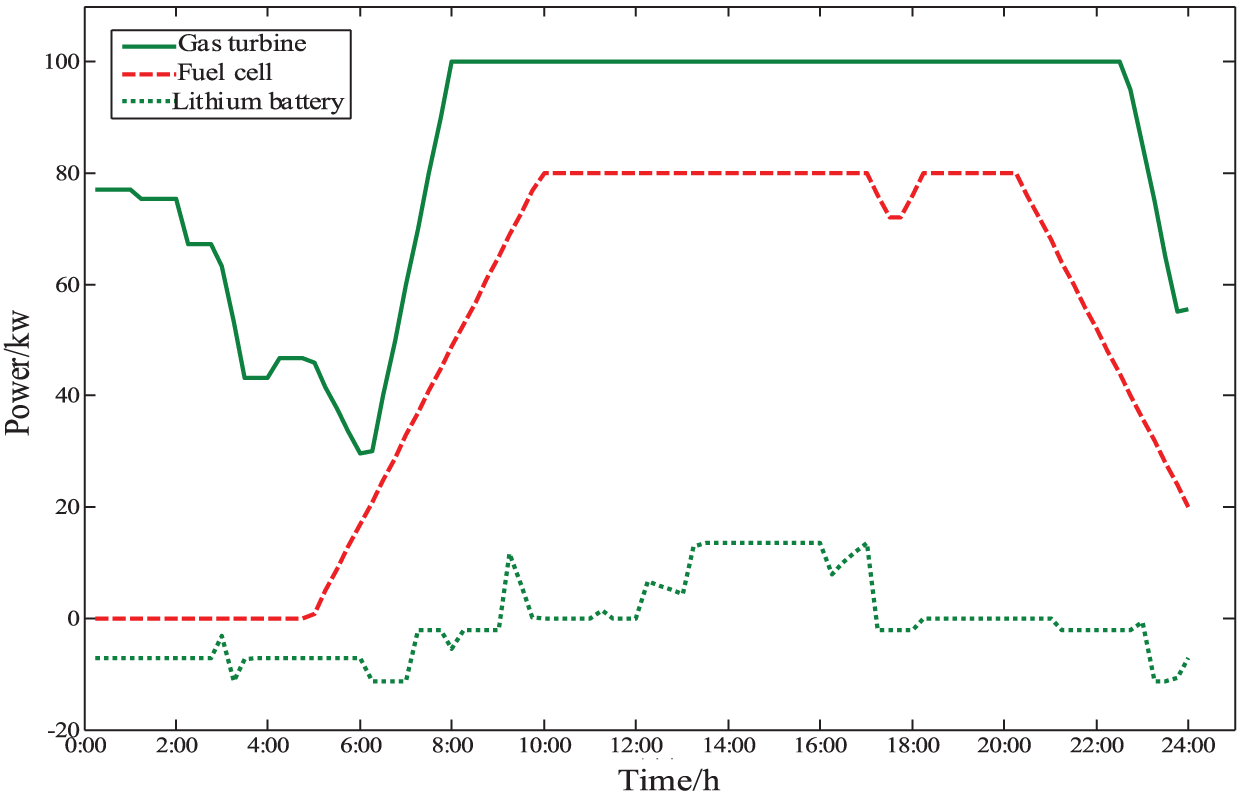
Figure 8: Distributed power supply in day-ahead stage
6.3 The Result of Intra-Day Optimization
6.3.1 Effectiveness Analysis of Simulation Strategy
This section analyzes the intra-day rolling optimization results of HVACR loads, dispatchable EVs, distributed power sources, and energy storage units under three scenarios to analyze the effectiveness of the simulation strategy in this paper.
Figs. 9 and 10 represent the power and temperature of the HVACR load, respectively, and the simulation results for the three cases are shown in the figure. In the case of a 10% power fluctuation of the fan, PV and conventional load, the HVACR load basically traces to the previous day’s simulation curve, and the highest temperature curve compensates over 27°C; when the power fluctuation increases to 20% and 30%, it can be seen that the HVACR load power also fluctuates, but it can still trace the previous day’s power curve. The highest temperature does not exceed 28°C under the condition of considering user satisfaction, basically meets the user’s comfort demand.
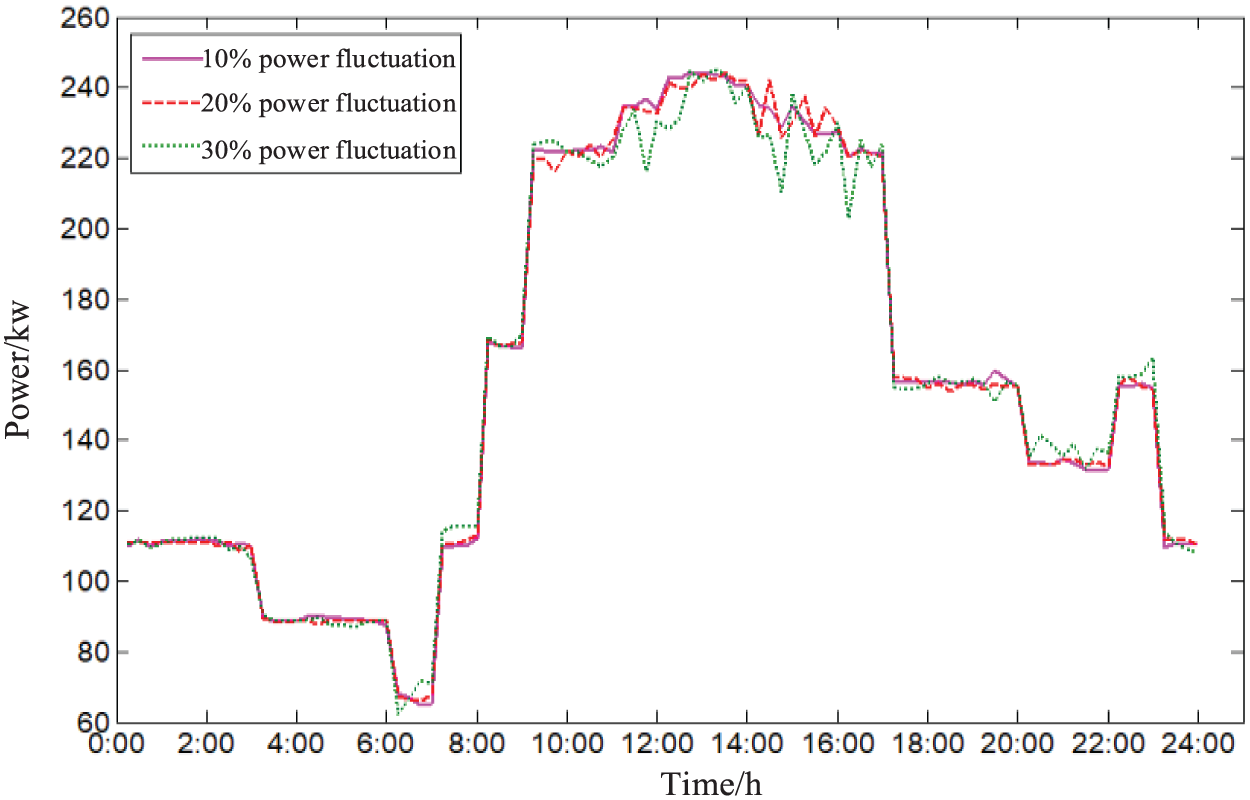
Figure 9: Actual adjusted power of HVACR load within the day
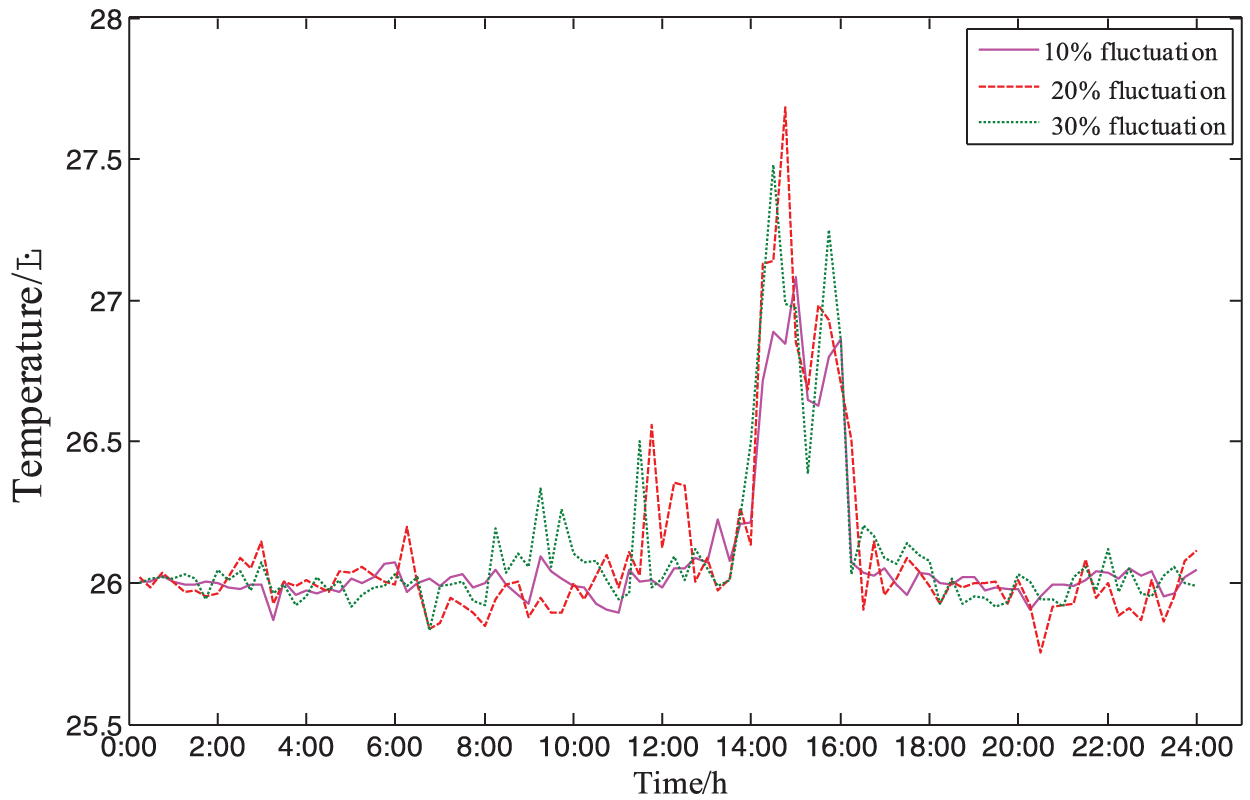
Figure 10: Actual temperature of HVACR load during the day
Fig. 11 represents the intra-day operating power of the micro gas turbine. From the operating simulation of the three cases, it can be seen that the micro gas turbine operates basically at full power from 9:00 to 22:00. Because of its lower cost, it operates at rated power at the moment of higher load. At 0:00–8:00, compared with the day-ahead operating power, it can be seen that when the micro gas turbine fluctuates by 30%, the operating power is much different from the planned power, but the simulation strategy also adjusts the operating power to meet the power balance of the park.
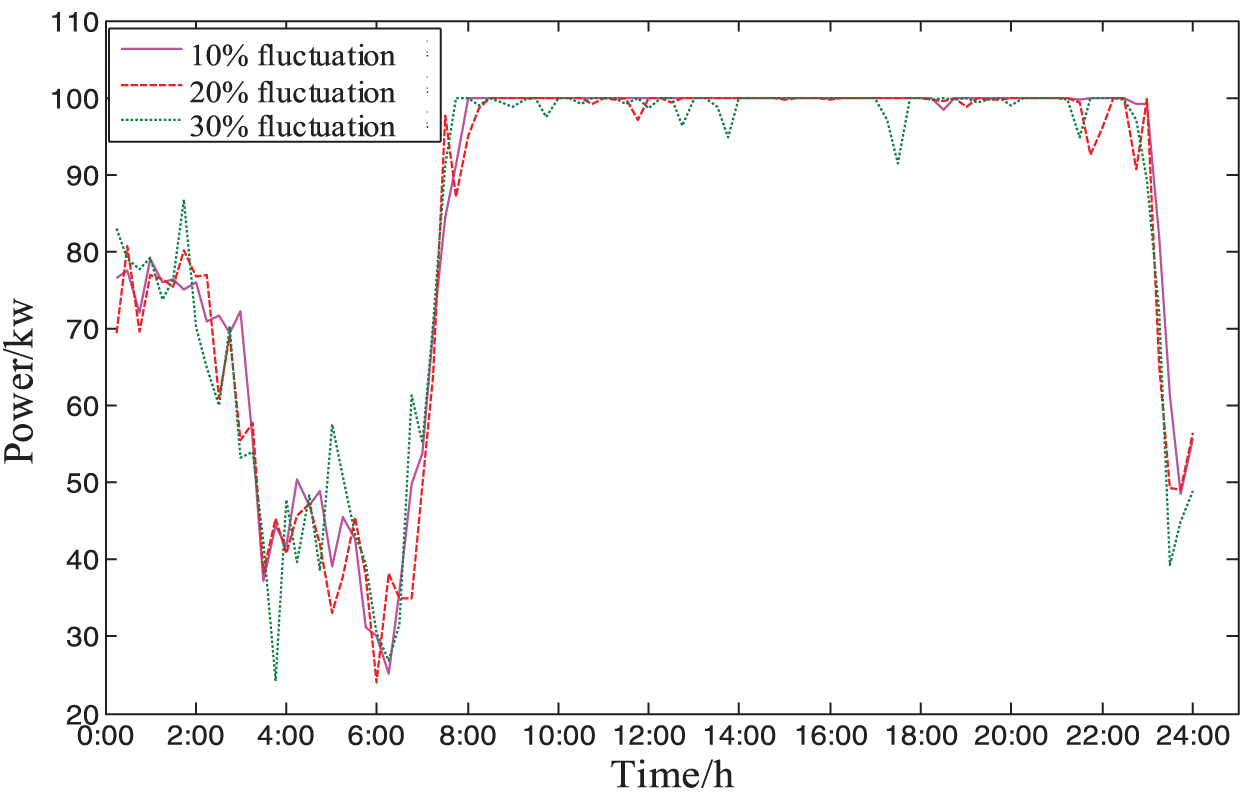
Figure 11: Actual daily power adjustment of micro gas turbine
The dispatchable EV charging power is shown in Fig. 12, which basically meets the high-power charging at low load valley. And low-power charging at peak load to achieve the effect of user-side demand response simulation. Under the power fluctuation of different situations of wind turbine, PV and conventional load, EV can be dispatched to adjust the charging power to ensure the stability of power consumption in the park.
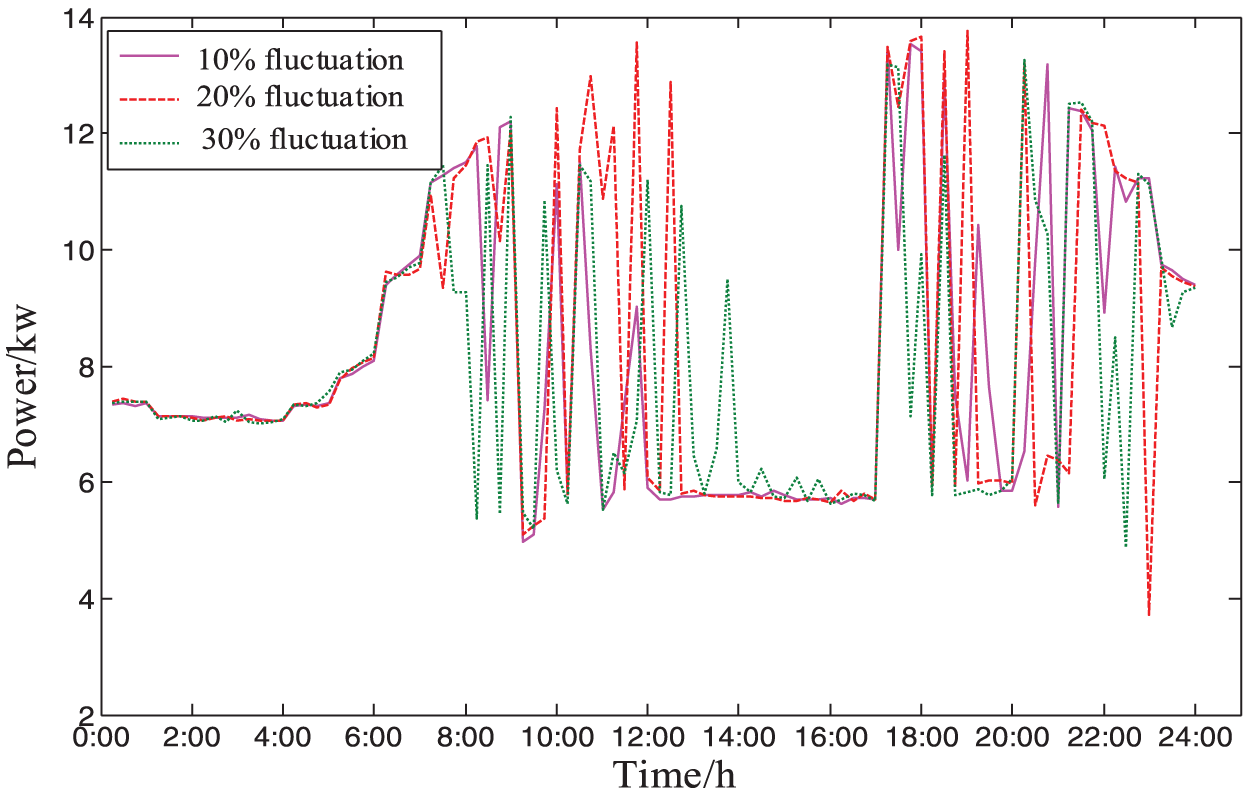
Figure 12: Dispatchable EV actual power transfer within the day
Fig. 13 shows the simulated power of the operation of the lithium battery device. From the figure, it can be seen that the lithium battery, as the park’s energy storage unit, in the intra-day phase also meets the load at low-time charging and peak-time discharge. The simulation in three cases can be seen: at 10%, the power adjustment per moment is small, and when the power fluctuation is large, the lithium battery operating power also varies widely, as the main adjustment device to bear the fluctuation of the wind turbine, photovoltaic and conventional load.
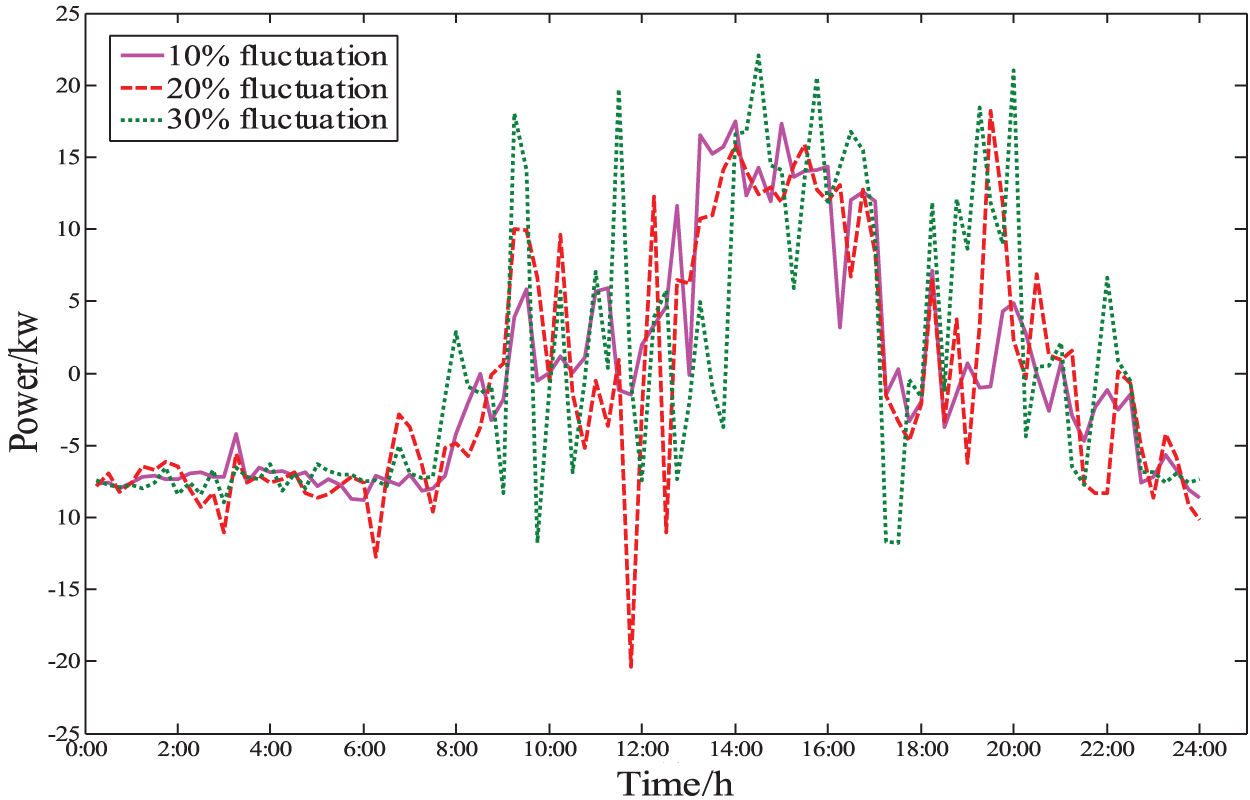
Figure 13: Actual adjusted power of lithium battery within the day
Fig. 14 shows the contact line power. Considering the impact of the time-sharing tariff, the park purchases large power at a low tariff and low power at a high tariff, which basically meets the requirements of low-cost operation of the park; in the intra-day simulation stage, the impact of power fluctuation of wind turbine, PV, and conventional load is reduced by distributed power, HVACR load, and dispatchable EV adjustment.
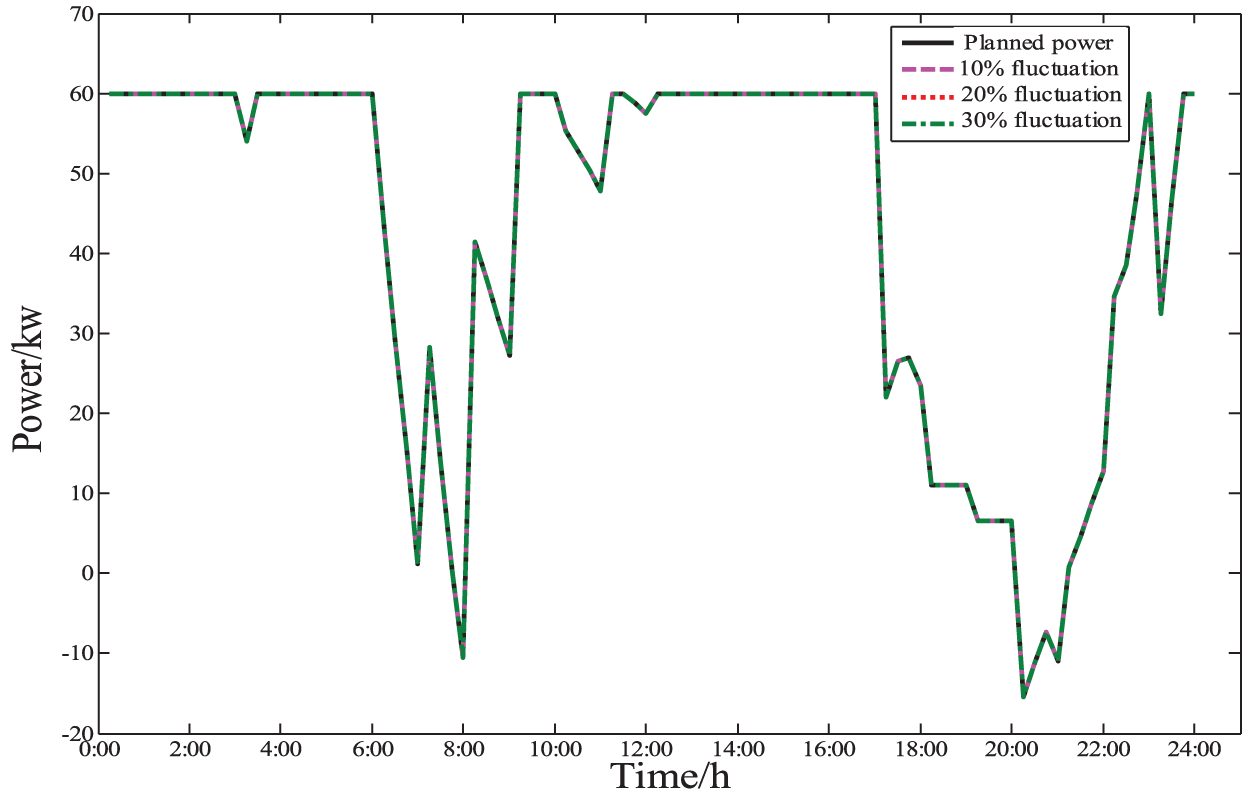
Figure 14: Tie line power
6.3.2 Economic Analysis of Simulation Strategies
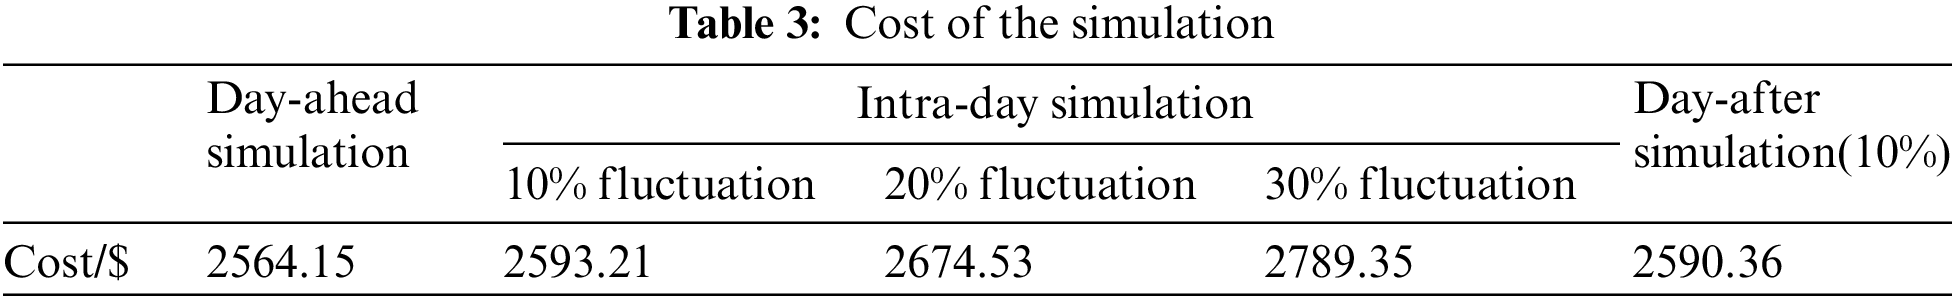
In this section, the concept of day-after simulation [24] is introduced to analyze the economics of the simulation strategy of this paper by comparing the results of the simulation of this paper with the results of the day-after simulation at 10% power fluctuation, and the results are as follows.
The comparison of the simulated power for the intra-day operation of the HVACR load and the simulated power for day-after operation is shown in Fig. 15. As shown in Fig. 15, the simulated power for intra-day operation of HVACR load and the simulated power for day-after operation basically overlap, which indicates that the simulation strategy proposed in this paper is economical for the simulation of HVACR load operation.
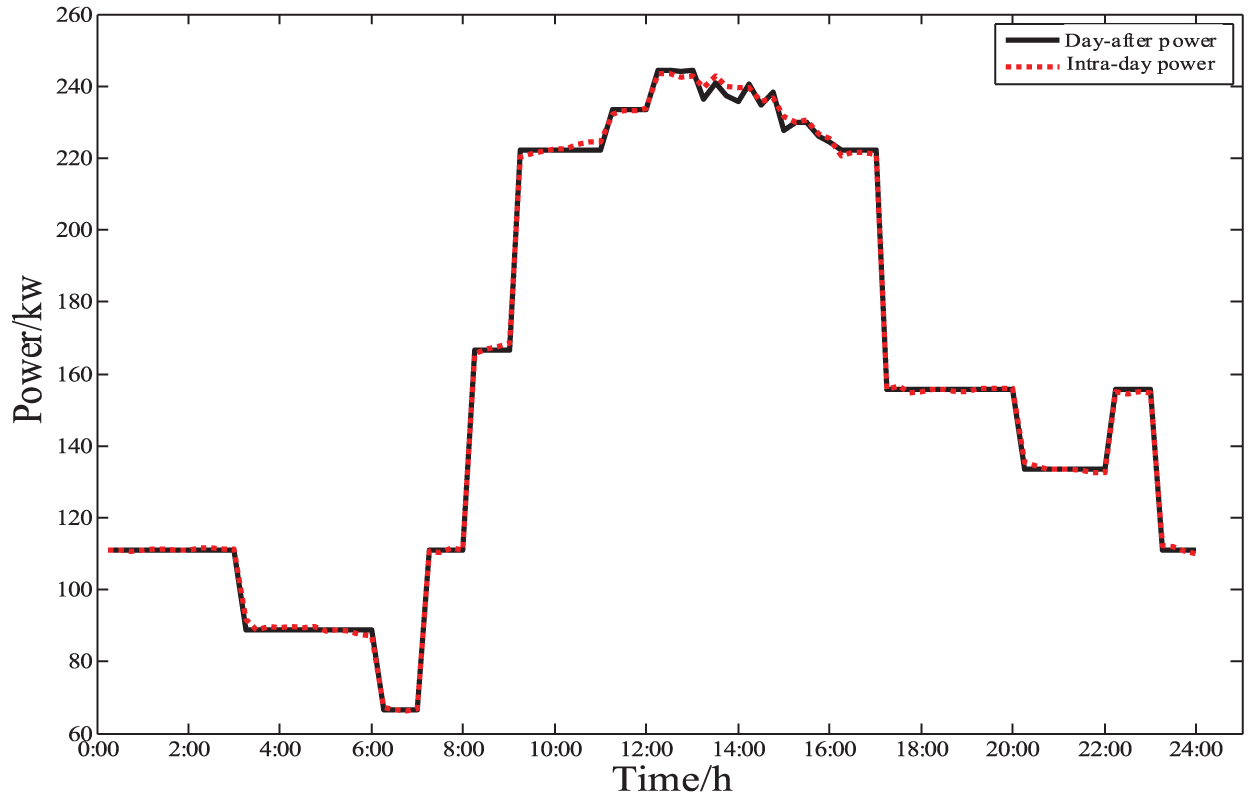
Figure 15: HVACR load power comparison diagram
Fig. 16 shows the comparison of the day-after simulation power and the intra-day simulation power of the micro gas turbine. From the image, it can be seen that the intra-day simulation power and the day-after simulation power basically overlap, which indicates that the simulation strategy proposed in this paper is economical for the micro gas turbine simulation.
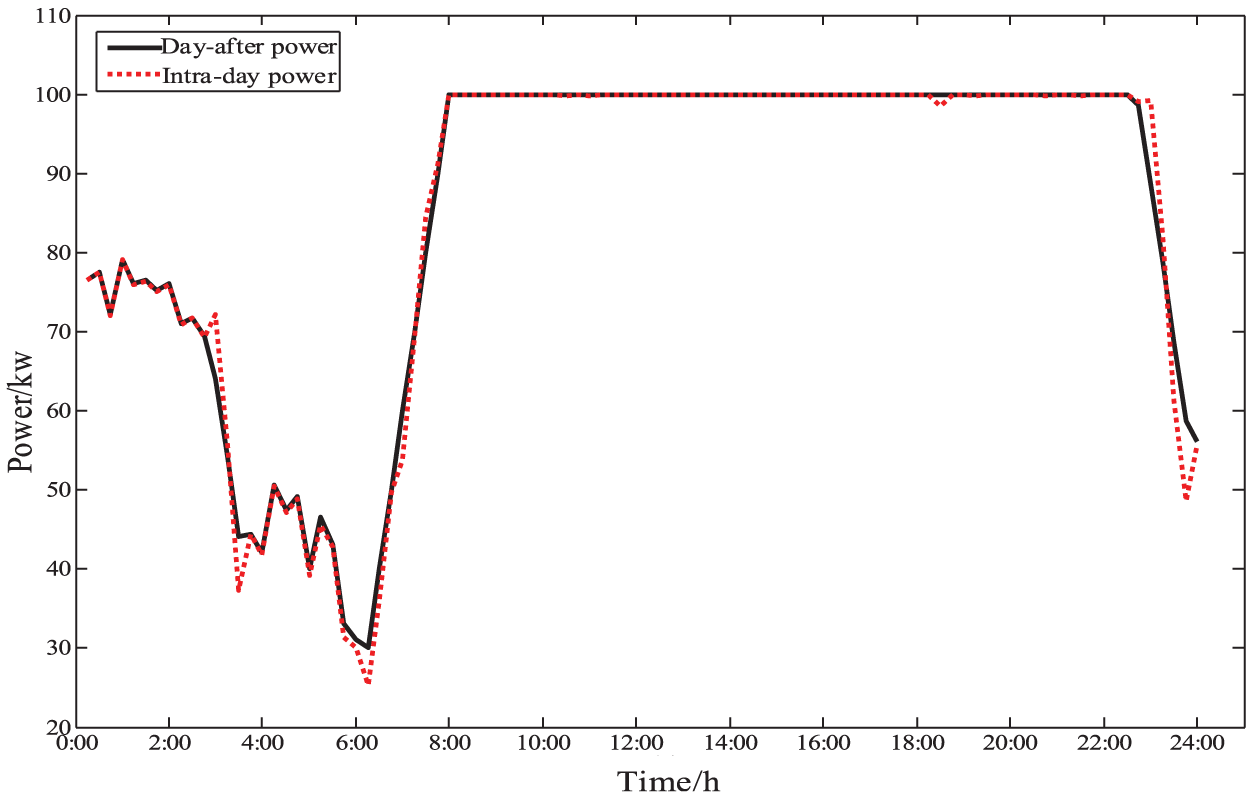
Figure 16: HVACR load power comparison diagram
From Table 3, we can see that the day-ahead simulation cost is the smallest, and considering the day-ahead optimization based on forecast information, all simulation costs are the lowest. With the increase of wind power, PV power, and conventional load power fluctuation in the intra-day phase, the intra-day simulation cost also increases; compared to the day-after simulation with the intra-day 10% fluctuation case, the simulation strategy of this paper is only $2.85 more than the optimal day-after, which indicates that the simulation strategy of this paper is economical.
This section illustrates that the simulation strategy of this paper is equally economical and accurate for distributed power, HVACR load and dispatchable EV units by comparing the effect graphs of micro gas turbine and HVACR load.
In this paper, a multi-time scale operation simulation method for the park microgrid is proposed, including day-ahead optimization and day-day MPC rolling optimization. The method establishes constraints for each unit model and considers power fluctuations of wind turbines, photovoltaic systems, and conventional loads. By considering the power supply side and the user side, a combined approach of day-ahead optimization and intra-day rolling optimization is devised to simulate the park’s operation across multiple timescales, with the goal of minimizing the park’s electricity cost. The feasibility of the proposed day-ahead and intra-day scheduling strategies has been validated through experiments, and draws the following conclusions:
(1) In the day-ahead dispatching stage, the park is optimized with the source-load forecast data to obtain the day-ahead simulation plan. Under the consideration of customer satisfaction, all distributed power sources and loads in the park are in low economic cost operation and play the role of peak-shaving and valley-filling.
(2) In the intra-day dispatching stage, considering the randomness of the source load, the distributed power sources and park loads are dispatched through rolling optimization, which is feasible and economical under the fluctuation of source load power.
(3) With the continuous rise and vigorous construction of microgrid in the park, microgrid demonstration projects have been built around the world, such as Kythnos microgrid demonstration project in Greece, Mannheim microgrid demonstration project in Germany, Bomholm microgrid demonstration project in Denmark and Xinwanda microgrid demonstration project in China. The strategies proposed in this paper can be applied to these microgrid demonstration projects to help them reduce operating costs.
Acknowledgement: None.
Funding Statement: The study was supported by the Science and Technology Project of State Grid Shanxi Electric Power Research Institute: Research on Data-Driven New Power System Operation Simulation and Multi Agent Control Strategy (52053022000F).
Author Contributions: The authors confirm their contribution to the paper as follows: study conception and design: Jun Zhao, Chaoying Yang, Ran Li and Jinge Song. Data collection: Jun Zhao, Chaoying Yang and Jinge Song. Analysis and interpretation of results: Ran Li and Jinge Song. Draft manuscript preparation: Jun Zhao and Chaoying Yang. All authors reviewed the results and approved the final version of the manuscript.
Availability of Data and Materials: Data supporting this study are included within the article.
Conflicts of Interest: The authors declare that they have no conflicts of interest to report regarding the present study.
References
1. Ellingwood, K., Safdarnejad, S., Kovacs, H. (2019). Analysing the benefits of hybridisation and storage in a hybrid solar gas turbine plant. International Journal of Sustainable Energy, 38(10), 937–965. [Google Scholar]
2. Ouyang, H., Lv, L., Liu, J. Y. (2022). Stochastic robust economic scheduling of cogeneration microgrids considering renewable energy uncertainties. Electric Power Construction, 43(1), 19–28. [Google Scholar]
3. Zheng, Y. L., Gong, J. X., Mei, G. Y. (2023). Micronet economic risk game model considering landscape uncertainty. Electrical Measurement and Instrumentation, 60(3), 107–114. [Google Scholar]
4. Xu, G. X., Wang, X., Deng, H. (2023). The energy storage system takes into account the uncertainty of frequency modulation demand and wind power to participate in the operation strategy of energy-frequency modulation market. Power System Technology, 47(6), 2317–2330. [Google Scholar]
5. Sun, J. Q., Wang, Y., Guo, X. H. (2022). Virtual power plant operation optimization considering environmental externalities and wind and landscape output uncertainties. Automation of Electric Power System, 46(8), 50–59. [Google Scholar]
6. Guo, Z. G., Xu, M., Yu, H. (2022). Interval optimal scheduling of integrated energy system in park considering multiple uncertainties. Electric Power of China, 55(11), 121–128+141. [Google Scholar]
7. Chai, Y. Y., Zhao, X. B., Lv, C. X. (2023). A multi-time scale coordinated optimization control strategy for power distribution network load and storage based on Fisher period division. Power System Technology, 46(8), 50–59. [Google Scholar]
8. Han, L., Wang, X. J., Lu, P. P. (2023). Multi-time scale scheduling of electrothermal combined system considering time-sharing compensation of wind power prediction error. Automation of Electric Power System, 47(1), 74–85. [Google Scholar]
9. Li, Q. S., Li, Z., Sun, B. (2023). Multi-time scale absorption method of distributed energy in active distribution network considering uncertainty. Renewable Energy, 9(5), 692–698. [Google Scholar]
10. Wang, Z., Tao, H. J., Cai, W. K. (2023). Research on optimal scheduling of multi-time scale rolling optimization in combined cooling, thermal and power supply system. Acta Solar Energy Sinica, 44(2), 298–308. [Google Scholar]
11. Li, X. Z., Wang, W. Q., Wang, H. Y., Fan, X. C., Wu, J. H. et al. (2020). Energy storage configuration strategy of wind-wind storage combined power generation system based on robust optimization. Acta Energiae Solaris Sinica, 41(8), 67–78. [Google Scholar]
12. Zhang, F. M., Cui, H. B., Li, Z. K., Jiang, H., Ma, C. Y. et al. (2018). Interactive multi-objective optimization of microgrid based on improved NSGA-II algorithm. Power System Protection and Control, 46(12), 24–31. [Google Scholar]
13. Dai, Z. H., Lu, H., Liu, Y., Yang, X., Chen, B. Y. et al. (2020). A review of multi-layer and multi-time scale energy management in active distribution networks with multi-microgrids. Electrotechnical Application, 39(7), 12–23. [Google Scholar]
14. Sun, H. J., Zhang, L. L., Peng, C. H. (2021). Time-domain rolling optimization scheduling of microgrid based on differential demand response model predictive control. Power System Technology, 45(8), 3096–3105. [Google Scholar]
15. Cui, Y., Zhou, H. J., Zhong, W. Z., Hui, X. X., Zhao, Y. T. (2021). Day-ahead-day two-stage rolling optimal dispatch considering generalized energy storage and thermal power combined peak shaving. Power System Technology, 45(1), 10–20. [Google Scholar]
16. Huang, X. C., Feng, Y. (2020). Independent microgrid considering unit flexibility to coordinate and optimize dispatching within days and days. Electric Power Automation Equipment, 40(4), 125–131. [Google Scholar]
17. Yuan, H. T., Wei, G., Zhang, H., Luo, Z. G., Hu, Y. (2020). Optimal operation of distribution network with integrated charging and storage stations based on model predictive control. Automation of Electric Power Systems, 44(5), 187–197. [Google Scholar]
18. Batiyah, S., Zohrabi, S., Abdelwahed, S., Sharma, R., Hu, Y. (2018). An MPC-based power management of a PV/battery system in an islanded DC microgrid. 2018 IEEE Transportation Electrification Conference and Expo (ITEC), pp. 231–236. Long Beach, CA, USA. [Google Scholar]
19. Shao, L. X., Wan, C., Zhang, X. B. (2023). Two-stage scheduling of urban integrated energy system considering uncertainty and interactive power. Automation of Electric Power Systems, 47(9), 59–69. [Google Scholar]
20. Lu, P., Ye, L., Tang, Y. (2019). Research on multi-time scale active power optimal scheduling strategy for wind power clusters based on model predictive control. Proceedings of the CSEE, 39(22), 6572–6583 (In Chinese). [Google Scholar]
21. Huang, W. D., Li, Y., Li, J. Y. (2023). Wind-light-storage-storage multi-timescale joint optimal dispatch considering renewable energy uncertainty. Electric Power Automation Equipment, 43(4), 91–98. [Google Scholar]
22. Xu, Q. S., Yang, C. X., Yan, Q. G. (2016). Strategy of day-ahead power peak load shedding considering thermal equilibrium inertia of large-scale air conditioning loads. Power System Technology, 40(1), 156–163. [Google Scholar]
23. Wang, Z. J., Zhang, Z. Q., Lian, L. M. (2002). Discussion on thermal comfort evaluation index and indoor calculated temperature in winter. Heating Ventilating & Air Conditioning, 32(2), 26–28. [Google Scholar]
24. Shi, W. L., Qin, W. P., Wang, L. B., Yao, H. M., Jing, X. et al. (2022). Regional power grid LSTM dispatch strategy taking into account the difference between electric vehicle demand and time-of-use electricity price. Proceedings of the CSEE, 42(10), 3573–3587 (In Chinese). [Google Scholar]
25. Zhang, Y., Zhang, T., Liu, Y. J. (2016). Research on optimal dispatch of energy local area network based on stochastic model predictive control. Proceedings of the CSEE, 36(13), 3451–3462 (In Chinese). [Google Scholar]
26. State Grid Company Dispatching Communication Center (2019). Functional specification for wind power forecasting system. https://wenku.baidu.com/view/093d953a5122aaea998fcc22bcd126fff6055d25.html?_wkts_=1691039809085 [Google Scholar]
27. China Power Investment Corporation (2021). Specification for photovoltaic power prediction system of Solar Mountain photovoltaic power station. https://max.book118.com/html/2021/1009/6113132243004021.shtm [Google Scholar]
Cite This Article
 Copyright © 2024 The Author(s). Published by Tech Science Press.
This work is licensed under a Creative Commons Attribution 4.0 International License , which permits unrestricted use, distribution, and reproduction in any medium, provided the original work is properly cited.
 Downloads
 Citation Tools